Article

Environmental Factors Affecting Volume Growth of Yellow Poplar Plantations in South Korea

1
College of Forest and Environmental Science, Kangwon National University, Chuncheon 24341, Republic of Korea
2
Department of Forest Bioresources, National Institute of Forest Science, Suwon 16631, Republic of Korea
*
Author to whom correspondence should be addressed.
Forests 2023, 14(10), 2003; https://doi.org/10.3390/f14102003
Submission received: 9 August 2023 / Revised: 27 September 2023 / Accepted: 30 September 2023 / Published: 6 October 2023
(This article belongs to the Section Forest Ecology and Management)

Abstract

:
South Korean forests need hardwood tree species that can produce timber, as global warming progresses and the habitats of conifers dwindle. For the past 30 years, exotic yellow poplar (Liriodendron tulipifera) has been planted to replace some of the pine-dominated forests, as there is a lack of native hardwood tree species that produce large and good quality timber. However, yellow poplar growth has varied among planting sites across the country. We studied how environmental factors affect the growth of 49 stands of yellow poplar trees, with 945 dominant trees across 129 plots. To identify the optimal conditions for yellow poplar growth, we assessed 28 environmental variables, including geographic, climatic, topographic, and soil properties, for their correlation with volume growth. We estimated the optimal conditions for yellow poplar growth by averaging the values of the variables for the top five performing stands. To calculate the relative distance of any stand from the optimal conditions, we divided the difference between the stand’s values for the environmental variables and the optimal conditions by the standard deviation of those variables. We then calculated Spearman rank correlation coefficients between these distances and volume growth rankings. Wind exposure (WE), growing season temperature (GT), Latitude (LN), soil phosphorus pentoxide (P2O5) content, low extreme temperature during January and February (LT), and spring humidity (SH) were the most important environmental factors governing growing sites for yellow poplar in Korea, with WE being the most critical. Some variables showed synergistic effects and correlated slightly more strongly with volume growth when combined with the WE variable. Our study provides crucial insights for optimizing plantation management and site selection in non-native ranges, enhancing overall success in establishing yellow poplar plantations in South Korea.

1. Introduction

Yellow poplar (Liriodendron tulipifera), native to North America, has been planted in various regions of South Korea over the past fifty years [1]. It has shown excellent adaptability and successful growth in several test regions and has been widely planted across Korea to meet the rising demand for timber. However, forestation efforts with the species were then halted due to poor growth in some areas. Nevertheless, yellow poplar has recently regained attention as a promising forestation species in Korea, due to its high carbon sequestration potential and resilience to climate change. This resurgence is driven by a government initiative to achieve carbon neutrality by 2050. Historically, Korea has relied heavily on conifers such as red pine and Korean pine for forestation. However, these conifers have several drawbacks, including slow growth, susceptibility to wildfires, and a shrinking natural habitat range due to global warming [2,3]. As a result, there is a growing demand for fast-growing hardwood species like yellow poplar to replace conifers. Yellow poplar is well-suited for Korean forests, as it is tolerant of a wide range of site conditions and can grow quickly [4].
However, despite high expectations, some yellow poplar plantations in Korea have performed poorly. The poor performance of some yellow poplar plantations may be due to unsuitable site conditions, such as climate, topography, or soil properties [5]. The Korean climate is similar to the northern edge of yellow poplar’s native range, with a temperate climate and distinct seasons. However, there are subtle differences, such as Korea’s dry winter and spring seasons [6,7].
Despite its relatively small size, the Korean Peninsula has a diverse climate due to variations in altitude, topography, and proximity to the surrounding seas. Moisture-loving trees like yellow poplar tend to thrive on east and north slopes [8,9]. Other factors that influence tree growth include soil depth, drainage, weeding, and fertility [10]. Understanding the influence of environmental factors on yellow poplar growth in Korean plantations is crucial for future large-scale expansion. However, given the multitude of interacting factors that influence growth, drawing conclusions based on individual factors alone is challenging.
This study aims to identify the environmental factors that influence yellow poplar growth in Korea, to inform large-scale reforestation efforts for this economically important species. We hypothesized that the failure of yellow poplar plantations is caused by unsuitable climate and unfavorable local topography. To test this hypothesis, we examined the volume growth of trees of the same age under different environmental conditions and analyzed the correlations between volume growth and multiple environmental variables.

2. Materials and Methods

2.1. Description of the Study Areas

Forty-nine yellow poplar stands established between 2001 and 2010 were selected throughout the country for this study. The seeds were introduced from a seed orchard in Tennessee, USA and raised in Korean forest nurseries before planting. The 49 yellow poplar stands were located throughout Korea, between 34.5528° N and 38.2885° N latitude and 126.5272° E and 129.4114° E longitude. The stands ranged in altitude from 40 to 873 m above sea level. A total of 129 plots, each measuring 10 by 20 m, were established in the stands. In large stands, three plots representing good, fair, and poor growth were established, at least 20 m apart. In small stands, a single plot representing fair growth was established. The following information was measured and recorded at each plot: elevation, latitude, longitude, drainage, topographic (slope) position, slope steepness, wind exposure extent, azimuthal aspect, and soil depth of the plots. This information was obtained through web GPS application programs, including My Elevation (RDH software 1.63, Windsor, CT, USA), Simple Inclinometer (Syleos Apps 1.70, https://androidapps-9f44e.web.app, accessed on 13 April 2021), and Compass (Melon software 1.5.0, https://play.google.com/store/apps/details?id=app.melon.icompass&hl=en&gl=US&pli=1, accessed on 13 April 2021). Effective soil depth and total soil depth were determined by digging a hole at the center of each plot and measuring the maximum depth to which the roots had penetrated (effective soil depth) and the distance to the bedrock (total soil depth). Soil pH, organic matter, total nitrogen, phosphate (P2O5), and exchangeable ions (potassium, calcium, and magnesium) were determined from soil samples taken from a depth of 5–10 cm below the organic layer in each plot.

2.2. Climate of the Study Area

Climatic data of the past 10-year average from the 37 closest stations were extracted from the Open Met Data Portal in the National Climate Data Center (https://data.kma.go.kr/stcs/grnd/grndTaList.do?pgmNo=70, accessed on 3 June 2022). The highest and annual mean temperature of each stand was measured on July–August (the highest) and calculated by subtracting 0.65 °C for each 100 m difference in the altitude of the weather station nearby from that of the stand. In winter, the lowest temperature in January–February was calculated by subtracting 0.98 °C for each 100 m increase in altitude followed by the meteorology3 (http://www.meteo.psu.edu/wjs1/Meteo3/Html/stability.htm, accessed on 20 June 2023). Humidity was calculated to decrease by 4% for each 1 km increase in altitude [11].

2.3. Volume Growth of Stands

Stand performance data, including height and diameter at breast height (DBH), and survival rate, were collected from the plots. For each plot, five dominant trees were measured and recorded. Individual tree volume index was estimated by multiplying tree height by basal area. Mean annual volume growth was computed by dividing the volume by the tree’s age. However, growth patterns vary depending on species and environment, with younger trees typically growing faster than older trees [5,12]. To compare the growth of different stands, the mean annual increment index (MAI by HD2) was calculated at the forest stand (or survey plot) level, based on individual tree heights and DBH. Since many stands were established in different years, it was necessary to use the volume at the same age for comparative purposes. To adjust for this, growth rates based on age within the same harvesting position in the yield table were used to correct and calculate specific correction coefficients for each detailed age group, which were differentially applied within each interval [5,13] (Table 1).

2.4. Environmental Distance of Each Stand from the Optimal Conditions

To compare the climatic conditions of the yellow poplar stands to the optimal conditions for yellow poplar growth, we collected climate data from the three U.S. states (Tennessee, Kentucky, and West Virginia) where yellow poplar grows best. These climatic data were sourced from various authorities, including the National Oceanic and Atmospheric Administration (NOAA), state governments, and environmental agencies, and were used for analysis https://semspub.epa.gov/work/01/554362.pdf, http://weather.uky.edu/panevap.html, https://www.in.gov/dnr/water/files/pg24-57.pdf, accessed on 20 June 2023). We also selected four climate variables that were highly correlated with yellow poplar growth (r > 0.3, p < 0.05): annual mean temperature (AT), low extreme temperature during January and February (LT), growing season temperature (GT), and spring humidity (SH) by Pearson’s coefficient.
To calculate the distance of each stand from the optimal environmental conditions, we used the following formula to standardize each variable:
di = |(x − xi)|/SD
where x is the optimal environmental value for yellow poplar and xi (i = 1, …n) is the environmental value for the stand. SD is a standard deviation.
The distance of a stand from the optimal environmental conditions was calculated by summing up the distances of the four climate variables and dividing by four as shown in Table 9.
D = ∑di = ∑|(x − xi)|/SD × n − 1
where D is the total distance, d is the relative distance of a stand, SD is the standard deviation, and n is the number of variables. We also calculated topographic and soil chemical distances for the environmental variables that were highly correlated with yellow poplar growth (r > 0.3, p < 0.05) by Pearson’s coefficient. We then calculated Spearman correlation coefficients between these distances and volume growth rankings.

3. Results

3.1. Overall Growth

Figure 1 shows the mean annual volume growth of yellow poplar in the stands. The volume growth varied widely, from 0.0004 to 0.1175 m3, with an average of 0.0437 m3. Despite the similarity in climate, the volume growth varied between regions. The most favorable stands were located in the southernmost region, which has higher temperatures and precipitation. Interestingly, some stands in the northern region also exhibited robust growth, despite cooler temperatures than the native habitat. Conversely, weaker growth was generally observed in the eastern half of the country, even though favorable environmental factors were expected. There were a few exceptions, such as stands with lower precipitation levels.

3.2. Effects of Latitude, Longitude, and Altitude on Volume Growth of Yellow Poplar

We analyzed the volume growth of yellow poplar across 129 plots, considering the variations in climate factors associated with latitude, longitude (LN), and altitude. The distribution of latitude revealed 15 plots below 35° N, 28 plots between 35° N and 36° N, 41 plots between 36° N and 37° N, 57 plots between 37° N and 38° N, and nine plots above 38° N. Spearman correlation coefficients were calculated due to non-normal data distribution. The correlation between latitude and volume growth was statistically not significant (r = −0.14, p = 0.327). However, stands at lower latitudes, especially in the southernmost regions, consistently showed better volume growth than those at higher latitudes. This is likely because the climatic conditions in the southernmost region of Korea more closely resemble the optimal growth conditions found in yellow poplar’s native habitat. The longitudinal range of yellow poplar plantations in Korea is less than 3 degrees, from 126.5272° E to 129.4114° E. LN showed a moderately negative association with volume growth (r = −0.34, p = 0.016, Table 2). While the correlation is not strong, it is worth noting that the cooler temperatures and reduced precipitation in the higher mountainous regions of the eastern peninsula may potentially have a negative impact on yellow poplar growth.
For altitude, the data encompassed 33 plots between 40 and 100 m, 49 plots between 201 m and 300 m, 17 plots from 301 to 400 m, and six plots above 400 m (Figure 2). Volume growth decreased with increasing altitude. Plots below 100 m showed the best growth, while plots above 400 m showed the poorest growth. A slight negative association was found between altitude and volume growth (r = −0.24, p < 0.097). Overall, the results indicate that yellow poplar growth in Korea declines with increasing latitude, longitude, and altitude.

3.3. Effects of Climatic Variables of the Stands on Volume Growth of Yellow Poplar

Four temperature variables were analyzed: annual mean temperature (AT), growing season temperature (GT), mean July-August high temperature (HT), and mean January–February low temperature (LT). AT ranged from 6.44 °C to 13.78 °C, with an average of 11.52 °C. GT ranged from 12.36 °C to 18.74 °C, with an average of 17.49 °C. HT ranged from 29.69 °C to 36.61 °C, with an average of 34.09 °C. LT ranged from −20.09 °C to −8.65 °C, with an average of −13.67 °C. Spearman rank correlation coefficients were calculated between standardized volume growth and standardized temperature variables. As shown in Table 3 and Figure 3, three temperature variables showed moderate correlations with volume growth: AT (r = 0.41, p < 0.0010, GT (r = 0.38, p < 0.001), and LT (r = −0.32, p = 0.001). HT did not show a significant correlation with volume growth.
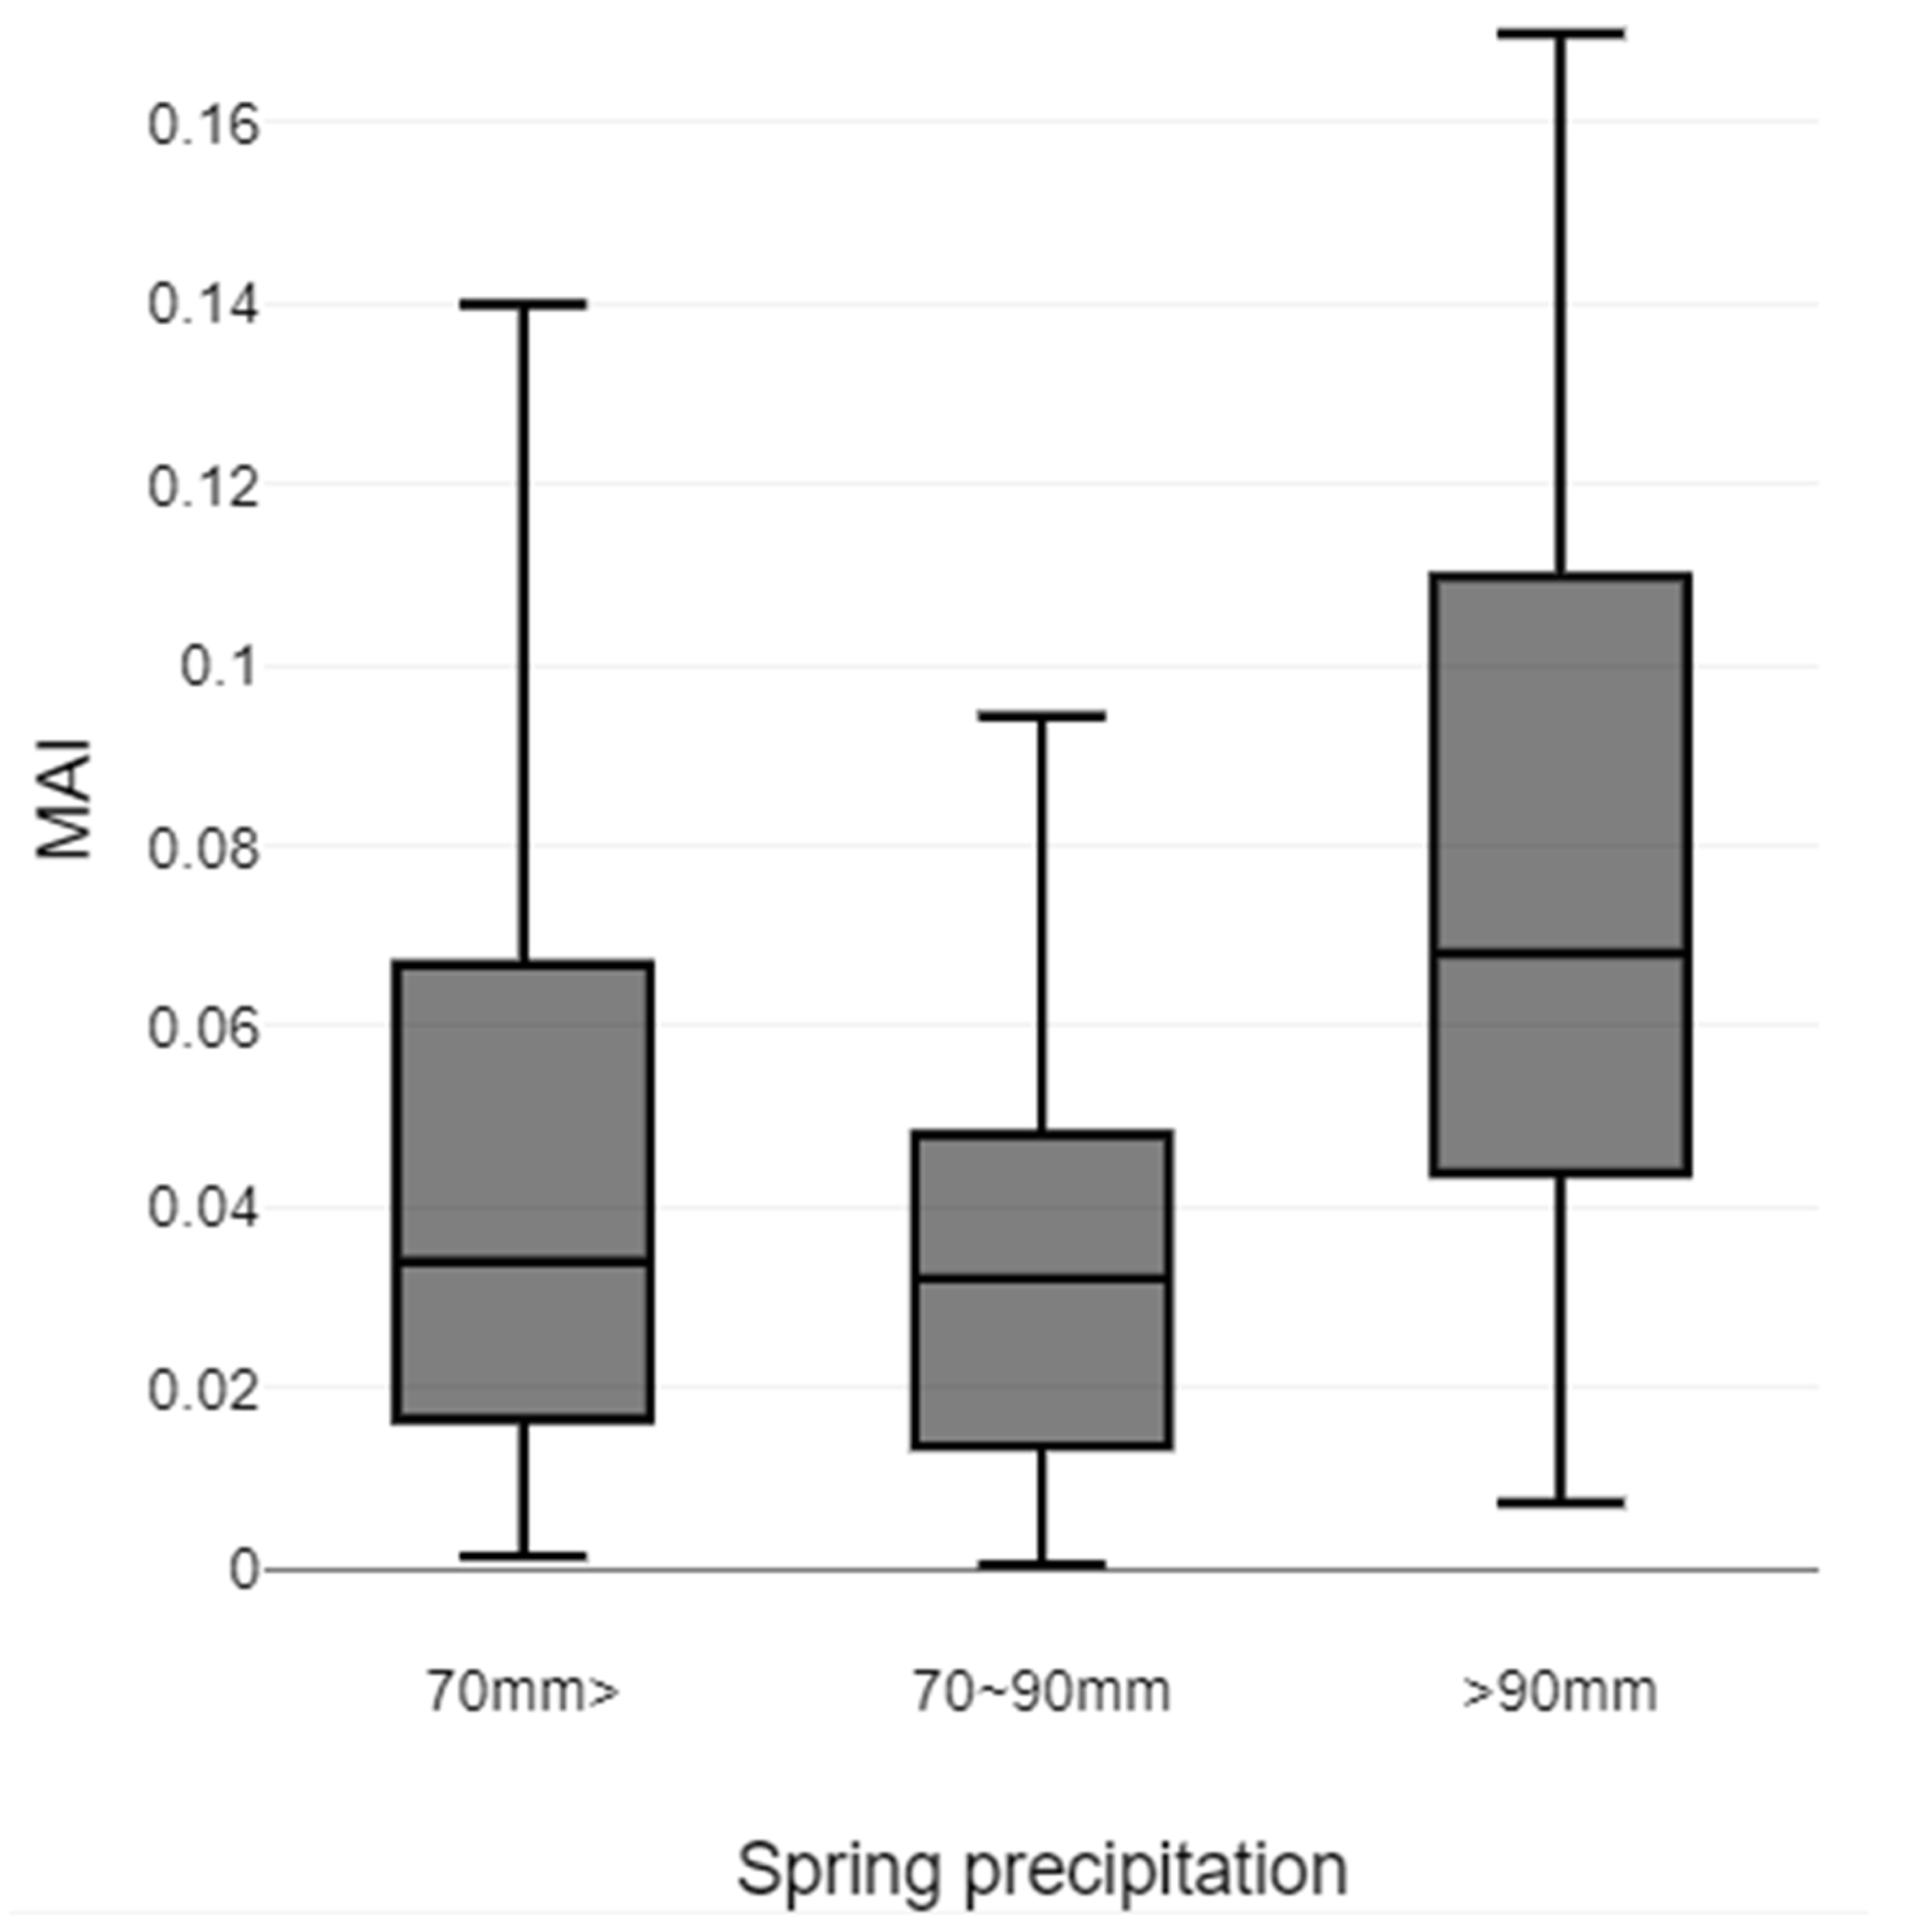
Four precipitation variables were analyzed: annual precipitation (AP), growing season precipitation (GP), winter precipitation (WP), and spring precipitation (SP). AP ranged from 1011 to 1518 mm, with an average of 1256 mm. GP ranged from 911 to 1374 mm, with an average of 1114 mm. WP ranged from 85 to 224 mm, with an average of 142 mm, and SP ranged from 60 to 129 mm, with an average of 78 mm per month. Spearman’s rank correlation between volume growth and AP, GP, and WP was weak. SP showed no significant correlation with volume growth (Table 4). However, volume growth was notably higher for precipitation levels over 90 mm (Figure 4).
Four relative humidity variables were analyzed: annual humidity (AH), growing season humidity (GH), winter humidity (WH), and spring humidity (SH). AH ranged from 62% to 77%, with an average of 69%. GH varied from 63% to 78%, with an average of 71%. WH ranged from 51% to 74%, with an average of 65%, while SH ranged from 54% to 72%, with an average of 61%. Spearman rank correlation coefficients between volume growth and AH, GH, WH, and SH were weak, ranging from 0.06 to 0.27 (Table 4). Effective water content, defined as the difference between total precipitation and actual evaporation, was also analyzed [14]. Yearly effective water content ranged from −339 mm to 497 mm, with a mean of −8.8 mm. For the growing season, it ranged from −321 mm to 239 mm, with a mean of −46 mm. Pearson’s correlation coefficients between volume growth and annual, and growing season effective water content were weak, at 0.23 and 0.24, respectively.

3.4. Climatic Distance of Yellow Poplar Stands from the Optimal Growing Conditions

To assess the impact of climatic conditions on yellow poplar stands, Spearman correlation coefficients were calculated between various climate variables and volume growth rankings. AT, LT, GT, and SH showed significant correlations (p < 0.05) with coefficients higher than 0.3 (Table 5). Optimal conditions were determined based on the maximum values (MAX) of these variables. The relative distance of climate variables from the optimal conditions for each stand was calculated as described in the Materials and Methods section.
Most climate variables were not normally distributed, so Spearman rank correlation coefficients (r) were used to assess the relationship between volume growth rankings and the total climatic distances of the stands. The combination of AT, LT, GT, and SH showed a moderate correlation (r = −0.43, p = 0.002) with volume growth. To comprehensively investigate potential correlations, over 120 combinations of 2, 3, 4, 5, and 6 climate variables were tested for their association with volume growth. However, no other combinations produced higher correlation coefficients. These findings suggest that the identified climate variables are important for influencing yellow poplar growth. This information can be used to optimize plantation success in various climatic conditions. Correlation analysis also showed that yellow poplar growth tends to improve with increasing temperature, precipitation, and humidity. This is because the stands are located in regions that correspond to the northern marginal region of the native habitat in North America [15]. Therefore, the maximum values of these variables were considered optimal.

3.5. Effects of Topographic Variables of the Stands on Volume Growth of Yellow Poplar

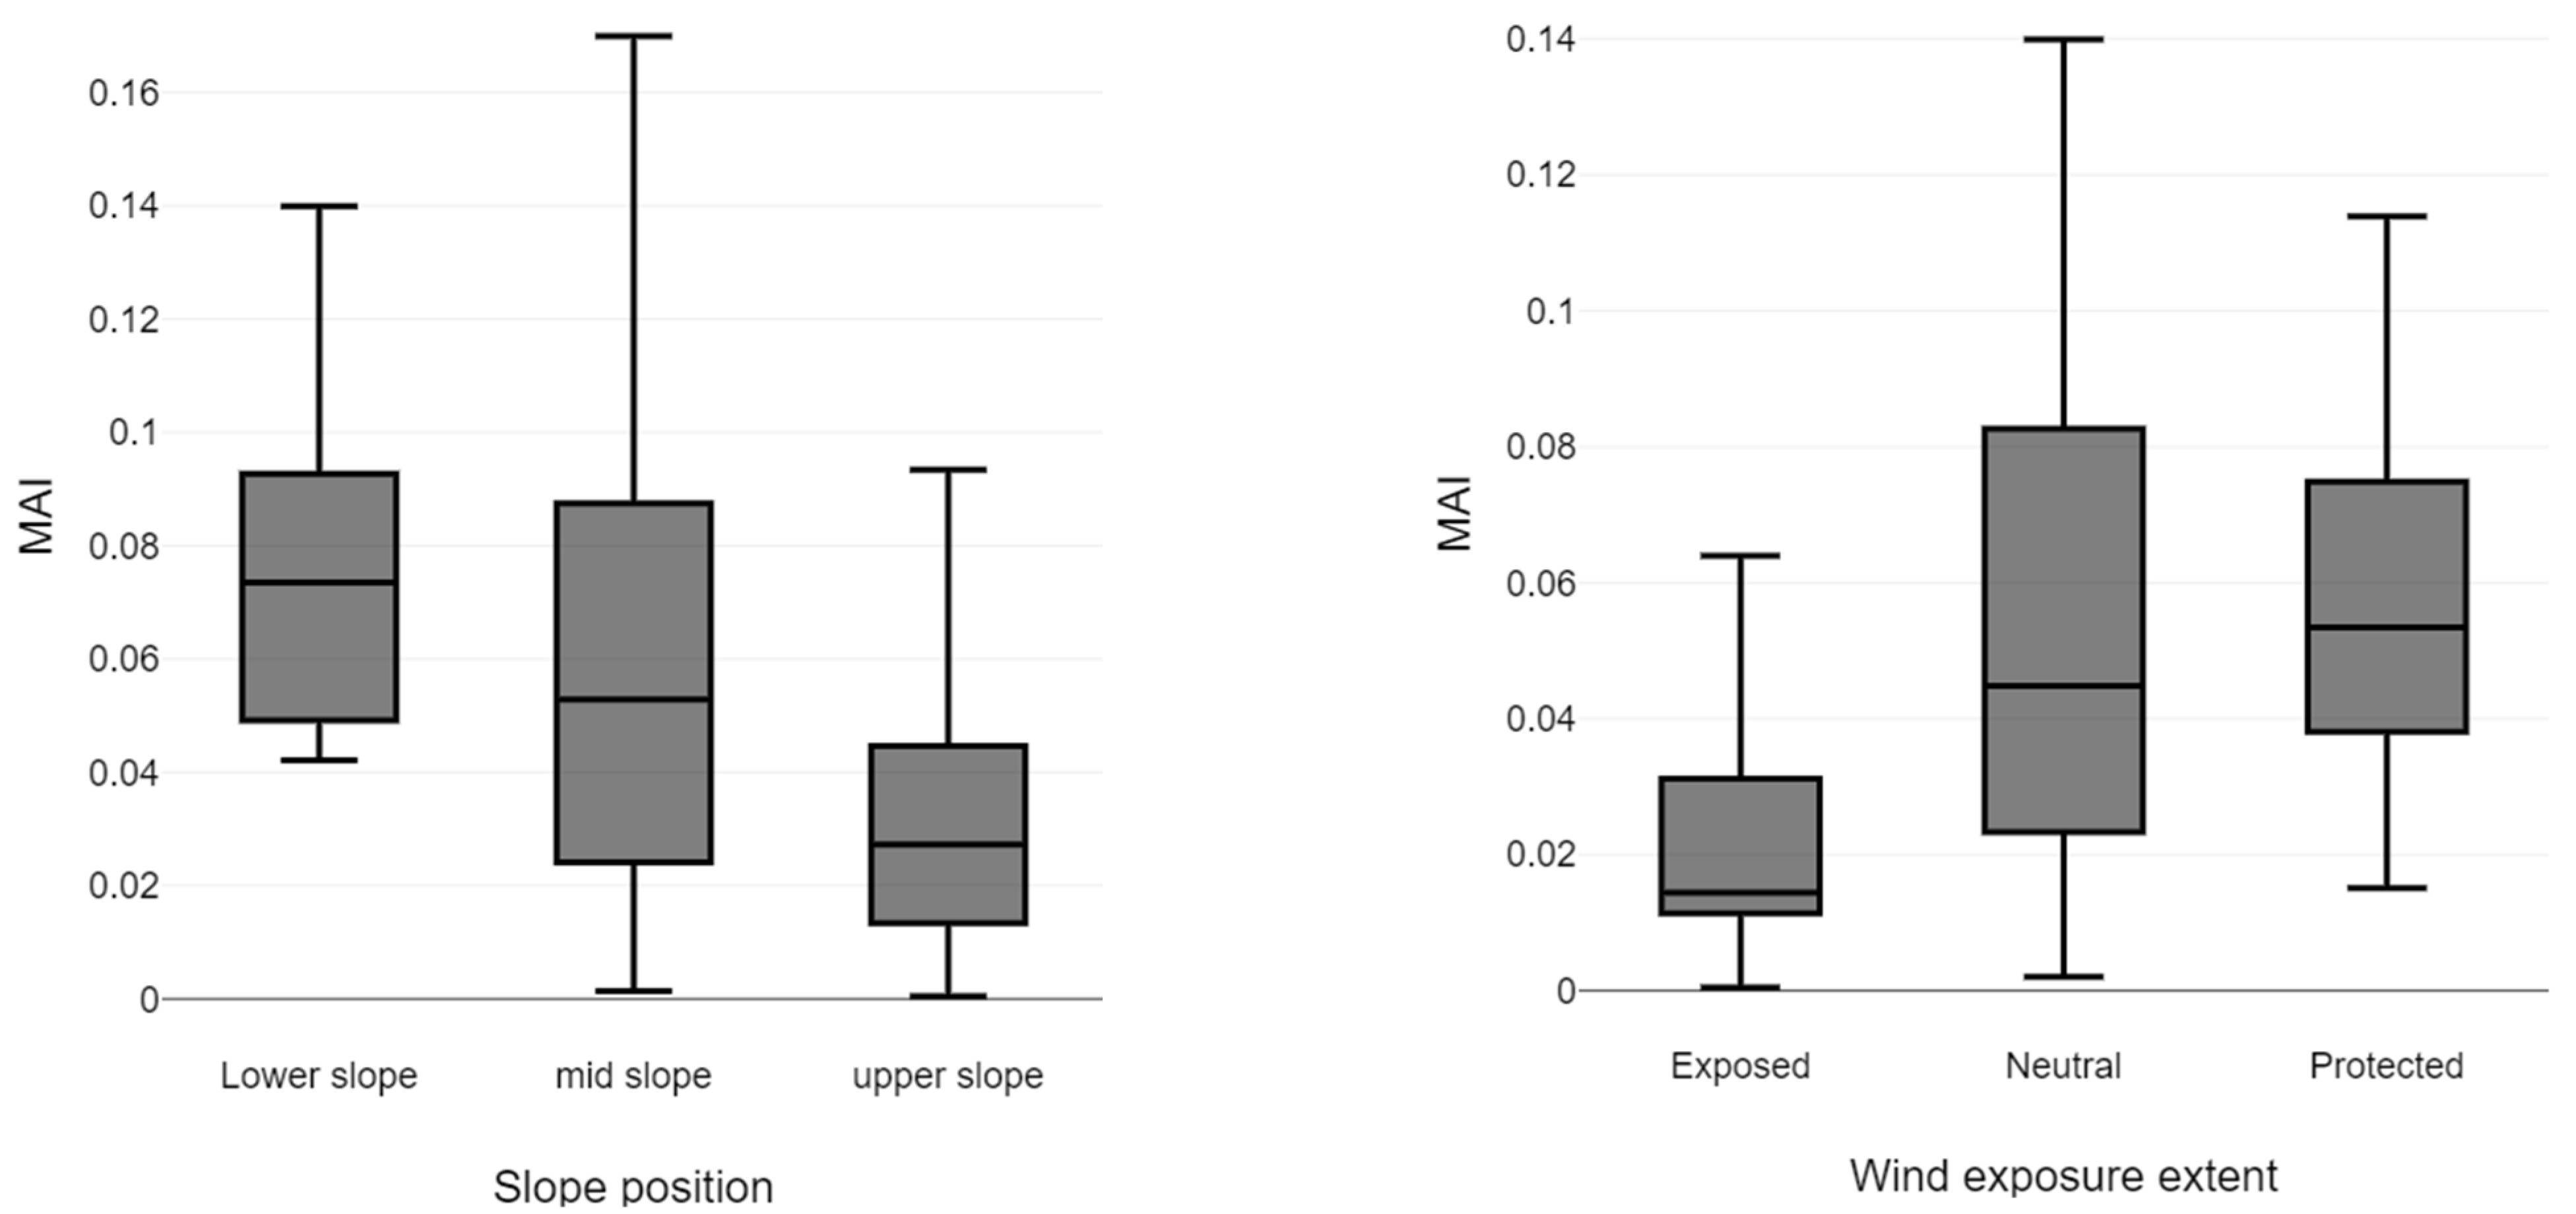
The majority of the stands were established on slopes, classified into three categories: lower slope, mid-slope, and upper slope. Among the 129 plots, 11 were on the lower slope, 43 on the mid-slope, and 75 on the upper slope. Topographic position (TP) on the slope did not show a statistically significant correlation (r = −0.16, p = 0.275) with volume growth (Table 6 and Figure 5).
Wind exposure (WE), categorized as exposed, neutral (partially exposed), and protected based on facing hills that affected wind flow, showed a moderate negative correlation with volume growth (r = −0.53, p < 0.001, Table 6). Volume growth was significantly lower in exposed wind conditions than in neutral or protected conditions (Figure 5). The effects of WE appeared to be similar to those of altitude, with stands at higher altitudes and those that were more exposed to wind having lower volume growth.
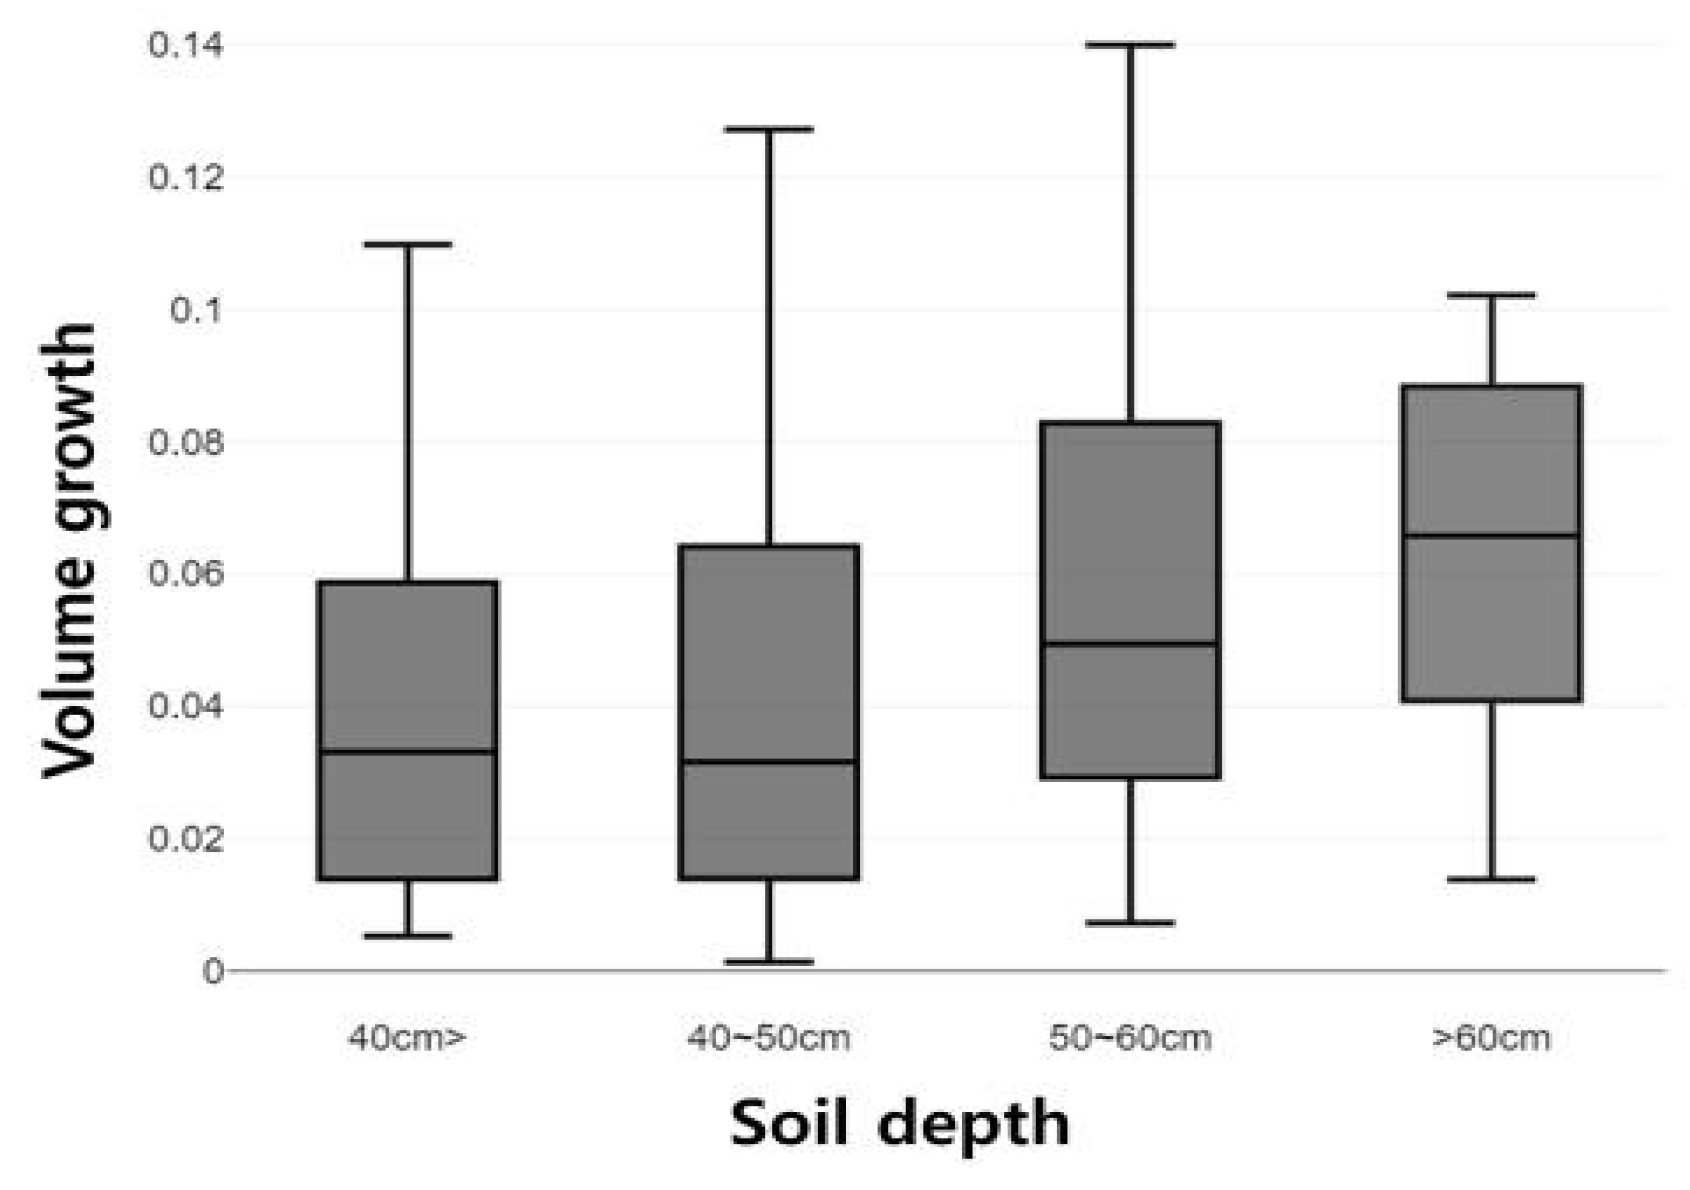
Most of the soils in the plots were shallow (55 cm or less), likely due to deforestation before the 1960s and heavy monsoon rains that caused erosion on the steep slopes. However, soil depth did not have a significant correlation with volume growth (r = 0.11, Figure 6). The slope of the stands, soil drainage, and azimuth aspects of the plots did not show any significant correlation with volume growth.
The inclination of the stands to the horizon was divided into five classes, but no correlation was observed between slope degree and volume growth (r = −0.06, p = 0.494). Soil drainage, categorized into four classes, showed that drainage was rarely a limiting factor in yellow poplar stands. Additionally, the azimuth directions of the plots did not show any significant difference (p = 0.712) in volume growth.

3.6. Effects of Soil Chemical Properties on Volume Growth of Yellow Poplar

The soils in the yellow poplar stands were mostly acidic but generally fertile, with a few exceptions. Six soil chemical properties were investigated: soil pH, organic matter, total nitrogen, exchangeable potassium, exchangeable calcium, and exchangeable magnesium (Table 7). The only soil chemical property that showed a significant correlation with volume growth rankings was phosphorus pentoxide (P2O5) content, which had a moderate negative correlation (r = −0.39, p = 0.013). None of the other variables demonstrated significant correlations with volume growth rankings.

3.7. Integration of the Environmental Variables with Significant Correlation Coefficients

Table 8 shows the most important factors influencing optimal growing sites for yellow poplar in Korea. WE, GT, LN, LT, and SH emerged as the most crucial variables. LT and SH played negative roles in the cooler Northeastern and hot and dry Southeastern regions of the Korean Peninsula, which is consistent with the LN effect. Low LT and SH make the region less than ideal for yellow poplar growth.
The environmental variables that showed the strongest correlations with volume growth (correlation coefficients of 0.3 or higher) were integrated in equal proportions (Table 8). To ensure that the variables were independent, we performed correlation analysis on all possible pairs of variables before combining them. The four variables LN, WE, GT, and SH were mutually independent, meaning that they had no significant linear relationship with each other. This was confirmed by the fact that the correlation coefficients between all two pairs of variables were less than 0.05. However, the other pairs of variables, WE and LT, LT and SH, AT and GT, and GT and LT, were dependent on each other. The integrated mean values were ranked, and their Spearman rank correlation with volume growth rank was calculated (Table 9). The highest correlation coefficients were observed when WE was integrated with GT, and SH, or LN. This suggests that WE is the primary environmental factor controlling the volume growth of yellow poplar in plantations in Korea, with other factors playing a minor role.
In conclusion, we identified WE, P2O5, LN, GT, LT, AT, and SH as the most critical factors governing optimal growing sites for yellow poplar in Korea. Some of these factors have overlapping effects.

4. Discussion

Yellow poplar is a versatile tree that can thrive in a variety of climates, from the harsh winters of the north to the nearly frost-free winters of the south [16]. However, despite the milder climate in some northern regions of Korea than in the native northern limit of yellow poplar in the United States, yellow poplar trees in these regions still appear to be damaged by cold snaps. This suggests that cold temperatures and dry winter air may synergistically damage yellow poplar trees in cold northern regions. Previously, the performance and adaptation of yellow poplar in Korea were studied on a much smaller scale, with only six study sites [1]. Air and soil humidity were reported as critical factors for yellow poplar plantations. In this study, we found that regional effects on the growth of yellow poplar are influenced by a variety of climatic variables, with temperature being the most important factor. Yellow poplar grows best when rainfall is well-distributed throughout the growing season [17]. The dry winter and spring in Korea could, therefore, hinder the growth and adaptation of yellow poplar trees in this non-native environment. Previous studies found that global variation in xylem hydraulic conductivity is independently driven by two climate variables: growing season temperature (GT) and growing season precipitation (GP) [18,19]. However, in this study, GP was negatively correlated with volume growth, possibly due to concentrated rainfall during the summer.
The only humidity variable significantly correlated with volume growth ranking was SH, which had a negative correlation (r = −0.33, p < 0.05). GH had a weak correlation (r = 0.27, p = 0.065). In ranking correlation, a negative value indicates a positive relationship. This is consistent with findings that higher humidity is beneficial for volume growth during the dry spring season, but can have a negative impact during the wet growing season, possibly by reducing transpiration [20].
Topographical characteristics are also known to play a major role in determining where different tree species are found and how fast they grow [21,22]. However, in this study, only wind exposure showed a significant correlation with yellow poplar volume growth. A study of five mountain regions on three continents found that seedling abundance at alpine tree lines is limited by a combination of factors, with temperature playing a relatively minor role. The strongest negative effects on seedling abundance were found from wind exposure and radiation stress, followed by elevation-related temperature [23]. In our study, none of the other topographical variables, including azimuth aspects, were significantly correlated with volume growth. This is in contrast to previous studies, which have found associations between volume growth and certain aspects of azimuth direction [8,9]. More work is needed to elucidate the azimuthal effects.
The positive effects of phosphorus nutrition on tree growth are well-known [24,25]. However, it is not yet clear why yellow poplar volume growth decreases with increased P2O5 levels, given that P2O5 is rarely found in excess in the study area. Soil phosphorus can negatively influence plant growth, as evidenced by a study that found that adding phosphorus to the soil significantly decreased the survival rate of seedlings [26]. We did not measure the phosphorus (P) content in the leaves of the trees. More research is needed to better understand the relationship between P content and volume growth of yellow poplar.
Despite these challenges, yellow poplar thrives in more sites than expected. One challenge that may arise in the future is soil depth. Soils in Korean forests are generally shallow, and the majority of yellow poplar trees in the stands are less than 30 years old. As these trees grow larger, they will need deeper soil to support their growth. If the soil is not deep enough, the trees may eventually stop growing or become malformed [27]. Adopting a shorter harvesting rotation could be one way to address the challenge of shallow soil. A recent study employed a Bayesian Generalized Linear Model (BGLM) with climatic variables to predict the habitat distribution of a rare species (Taxus globosa) [28]. In our study, we specifically examined the correlation between yellow poplar growth and abiotic factors. However, we anticipate that in the future, we may employ modeling techniques to comprehensively identify the pivotal factors that influence yellow poplar growth. It will enable us to determine suitable sites for yellow poplar cultivation in Korea.

5. Conclusions

Yellow poplar can be successfully cultivated throughout South Korea, but it is important to consider specific environmental factors. For example, yellow poplar should be planted in less wind-exposed sites to avoid damage from cold snaps, especially in northern regions. Conversely, the poor growth observed in the southeast can be attributed to low precipitation and humidity during the spring and growing seasons. South Korea’s concentrated summer precipitation, unlike the consistent year-round precipitation in the eastern part of North America, poses challenges for yellow poplar adaptation in the drier southeast regions. This study identified seven environmental variables with moderate correlations to yellow poplar volume growth. Among these variables, wind exposure (WE), phosphorus pentoxide (P2O5), latitude (LN), growing season temperature (GT), low extreme temperature during January and February (LT), annual temperature (AT), and spring humidity (SH) emerged as the most crucial factors shaping yellow poplar growth, with WE being the most critical.
However, the correlation coefficient of the integrated variables remained rather low, possibly due to human interventions, such as fertilization, thinning, or weeding, in artificial stands. These interventions might mask the true effects of environmental variables on tree growth. Nevertheless, the identified variables can serve as valuable tools in guiding the selection of suitable planting zones for yellow poplar. Additionally, understanding the intricate interactions among these environmental factors will enhance our comprehension of tree growth dynamics. By considering the key environmental factors, stakeholders can implement strategic planting practices and management strategies to optimize yellow poplar growth and adaptation in diverse regions of the country.

Author Contributions

Conceptualization, investigation, resources, K.J., I.H.L. and C.O.; project administration, C.O.; supervision, I.H.L. and C.O.; methodology, funding acquisition, K.J. and C.O.; software, validation, formal analysis, data curation, writing—original draft preparation, K.J.; visualization, K.J. and S.B.; writing—review and editing, I.H.L., C.O., S.B. and E.J.C. All authors have read and agreed to the published version of the manuscript.

Funding

This study was carried out with the support of National Institute of Forest Science (NIFoS), Republic of Korea (Grant No. FE0604-2018-01-2022).

Data Availability Statement

The data is available on request from the corresponding author.

Acknowledgments

We thank E.W. Noh and Y.B. Koo for their critical review of the manuscript.

Conflicts of Interest

The authors declare no conflict of interest.

References

  1. Lyu, G.O.; Jang, S.S.; Choe, W.Y.; Kim, H.E. Growth performance and adaptation of Liriodendron tulipifera in Korea. J. Korean For. Soc. 2003, 92, 515–525. [Google Scholar]
  2. Kang, W.S.; Koo, K.A.; Choi, K.; Yang, J.C. Historic vegetation and environmental changes since the 15th century in the Korean peninsula. Quat. Int. 2015, 392, 25–36. [Google Scholar] [CrossRef]
  3. Choung, Y.; Lee, J.; Cho, S.; Noh, J. Review on the succession process of Pinus densiflora forests in South Korea: Progressive and disturbance-driven succession. J. Ecol. Environ. 2020, 44, 16. [Google Scholar] [CrossRef]
  4. Lee, H.; Lim, H.; Kang, J.-W. Growth performance of exotic trees in Korea. J. For. Environ. Sci. 2019, 35, 115–120. [Google Scholar] [CrossRef] [PubMed]
  5. Ryu, K.O.; Han, M.-S.; Noh, E.-R.; Kim, I.-S. Age-age correlation on volume growth of yellow poplar (Liriodendron tulipifera). J. Agric. Life Sci. 2014, 48, 13–23. [Google Scholar] [CrossRef]
  6. Min, S.-K.; Son, S.-W.; Seo, K.-H.; Choi, Y.-S.; Jeong, J.-H.; Kim, B.-M.; Kim, J.-W.; Kim, Y.-H.; Lee, J.-Y.; Lee, M.I. Changes in weather and climate extremes over Korea and possible causes: A review. Asia-Pac. J. Atmos. Sci. 2015, 51, 103–121. [Google Scholar] [CrossRef]
  7. World Bank Group. Climate Change Knowledge Portal. 2021. Available online: https://climateknowledgeportal.worldbank.org/ (accessed on 20 June 2023).
  8. Carmean, W.H. Site quality for eastern hardwoods. In The Silviculture of Oaks and Associated Species; U.S. Department of Agriculture Forest Service Research Paper NE-144; Northeast Forest Experiment Station: Upper Darby, PA, USA, 1970; pp. 36–56. [Google Scholar]
  9. Crum, C.T. Factors Influencing Basal Area Growth of Yellow-Poplar (Liriodendron tulipifera L.) in Central West Virginia; West Virginia University: Morgantown, WV, USA, 2004; p. 1533. Available online: https://researchrepository.wvu.edu/etd/1533 (accessed on 20 June 2023).
  10. Hewitt, A. Soil Properties for Plant Growth; Landcare Research Science Series No. 26; Manaaki Whenua Press: Lincoln, New Zealand, 2004; ISBN 0-478-09362-4. [Google Scholar]
  11. Turgut, E.T.; Usanmaz, Ö. An analysis of vertical profiles of wind and humidity based on long-term radiosonde data in Turkey. Anadolu Univ. J. Sci. Technol. A-Appl. Sci. Eng. 2016, 17, 830–844. [Google Scholar]
  12. Johnson, S.E.; Abrams, M.D. Age class, longevity, and growth relationships; Protracted growth increases in old trees in the eastern United States. Tree Physiol. 2009, 29, 1317–1328. [Google Scholar] [CrossRef] [PubMed]
  13. Schlegel, B.E.; Kulow, D.L.; Baughman, R.N. Empirical yield tables for West Virginia yellow poplar. West Va. Agric. For. Exp. Stn. Bull. 1969. [Google Scholar] [CrossRef]
  14. Linacre, E.T. A simple formula for estimating evaporation rates in various climates, using temperature data alone. Agric. Meteorol. 1977, 18, 409–424. [Google Scholar] [CrossRef]
  15. Beck, D.E.; Della-Bianca, L. Yellow-poplar: Characteristics and management. In Agriculture Handbook No. 583; USDA, Southeastern Forest Experiment Station Asheville: Asheville, NC, USA, 1981. [Google Scholar]
  16. Burns, R.M.; Honkala, B.H. Silvics of North America: Volume 2; Technical Coordinators; Hardwoods Agriculture Handbook 654; United States Department of Agriculture (USDA) Forest Service: Washington, DC, USA, 1990.
  17. McCarthy, E.F. Yellow Poplar Characteristics, Growth, and Management; Technical Bulletin No. 356; USDA: Washington, DC, USA, 1933.
  18. Yan, E.Y.; Song, X.M.; Hao, G.; Reich, P.B.; Wang, Y.; Ellsworth, D.S.; Ye, Q. Growing-season temperature and precipitation are independent drivers of global variation in xylem hydraulic conductivity. Glob Chang. Biol. 2020, 26, 1833–1841. [Google Scholar]
  19. Janecka, K.; Harvey, J.E.; Trouillier, M.; Kaczka, R.J.; Metslaid, S.; Metslaid, M.; Buras, A.; Wilmking, M. Higher Winter-Spring Temperature and Winter-Spring/Summer Moisture Availability Increase Scots Pine Growth on Coastal Dune Microsites Around the South Baltic Sea. Front. For. Glob. Chang. 2020, 3, 578912. [Google Scholar] [CrossRef]
  20. Tullus, A.; Kupper, P.; Sellin, A.; Parts, L.; Sober, J.; Tullus, T.; Lõhmus, K.; Sober, A.; Tullus, H. Climate Change at Northern Latitudes: Rising Atmospheric Humidity Decreases Transpiration, N-Uptake and Growth Rate of Hybrid Aspen. PLoS ONE 2012, 7, e42648. [Google Scholar] [CrossRef] [PubMed]
  21. Bellingham, P.; Edmund, T. The Influence of Topography on Tree Growth, Mortality, and Recruitment in a Tropical Montane Forest. Biotropica 2000, 32, 378–384. [Google Scholar] [CrossRef]
  22. Adams, H.R.; Barnard, H.R.; Loomis, A.K. Topography alters tree growth–climate relationships in a semi-arid forested catchment. Ecosphere 2014, 5, 148. [Google Scholar] [CrossRef]
  23. McIntire, E.J.B.; Piper, F.I.; Fajardo, A. Wind exposure and light exposure, more than elevation-related temperature, limit tree line seedling abundance on three continents. J. Ecol. 2016, 104, 1379–1390. [Google Scholar] [CrossRef]
  24. Duan, X.; Liu, W.; Wang, X.; Zhang, L.; Liu, S.; Guo, L.; Guo, D.; Hou, X. Effects of Phosphorus Fertilization on Growth Characteristics, Fatty Acid Composition, and Seed Yields of Fengdan (Paeonia ostii T. Hong & J. X. Zhang). HortScience 2022, 57, 733–740. [Google Scholar]
  25. Khan, F.; Siddique, A.B.; Shabala, S.; Zhou, M.; Zhao, C. Phosphorus Plays Key Roles in Regulating Plants’ Physiological Responses to Abiotic Stresses. Plants 2023, 12, 2861. [Google Scholar] [CrossRef] [PubMed]
  26. Mao, Q.; Chen, H.; Gurmesa, G.A.; Gundersen, P.; Ellsworth, D.; Gilliam, F.; Wang, C.; Zhu, F.; Ye, Q.; Mo, J.; et al. Negative effects of long-term phosphorus additions on understory plants in a primary tropical forest. Sci. Total Environ. 2021, 798, 149306. [Google Scholar] [CrossRef] [PubMed]
  27. Russel, T.E. Planting Yellow Poplar—Where We Stand Today; USDA Forest Service General Technical Report SO-17; Southern Forest Experiment Station: New Orleans, LA, USA, 1977; 8p.
  28. Antunez, P. Influence of physiography, soil and climate on Taxus globosa. Nord. J. Bot. 2021, 39, e03058. [Google Scholar] [CrossRef]
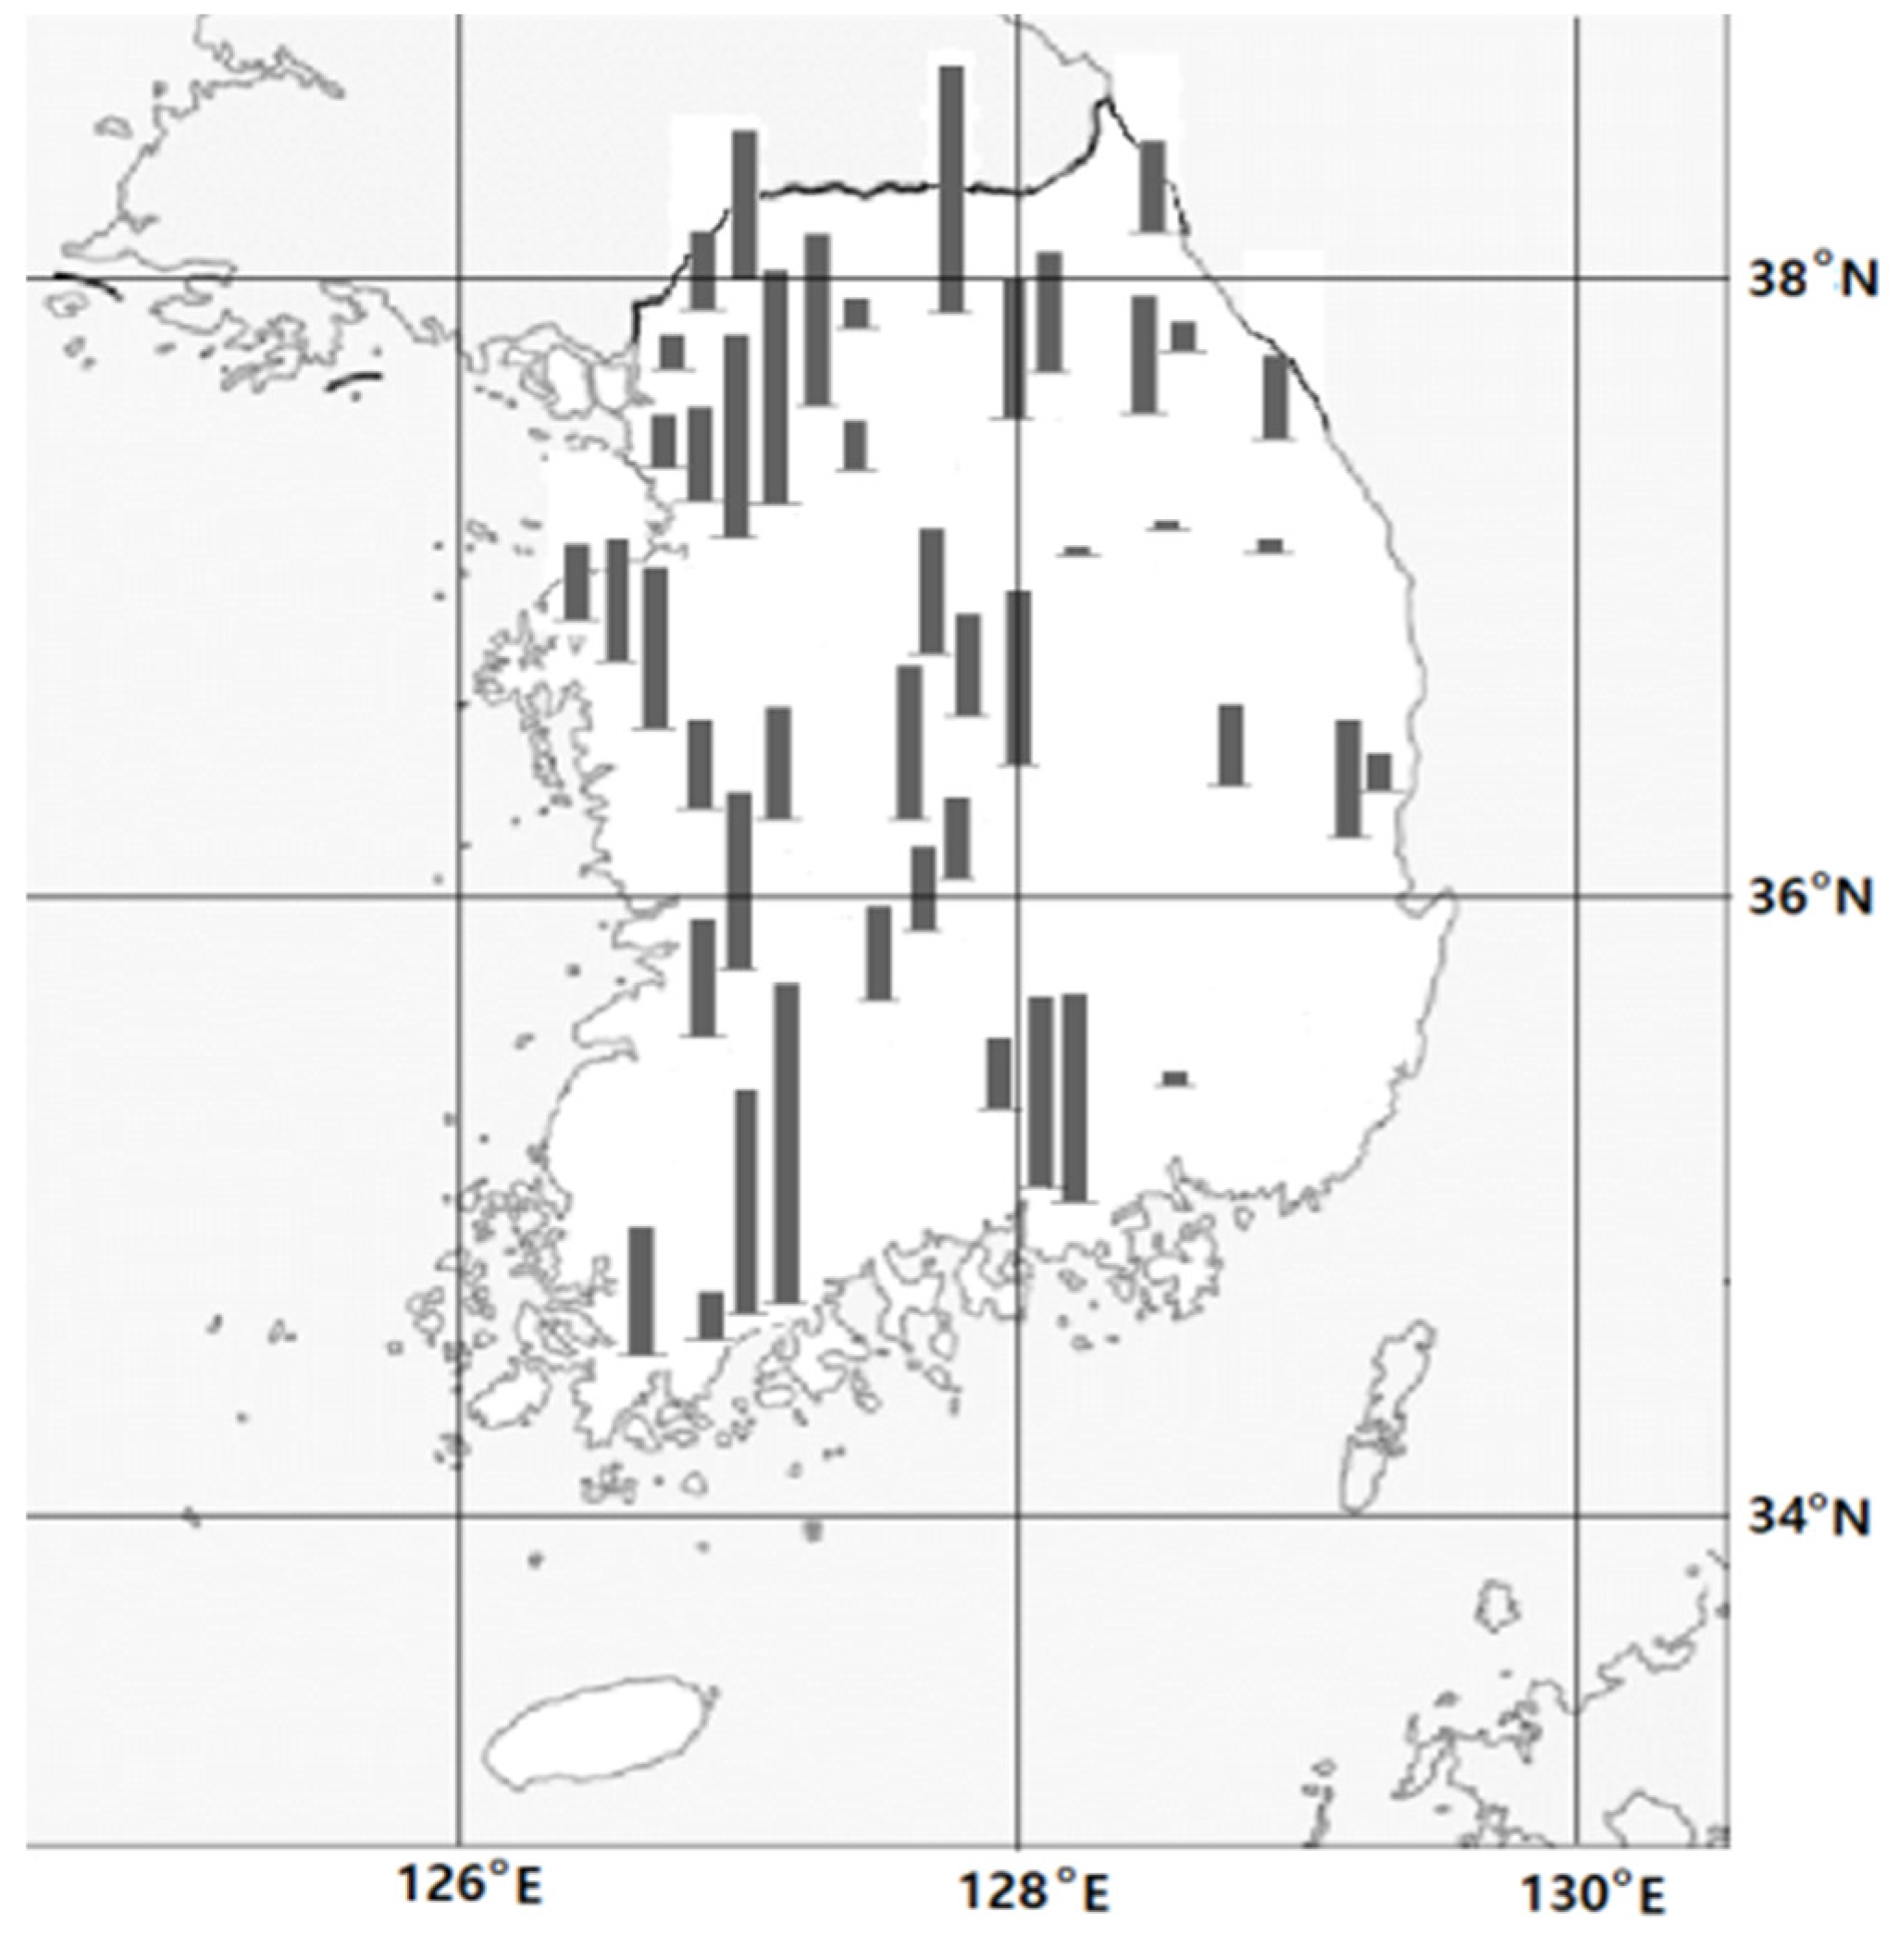
Figure 1. Distribution of sample stands. Latitude and longitude ranged from 34.5528 Nº to 38.2885 Nº and 126.5272 E° to 129.4114 E°, respectively. Distribution of mean volume growth (m3) of yellow poplar trees in the stands is shown at age 20 across the country.
Forests 14 02003 g001
Figure 2. Changes in volume growth of yellow poplar along the altitude (left) and latitude (right).
Forests 14 02003 g002
Figure 3. Volume growth of yellow poplar by mean annual (left), and growing season (right) temperatures.
Forests 14 02003 g003
Figure 4. Volume growth of yellow poplar by spring precipitation.
Forests 14 02003 g004
Figure 5. Volume growth of yellow poplar by slope position and wind exposure level.
Forests 14 02003 g005
Figure 6. Volume growth of yellow poplar by soil depth.
Forests 14 02003 g006
Table 1. Spearman correlation coefficients (r) of volume growth with altitude, latitude and longitude.
AltitudeLatitudeLongitude
Volume growthr−0.24−0.14−0.34
p0.0970.3270.016
Table 2. Spearman’s correlation coefficients (r) between temperature variables and Volume growth.
Annual TemperatureGrowing Season
Temperature
Mean Jul–Aug
High Extreme
Mean Jan–Feb
Low Extreme
Volume growthr0.30.35−0.080.34
p0.0370.0150.6080.016
Table 3. Spearman rank correlation coefficients (r) between precipitation variables and volume growth of yellow.
Annual
Precipitation
Growing Season
Precipitation
Winter
Precipitation
Spring
Precipitation
Volume growthr−0.27−0.260.06−0.17
p0.0590.0670.4730.245
Table 4. Spearman rank correlation coefficients (r) between humidity variables and volume growth of yellow poplar.
Annual
Humidity
Growing Season
Humidity
Winter
Humidity
Spring
Humidity
Effective Water
Volume growthr0.170.270.06−0.330.27
p0.2470.0650.6960.020.062
Table 5. Ranges of some climate variables with Spearman correlation coefficients higher than 0.3.
AT (°C)LT (°C)GT (°C)SH (%)
Mean11.41−13.8617.2761.9
Max13.70 −8.818.771.6
Min6.44−21.8812.3653.9
AT: annual temperature, LT: low extreme temperature during January and February, GT: growing season temperature, ST: spring precipitation, and SH: spring humidity.
Table 6. Pearson’s correlation coefficients (r) between volume growth of yellow poplar and topographic factors.
Slope
Position
Wind
Exposure
Soil
Depth
Slope
Degree
Soil
Drainage
Volume growthr−0.160.530.11−0.06−0.11
p0.275<0.0010.440.4940.209
Table 7. Spearman rank correlation coefficients (r) between soil chemical properties and volume growth of yellow poplar.
Soil pHOMTotal NP2O5KCaMg
Volume
growth
r−0.240.040−0.39−0.16−0.24−0.11
p0.1310.8270.9880.0130.3130.1410.495
OM: Organic matters, K, Ca, and Mg: exchangeable form.
Table 8. Spearman rank correlation coefficients (r) between variables with high correlation coefficients and volume growth of yellow poplar.
WEP2O5GTLNLTSHAT
Volume growthr0.53−0.390.35−0.340.330.310.3
p<0.0010.0130.0150.0160.0320.0460.037
WE: wind exposure, P2O5: P2O5 content, GT: growing season temperature, LN: longitude, LT: low temperature during January–February, SH: spring humidity, and AT: mean annual temperature.
Table 9. Spearman correlation between different combinations of variables and volume growth of yellow poplar.
Combination of Environment Variablesrp
WE0.53<0.001
WE + P2O50.170.25
WE + GT0.58<0.001
WE + GT + LN0.58<0.001
WE + GT + LN + LT + SH + P2O5 + AT0.510.001
LT + SH0.420.003
WE: wind exposure, P2O5: P2O5 content, GT: growing season temperature, LN: longitude, LT: low temperature during January–February, SH: spring humidity, and AT: mean annual temperature.
Disclaimer/Publisher’s Note: The statements, opinions and data contained in all publications are solely those of the individual author(s) and contributor(s) and not of MDPI and/or the editor(s). MDPI and/or the editor(s) disclaim responsibility for any injury to people or property resulting from any ideas, methods, instructions or products referred to in the content.