


The Impact of Environmental Regulation on the Green Overall Factor Productivity of Forestry in the Yangtze River Economic Belt

Abstract
:1. Introduction
1.1. Background of Topic Selection
1.2. Research Significance
1.3. Purpose of the Study
2. Literature Review
3. Materials and Methods
3.1. Research Hypothesis
3.2. Description of Research Methodology and Variables
3.2.1. SBM-ML Index Model for Unexpected Output Super Efficiency
3.2.2. Fixed-Effect Panel Model
3.2.3. Panel Smooth Transformation Model (PSTR)
3.3. Variable Description
4. Results
4.1. Panel Data Model Regression Results
4.2. Spatiotemporal Heterogeneity Test
4.3. Panel Smoothing Transformation Regression (PSTR) Model Estimation Results
4.3.1. Test Results of Nonlinear Effects
4.3.2. PSTR Model Estimation Results
5. Discussion
- “Compensation for innovation theory”.
- “Compliance cost argument”
- “Uncertainty theory”
6. Conclusions
6.1. Main Conclusion
6.2. Policy Recommendations
6.3. Research Deficiencies and Prospects
Author Contributions
Funding
Data Availability Statement
Acknowledgments
Conflicts of Interest
References
- Wang, B.; Liu, G. Energy conservation and emission reduction and China’s green economic growth—Based on a total factor productivity perspective. China Ind. Econ 2015, 5, 57–69. [Google Scholar]
- Li, X.; Wu, R.; Guo, Z. Analysis of the relationship between the construction of the Yangtze River Economic Belt and forestry development. For. Econ. 2016, 38, 30–35. [Google Scholar]
- Ramanathan, R.; Ramanathan, U.; Bentley, Y. The debate on flexibility of environmental regulations, innovation capabilities and financial performance—A novel use of DEA. Omega 2018, 75, 131–138. [Google Scholar] [CrossRef]
- Porter, M.E. America’s Green Strategy. Sci. Am. 1991, 268, 95–117. [Google Scholar]
- Jaffe, A.B.; Palmer, K. Environmental regulation and innovation: A panel data study. Rev. Econ. Stat. 1997, 79, 610–619. [Google Scholar] [CrossRef]
- Yuan, B.; Zhang, Y. Flexible environmental policy, technological innovation and sustainable development of China’s industry: The moderating effect of environment regulatory enforcement. J. Clean. Prod. 2020, 243, 118543. [Google Scholar] [CrossRef]
- Gollop, F.M.; Roberts, M.J. Environmental regulations and productivity growth: The case of fossil-fueled electric power generation. J. Political Econ. 1983, 91, 654–674. [Google Scholar] [CrossRef]
- Andrei, J.; Mieila, M.; Popescu, G.H.; Nica, E.; Cristina, M. The impact and determinants of environmental taxation on economic growth communities in Romania. Ettergies 2016, 9, 902. [Google Scholar] [CrossRef]
- Jorgenson, D.W.; Wilcoxen, P.J. Environmental regulation and US economic growth. RAND J. Econ. 1990, 21, 314–340. [Google Scholar] [CrossRef]
- Brunnermeier, S.B.; Levinson, A. Examining the evidence on environmental regulations and industry location. J. Environ. Dev. 2004, 13, 6–41. [Google Scholar] [CrossRef]
- Gray, W.B.; Shadbegian, R.J. Plant vintage, technology, and environmental regulation. J. Environ. Econ. Manag. 2003, 46, 384–402. [Google Scholar] [CrossRef]
- Lanoie, P.; Patry, M.; Lajeunesse, R. Environmental regulation and productivity: Testing the porter hypothesis. J. Product. Anal. 2008, 30, 121–128. [Google Scholar] [CrossRef]
- Xu, C.; Gan, M. How does economic environmental regulation in the Yellow River Basin affect green total factor productivity? J. He Hai Univ. (Philos. Soc. Sci. Ed.) 2021, 23, 62–69+111. [Google Scholar]
- Clinch, J.P. Assessing the social efficiency of temperate-zone commercial forestry programmes: Ireland as a case study. For. Policy Econ. 2000, 1, 225–241. [Google Scholar] [CrossRef]
- Das, G.G.; Alavalapati, J.R.; Carter, D.R.; Tsigas, M.E. Regional impacts of environmental regulations and technical change in the US forestry sector: A multiregional CGE analysis. For. Policy Econ. 2005, 7, 25–38. [Google Scholar] [CrossRef]
- Salehirad, N.; Sowlati, T. Productivity and efficiency assessment of the wood industry: A review with a focus on Canada. For. Prod. J. 2006, 56, 25–32. [Google Scholar]
- Diaz-Balteiro, L.; Herruzo, A.C.; Martinez, M.; González-Pachón, J. An analysis of productive efficiency and innovation activity using DEA: An application to Spain’s wood-based industry. For. Policy Econ. 2006, 8, 762–773. [Google Scholar] [CrossRef]
- Šporćić, M.; Martinić, I.; Landekić, M.; Lovrić, M. Measuring efficiency of organizational units in forestry by nonparametric model. Croat. J. For. Eng. J. Theory Appl. For. Eng. 2009, 50, 1–13. [Google Scholar]
- Pan, D. The impact of command control and market incentive environmental regulations on afforestation area: Evidence from quasi natural experiments at the county level in China. Resour. Sci. 2021, 43, 2026–2041. [Google Scholar]
- Xu, Y.; Lin, R. Green development path of forestry carbon sequestration industry under environmental regulations. Mark. Res. 2019, 8, 20–21. [Google Scholar]
- Jiang, W.; Liu, J.; Hu, H. Study on the spatiotemporal evolution of forestry ecological efficiency and environmental regulation threshold effect in China. J. Cent. South For. Univ. Sci. Technol. 2020, 40, 166–174. [Google Scholar]
- Zheng, Y. Research on the Impact of FDI on the Forestry Ecological Environment from the Perspective of Environmental Regulation. Old Area Constr. 2019, 16, 26–37. [Google Scholar]
- LeBel, L.; Stuart, W. Technical efficiency evaluation of logging contractors using a nonparametric model. J. For. Eng. 1998, 9, 15–24. [Google Scholar] [CrossRef]
- Liu, T.; Li, J. Spatial and temporal differentiation of green total factor productivity in China’s forestry and its influencing factors. World For. Res. 2020, 55, 56–61. [Google Scholar]
- Lv, J.; Sun, J.; Cai, X. Analysis of spatiotemporal evolution of green total factor productivity in China’s forestry. J. Agric. For. Econ. Manag. 2022, 21, 320–330. [Google Scholar]
- Zhang, Y.Z.; Qiao, Y. Research on the Impact of Different Types of Environmental Regulations on Green Total Factor Productivity in Manufacturing Industry: An Empirical Analysis Based on DEA-Malmquist Index Method and Spatial Error Model. Ecol. Econ. 2022, 38, 177–182. [Google Scholar]
- Testa, F.; Iraldo, F.; Frey, M. The effect of environmental regulation on firms’ competitive performance: The case of the building & construction sector in some EU regions. J. Environ. Manag. 2011, 92, 2136–2144. [Google Scholar]
- Mueller, R.; Sanderson, E. Environmental regulations and innovation activity in UK manufacturing industries. Resour. Energy Econ. 2012, 34, 211–235. [Google Scholar]
- Wagner, M. On the relationship between environmental management, environmental innovation and patenting: Evidence from German manufacturing firms. Res. Policy 2007, 36, 1587–1602. [Google Scholar] [CrossRef]
- Cui, J.; Ma, P. Measurement of China’s regional agricultural green total factor productivity differences based on the SBM-ML index model. China Mark. 2020, 35, 6–8. [Google Scholar]
- Liu, L. Research on atmospheric environmental efficiency in China based on SBM and ML index models. J. Tong Ling Univ. 2016, 15, 91–96. [Google Scholar]
- Yuan, Y. Nonlinear Impact of Financial Industry on the Real Economy Based on PSTR Model. Technol. Econ. Manag. Res. 2022, 3, 63–66. [Google Scholar]
- Johnstone, N.; Managi, S.; Rodríguez, M.C.; Haščič, I.; Fujii, H.; Souchier, M. Environmental policy design, innovation and efficiency gains in electricity generation. Energy Econ. 2017, 63, 106–115. [Google Scholar] [CrossRef]
- Zhang, R.; Cao, Y.; Chen, D.; Zou, Z. Study on the mechanism and effect of heterogeneous environmental regulation on ecological welfare performance in the Yellow River Basin. For. Econ. 2022, 44, 34–49. [Google Scholar]
- Wang, W.; Sun, F. Financial development, environmental regulation and green total factor productivity growth in the Yangtze River Economic Belt. J. Southwest Univ. Natl. (Humanit. Soc. Sci. Ed.) 2018, 39, 129–137. [Google Scholar]
- Cai, W.; Zhou, X. The dual effect of China’s environmental regulation on green total factor productivity. Economist 2017, 9, 27–35. [Google Scholar]
- Ye, B.; Cao, Q. Environmental regulation and development of the tertiary industry. Appl. Econ. 2023, 55, 6025–6041. [Google Scholar] [CrossRef]
- Xie, J.L.; Wang, Z. The Threshold Effect and Spatial Difference of Environmental Regulation on Tourism Ecological Efficiency in the Yangtze River Economic Belt. Geogr. Geogr. Inf. Sci. 2023, 30, 1–9. [Google Scholar]
- Xiao, P.; Su, J.; Li, Q. Research on the Impact of Environmental Regulation on Green Total Factor Productivity in Dong Ting Lake Region. Financ. Econ. 2022, 5, 7–17. [Google Scholar]
- Huang, S. Analysis of the impact mechanism of sports financial input threshold effect on economic growth based PSTR model. Sports Sci. Technol. Lit. Bull. 2023, 31, 217–220. [Google Scholar]
- Zhou, S.; Jun, L.X.; Liu, Y. Study on threshold effect of environmental regulation intensity on energy efficiency: Based on PSTR model. Econ. Math. 2020, 37, 9–19. [Google Scholar] [CrossRef]
- Wu, L.; Zhu, C.; Song, X.; He, J. Impact of Environmental Regulation on Carbon Emissions in Countries along the Belt and Road—An Empirical Study Based on PSTR Model. Int. J. Environ. Res. Public Health 2023, 20, 2164. [Google Scholar] [CrossRef] [PubMed]
- Yang, F. The relationship between knowledge capital, industrial structure upgrading and total factor productivity: An empirical evidence based on fixed effect model and PSTR model. J. Tong Ling Univ. 2020, 19, 14–20. [Google Scholar]
- An, K. Research on the impact of environmental regulation on green total factor productivity in the Yellow River ecological economic belt. Ph.D. Thesis, Zhengzhou University, Zhengzhou, China, 2021. [Google Scholar] [CrossRef]
- Liu, Y. Research on the impact of environmental regulation on green total factor productivity in the Yangtze River Economic Belt. Ph.D. Thesis, Chongqing Technology and Business University, Chongqing, China, 2021. [Google Scholar] [CrossRef]
- Sun, Y. Research on the impact of environmental regulation on the high-quality development of mining. Res. Technol. Econ. Manag. 2023, 8, 94–95. [Google Scholar]
- Liu, H.; Chen, L.; Shan, Y. Does environmental regulation affect global value chain position in service sectors? Evidence from 41 major economies. Front. Environ. Sci. 2022, 10, 1051015. [Google Scholar] [CrossRef]
- Yu, M.; Yuan, S. The impact of environmental regulation and government input on agricultural emission reduction. J. Anhui Agric. Sci. 2023, 51, 229–233+250. [Google Scholar]
- Deng, M. The impact of environmental regulation on green total factor productivity in manufacturing industry. Ph.D. Thesis, Yunnan University of Finance and Economics, Kunming, China, 2023. [Google Scholar]
- Porter, M.E.; van der Linde, C. Toward a new conception of the environment-competitiveness relationship. J. Econ. Perspect. 1995, 9, 97–118. [Google Scholar] [CrossRef]
- Levinson, A.; Taylor, M.S. Unmasking the pollution haven effect. Int. Econ. Rev. 2008, 49, 223–254. [Google Scholar] [CrossRef]
- Baron, R.M.; Kenny, D.A. The moderator—Mediator variable distinction in social psychological research: Conceptual, strategic, and statistical considerations. J. Personal. Soc. Psychol. 1986, 51, 1173. [Google Scholar] [CrossRef]
- Xie, R.H.; Yuan, Y.J.; Huang, J.J. Different types of environmental regulations and heterogeneous influence on “green” productivity: Evidence from China. Ecol. Econ. 2017, 132, 104–112. [Google Scholar] [CrossRef]
- Walter, I.; Ugelow, J.L. Environmental policies in developing countries. Ambio 1979, 8, 102–109. [Google Scholar]
- Berman, E.; Bui, L.T. Environmental regulation and labor demand: Evidence from the south coast air basin. J. Public Econ. 2001, 79, 265–295. [Google Scholar] [CrossRef]
- Haveman, R.H.; Christainsen, G.B. Environmental regulations and productivity growth. Nat. Resour. J. 1981, 21, 459–509. [Google Scholar]
- Xing, Y.; Kolstad, C.D. Do lax environmental regulations attract foreign investment? Environ. Resour. Econ. 2002, 21, 1–22. [Google Scholar] [CrossRef]
- Andrejić, M.; Kilibarda, M.; Pajić, V. Measuring efficiency change in time applying malmquist productivity index: A case of distribution centres in Serbia. Facta Univ. Ser. Mech. Eng. 2021, 19, 499–514. [Google Scholar] [CrossRef]
- Qin, W.; Qi, X. Evaluation of green logistics efficiency in Northwest China. Sustainability 2022, 14, 6848. [Google Scholar] [CrossRef]
- Zhao, W.; Qiu, Y.; Lu, W.; Yuan, P. Input—Output efficiency of Chinese power generation enterprises and its improvement direction-based on three-stage DEA model. Sustainability 2022, 14, 7421. [Google Scholar] [CrossRef]

| Type | Variable Name | Data Description | ||
|---|---|---|---|---|
| Interpreted variable | Overall factor productivity of forestry | Investment | Land input | Forestry land area |
| Energy input | Overall area energy consumption × gross regional forest product/gross regional product (GDP) | |||
| Labor input | Number of employees in the regional forestry industry at the end of the year | |||
| Capital investment | Forestry fixed assets investment stock | |||
| Expected output | Economic performance | Gross regional forestry production | ||
| Ecological benefit | Area of afforestation in the current year | |||
| Unexpected output | Regional forestry industry wastewater discharge | Regional industrial wastewater discharge× regional forestry secondary industry output value/regional industrial output value | ||
| Regional forestry industry emissions | Regional industrial emissions × regional forestry secondary industry output value/regional industrial output value | |||
| Regional forestry solid waste production | Regional generation of industrial solid waste × regional forestry secondary production value/gross regional industrial product | |||
| Variable | 1 | 2 | 3 | 4 | 5 |
|---|---|---|---|---|---|
| GTFP | |||||
| CE | 0.576 *** (5.022) | 0.244 ** (2.408) | 0.409 ** (2.181) | ||
| IE | −0.0425 *** (−3.3895) | −0.020 (−1.668) | −0.018 (−1.364) | ||
| PE | 0.109 *** (4.439) | 0.027 (0.760) | 0.012 (0.321) | ||
| Control variable | ✓ | ||||
| R-squared | 0.689 | 0.751 | 0.755 | 0.780 | 0.776 |
| Variable | GTFP | ||||
|---|---|---|---|---|---|
| Regional Heterogeneity | Temporal Heterogeneity | ||||
| Upper Yangtze River | The Middle Reaches of the Yangtze River | Lower Yangtze River | Before 2014 | After 2014 | |
| CE | 0.276 (0.913) | 1.591 ** (3.058) | 0.939 ** (2.330) | 0.069 (0.511) | 0.178 * (1.942) |
| IE | −0.007 (−0.521) | 0.082 (0.630) | 0.138 ** (2.503) | −0.010 (−0.152) | −0.013 * (−1.81) |
| PE | −0.103 (−1.340) | 0.077 (1.071) | −0.151 ** (−2.022) | −0.008 (−0.163) | 0.027 * (−0.806) |
| Control variable | ✓ | ✓ | ✓ | ✓ | ✓ |
| R-squared | 0.798 | 0.774 | 0.572 | 0.001 | 0.091 |
| Transformation Variable | Nonlinear Test (H0: r = 0, H1: r = 1) | Residual Nonlinear Test (H0: r = 1, H1: r = 2) | ||||
|---|---|---|---|---|---|---|
| LM | LMF | LRT | LM | LMF | LRT | |
| CE | 46.879 *** (0.000) | 11.618 *** (0.000) | 54.513 *** (0.000) | 1.831 (0.872) | 0.315 (0.903) | 1.840 (0.871) |
| IE | 32.918 *** (0.000) | 7.362 *** (0.000) | 36.443 *** (0.000) | 0.867 (1.865) | 0.900 (0.321) | 0.866 (1.875) |
| PE | 39.879 *** (0.000) | 9.375 *** (0.000) | 45.221 *** (0.000) | 13.704 (0.018) | 2.533 (0.031) | 14.267 (0.014) |
| Variable | CE | IE | PE | |||
|---|---|---|---|---|---|---|
| Low System | High System | Low System | High System | Low System | High System | |
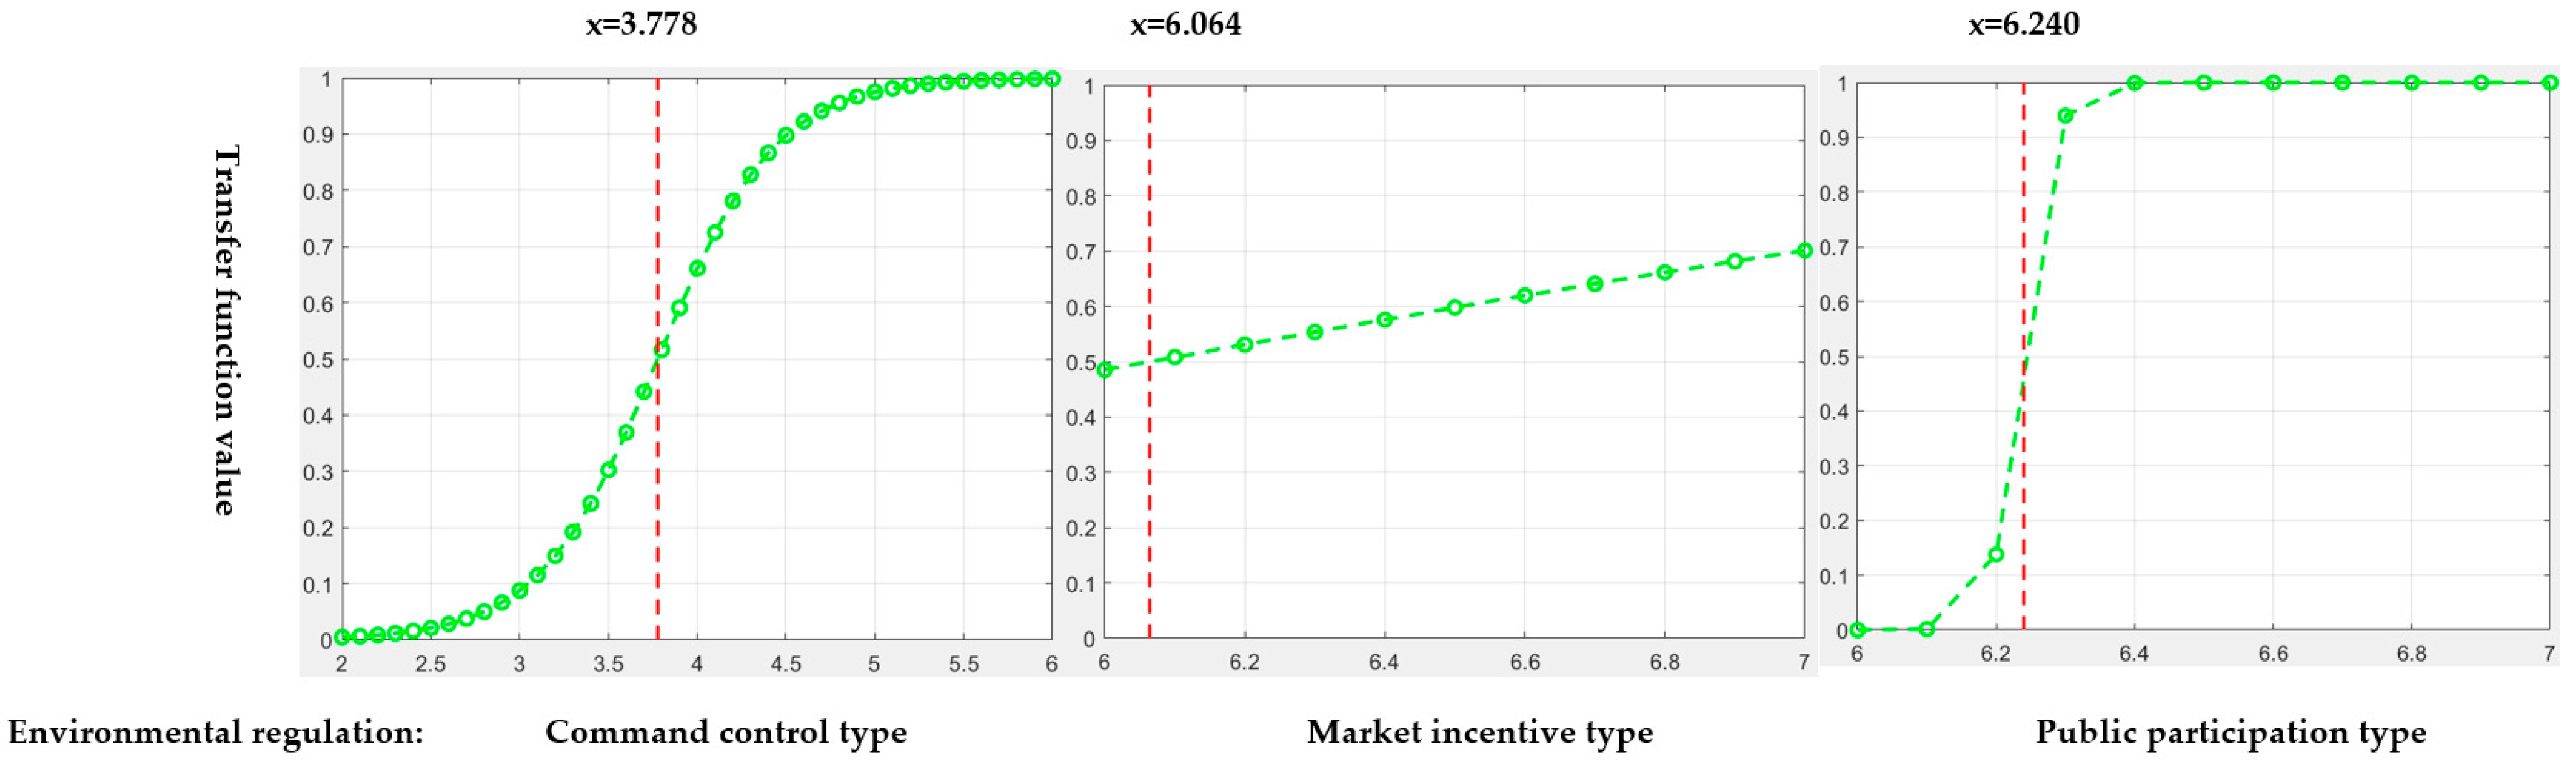
| ER. | −0.694 * (1.784) | 0.629 * (1.741) | 0.018 (0.478) | 0.829 * (1.746) | 0.214 * (1.506) | −0.338 *** (−3.203) |
| UL. | −2.412 * (2.352) | 0.851 *** (3.391) | −5.756 *** (−4.898) | 3.665 *** (3.755) | −0.034 (−0.043) | −2.375 *** (−3.543) |
| GDP | 3.380 (0.687) | 2.221 (0.870) | −1.524 *** (−4.020) | 0.316 *** (3.756) | −0.400 * (−1.183) | −0.111 * (0.982) |
| DO | −0.365 (0.416) | 0.464 (0.567) | 0.943 *** (6.601) | −0.323 ** (2.460) | 0.214 * (1.367) | 0.212 (−0.011) |
| PYE | −4.167 (−0.593) | 4.866 * (1.826) | 7.416 *** (4.347) | 3.323 ** (−2.564) | 0.940 * (0.726) | 0.531 (−0.285) |
| r | 3.011 | 0.911 | 45.800 | |||
| c | 3.778 | 6.064 | 6.240 | |||
Disclaimer/Publisher’s Note: The statements, opinions and data contained in all publications are solely those of the individual author(s) and contributor(s) and not of MDPI and/or the editor(s). MDPI and/or the editor(s) disclaim responsibility for any injury to people or property resulting from any ideas, methods, instructions or products referred to in the content. |
© 2023 by the authors. Licensee MDPI, Basel, Switzerland. This article is an open access article distributed under the terms and conditions of the Creative Commons Attribution (CC BY) license (https://creativecommons.org/licenses/by/4.0/).
Share and Cite
Li, D.; Li, Y.; Tian, G.; Mendako, R.K. The Impact of Environmental Regulation on the Green Overall Factor Productivity of Forestry in the Yangtze River Economic Belt. Forests 2023, 14, 2004. https://doi.org/10.3390/f14102004
Li D, Li Y, Tian G, Mendako RK. The Impact of Environmental Regulation on the Green Overall Factor Productivity of Forestry in the Yangtze River Economic Belt. Forests. 2023; 14(10):2004. https://doi.org/10.3390/f14102004
Chicago/Turabian StyleLi, Deli, Yang Li, Gang Tian, and Richard K. Mendako. 2023. "The Impact of Environmental Regulation on the Green Overall Factor Productivity of Forestry in the Yangtze River Economic Belt" Forests 14, no. 10: 2004. https://doi.org/10.3390/f14102004
APA StyleLi, D., Li, Y., Tian, G., & Mendako, R. K. (2023). The Impact of Environmental Regulation on the Green Overall Factor Productivity of Forestry in the Yangtze River Economic Belt. Forests, 14(10), 2004. https://doi.org/10.3390/f14102004