Abstract
In recent years, rapid global changes have accelerated the loss of habitats and fragmentation of landscapes, emerging as primary drivers of the alarming decline in global biodiversity. Through the construction of ecological networks (ENs) that simulate the interactions between animal and plant species with their environment, it is possible to mitigate landscape fragmentation and the loss of biodiversity. In this study, we focused on the ecologically diverse southeastern region of the Qinghai–Tibetan Plateau (QTP) as our research area and developed a comprehensive Multi-Species Ecological Network (MEN) consisting of ten species. Through employing complex network analysis methods, we thoroughly examined the intra-species and inter-species interactions within the MEN, integrating the findings with the natural characteristics of the study area to yield valuable insights. The results of our study revealed considerable spatial variations in the MEN. Specifically, the western and eastern regions experienced significant ecological resistance, leading to fragmented ecological sources and a limited connectivity of ecological corridors. Furthermore, the application of complex network analysis revealed inadequate connectivity and stability in specific localized areas within the MEN. This emphasizes the pressing requirement for effective ecological preservation plans. Through this study, our aim is to advance research on multi-species ecological spatial networks and to offer novel perspectives and methodologies for biodiversity conservation and habitat maintenance in the Qinghai–Tibetan Plateau.
1. Introduction
Biodiversity loss is occurring at an unprecedented rate, and the factors driving this decline are becoming increasingly severe. These factors include changes in land and marine use, overexploitation, climate change, pollution, and the spread of invasive species [1,2,3]. In recent years, habitat loss and fragmentation have emerged as critical issues in conservation biology [4]. They are recognized as significant threats to global biodiversity and have negative effects on a wide range of taxonomic groups, including birds, mammals, reptiles, amphibians, invertebrates, and plants [5,6,7]. Although current conservation and management efforts have shown some positive outcomes, they struggle to keep up with the growing pressures on biodiversity [8,9]. These pressures are linked to increased levels of food, energy, and resource consumption, as well as infrastructure development. Furthermore, global climate change poses a direct or indirect threat to global animal and plant populations by reducing suitable habitat areas, forcing species to shift habitats, and impacting population growth rates [1,10]. To protect biodiversity and preserve habitats, it is crucial to adopt new perspectives and approaches to understand and analyze the challenges of habitat fragmentation and loss.
The construction of a multi-species ecological network (MEN) offers a fresh perspective for comprehending biodiversity and habitat fragmentation [11,12]. Previous research methods that relied on species tagging and field surveys were time-consuming and expensive. Therefore, these studies often focus on a few selected species or limited geographic areas, which limits inferences at the larger population level [13]. Furthermore, traditional methods often lead to difficulty in comprehensively capturing the spatial characteristics and complex interactions of species [14,15]. The ecological network (EN) based on graph theory addresses these limitations by representing complex and interconnected ecosystems as networks composed of nodes and links [16,17]. This approach combines spatial attributes from various data sources, aiding in the understanding of species distribution and connectivity across different spatial locations [18,19]. Therefore, species research methods based on a network perspective provide us with a new perspective and tool to protect biodiversity and maintain habitats. Moreover, the study of MENs not only contributes to promoting ecological conservation cooperation across nations and regions, but also facilitates international exchange of species information and conservation techniques. This can advance collective efforts to address the global biodiversity crisis [20].
The construction of ENs follows a research paradigm that involves identifying ecological sources, constructing resistance surfaces, and extracting ecological corridors. Ecological sources serve as the foundation for EN construction, and their identification should be linked to target species, making species habitats a focal point in conservation research [21]. Previous research on constructing ENs has focused primarily on individual species or a few focal species [22]. However, this approach may limit communication among other species. To address this limitation, some studies have adopted a multi-species approach, constructing ENs based on multiple large mammals, birds, carnivores, or species populations with contrasting habitat requirements [23]. Additionally, virtual species have been used in EN modeling to represent species with different dispersal capacities or by creating virtual species groups based on ecological characteristics of real species crucial for connectivity [24,25]. However, constructing ENs based on multiple species may come with a lack of detailed information about specific species, which can impact the effectiveness of conservation strategies for those species [11,12]. Selecting multiple target species and establishing a framework based on multi-species connectivity remains a challenge in EN construction.
Resistance surfaces reflect the intensity of migration, propagule dispersal, and communication influenced by natural conditions and human activities [26]. The construction of resistance surfaces requires the quantification of natural and anthropogenic impediments to the ecology of plants and animals, such as land use/land cover (LULC) type, habitat quality, and the intensity of human activities. [27,28]. In studies involving urban areas or watersheds, resistance surfaces are adjusted by considering landscape heterogeneity, incorporating indicators such as nighttime lighting data [29] and impervious surface area. In species habitat EN, factors such as public roads, rivers, habitat quality, land use types, and terrain diversity should be taken into account when constructing resistance surfaces. Ecological corridors represent pathways that connect ecological sources. In MENs, ecological corridor facilitate species dispersal, gene exchange, and animal movements, and provide potential habitats for subpopulations [20]. When corridors connect multiple species, regional ecosystems can achieve a high level of connectivity and integration [30,31]. Ecological corridors play a crucial role in maintaining and enhancing biodiversity by promoting connectivity between fragmented habitats [32].
The southeastern part of the QTP (QTP) is a region highly sensitive to climate change and is recognized as a biodiversity hotspot in mountainous areas in southwest China [33]. However, human activities have led to habitat fragmentation, posing a threat to the region’s rich flora and fauna [34,35]. To address this issue, a study is being conducted in the southeastern QTP to construct a MEN and analyze the habitat connections among multiple populations and individual species. The study focuses on ten rare animal and plant species and simulates their potential habitat distributions within the research area. By constructing a MEN, the researchers aim to gain a network perspective on habitat connections. They will analyze different driving factors contributing to the decline in network stability and provide corresponding recommendations to address these issues. The goal is to offer a new perspective and tool to understand and analyze biodiversity and habitat fragmentation problems in the QTP region, ultimately promoting biodiversity conservation and habitat maintenance.
2. Study Area and Data Sources
2.1. Study Area
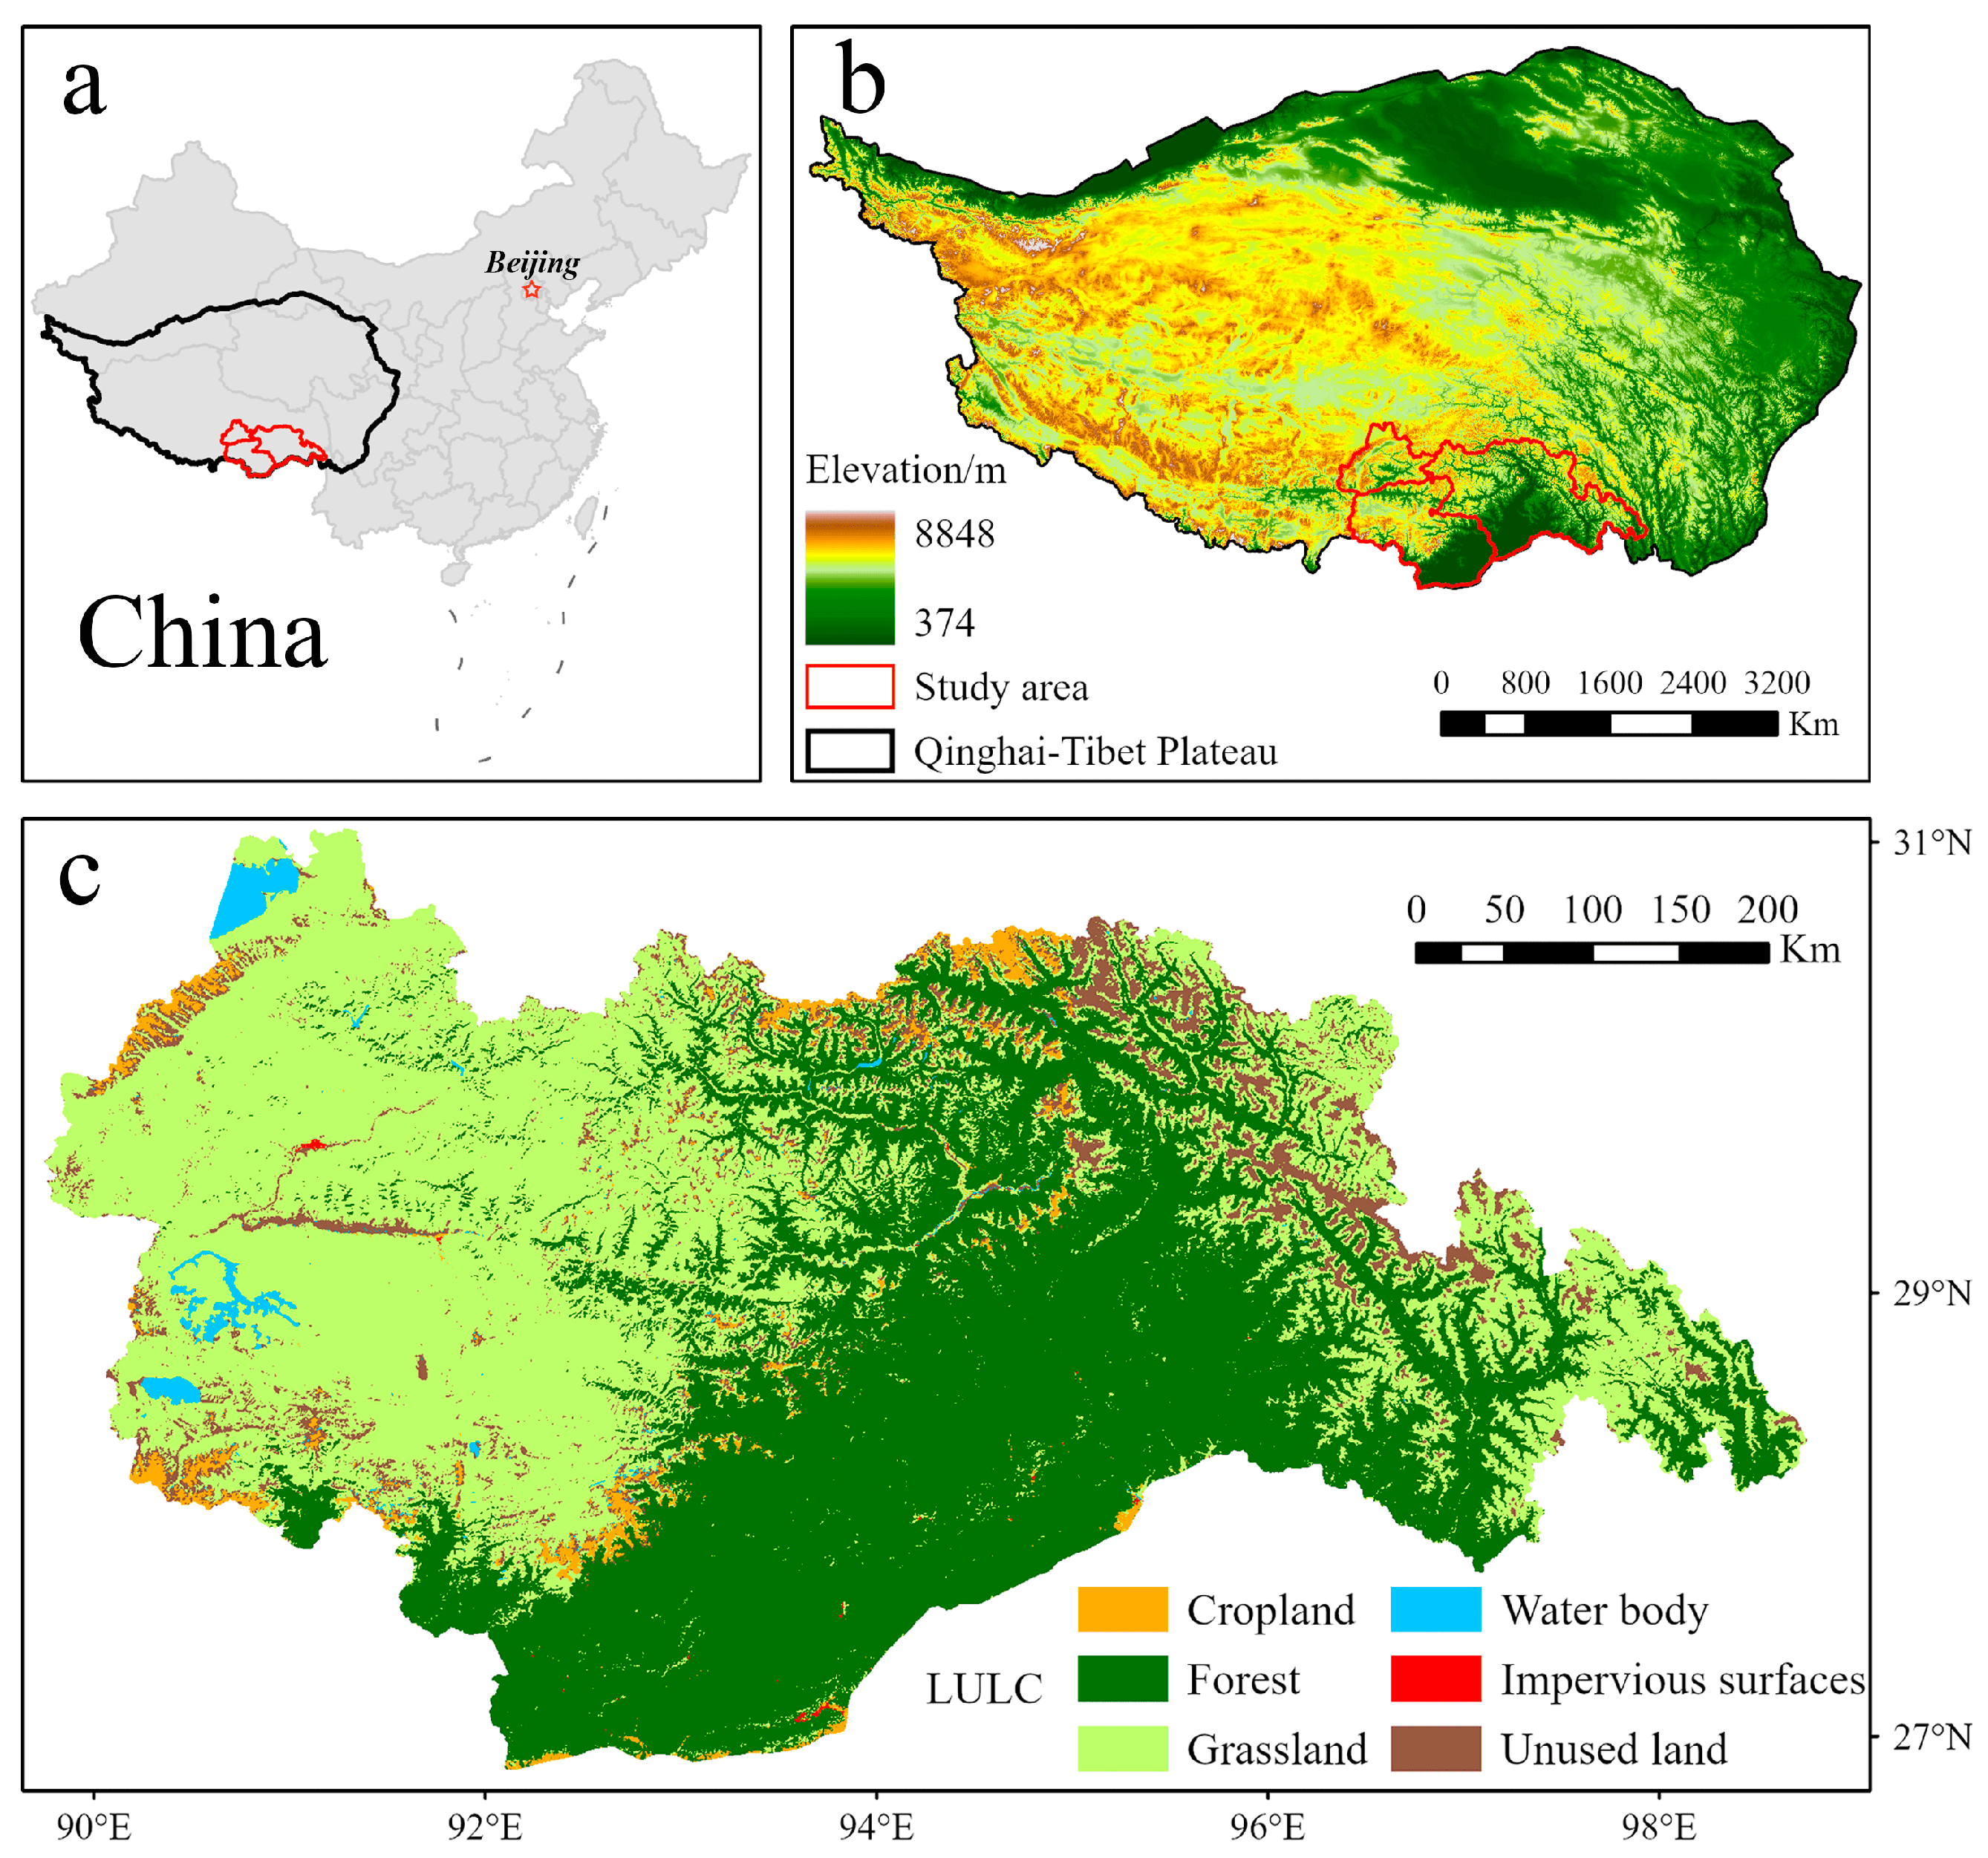
The research area is located in the southeast part of the QTP and includes the cities of Lhasa, Shannan, and Nyingchi in the Tibet Autonomous Region, with a total area of approximately 223,600 km2 (Figure 1). The region is characterized by a high altitude, averaging around 3500 m, and exhibits various climates, including alpine and subtropical monsoon climates [35]. The alpine climate dominates the high-altitude areas, characterized by cold and dry winters, cool summers, and relatively high precipitation. In contrast, the low-altitude areas experience a subtropical monsoon climate with hot and rainy summers and warm and dry winters [36]. The varied terrain and elevation of the region support a variety of ecosystems, including alpine meadows, forests, wetlands, and glaciers, resulting in a high level of biodiversity and endemism. However, human activities, particularly road construction, have led to habitat fragmentation in the region. By 2015, the average patch size of natural habitats, such as forests, shrubs, and grasslands, had decreased significantly due to road fragmentation. This highlights the need for in-depth research on climate change, landform evolution, and biodiversity in the southeastern QTP to understand and preserve unique plateau ecosystems.
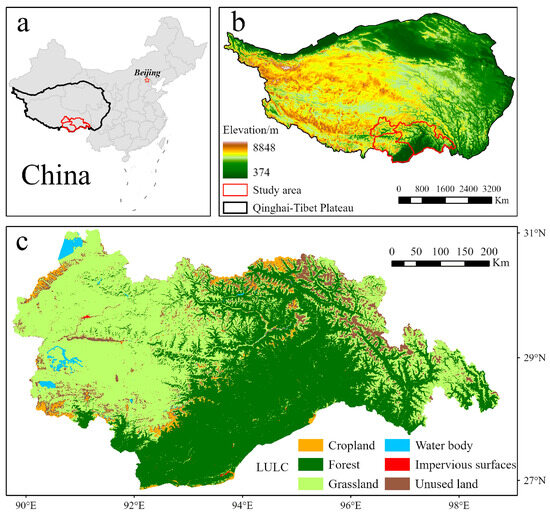
Figure 1.
(a) Location in China; (b) location and elevation of the study area; (c) LULC of the study area.
2.2. Data Sources
The data used in the article include geographical, socio-economic, and climatic data. All data are publicly available to ensure the scalability of the experiments and models. To ensure data availability, this study converted all data into a uniform projected coordinate system with a uniform raster size of 100 × 100 m. The data sources are shown in Table 1.

Table 1.
Data used in this study.
3. Material and Methods
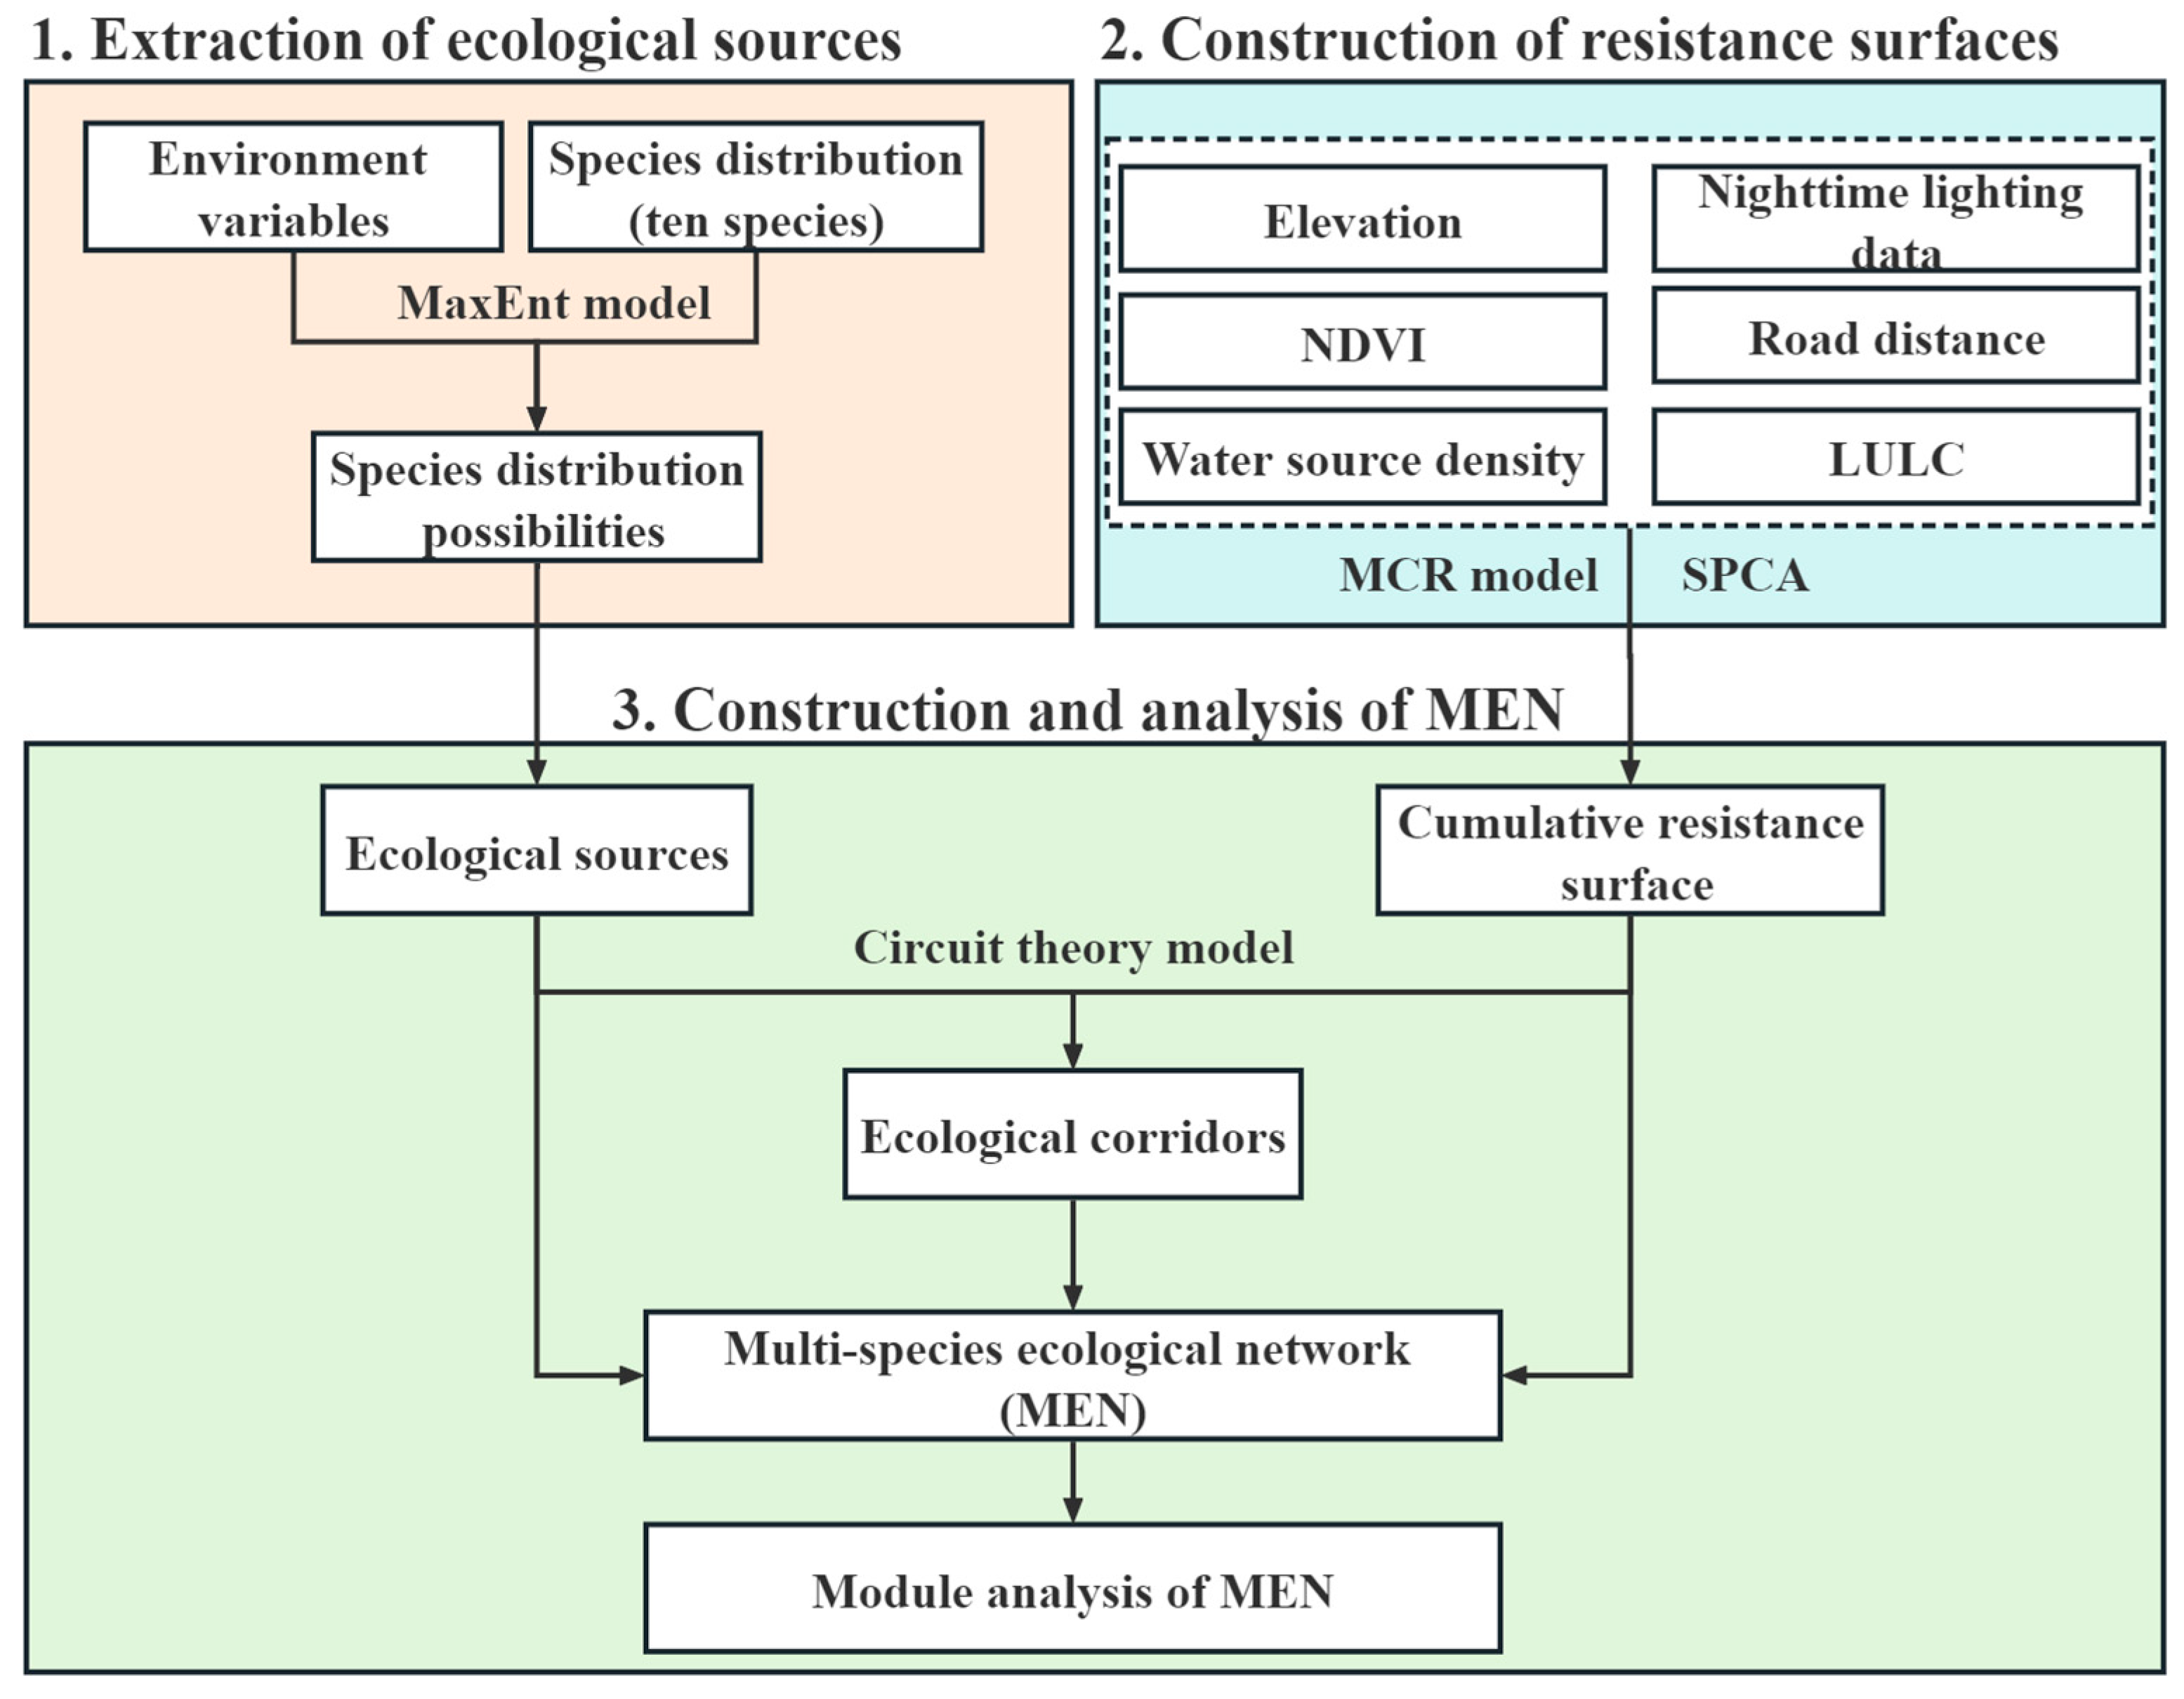
The methodological framework used in this study is delineated into three components, as illustrated in Figure 2. Firstly, the MaxEnt model was utilized to integrate species distribution data with environmental variables, thereby generating potential habitat distributions for the ten selected species. From these distributions, the areas characterized by the highest suitability were identified as ecological sources. The second component involved the integration of six resistance factors using the minimum cumulative resistance (MCR) model and spatial principal component analysis (SPCA). This amalgamation facilitated the construction of a cumulative resistance surface, which quantified the overall resistance levels throughout the study area. The third component entailed the extraction of ecological corridors within the study area using circuit theory. These corridors served as the pathways connecting the ecological sources identified earlier. The MEN was subsequently composed of the ecological sources, the resistance surfaces, and the ecological corridors. To analyze the MEN, the complex network analysis method was employed, enabling a comprehensive assessment of its structural properties and functional characteristics.
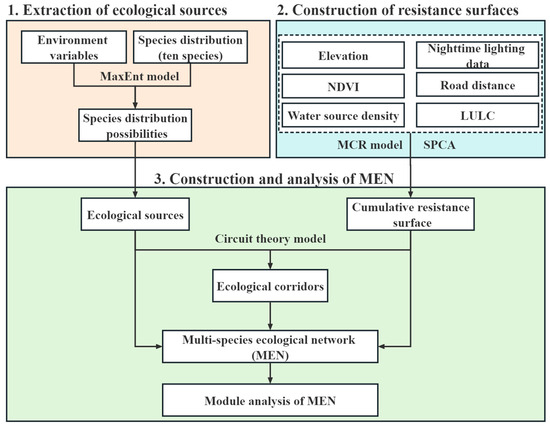
Figure 2.
Research framework.
3.1. Extraction of Ecological Sources
The MaxEnt model is a powerful machine learning tool utilized for selecting the ecological source of species [37,38]. This model is employed to predict the potential habitat distribution of species under varying environmental conditions. Based on the principle of maximum entropy, the MaxEnt model seeks to find a probability distribution that maximizes entropy (uncertainty) while adhering to a set of constraints [39]. These constraints are derived from statistical characteristics of known species distributions, such as expected values within the habitat. The MaxEnt model finds applications in ecology, biogeography, neural networks, medicine, and other fields. To apply the MaxEnt model, two types of input data are required: species distribution data and environmental variable data [40].
The data of environmental variables include bioclimatic factors specific to the study area, providing information on factors that potentially influence the adaptability of the species within the environment. In this study, 19 environmental variables were initially selected based on the relevant literature and the “Ecological Protection Law of the People’s Republic of China in the Qinghai-Tibet Plateau”. These variables underwent screening to eliminate those with a low contribution and high covariance, resulting in the retention of 8 environmental variables. Detailed information regarding these environmental variables can be found in Table S1.
Species distribution data consist of observed latitude and longitude coordinates of species locations. For this study, species distribution data were obtained from the Global Biodiversity Information Facility (www.gbif.org) (format: 26.5.2023). Ten species of wildlife were selected based on their distribution and conservation status in Tibet, sourced from the “IUCN Red List of Threatened Species” and the “National Key Protected Wildlife List.” These species include Larix himalaica, Anser indicus, Nucifraga caryocatactes, Rhododendron phaeochrysum, Rhodiola crenulata, Rheum nobile, Gentiana veitchiorum, Semnopithecus schistaceus, Saussurea laniceps, and Budorcas taxicolor. Figure 3 illustrates their spatial distribution.
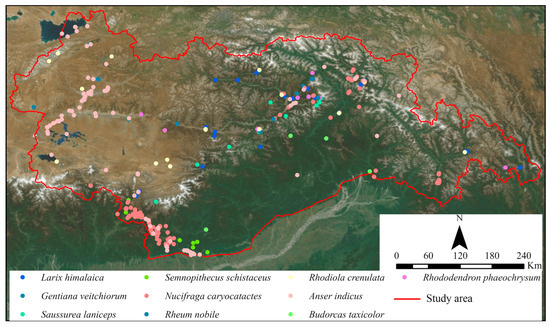
Figure 3.
Geographical distribution of species.
By integrating species distribution data and environmental variable data into the MaxEnt model, 75% of the species distribution points were randomly assigned as training data to develop the prediction model, while the remaining 25% served as test data to validate the model [41]. The predictive precision of model was evaluated using the area under the curve (AUC) of the receiver operating characteristic (ROC) curve, which ranges from 0 to 1. After fine-tuning the model parameters, the potential distribution of the species was determined, and the distribution probabilities were classified into 5 categories, with the highest category representing the ecological source.
3.2. Construction of Resistance Surfaces
Migration, propagule dispersal, and communication, are profoundly influenced by natural conditions, human activities, and other factors [42,43]. These processes tend to be concentrated within diverse land use types and terrains, where resistance surfaces effectively depict the overall impediments encountered by different locations across the landscape. The resistance values quantitatively reflect the intensity of hindrances encountered in spatial connectivity and communication, where higher values indicate greater obstacles [44].
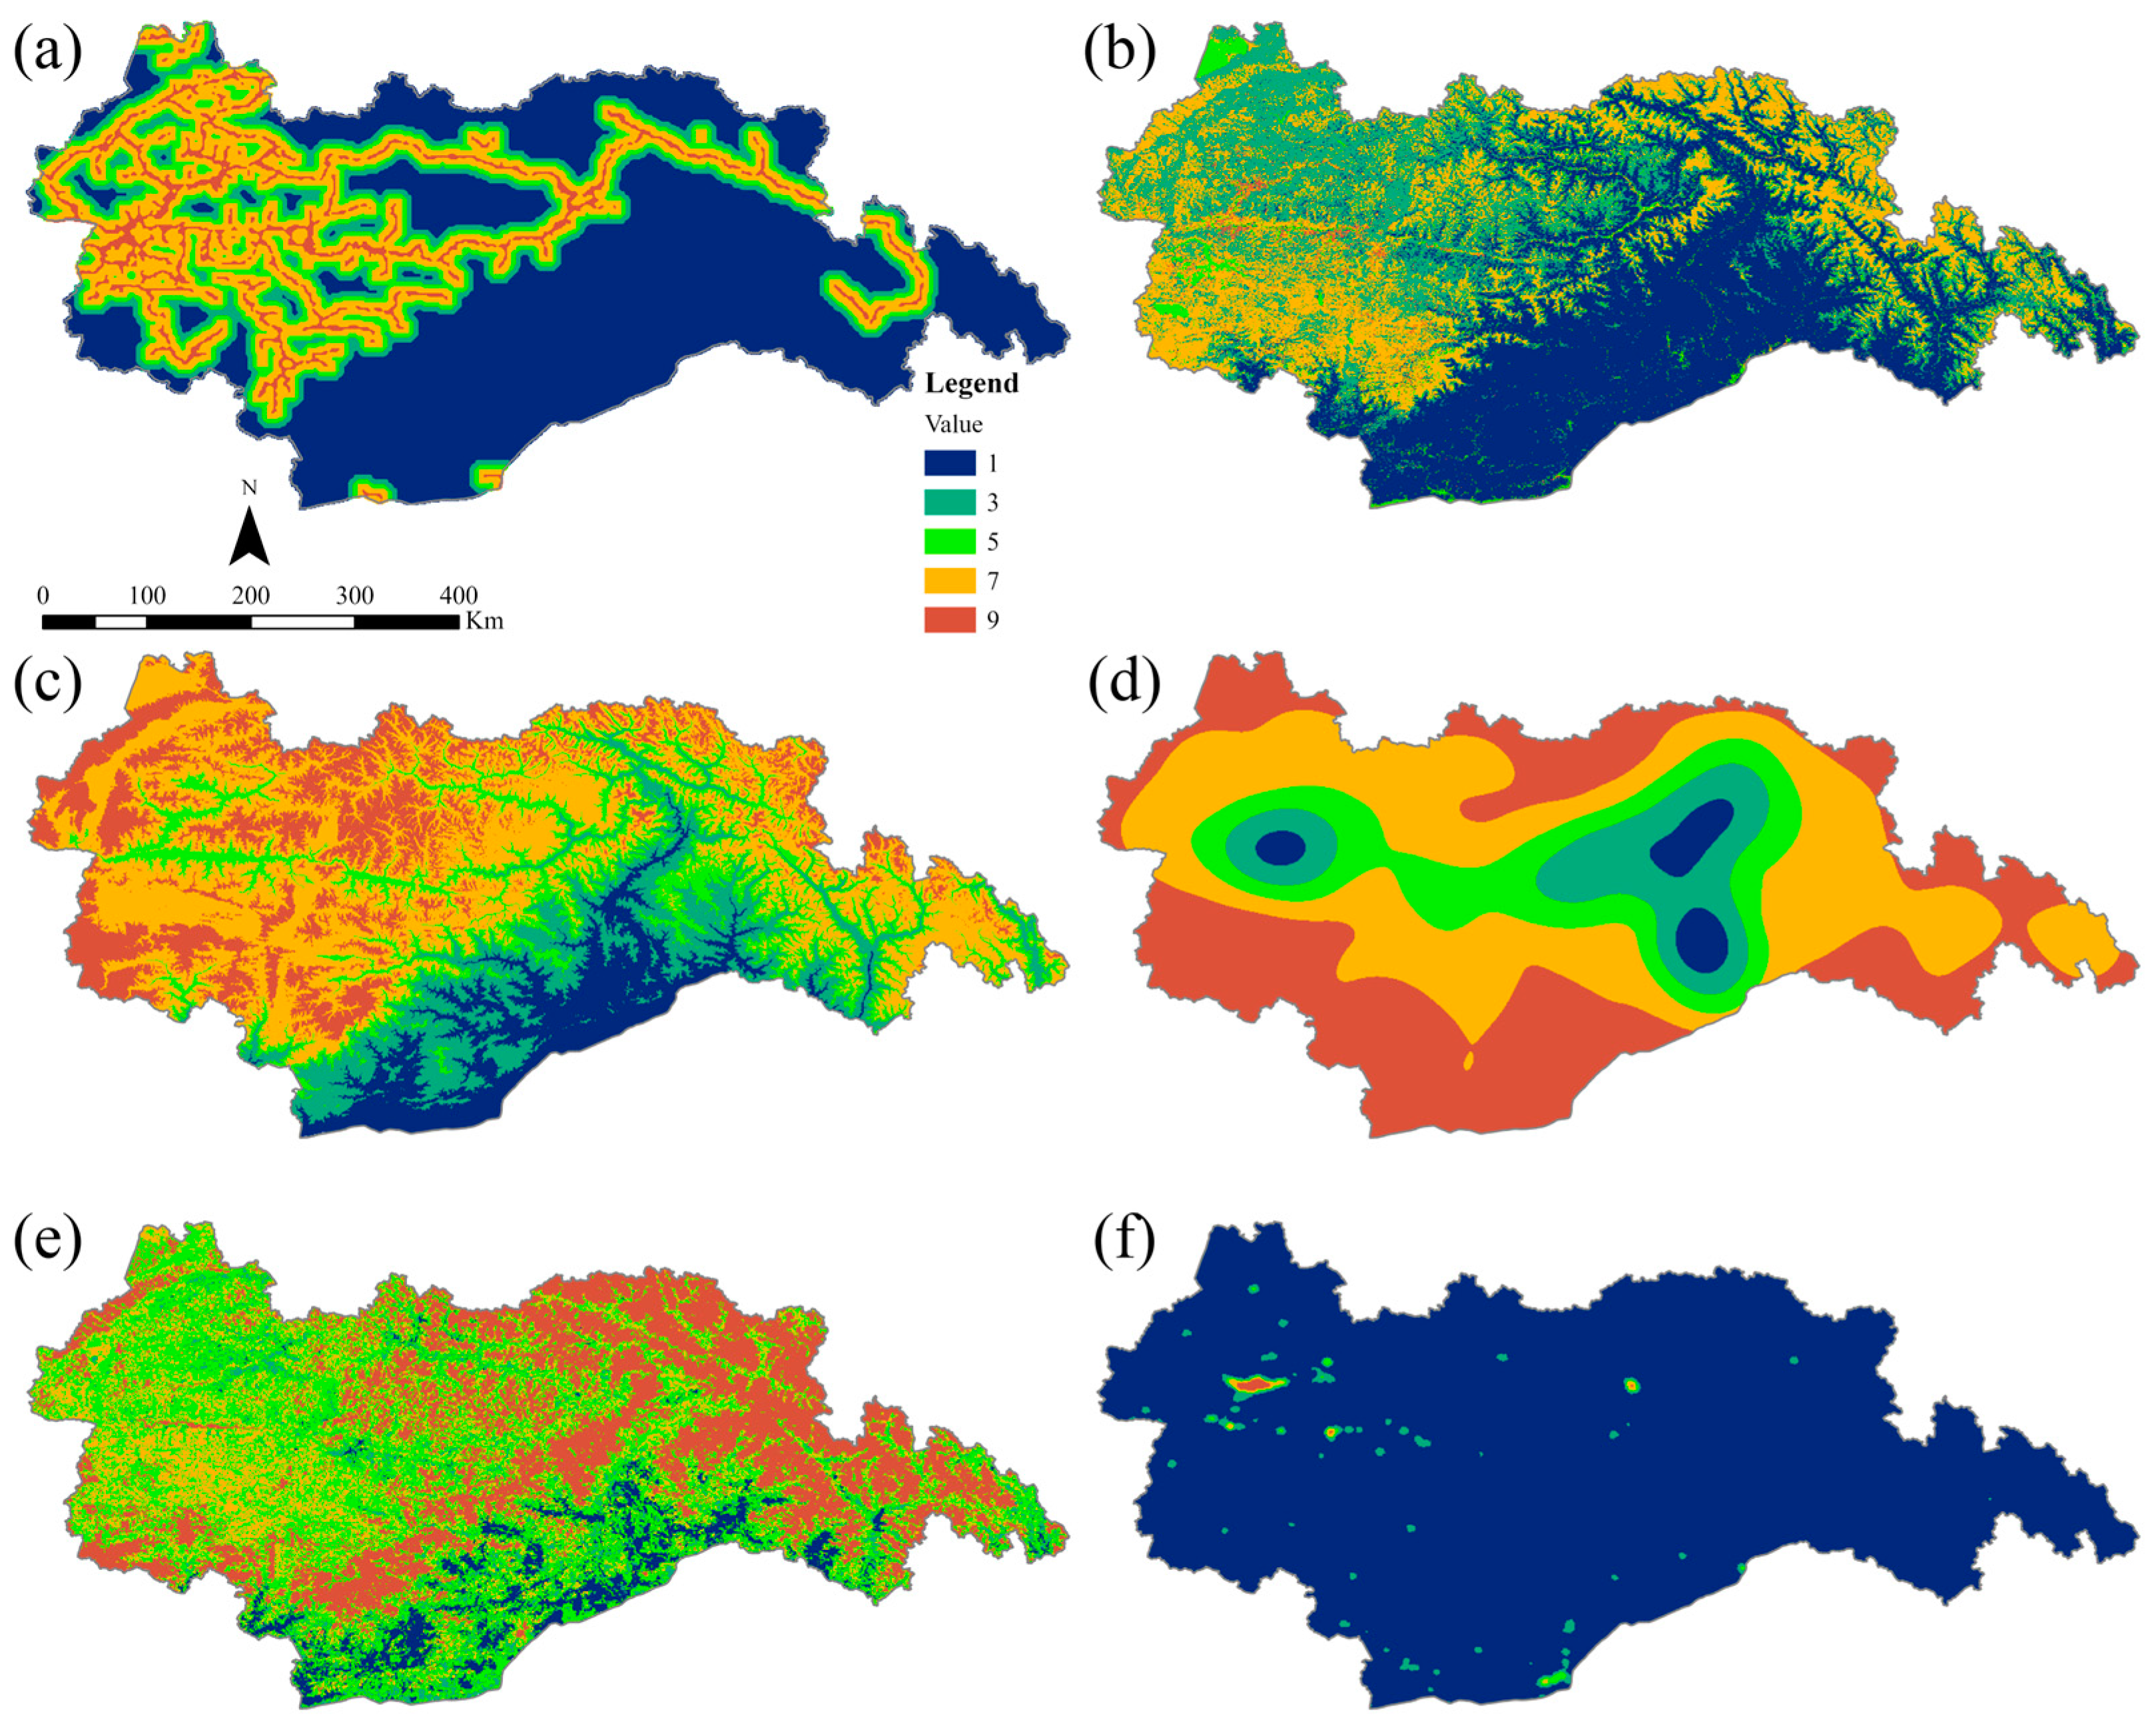
Given the significant impacts of terrain, food availability, water sources, and human activities on inter- and intra-species communication processes, we selected six resistance factors: LULC, NDVI, road distance, elevation, nighttime lighting, and water source density. To establish meaningful comparisons, the resistance values for each factor were thoughtfully reclassified into five distinct levels based on the previous scientific literature (Table 2). These levels have been assigned ascending values of 1, 3, 5, 7, and 9, reflecting increasing degrees of resistance [28,42] (Figure 4).
Table 2.
Grading and weight of the resistance factor.

Figure 4.
Hierarchical division of resistance factors. (a) Road distance; (b) LULC; (c) elevation; (d) water source density; (e) NDVI; (f) night-time lighting.
To effectively visualize the intricate three-dimensional data within a two-dimensional framework, we employed SPCA [45] to reduce the dimensionality of the resistance factors. Through this analysis, we obtained spatial loadings for each principal component and calculated the cumulative contribution rate associated with each component. These calculations were employed to determine the weights assigned to each evaluation factor. Subsequently, we employed the MCR model [45], utilizing the minimum cumulative resistance equation, to amalgamate the weighted combination of the six resistance factors.
The subsequent steps outline the process for conducting SPCA analysis (Equation (1)) and the subsequent calculation of the MCR model (Equation (2)):
where E is the ecological safety index; is the principal component corresponding to the grid; and is the eigenvalue contribution rate of the principal component.
where is the minimum cumulative resistance value (the minimum cumulative resistance from the ecological sources to a point in the region); is a positive correlation function between the minimum cumulative resistance and ecological process; is the spatial distance from the ecological sources, , to a certain landscape unit, ; is the resistance coefficient of a landscape unit, , in the region to the motion process.
3.3. Extraction of Ecological Corridors
An ecological corridor refers to a linear land strip that connects adjacent ecological sources, serving as a pathway from a “source” area to a “sink” area. The circuit theory, initially proposed by [46] in the context of genetic predictions, has been further developed to model migration and dispersal processes of biological populations [47,48]. This theory draws an analogy between complex landscapes and circuits, simulating animal movement, information transfer, and gene flow by modeling the random walk of electrons in a circuit. This approach provides a more realistic representation of species movement compared to that provided by traditional distance isolation models and least-cost path models, as most species migrations or habitat expansions do not follow predetermined paths [49].
In the circuit theory model, cumulative resistance surfaces are represented as conductive surfaces, where low resistance facilitates the easier movement of electrons (representing species), while high resistance impedes their movement. Ecological corridors are simulated by modeling the flow of current between ecological sources. The magnitude of current reflects the probability of species movement through the corridors, indicating the significance of corridors in ENs and the stability of different corridor segments. A high current implies a high probability of species movement and a path that is challenging to substitute, while a low current indicates a lower probability of movement and inadequate stability [48]. The current of ecological corridors is calculated using the Linkage Mapper toolbox in ArcGIS software 2.8.6 (US). A schematic diagram of the circuit theory can be found in Figure S1.
3.4. Analysis of MEN
In order to gain a comprehensive understanding of intra- and inter-species relationships in the MEN, we applied complex network analysis methods [44]. Ecological sources are represented as nodes, and ecological corridors are represented as edges in an complex undirected and unweighted network, which represents the structure of MEN [50]. Analyzing the modular characteristics of ENs from a complex network perspective allows us to uncover features that traditional methods fail to capture, thereby shedding light on the formation and evolution of ENs [27]. Network modules refer to groups of nodes with similar characteristics and strong interconnections. The presence of a modular structure is considered crucial for habitat network connectivity, as it can limit the spread of disturbances, as demonstrated in experiments [51]. When habitat loss and disturbances occur due to human activities, incorporating modularity with connectivity becomes essential for conservation planning and landscape change analysis. However, it is crucial to establish a theoretical foundation and model assumptions for modularity and connectivity analysis before integrating them into conservation planning and decision-making processes.
In this study, we analyzed the network module with the entire network and each species in the network. Furthermore, we explored inter- and intra-species interactions among multiple species and within individual species, ultimately providing suggestions for improvement. These analyses were performed using the igraph package in the R programming language in Windows 10 (64-bit).
4. Results
4.1. Resistance Surfaces
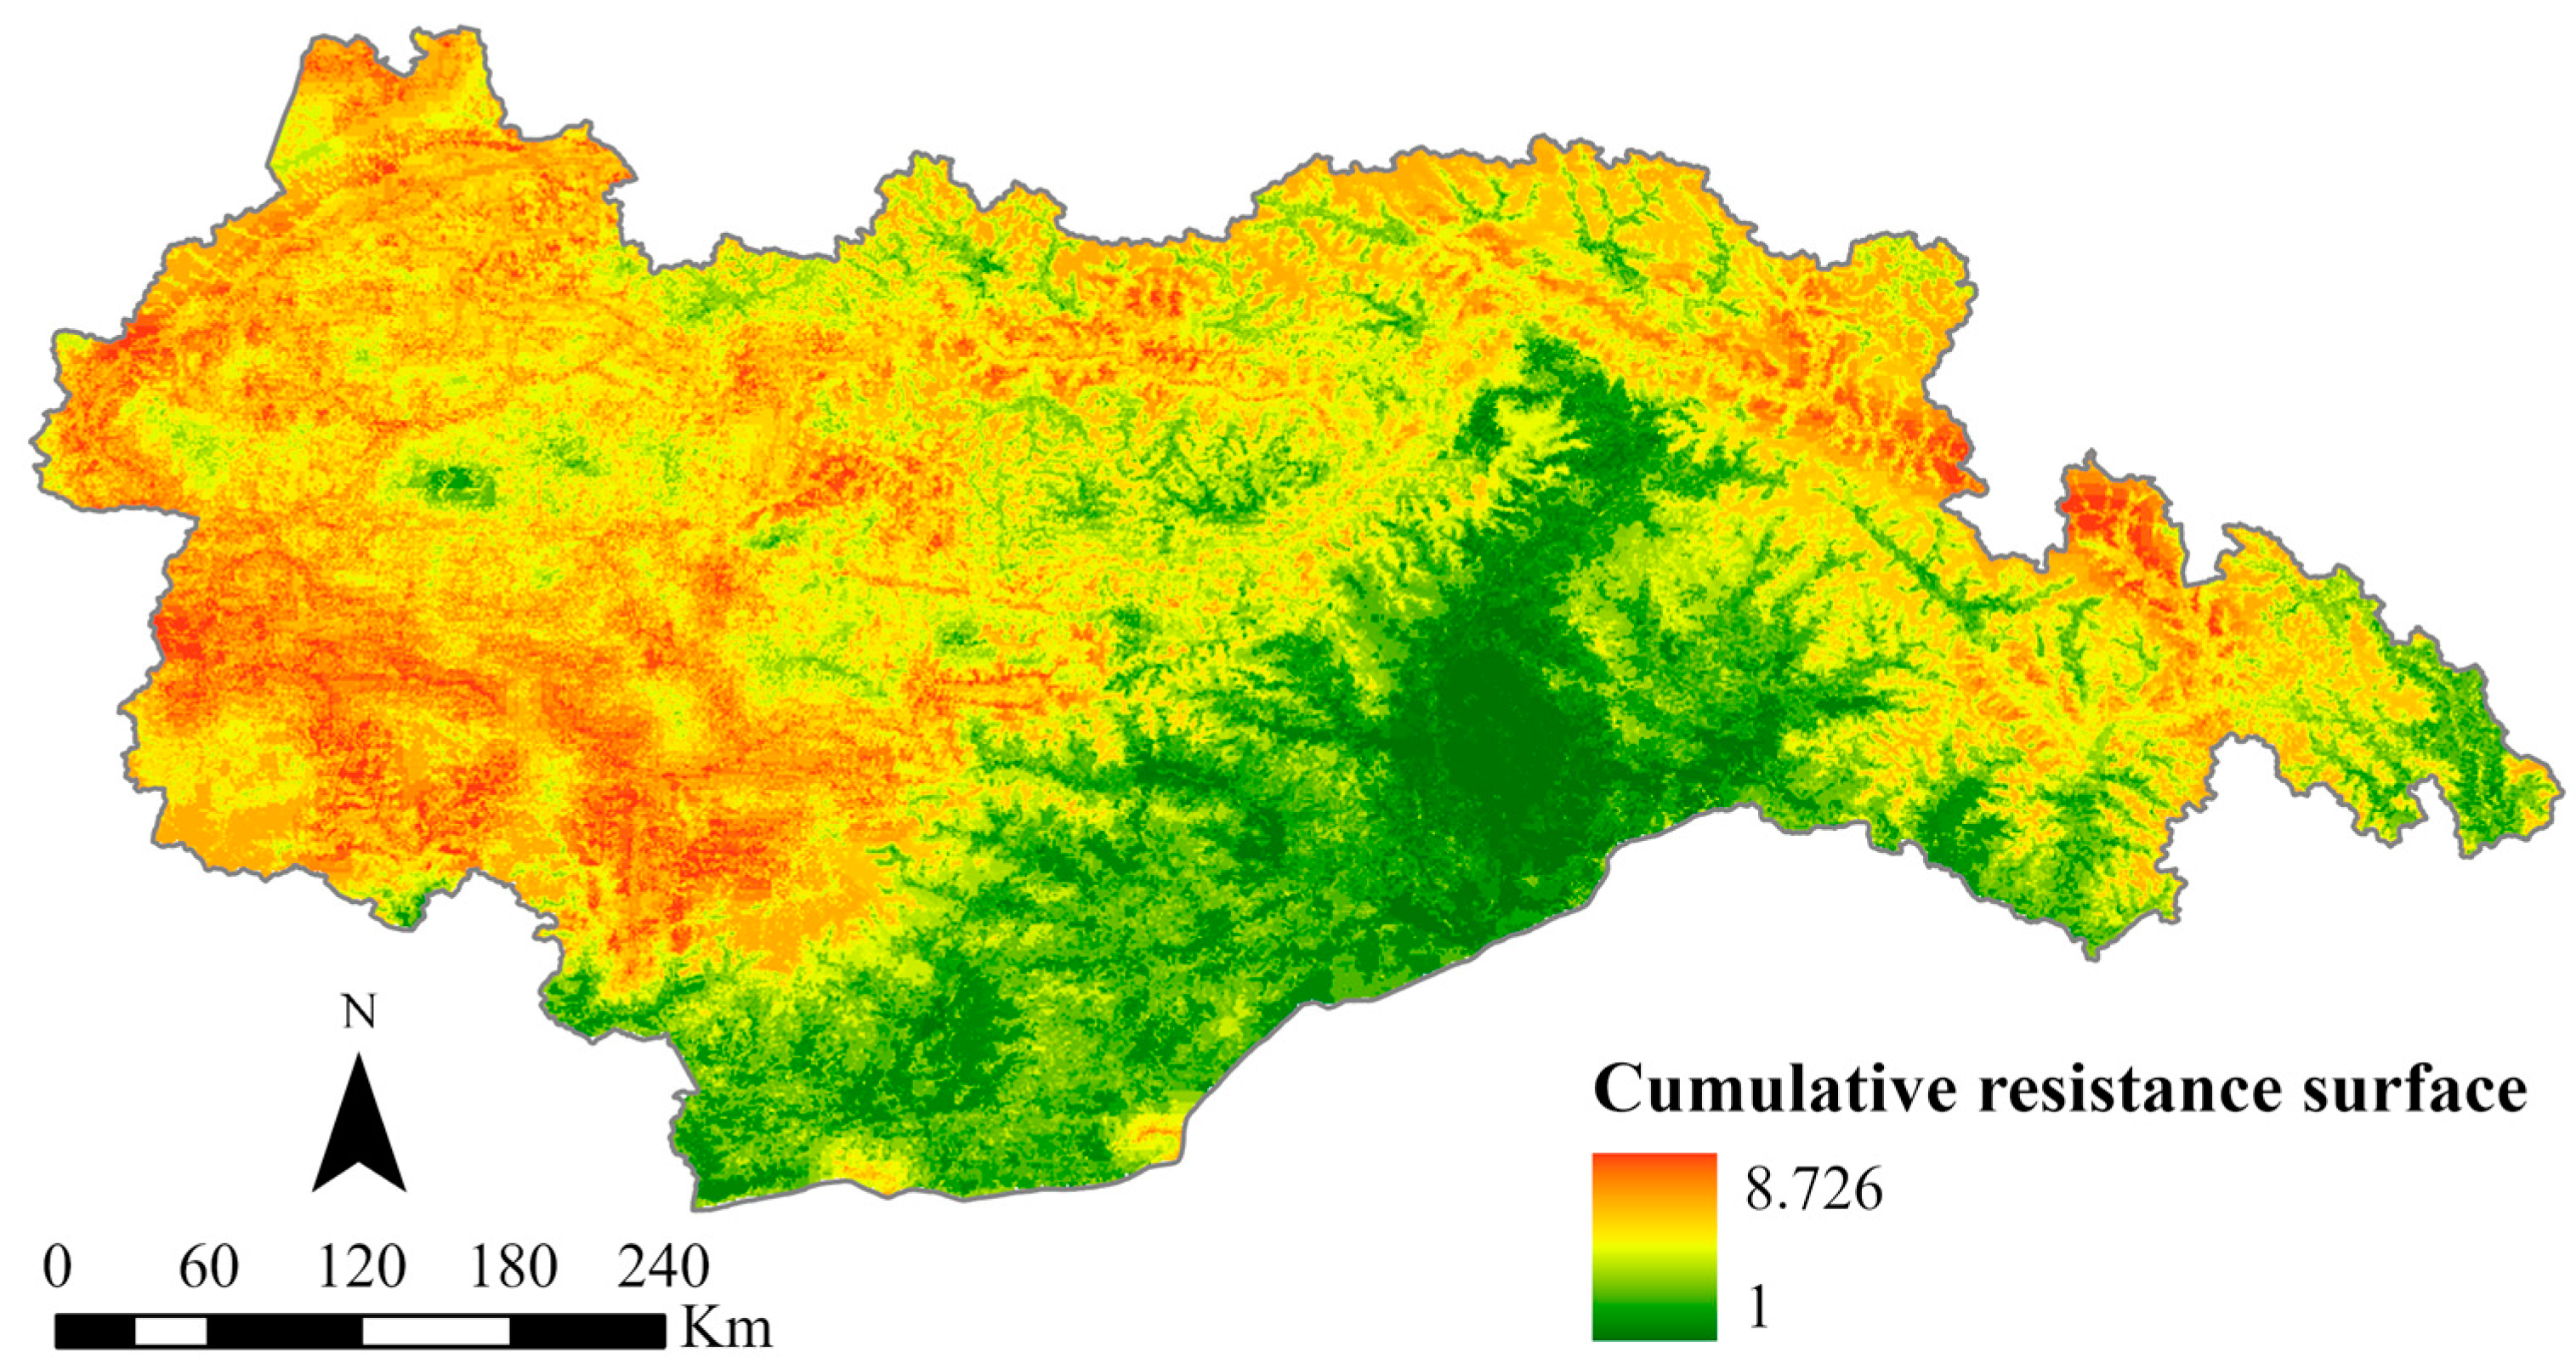
Using the MCR model, we obtained the spatial pattern of the cumulative resistance surfaces within the study area (Figure 5). The results of SPCA calculations are shown in Tables S2 and S3. The resistance values demonstrate a discernible distribution pattern, with higher values observed in the western and northeastern regions, while lower values are found in the southern part. The range of resistance values ranges from 1 to 8.726. Geographically analyzing the study area reveals that the western region is characterized by dense mountains and intersecting valleys, resulting in substantial impediments due to elevated terrain and steep slopes. Moreover, the presence of major urban centers such as Lhasa and Shannan, characterized by dense human populations and intricate road networks, further imposes significant barriers to the movement of wildlife. The northeast part of the study area is predominantly characterized by snow-capped mountains, rendering it inhospitable for organisms to inhabit due to the perpetual presence of ice and snow. Consequently, this geographical attribute contributes to notably high resistance values. Conversely, the southern part of the study area showcases extensive forest coverage and lower elevations, establishing it as one of the Qinghai–Tibet Plateau regions with the highest biodiversity. This area provides abundant food and optimal habitats for wildlife, resulting in comparatively lower overall resistance values.
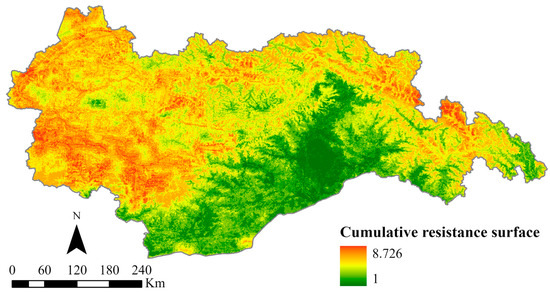
Figure 5.
Cumulative resistance surface.
In summary, substantial spatial disparities exist in the distribution of ecological resistance values throughout the study area. Areas characterized by higher resistance values experience ongoing challenges to wildlife connectivity and population stability, which ultimately leads to habitat loss and fragmentation. On the contrary, regions with lower resistance values offer enhanced ecological quality, rendering them favorable options for migratory populations. To address the spatial pattern of resistance values within the study area, it is imperative to consider the local natural context in conjunction with resistance levels. Mitigating ecological barriers in high-resistance areas and prioritizing the preservation of transitional zones between areas of high and low resistance are crucial steps toward preventing the expansion of high-resistance regions.
4.2. Spatial Pattern of MEN
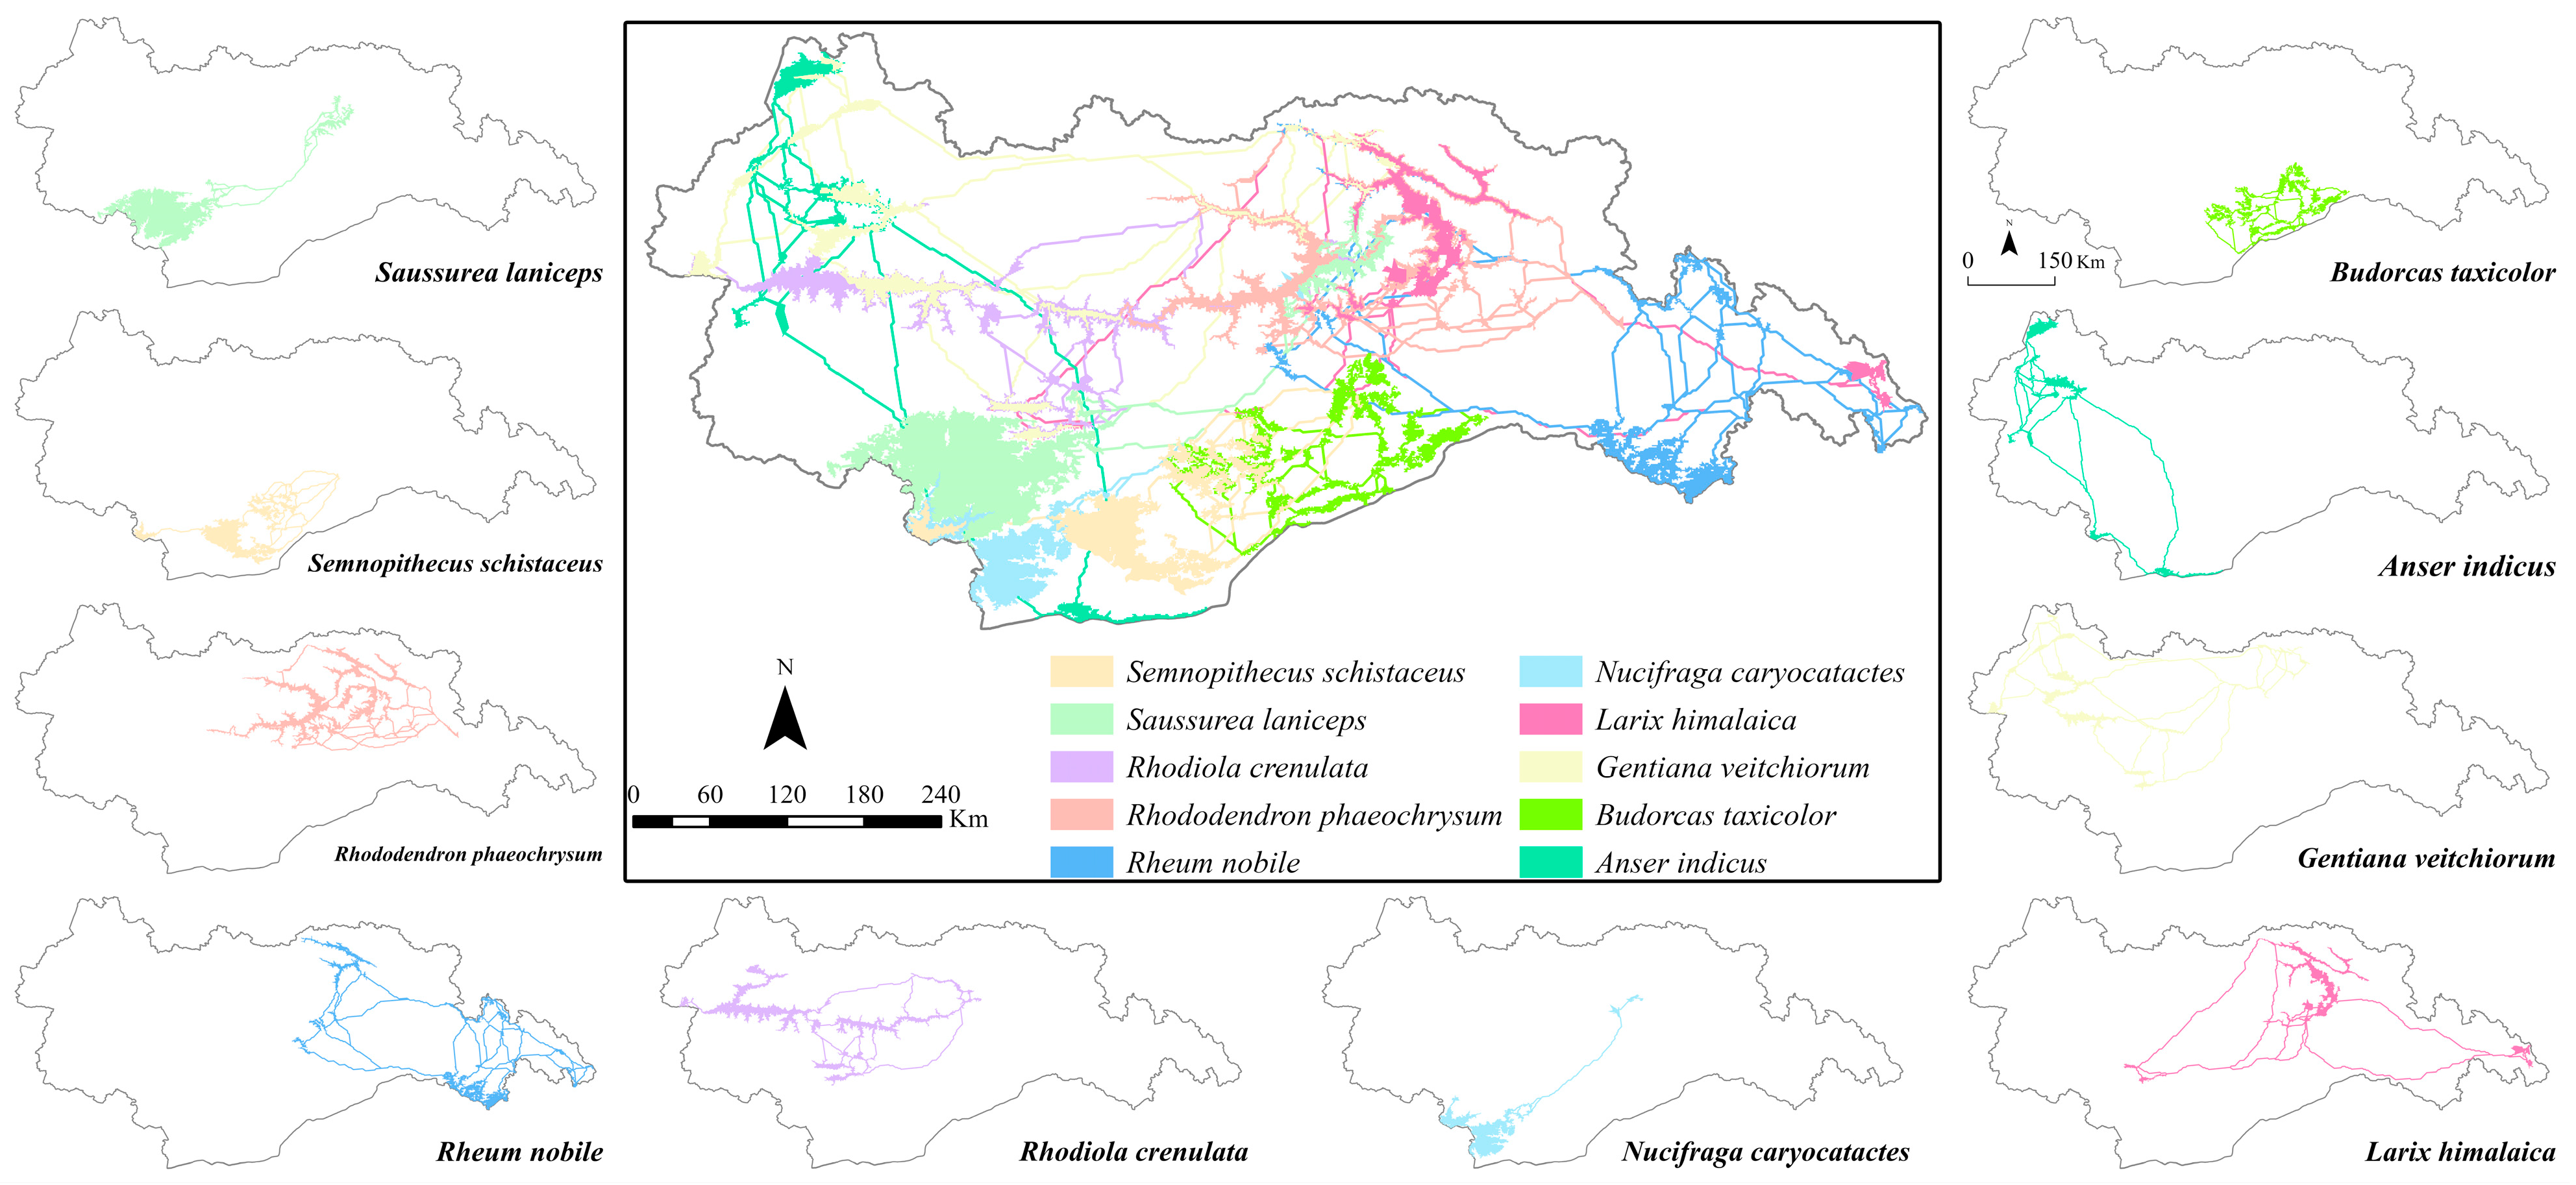
Through the application of circuit theory modeling for multi-species ecological corridors, we have generated the spatial pattern of the MEN within the study area (Figure 6). The distribution of ecological sources in the study area reveals concentrated and extensive areas in the central and southern regions, while the western and eastern parts exhibit fragmented and sparse patterns. The MEN, as a whole, demonstrates three prominent dense areas spanning from east to west. The central region exhibits relatively favorable connectivity within the MEN, whereas the ecological corridors connecting the central region with the western and eastern regions are limited in number and excessively long. Consequently, these prolonged corridors can impede species connectivity, while the scarcity of corridors results in a lack of alternative pathways for species exchange. The occurrence of blockages in specific pathways can lead to species isolation and potentially worsen reproductive isolation. In contrast, the southern part of the study area showcases relatively robust connectivity among ecological sources and corridors, facilitating convenient intra- and inter-species communication.
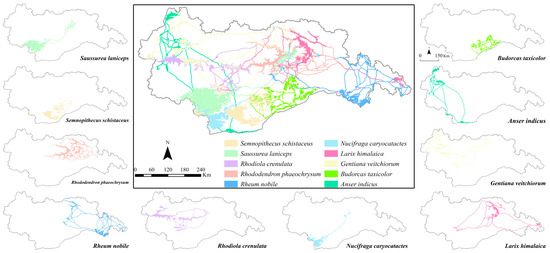
Figure 6.
Spatial pattern of MEN (ecological corridor color is the same as ecological source color; see Figure S3 for details).
In summary, the MEN connectivity within the central part of the study area is strong. However, the network’s connectivity between the central region and the eastern and western regions is deficient, presenting challenges for peripheral species in terms of habitat loss and hindered species exchange. To address these internal shortcomings of the MEN in the study area, it is crucial to develop appropriate ecological conservation plans that prioritize the preservation of species habitats, thereby ensuring continuous connectivity within the network.
4.3. Network Analysis of MEN
The complex network analysis of the MEN for individual species and the overall network is shown in Figure 7. The figure on the left illustrates the distribution of network modules in the study area, which is divided into five modules. Module 3, consisting of Budorcas taxicolor and Semnopithecus schistaceus, exhibits a relatively small number of network nodes, making it easier to form modules with fewer nodes. This results in looser connections between different modules. Other modules demonstrate closer connections to the overall network, indicating more intricate network relationships. Complex modules that include numerous ecological sources are more likely to form, leading to stronger connectivity between communities.
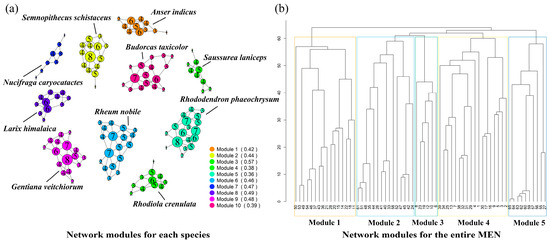
Figure 7.
Surface of cumulative resistance. (a) Network modules for each species; (b) network modules for the entire MEN.
The figure on the right displays the single-species network modules for ten species, with the numbers representing the degree values of the network nodes. Degree values serve as indicators of the importance of network nodes. Module 7, represented by Nucifraga caryocatactes, exhibits relatively low node importance and requires the addition of stepping stone patches to connect multiple nodes together. Moreover, appropriate restoration strategies should be developed based on the natural background of the study area to mitigate ecological barriers. Modules 2 (Semnopithecus schistaceus), 5 (Rhododendron phaeochrysum), 6 (Rheum nobile), 9 (Gentiana veitchiorum), and 10 (Budorcas taxicolor) demonstrate a high importance of nodes and require targeted protection to prevent habitat degradation from compromising node stability. The clustering coefficient reflects the overall stability of the network, and modules 4 (Rhodiola crenulata), 5 (Rhododendron phaeochrysum), and 10 (Budorcas taxicolor) exhibit an average clustering coefficient lower than 0.4, which is below the average level of that of the ten modules.
Overall, the complex network analysis of both individual species and the overall network provides insights into the spatial attributes of intra-species and inter-species relationships. From the perspective of the overall network, the MEN in the study area is divided into five modules, with certain areas prone to forming modules with fewer nodes, resulting in looser connections between modules. When examining the single-species modules, there are instances of low ecological source importance and inadequate stability.
5. Discussion
5.1. Discussion of the MEN Build
Regarding the selection of ten species, the QTP is known for its unique biodiversity and ecosystems due to its biogeographic location and harsh environmental conditions. The southeastern region of the QTP is closely associated with rivers, and most species in the area inhabit both sides of these rivers. To reflect the threats to regional populations and focus on endangered and protected species, we selected six plant species and four animal species (including two bird species) that are listed as endangered or protected worldwide and in China. These species have a certain degree of similarity in their distribution points, resulting in an overlap in the extracted ecological sources. Approximately 13% of the total ecological source area (around 6246.5 km2) is shared by all selected species. Shared habitats among multiple species have greater conservation value and attract more attention and protection [11]. Additionally, considering the different habitats occupied by various species in the ecological vertical space, the associations among species may be stronger than numerical values suggest. For example, birds inhabit the forest canopy, while terrestrial animals live on the ground or below the canopy. Ecological sources serve as a foundation for studying biological relationships. Although the ecological sources used for constructing the multi-species EN may differ from the actual habitats of plants and animals, this small multi-species network can connect multiple species to the entire regional EN.
Regarding ecological corridors, animal corridors are relatively easier to understand because animals have mobility, and corridors can be seen as the actual paths of animal movement [23]. However, plant corridors are more abstract since plants have limited mobility. In landscape ecology, numerous studies have focused on building connections among plants from the perspective of landscape connectivity [24]. Landscape connectivity allows for the movement of plant species, resource utilization, migration to new habitats, and the maintenance of genetic flow through pollen and seed dispersal [52]. The lack of landscape connectivity can hinder these processes and threaten the conservation of plant populations. Plant landscape connectivity involves not only diffusion from source areas but also successful establishment and development in recipient areas, requiring well-connected pathways to function effectively [47]. Conversely, well-connected pathways receive more dispersers and provide more propagules. The ecological corridor length for all species in our study is 14,136.4 km, with an average length of 54.4 km. Terrestrial animal corridor distances are relatively short, while bird corridor lengths are often much larger due to migration [7,53]. Mutual influences exist between plant and animal corridors, such as plant reproductive processes relying on pollen dissemination and propagule dispersal by animals, and animals selecting habitats and food sources based on plant distribution [54]. Therefore, studying the coexistence networks of animals and plants is valuable and can explore associations and mutual influences among species.
Resistance surfaces simulate the ecological processes of spatial species movements and the flow and transfer of ecological functions among different landscape types. They are primarily influenced by landscape types and natural and anthropogenic disturbances [28]. In our study, the construction of resistance surfaces is not solely focused on the ecological resistance of individual species. Instead, we constructed comprehensive ecological resistance surfaces based on the connectivity of ecological sources and the stability of ecological functional processes [55]. Considering the impacts of global change, the location and size of resistance surfaces may change, affecting the structure and functioning of ENs. In many studies, ecological resistance surfaces are constructed based on a unified valuation of different landscape types, which lead to the differences in ecological resistance coefficients caused by natural and anthropogenic disturbances within the same type of land cover to be overlooked and the heterogeneity and connectivity levels of patches to be neglected [56]. There is no universally recognized standard for ecological resistance research, both domestically and internationally [16,24]. In our study, we quantified the impacts of natural and anthropogenic disturbances and patch connectivity on ecological resistance surfaces from the perspectives of population suitability and habitat connectivity obstacles, which aligns more closely with the actual state of ecological processes.
5.2. Study Limitations and Further Work
This study used a diversified selection of ten species encompassing a broad taxonomic spectrum, taking advantage of the distinctive geographical and climatic characteristics of the QTP to capture the region’s abundant species richness. Future endeavors in the construction of MENs may involve incorporating additional species. However, it is important to acknowledge that an increased species count also escalates the workload and computational complexities. Consequently, a further refinement of the model is imperative to enhance the efficiency and accuracy of MEN construction. The construction of resistance surfaces, which encapsulate the ecological barriers encountered by mammals, birds, and plants in a multi-species context, reveals the existence of divergent impediments across taxa. Consequently, future investigations may consider developing tailored resistance surfaces for individual species, thus enabling a more precise and objective representation of the ecological barriers experienced within MEN. Moreover, conducting comprehensive network analyses, akin to those conducted for capillary networks, for individual species assumes significance in elucidating interspecies relationships. Furthermore, fostering collaboration between China and neighboring countries to establish and administer multinational initiatives for ecological conservation and development is a prudent strategy. Future research endeavors will delve into optimizing the construction and management of ENs to enhance biodiversity protection. Additionally, exploring the utilization of ENs in predicting the future impacts of climate change and land use transformations on biodiversity represents a promising avenue of inquiry. These studies aim to provide better scientific evidence for the conservation and management of biodiversity.
6. Conclusions
In conclusion, this study selected numerous animal and plant species to assemble an ecological spatial network, thereby gleaning insights into the relationships between species and the ecological barriers encountered. Our research offers a fresh perspective for comprehending and safeguarding the biodiversity within the southeastern QTP, thereby advancing the theory and practice of global biodiversity conservation. The principal findings of this study can be summarized as follows.
- The spatial distribution of ecological resistance values within the study area exhibits marked disparities, with resistance values ranging from 1 to 8.726. Generally, higher resistance values are observed in the western and northeastern regions, while lower values are prevalent in the southern part.
- The connectivity of the MEN within the central portion of the study area demonstrates robustness. However, the connectivity between the central region and the eastern/western areas is relatively weak, leading to habitat loss and impeding species movement at the periphery.
- The module analysis reveals that the MEN within the study area can be categorized into five modules. Regions inhabited by Budorcas taxicolor and Semnopithecus schistaceus exhibit a tendency to form modules with fewer nodes, resulting in looser connectivity. When assessing individual species modules, modules 5 (Rhododendron phaeochrysum) and 10 (Budorcas taxicolor) indicate lower ecological significance and inadequate stability.
Supplementary Materials
The following supporting information can be downloaded at https://www.mdpi.com/article/10.3390/f14112149/s1, Figure S1: Circuit theory diagram; Figure S2: Environmental variable correlation; Figure S3: Ecological networks for each species; Table S1: Environment variable; Table S2: Characteristic values of principal components and their contribution rates; Table S3: Principal component load matrix.
Author Contributions
Methodology, C.L., J.Z. and X.J.; software, C.L. and J.Z.; validation, C.L. and J.Z.; formal analysis, C.L.; resources, J.Z. and J.L.; data curation, K.S. and C.L.; writing—original draft, C.L.; writing—review & editing, K.S., C.L., X.J. and Y.Y.; supervision, K.S.; project administration, J.Z. and J.L.; Funding acquisition, J.Z. and K.S. All authors have read and agreed to the published version of the manuscript.
Funding
This research was supported by the Open Research Fund from the Key Laboratory of Forest Ecology in Tibet Plateau (Tibet Agricultural & Animal Husbandry University), Ministry of Education, China [Grant: XZA-JYBSYS-2023-09].
Data Availability Statement
The authors are unable or have chosen not to specify which data has been used.
Conflicts of Interest
The authors declare that they have no known competing financial interests or personal relationships that could have appeared to influence the work reported in this paper.
References
- Heller, N.E.; Zavaleta, E.S. Biodiversity management in the face of climate change: A review of 22 years of recommendations. Biol. Conserv. 2009, 142, 14–32. [Google Scholar] [CrossRef]
- Pascual, U.; Adams, W.M.; Díaz, S.; Lele, S.; Mace, G.M.; Turnhout, E. Biodiversity and the challenge of pluralism. Nat. Sustain. 2021, 4, 567–572. [Google Scholar] [CrossRef]
- Mi, X.; Feng, G.; Hu, Y.; Zhang, J.; Chen, L.; Corlett, R.T.; Hughes, A.C.; Pimm, S.; Schmid, B.; Shi, S.; et al. The global significance of biodiversity science in China: An overview. Natl. Sci. Rev. 2021, 8, nwab032. [Google Scholar] [CrossRef] [PubMed]
- Fahrig, L. Effects of Habitat Fragmentation on Biodiversity. Annu. Rev. Ecol. Evol. Syst. 2003, 34, 487–515. [Google Scholar] [CrossRef]
- Kiesecker, J.M.; Blaustein, A.R.; Belden, L.K. Complex causes of amphibian population declines. Nature 2001, 410, 681–684. [Google Scholar] [CrossRef]
- Crooks, K.R.; Burdett, C.L.; Theobald, D.M.; King, S.R.B.; Di Marco, M.; Rondinini, C.; Boitani, L. Quantification of habitat fragmentation reveals extinction risk in terrestrial mammals. Proc. Natl. Acad. Sci. USA 2017, 114, 7635–7640. [Google Scholar] [CrossRef]
- Taylor, C.M.; Stutchbury, B.J.M. Effects of breeding versus winter habitat loss and fragmentation on the population dynamics of a migratory songbird. Ecol. Appl. 2016, 26, 424–437. [Google Scholar] [CrossRef]
- Folke, C.; Österblom, H.; Jouffray, J.-B.; Lambin, E.F.; Adger, W.N.; Scheffer, M.; Crona, B.I.; Nyström, M.; Levin, S.A.; Carpenter, S.R.; et al. Transnational corporations and the challenge of biosphere stewardship. Nat. Ecol. Evol. 2019, 3, 1396–1403. [Google Scholar] [CrossRef]
- Boivin, N.L.; Zeder, M.A.; Fuller, D.Q.; Crowther, A.; Larson, G.; Erlandson, J.M.; Denham, T.; Petraglia, M.D. Ecological consequences of human niche construction: Examining long-term anthropogenic shaping of global species distributions. Proc. Natl. Acad. Sci. USA 2016, 113, 6388–6396. [Google Scholar] [CrossRef]
- Fahrig, L. When does fragmentation of breeding habitat affect population survival? Ecol. Model. 1998, 105, 273–292. [Google Scholar] [CrossRef]
- Modica, G.; Praticò, S.; Laudari, L.; Ledda, A.; Di Fazio, S.; De Montis, A. Implementation of multispecies ecological networks at the regional scale: Analysis and multi-temporal assessment. J. Environ. Manag. 2021, 289, 112494. [Google Scholar] [CrossRef]
- Liang, G.; Niu, H.; Li, Y. A multi-species approach for protected areas ecological network construction based on landscape connectivity. Glob. Ecol. Conserv. 2023, 46, e02569. [Google Scholar] [CrossRef]
- Lisovski, S.; Gosbell, K.; Christie, M.; Hoye, B.J.; Klaassen, M.; Stewart, I.D.; Taysom, A.J.; Minton, C. Movement patterns of Sanderling (Calidris alba) in the East Asian-Australasian Flyway and a comparison of methods for identification of crucial areas for conservation. Emu-Austral Ornithol. 2016, 116, 168–177. [Google Scholar] [CrossRef]
- Reynolds, M.D.; Sullivan, B.L.; Hallstein, E.; Matsumoto, S.; Kelling, S.; Merrifield, M.; Fink, D.; Johnston, A.; Hochachka, W.M.; Bruns, N.E.; et al. Dynamic conservation for migratory species. Sci. Adv. 2017, 3, e1700707. [Google Scholar] [CrossRef]
- Manca, F.; Mulà, C.; Gustafsson, C.; Mauri, A.; Roslin, T.; Thomas, D.N.; Benedetti-Cecchi, L.; Norkko, A.; Strona, G. Unveiling the complexity and ecological function of aquatic macrophyte–animal networks in coastal ecosystems. Biol. Rev. 2022, 97, 1306–1324. [Google Scholar] [CrossRef]
- Minor, E.S.; Urban, D.L. A Graph-Theory Framework for Evaluating Landscape Connectivity and Conservation Planning. Conserv. Biol. 2008, 22, 297–307. [Google Scholar] [CrossRef]
- Urban, D.; Keitt, T. Landscape connectivity: A graph-theoretic perspective. Ecology 2001, 82, 1205–1218. [Google Scholar] [CrossRef]
- Rodrigues, A.S.L.; Andelman, S.J.; Bakarr, M.I.; Boitani, L.; Brooks, T.M.; Cowling, R.M.; Fishpool, L.D.C.; da Fonseca, G.A.B.; Gaston, K.J.; Hoffmann, M.; et al. Effectiveness of the global protected area network in representing species diversity. Nature 2004, 428, 640–643. [Google Scholar] [CrossRef] [PubMed]
- Landguth, E.L.; Hand, B.K.; Glassy, J.; Cushman, S.A.; Sawaya, M.A. UNICOR: A species connectivity and corridor network simulator. Ecography 2012, 35, 9–14. [Google Scholar] [CrossRef]
- Liang, J.; He, X.; Zeng, G.; Zhong, M.; Gao, X.; Li, X.; Li, X.; Wu, H.; Feng, C.; Xing, W.; et al. Integrating priority areas and ecological corridors into national network for conservation planning in China. Sci. Total Environ. 2018, 626, 22–29. [Google Scholar] [CrossRef]
- Zhang, L.; Peng, J.; Liu, Y.; Wu, J. Coupling ecosystem services supply and human ecological demand to identify landscape ecological security pattern: A case study in Beijing–Tianjin–Hebei region, China. Urban Ecosyst. 2016, 20, 701–714. [Google Scholar] [CrossRef]
- Teng, M.; Wu, C.; Zhou, Z.; Lord, E.; Zheng, Z. Multipurpose greenway planning for changing cities: A framework integrating priorities and a least-cost path model. Landsc. Urban Plan. 2011, 103, 1–14. [Google Scholar] [CrossRef]
- Thatte, P.; Joshi, A.; Vaidyanathan, S.; Landguth, E.; Ramakrishnan, U. Maintaining tiger connectivity and minimizing extinction into the next century: Insights from landscape genetics and spatially-explicit simulations. Biol. Conserv. 2018, 218, 181–191. [Google Scholar] [CrossRef]
- Saura, S.; Pascual-Hortal, L. A new habitat availability index to integrate connectivity in landscape conservation planning: Comparison with existing indices and application to a case study. Landsc. Urban Plan. 2007, 83, 91–103. [Google Scholar] [CrossRef]
- Pierik, M.E.; Dell’Acqua, M.; Confalonieri, R.; Bocchi, S.; Gomarasca, S. Designing ecological corridors in a fragmented landscape: A fuzzy approach to circuit connectivity analysis. Ecol. Indic. 2016, 67, 807–820. [Google Scholar] [CrossRef]
- Li, S.; Xiao, W.; Zhao, Y.; Lv, X. Incorporating ecological risk index in the multi-process MCRE model to optimize the ecological security pattern in a semi-arid area with intensive coal mining: A case study in northern China. J. Clean. Prod. 2020, 247, 119143. [Google Scholar] [CrossRef]
- Yu, Q.; Yue, D.; Wang, Y.; Kai, S.; Fang, M.; Ma, H.; Zhang, Q.; Huang, Y. Optimization of ecological node layout and stability analysis of ecological network in desert oasis: A typical case study of ecological fragile zone located at Deng Kou County(Inner Mongolia). Ecol. Indic. 2018, 84, 304–318. [Google Scholar] [CrossRef]
- Li, C.; Su, K.; Liang, X.; Jiang, X.; Wang, J.; You, Y.; Wang, L.; Chang, S.; Wei, C.; Zhang, Y.; et al. Identification of priority areas to provide insights for ecological protection planning: A case study in Hechi, China. Ecol. Indic. 2023, 154, 110738. [Google Scholar] [CrossRef]
- Keeley, A.T.H.; Beier, P.; Gagnon, J.W. Estimating landscape resistance from habitat suitability: Effects of data source and nonlinearities. Landsc. Ecol. 2016, 31, 2151–2162. [Google Scholar] [CrossRef]
- Chetkiewicz, C.-L.B.; St. Clair, C.C.; Boyce, M.S. Corridors for Conservation: Integrating Pattern and Process. Annu. Rev. Ecol. Evol. Syst. 2006, 37, 317–342. [Google Scholar] [CrossRef]
- Weber, T.; Sloan, A.; Wolf, J. Maryland’s Green Infrastructure Assessment: Development of a comprehensive approach to land conservation. Landsc. Urban Plan. 2006, 77, 94–110. [Google Scholar] [CrossRef]
- Tarabon, S.; Calvet, C.; Delbar, V.; Dutoit, T.; Isselin-Nondedeu, F. Integrating a landscape connectivity approach into mitigation hierarchy planning by anticipating urban dynamics. Landsc. Urban Plan. 2020, 202, 103871. [Google Scholar] [CrossRef]
- Piao, S.; Tan, K.; Nan, H.; Ciais, P.; Fang, J.; Wang, T.; Vuichard, N.; Zhu, B. Impacts of climate and CO2 changes on the vegetation growth and carbon balance of Qinghai–Tibetan grasslands over the past five decades. Glob. Planet. Chang. 2012, 98–99, 73–80. [Google Scholar] [CrossRef]
- Ren, L.; Huo, J.; Xiang, X.; Pan, Y.; Li, Y.; Wang, Y.; Meng, D.; Yu, C.; Chen, Y.; Xu, Z.; et al. Environmental conditions are the dominant factor influencing stability of terrestrial ecosystems on the Tibetan plateau. Commun. Earth Environ. 2023, 4, 196. [Google Scholar] [CrossRef]
- Qiu, J. China: The third pole. Nature 2008, 454, 393–396. [Google Scholar] [CrossRef]
- Yao, T.; Thompson, L.G.; Mosbrugger, V.; Zhang, F.; Ma, Y.; Luo, T.; Xu, B.; Yang, X.; Joswiak, D.R.; Wang, W.; et al. Third Pole Environment (TPE). Environ. Dev. 2012, 3, 52–64. [Google Scholar] [CrossRef]
- Merow, C.; Smith, M.J.; Silander, J.A., Jr. A practical guide to MaxEnt for modeling species’ distributions: What it does, and why inputs and settings matter. Ecography 2013, 36, 1058–1069. [Google Scholar] [CrossRef]
- Harte, J.; Umemura, K.; Brush, M. DynaMETE: A hybrid MaxEnt-plus-mechanism theory of dynamic macroecology. Ecol. Lett. 2021, 24, 935–949. [Google Scholar] [CrossRef]
- Phillips, S.J.; Anderson, R.P.; Schapire, R.E. Maximum entropy modeling of species geographic distributions. Ecol. Model. 2006, 190, 231–259. [Google Scholar] [CrossRef]
- Fitzpatrick, M.C.; Gotelli, N.J.; Ellison, A.M. MaxEnt versus MaxLike: Empirical comparisons with ant species distributions. Ecosphere 2013, 4, art55. [Google Scholar] [CrossRef]
- Qian, M.; Huang, Y.; Cao, Y.; Wu, J.; Xiong, Y. Ecological network construction and optimization in Guangzhou from the perspective of biodiversity conservation. J. Environ. Manag. 2023, 336, 117692. [Google Scholar] [CrossRef] [PubMed]
- Wang, L.; Wang, S.; Liang, X.; Jiang, X.; Wang, J.; Li, C.; Chang, S.; You, Y.; Su, K. How to Optimize High-Value GEP Areas to Identify Key Areas for Protection and Restoration: The Integration of Ecology and Complex Networks. Remote Sens. 2023, 15, 3420. [Google Scholar] [CrossRef]
- Jiang, H.; Peng, J.; Zhao, Y.; Xu, D.; Dong, J. Zoning for ecosystem restoration based on ecological network in mountainous region. Ecol. Indic. 2022, 142, 109138. [Google Scholar] [CrossRef]
- Guo, H.; Yu, Q.; Pei, Y.; Wang, G.; Yue, D. Optimization of landscape spatial structure aiming at achieving carbon neutrality in desert and mining areas. J. Clean. Prod. 2021, 322, 129156. [Google Scholar] [CrossRef]
- Dai, L.; Liu, Y.; Luo, X. Integrating the MCR and DOI models to construct an ecological security network for the urban agglomeration around Poyang Lake, China. Sci. Total Environ. 2021, 754, 141868. [Google Scholar] [CrossRef]
- McRae, B.H. Isolation by resistance. Evolution 2006, 60, 1551–1561. [Google Scholar] [CrossRef]
- McRae, B.H.; Beier, P. Circuit theory predicts gene flow in plant and animal populations. Proc. Natl. Acad. Sci. USA 2007, 104, 19885–19890. [Google Scholar] [CrossRef]
- Dickson, B.G.; Albano, C.M.; Anantharaman, R.; Beier, P.; Fargione, J.; Graves, T.A.; Gray, M.E.; Hall, K.R.; Lawler, J.J.; Leonard, P.B.; et al. Circuit-theory applications to connectivity science and conservation. Conserv. Biol. 2019, 33, 239–249. [Google Scholar] [CrossRef]
- Peng, J.; Yang, Y.; Liu, Y.; Hu, Y.n.; Du, Y.; Meersmans, J.; Qiu, S. Linking ecosystem services and circuit theory to identify ecological security patterns. Sci. Total Environ. 2018, 644, 781–790. [Google Scholar] [CrossRef] [PubMed]
- Huang, K.; Peng, L.; Wang, X.; Deng, W.; Liu, Y. Incorporating circuit theory, complex networks, and carbon offsets into the multi-objective optimization of ecological networks: A case study on karst regions in China. J. Clean. Prod. 2023, 383, 135512. [Google Scholar] [CrossRef]
- Gilarranz, L.J.; Rayfield, B.; Liñán-Cembrano, G.; Bascompte, J.; Gonzalez, A. Effects of network modularity on the spread of perturbation impact in experimental metapopulations. Science 2017, 357, 199–201. [Google Scholar] [CrossRef] [PubMed]
- Brudvig, L.A.; Damschen, E.I.; Tewksbury, J.J.; Haddad, N.M.; Levey, D.J. Landscape connectivity promotes plant biodiversity spillover into non-target habitats. Proc. Natl. Acad. Sci. USA 2009, 106, 9328–9332. [Google Scholar] [CrossRef] [PubMed]
- Lacher, I.; Wilkerson, M.L. Wildlife Connectivity Approaches and Best Practices in U.S. State Wildlife Action Plans. Conserv. Biol. 2014, 28, 13–21. [Google Scholar] [CrossRef]
- Bascompte, J.; Jordano, P.; Melián, C.J.; Olesen, J.M. The nested assembly of plant–animal mutualistic networks. Proc. Natl. Acad. Sci. USA 2003, 100, 9383–9387. [Google Scholar] [CrossRef] [PubMed]
- Huang, X.; Wang, H.; Shan, L.; Xiao, F. Constructing and optimizing urban ecological network in the context of rapid urbanization for improving landscape connectivity. Ecol. Indic. 2021, 132, 108319. [Google Scholar] [CrossRef]
- Keeley, A.T.H.; Basson, G.; Cameron, D.R.; Heller, N.E.; Huber, P.R.; Schloss, C.A.; Thorne, J.H.; Merenlender, A.M. Making habitat connectivity a reality. Conserv. Biol. 2018, 32, 1221–1232. [Google Scholar] [CrossRef] [PubMed]


Disclaimer/Publisher’s Note: The statements, opinions and data contained in all publications are solely those of the individual author(s) and contributor(s) and not of MDPI and/or the editor(s). MDPI and/or the editor(s) disclaim responsibility for any injury to people or property resulting from any ideas, methods, instructions or products referred to in the content. |
© 2023 by the authors. Licensee MDPI, Basel, Switzerland. This article is an open access article distributed under the terms and conditions of the Creative Commons Attribution (CC BY) license (https://creativecommons.org/licenses/by/4.0/).