Article

An Automated Pipeline for Extracting Forest Structural Parameters by Integrating UAV and Ground-Based LiDAR Point Clouds

College of Computer and Control Engineering, Northeast Forestry University, Harbin 150040, China
*
Author to whom correspondence should be addressed.
Forests 2023, 14(11), 2179; https://doi.org/10.3390/f14112179
Submission received: 9 October 2023 / Revised: 30 October 2023 / Accepted: 31 October 2023 / Published: 1 November 2023
(This article belongs to the Section Forest Inventory, Modeling and Remote Sensing)

Abstract

:
In recent times, airborne and terrestrial laser scanning have been utilized to collect point cloud data for forest resource surveys, aiding in the estimation of tree and stand attributes over hectare-scale plots. In this study, an automated approach was devised to estimate the diameter at breast height (DBH) and tree height across the entire sample area, utilizing information acquired from terrestrial laser scanning (TLS) and airborne laser scanning (ULS). Centered around a meticulously managed artificial forest in Northern China, where Mongolian oak and Chinese Scots pine are the predominant species, both TLS and ULS operations were conducted concurrently on each plot. Subsequent to data collection, a detailed processing of the point cloud data was carried out, introducing an innovative algorithm to facilitate the matching of individual tree point clouds from ULS and TLS sources. To enhance the accuracy of DBH estimation, a weighted regression correction equation based on TLS data was introduced. The estimations obtained for the Chinese Scots pine plots showed a correlation of R2 = 0.789 and a root mean square error (RMSE) of 3.2 cm, while for the Mongolian oak plots, an improved correlation of R2 = 0.761 and a RMSE of 3.1 cm was observed between predicted and measured values. This research significantly augments the potential for non-destructive estimations of tree structural parameters on a hectare scale by integrating TLS and ULS technologies. The advancements hold paramount importance in the domain of large-scale forest surveys, particularly in the calibration and validation of aboveground biomass (AGB) estimations.

1. Introduction

An integral aspect of forest surveys involves measuring the structural parameters of tree samples to assess their variability at the plot scale. These measurements furnish crucial forest-scale information for evaluating the distribution of trunk sizes and qualities. Conventional methods of estimating forest volume based on manually measured tree height and diameter at breast height (DBH) often entail significant errors. There is a pressing need to employ more precise scientific approaches for estimating additional parameters related to tree structure across various spatial scales and with higher temporal resolution [1].
In recent years, light detection and ranging (LiDAR) technology has gradually emerged as a pivotal tool in forest resource surveys [2]. Both airborne and terrestrial LiDAR scanning methods have the capacity to gather intricate three-dimensional information regarding forest structures. These data serve as a foundation for estimating the essential attributes of trees and stands, encompassing tree and stand height [3,4], timber volume [5,6], biomass [7], canopy coverage [8,9], tree density, and diameter at breast height (DBH) [10,11]. Moreover, LiDAR data acquired through aircraft and helicopters, known as airborne laser scanner (ALS) data, have garnered significant attention and find a wide range of applications in forestry. Several countries have adopted region-based approaches for forest surveys [12,13,14], which amalgamate LiDAR scanning data with on-ground information to estimate forest attributes over the entire scanned area.
However, ALS scanning, characterized by a top-down perspective, faces limitations in precisely capturing lower-level forest vegetation information, due to significant occlusion within highly dense forest canopies. The emergence of unmanned aerial vehicle laser scanning (ULS) has alleviated this issue. In order to estimate the detailed attributes of individual trees which are unattainable directly from aerial surveys, growing attention has been garnered towards generating relatively dense and accurate 3D data through terrestrial laser scanning (TLS), mobile laser scanning, personal laser scanning (hand-held or backpack), and photogrammetry. Mokroš et al. [15] conducted a study and comparison of these methods, where it was found that the results obtained through TLS exhibited the highest level of accuracy. However, from a practical application standpoint, utilizing devices such as the Apple iPad Pro had an impact on the accuracy of DBH estimation and tree detection rate [16].
Key observational variables in forest monitoring include DBH, tree height, basal area per hectare, stand growth volume, and aboveground biomass (AGB). To derive these attributes, the identification and enumeration of individual trees within the target area are essential. Methods for identifying tree trunks from TLS point clouds have been proposed by Henning and Radtke [17], Maas et al. [18], and Liang et al. [19]. Donager et al. [20] compared point densities, and Liang et al. [21] evaluated various tree detection methods, concluding that the increasing density of forest point clouds presents a challenge in accurately detecting all trees of interest within the region. The reliable estimation of individual trees by TLS greatly influences the reliability of data fusion and advanced applications.
Circular or cylindrical fitting is commonly used to estimate DBH from TLS data. However, these circular and cylindrical fitting methods assume that tree trunks are circular, which is a rather optimistic assumption [22]. Especially when the complete contour cannot be obtained, it is necessary to use methods such as those proposed by Krisanski S. [23] for the correction of the estimation results. As TLS data can model more complex primitives [24] or convex hulls, this assumption may be further challenged. TLS estimates of tree height based on co-registered point clouds are obtained by calculating the difference between the highest and lowest points of the tree point cloud [25]. While some studies have achieved accurate height measurements comparable to destructive felling measurements [26], others have reported underestimation issues with TLS-based tree heights [27]. The accuracy of height estimation can be attributed to differences in sensors and field settings. Combining TLS with 3D observations above the canopy can enhance tree height estimation [28,29]. However, further research in this method is warranted, particularly within more complex forest ecosystems in the future.
The potential of unmanned aerial vehicles (UAVs) equipped with laser scanners as a means to expedite scanning processes and cover larger areas, enabling analyses akin to TLS, has been under exploration [30,31]. ULS stands out for its significantly higher point densities at a reduced cost and enhanced flexibility. ULS has found successful applications in various forestry-related domains, including tree height estimation, localization [32], tree detection and segmentation [33,34], DBH estimation [35], crown height model (CHM) generation, leaf area index (LAI) estimation, aboveground biomass (AGB) estimation based on tree height and crown area in allometric equations, and the estimation of tree parameters through tree reconstruction algorithms [36]. These studies serve as compelling evidence of the fruitful utilization of ULS data in conjunction with quantitative structure model (QSM) algorithms.
Nonetheless, in instances where ULS systems yield lower point cloud densities and data quality, the ability to reconstruct tree structures may be compromised. Schneider et al. [28] discovered that, in temperate forests, ULS tends to occlude approximately 71% of crowns within the top 25 m above ground level. In denser forest types such as tropical rainforests or coniferous forests, the top-down crown perspective of ULS imposes limitations on capturing complete tree structures. To address these challenges, the fusion of TLS and ULS presents a promising solution. Such fusion can notably mitigate occlusion-related issues, thereby enhancing the reconstruction of fine-scale forest structures across extensive forested regions.
At present, the integration of ULS point clouds with TLS point clouds for large-scale forest measurements remains in its nascent stages. Cao et al. [36] conducted a study wherein they segmented individual trees using point cloud data acquired from both ULS and backpack laser scanning (BLS). They extracted tree height information from ULS data and DBH from BLS data. By combining these two datasets, they generated comprehensive point clouds covering the entire forest canopy. Subsequently, structural parameters for each tree, extracted using LiDAR technology, were utilized to develop taper models for five representative trees, resulting in an optimized taper model. This approach was employed to enhance the adaptability of standard volume tables, yielding commendable performance in poplar volume calculations.
In a separate study, Fekry et al. [37] integrated ground-based and ULS data to estimate tree parameters based on QSM. Initially, local density peaks, derived from canopy clustering, were employed to register ground-based/ULS LiDAR data. Following registration, data fusion of TLS/ULS datasets was conducted to mitigate redundancy and noise. Subsequently, tree modeling and the retrieval of biophysical parameters were carried out based on QSM. The study concluded that the fusion of TLS/ULS LiDAR data outperformed terrestrial LiDAR in tree parameter estimation, particularly in dense forest environments. In such settings, the fused tree parameters exhibited improvements compared to parameters derived solely from terrestrial LiDAR data.
Furthermore, Terryn et al. [38] assessed tree parameters derived from TLS and ULS benchmark data fusion, concluding that parameters derived from TLS and ULS were comparable to the fused parameters.
Due to the complementary nature of ULS and TLS, the collaborative utilization of ULS and TLS point cloud data can largely address technical challenges stemming from the limitations of laser point cloud data from a single platform. In comparison to existing research, this paper offers several key contributions:
  • It introduces a pipeline for the automatic measurement of forest structural parameters on a large scale using ULS point cloud data. This resolves the issue of automating high-precision measurements of forest information over extensive forest areas, which was challenging when using laser radar data from a single source, whether ULS or TLS, for tree structure modeling.
  • It proposes an automated matching method for individual trees in TLS point clouds and their corresponding trees in ULS point clouds, based on tree structures. This overcomes the problem commonly encountered with point-based registration methods, which often have high consistency requirements between TLS and ULS point cloud data, making them impractical for real-world applications.
  • It introduces a method for augmenting and correcting ULS point cloud sample data, using DBH calculated from TLS point clouds. This addresses the issue of significant bias in the DBH estimation equation, resulting from errors in DBH directly calculated from ULS point clouds.
These contributions collectively enhance the automation and accuracy of large-scale forest structural parameter measurement, facilitating improved utilization of ULS and TLS point cloud data for forest research.

2. Materials and Methods

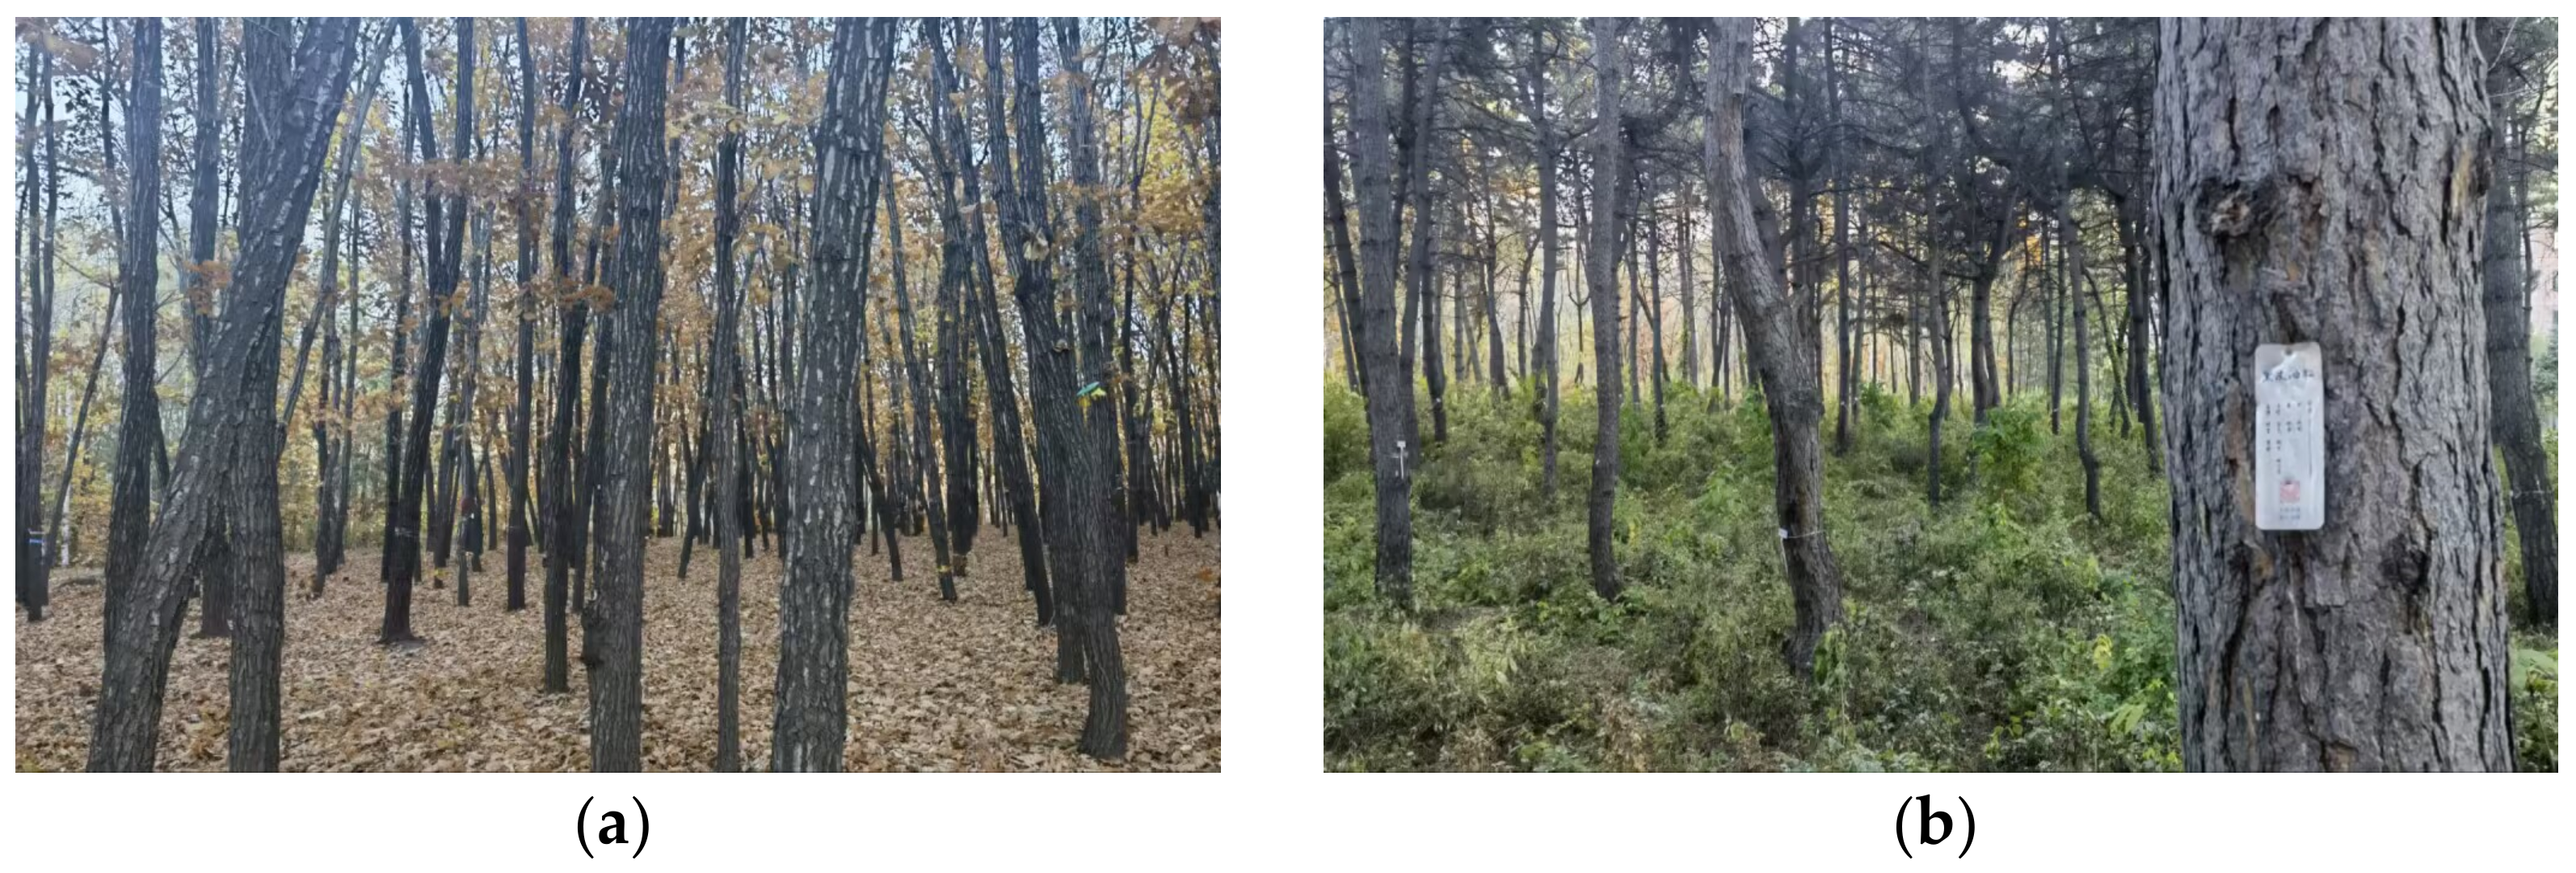
2.1. Study Site and Research Data

2.1.1. Study Site

This study was undertaken on an artificially planted forest in Harbin, Heilongjiang Province, China, at the coordinates 126°37′15′′ E longitude and 45°43′10′′ N latitude. Figure 1 shows the location of the study sites. Site 1 is the Mongolian oak (the Latin name is Quercus mongolica Fisch.ex Ledeb.) forest, and Site 2 is the Chinese Scots pine (the Latin name is Pinus tabuliformis var. mukdensis) forest. Figure 2 shows photos of the conditions of each site.

2.1.2. Point Cloud Data Acquisition Method

The ULS point cloud data were acquired using the DJI Matrice 300 RTK unmanned aerial vehicle (UAV) platform, equipped with the Zenmuse L1 LiDAR sensor. The scanning was conducted in September 2022. The scan parameters are detailed in Table 1.
The obtained raw data consist of a set of files, including laser data, RTK data, camera calibration data, and so on. Standard format files for the laser data (.LAS) were generated using DJI Terra 3.0.0 reconstruction software (SZ DJI Technology Co., Ltd., Shenzhen, China). Although we used consumer grade L1 LiDAR sensor laser scanning equipment, the accuracy requirements sufficiently met the needs of tree parameter measurement [39].
A separate portion of the dataset consists of TLS point clouds acquired for the Chinese Scots pine and Mongolian oak plantations. To minimize signal occlusion, TLS point clouds were captured using the FARO Focus3D S 120 at five scan positions around selected plots under deciduous conditions: at the center of the plot and along the north, east, south, and west edges of the plot. The angular resolution between pulses was set at 0.036, with a point spacing of 6.3 mm at a distance of 10 m from the scanner. Scan registration, performed using FARO SCENE 5.5.3.16 software (Faro Technology, Inc., Lake Mary, FL, USA), yielded an average absolute error ranging from 4.1 mm to 6.7 mm, with a mean value of 5.4 mm.
Within the ULS point cloud dataset for Mongolian oak and Chinese Scots pine in Harbin, China, sample plots of 0.25 hectares each (50 m × 50 m) were selected for data collection. The circular area with a diameter of 12 m represents the sampling region for TLS point clouds.

2.1.3. Manual Field Measurements

In September 2022, field measurements of tree diameter at breast height (DBH ≥ 9 cm) and tree height were conducted for the two sample plots. The distribution of DBH and tree height for the sample trees is depicted in Figure 3.
A total of 259 trees in the Chinese Scots pine sample plot were field-measured. The mean and median tree height in the stand were 13.7 m and 13.6 m, respectively. The average DBH for trees in the stand was 21.6 cm, with a median DBH of 20.9 cm. In the Mongolian oak sample plot, 223 trees were field-measured. The mean and median tree height in the plot were both 13.7 m. The average DBH for trees in the stand was 18.9 cm, with a median DBH of 18.5 cm.
Field surveys were conducted within the TLS sampling areas of the two sample plots (DBH ≥ 9 cm). In the Chinese Scots pine sample plot, a total of 17 trees were identified in the TLS point cloud. In the Mongolian oak sample plot, there were 25 trees detected in the TLS point cloud. The distribution of tree diameters is illustrated in Figure 4.
Due to the absence of canopy width measurements during the field measurements, no qualitative or quantitative analysis was conducted in this experiment. Crown width data obtained from the ULS point cloud were merely incorporated as one component in the DBH regression equation.

2.2. Methodology

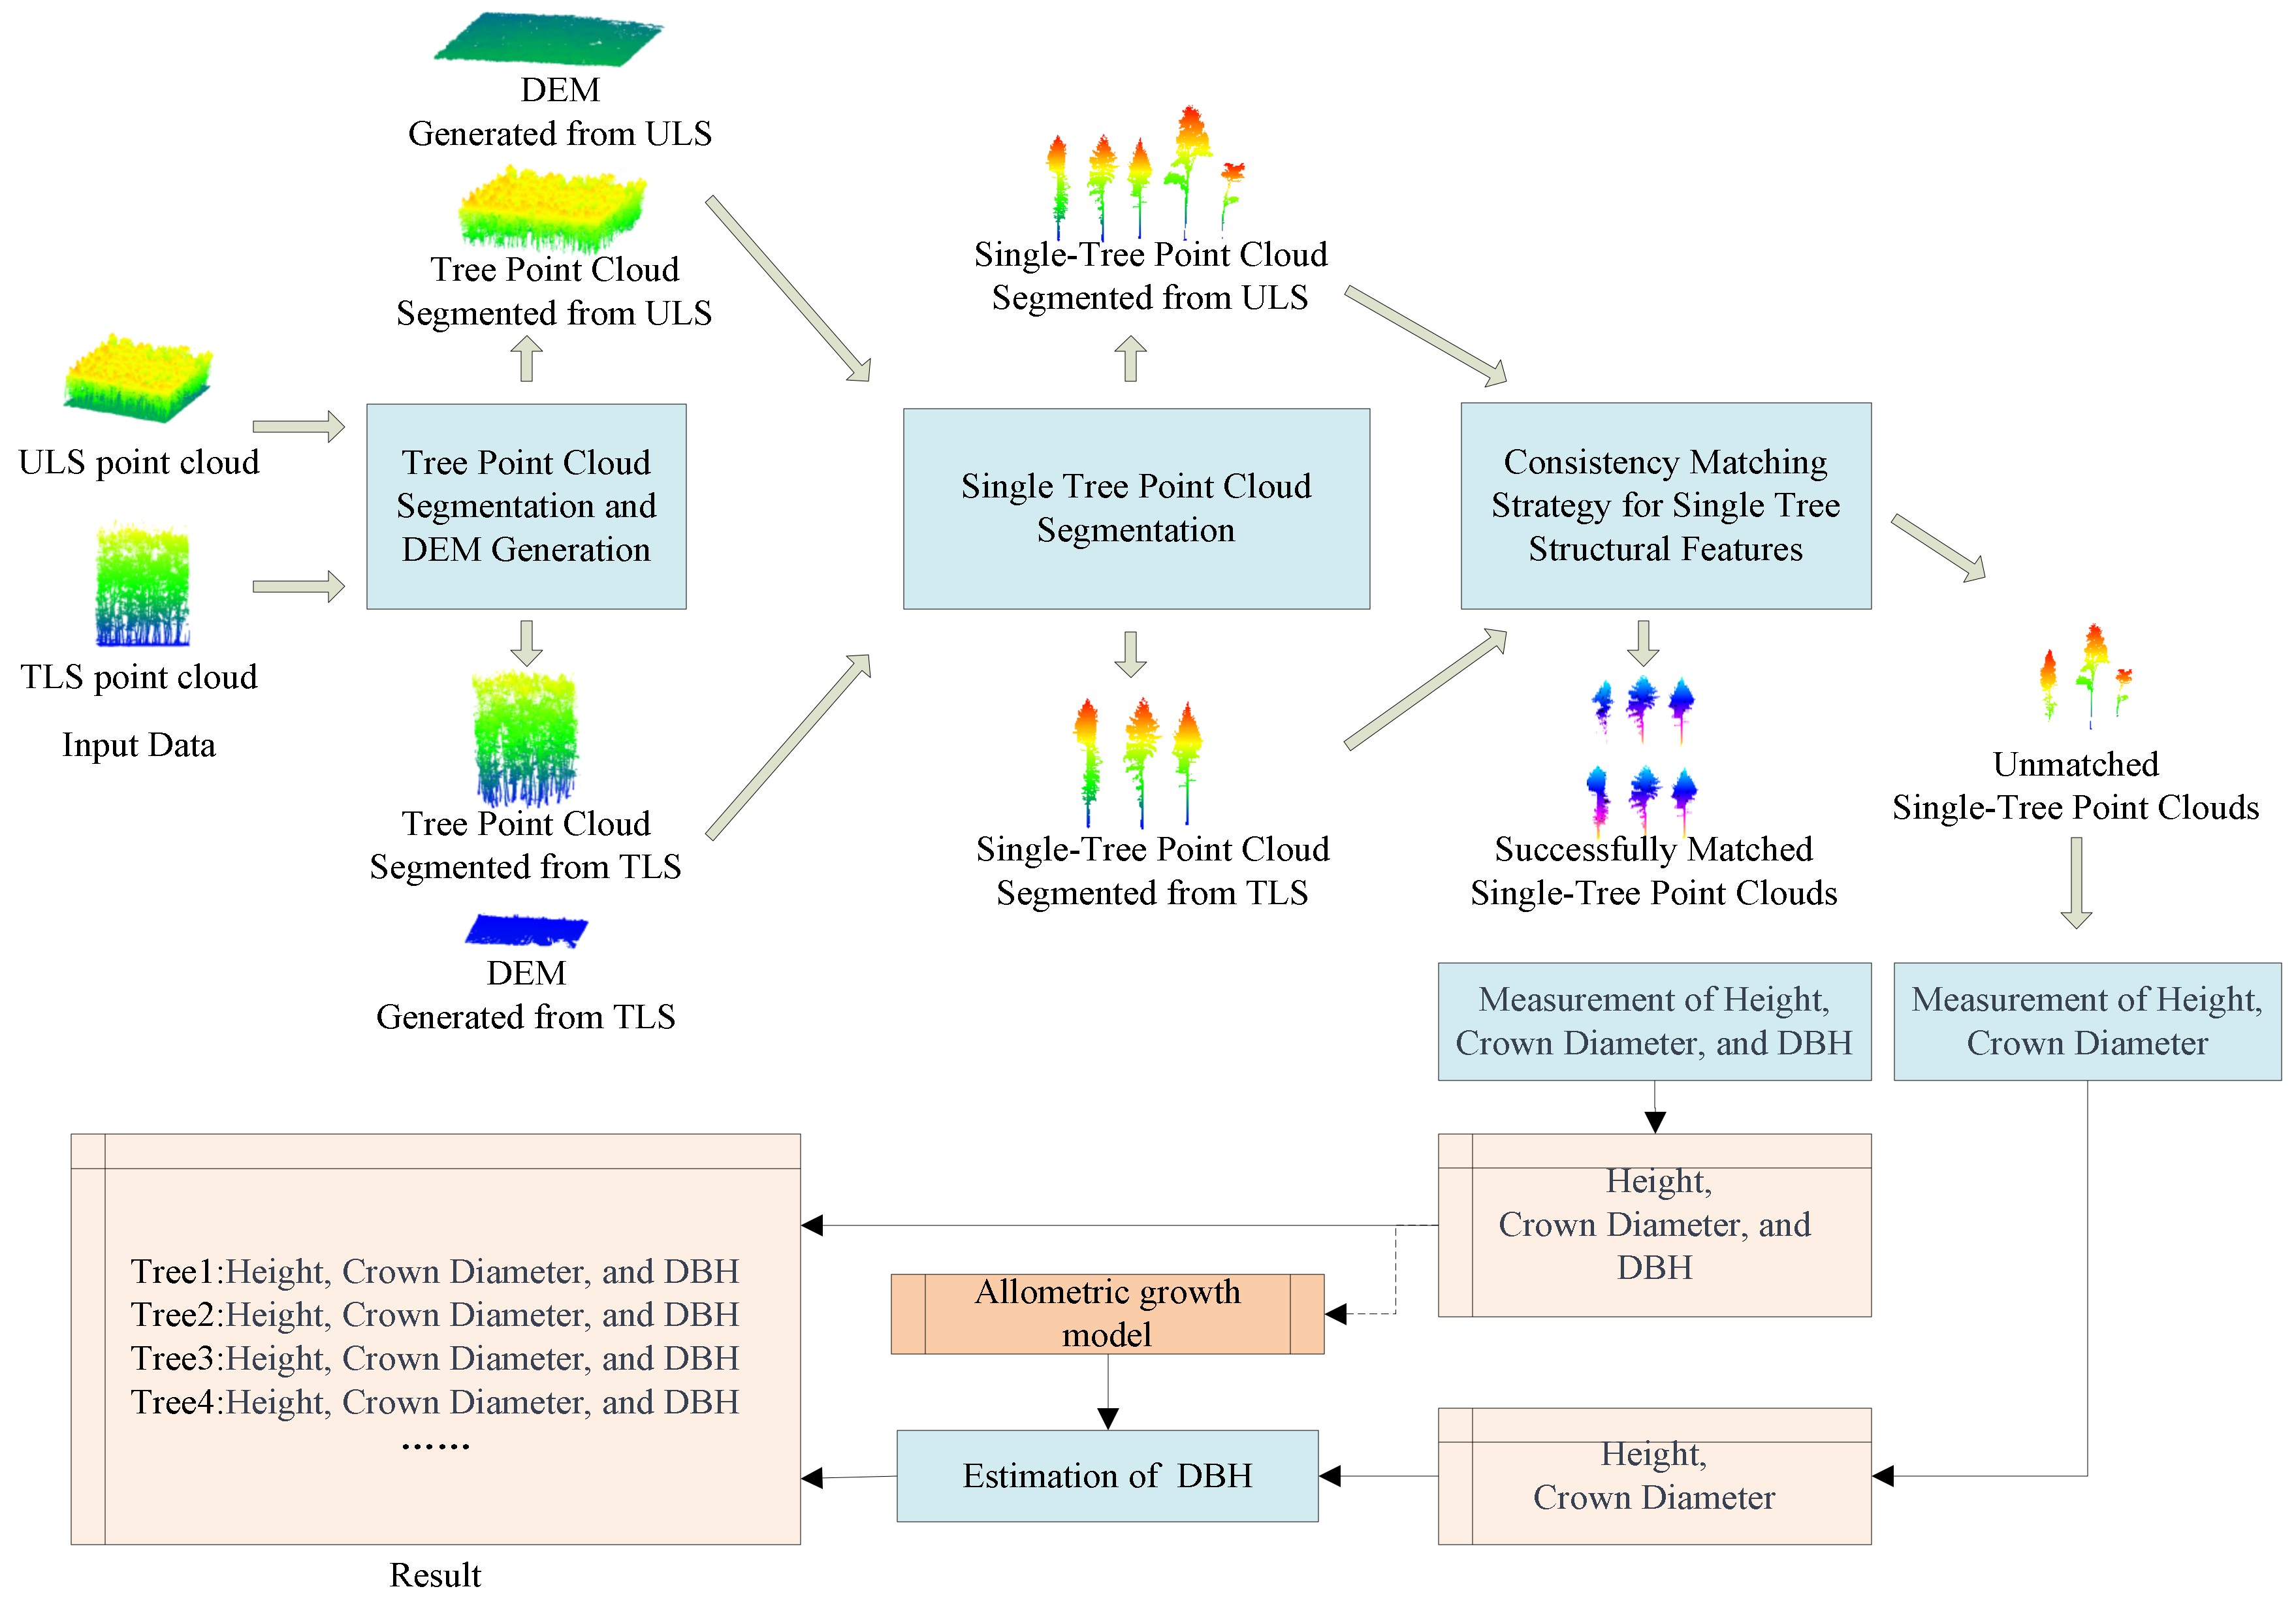
2.2.1. Overview of the Pipeline

This section presents a method for automatically reconstructing all quantitative structural parameters of trees from point clouds at the forest stand level. What sets this method apart is its novelty in elevating the current research on point cloud-based forest structural factor calculations from manual assistance to the realm of supporting large-scale automated measurements. It provides an end-to-end technical framework for integrating the research outcomes of existing tree or forest structural parameter extraction methods. It also offers a new approach for the combined use of point clouds from different platforms to enhance the accuracy of large-scale forest structural parameter estimation. The basic workflow is illustrated in Figure 5.
This process takes ULS point cloud files containing extensive forest sample tree point clouds and TLS point clouds, obtained through local scans of the sample areas (usually in PCD format), as “input data.” Through automated calculations, it derives quantitative structural parameters such as tree height, crown diameter, and DBH for all individual trees within the sample area. Some of these calculations are obtained directly from high-quality ULS single-tree point clouds, while others are estimated through dynamically established allometric growth models. The implementation process for each step in Figure 5 is detailed below.
  • Data input: large-scale forest point clouds, acquired using drones and ground-based equipment, (in *.pcd file format) are used as input data for the large-scale modeling method.
  • Digital elevation model (DEM) extraction: To perform subsequent segmentation of tree point clouds and obtain accurate tree height, a complete DEM needs to be established. The cloth simulation filter (CSF)-based algorithm [40] has been proven to be one of the best-performing ground point segmentation methods. Due to the high-density nature of ULS point clouds and the threshold settings during the CSF filtering process, a large number of non-ground points are included. Therefore, unlike traditional ground elevation modeling methods, downsampling, rather than upsampling, is required during ULS point cloud modeling for denoising purposes. The Delaunay triangulation of the resulting ground point cloud ultimately achieves automated and precise extraction of ground elevation models. Due to CSF’s point cloud inversion property, it is also applicable to DEM generation from TLS point clouds.
  • Single-tree point cloud segmentation: Processing the ULS and TLS tree point clouds involves extracting the portions above a given DEM threshold (e.g., 0.5 m) as input for single-tree segmentation within the point cloud. This step requires assigning indices to segmented single-tree instances. To accomplish the task of automatically segmenting single-tree point clouds in large-scale areas, a method based on deep supervised machine learning for tree detection, segmentation, and trunk reconstruction, as proposed by Windrim et al. [41], is employed. This algorithm is designed specifically for high-resolution aerial LiDAR point clouds and can segment individual trees, identify trunk points, and further build a main stem segmentation model including tree height, diameter, taper, and sweep. The basic idea of the algorithm is to project the tree point cloud into a bird’s eye view (BEV) representation, and then train a Faster R-CNN [42] network with a Resnet-101 backend [43] for segmenting single-tree point clouds. Once each individual tree is detected as a group of 3D points, these points can be further segmented into two parts, stem and canopy, using the PointNet [44] network.
  • Single-tree structural feature consistency matching: Differing from existing point-based methods for matching point clouds from different sources, this paper proposes a structural consistency search algorithm to match single-tree point clouds segmented from ULS point clouds with those segmented from TLS point clouds, establishing a dataset for estimating allometric growth models. If a limited number of single-tree point clouds are obtained from the provided TLS point cloud, ULS tree point clouds with distinct main stem features, obtained in step 3, can also be used as model estimation data. Tree height, crown diameter, and DBH calculations are performed directly on these single-tree point clouds. Utilizing the obtained quantitative structural data from these trees, an allometric growth model for the current sample area can be established. These quantitative structural parameters from this portion of trees will also be part of the overall measurement results.
  • For trees in ULS point clouds with poor quality or for incomplete main stem point clouds, their tree height and crown diameter are directly extracted. These values are then input into the allometric growth model, established in step 4, to obtain estimated DBH parameters.
The workflow presented in this paper focuses solely on the measurement of three parameters: tree height, crown diameter, and DBH. In reality, other quantitative structural parameter measurement tasks conducted using single-tree point clouds can be automated following the calculation processes outlined in the above workflow.

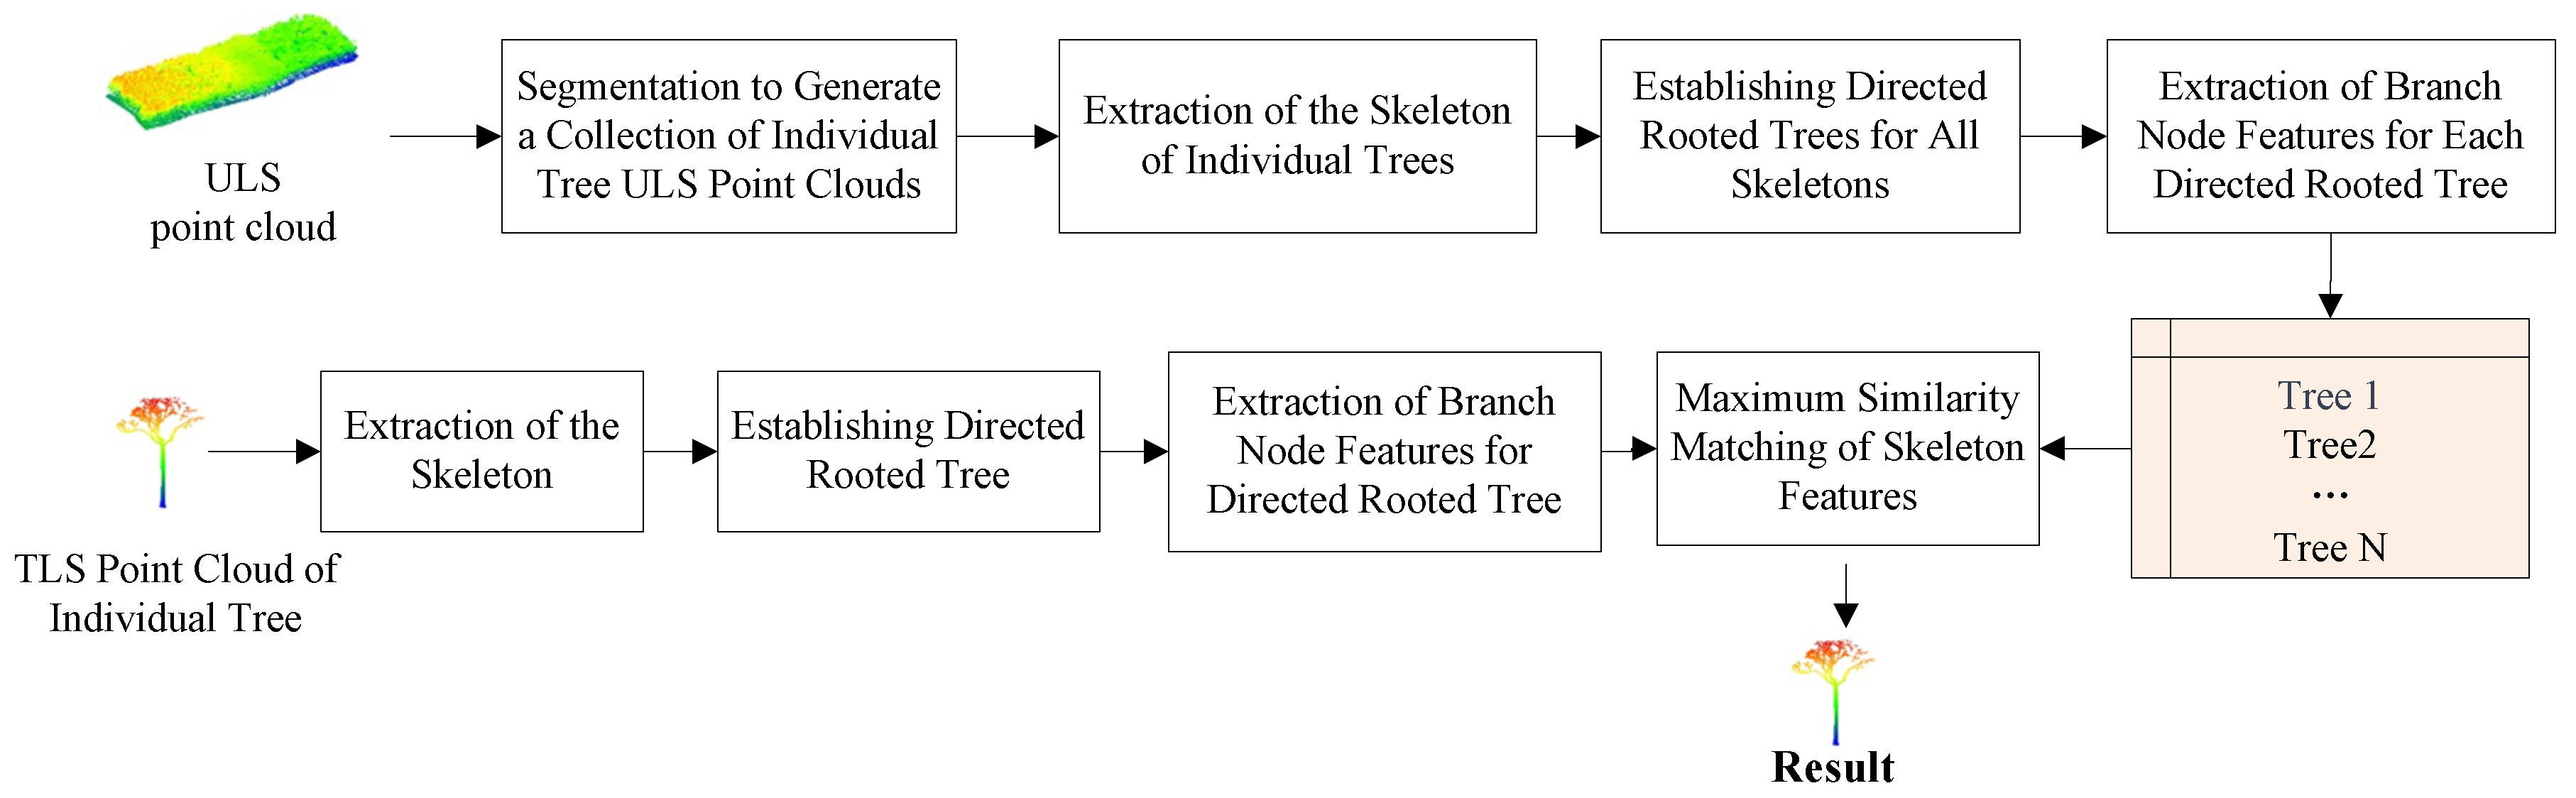
2.2.2. Tree Structure Consistency Assessment Method

Determining whether two sets of single-tree point clouds segmented from TLS and ULS data belong to the same tree poses a significant challenge. This is primarily due to variations in point cloud characteristics, such as point density, viewing angles, and accuracy, which can vary greatly depending on the sensing mode and data acquisition method. Additionally, dense vegetation often obscures or partially obscures the underlying scene, resulting in missing branches, tree trunks, and lower point densities in occluded areas. In the case of drone-based data, only the upper canopy and sometimes a small portion of the upper tree trunk may be observable, and in extreme cases, there may be no visible tree trunk at all. This variability makes it difficult for traditional methods of assessing point cloud similarity, which rely on geometric relationships between points, such as Chamfer distance (CD), earth mover’s distance (EMD), and similar approaches [45]. In situations where point cloud quality is low, especially in cases of non-uniform point cloud density, these features are often challenging to differentiate or become ambiguous. Therefore, achieving robust tree point cloud matching in general environmental conditions remains a challenging task, and current leading methods only provide point cloud similarity assessment solutions for specific environmental scenarios.
In contrast to typical point cloud registration or retrieval tasks, our objective primarily revolves around locating specific TLS point cloud objects within a collection of tree point clouds obtained through ULS segmentation. Throughout the search process, we have the capability to ascertain that the sought-after target undeniably exists within the ULS point cloud. Moreover, we do not undertake a point-to-point matching or alignment of all points within the located target and the target itself, as our primary focus lies on their structural similarity. Thus, we approach the establishment of correspondences between the same tree in ULS and TLS point clouds from a topological structural feature perspective.
Our observation of tree structural features is based on the following assumptions:
  • The object being sought unquestionably exists within the collection of tree point clouds segmented from ULS data.
  • The same tree exhibits similar topological structures across various sources of point clouds, even in cases where certain branches may remain unobserved in some of the source point clouds.
In comparison to traditional point cloud matching tasks, this object search approach demonstrates maximum robustness concerning the inevitable absence of tree point cloud data in practical application scenarios. Furthermore, it makes fewer assumptions about the nature of the data, and it yields favorable matching results even in situations where a portion of essential main trunk and branch data is missing. The workflow of the point cloud target search method is illustrated in Figure 6.
  • Constructing the Branching Structure of Single Trees from Point Clouds
Methods for reconstructing tree skeletons used to build tree structures have matured considerably, with the most commonly used method being distance-based segmentation [46]. The fundamental concept behind this method is to establish the shortest path tree from the root to all points in the cloud. Each point is grouped based on its distance along the path from the root, resulting in a set of approximately cylindrical cross-sections that can be transformed into nodes within the tree structure. In the context of tree point cloud comparison, once the skeleton trees for two objects to be compared are obtained, they can be simplified by removing non-essential nodes from the skeleton, i.e., non-branching nodes, while preserving root nodes, branching nodes, and leaf nodes. This streamlined skeleton not only significantly reduces redundant nodes but also avoids the influence of local detail errors on the similarity between two trees.
The branching structure of a tree can be represented as a directed root tree, characterized by having a unique vertex serving as the root, and each edge departing from that vertex; i.e., having exactly one vertex with an in-degree of 0, while all other vertices have an in-degree of 1. This is also known as an outward tree. In the root tree T, nodes with descendants are referred to as internal nodes, and the root is an internal node unless it is the only node in the graph; i.e., an in-degree of one and out-degree greater than zero define an internal node. Internal nodes and the root collectively are referred to as branching nodes, while all other nodes are leaf nodes. For ease of measurement, we express subtree features recursively using the characteristics of its node ‘t’ and all of its descendant nodes. This transformation converts the determination of common subtree similarity into a node similarity determination problem between two subtrees, allowing the use of a node search process to complete the task of obtaining common subtrees.
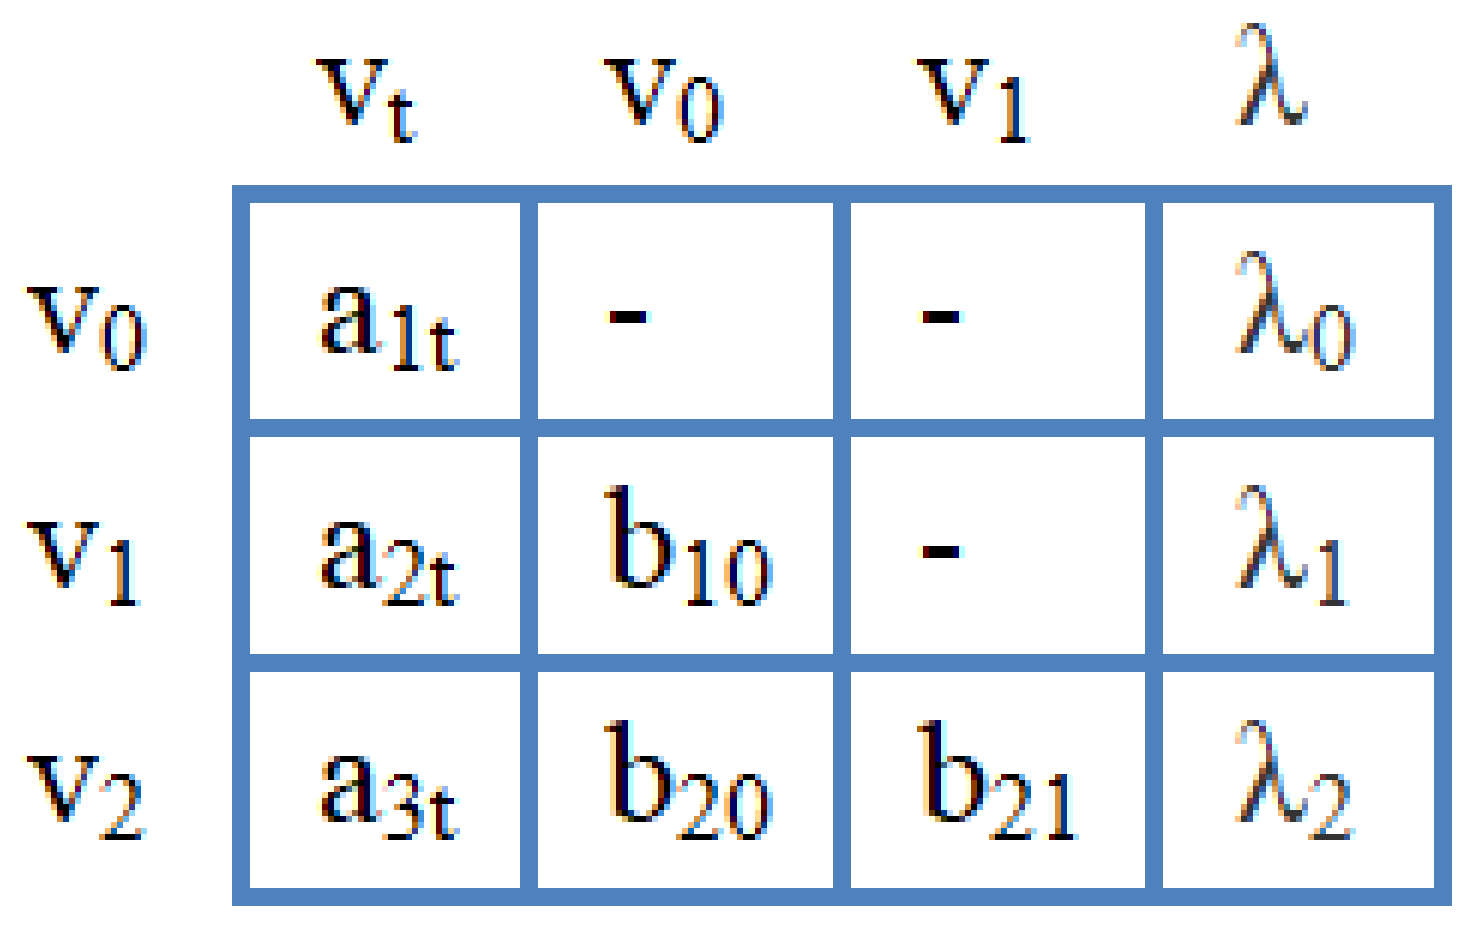
  • Node Feature Representation
  • To calculate the feature representation of nodes, we perform a depth-first traversal from the root node, computing the depth ‘r’ for all branch nodes. These depth values serve as weighting coefficients for the individual branch nodes. This consideration is primarily based on the growth characteristics of trees, where the main trunk often has the most branches. The decision to use weighting for node similarity calculations depends on whether we believe the main trunk contributes more to tree similarity.
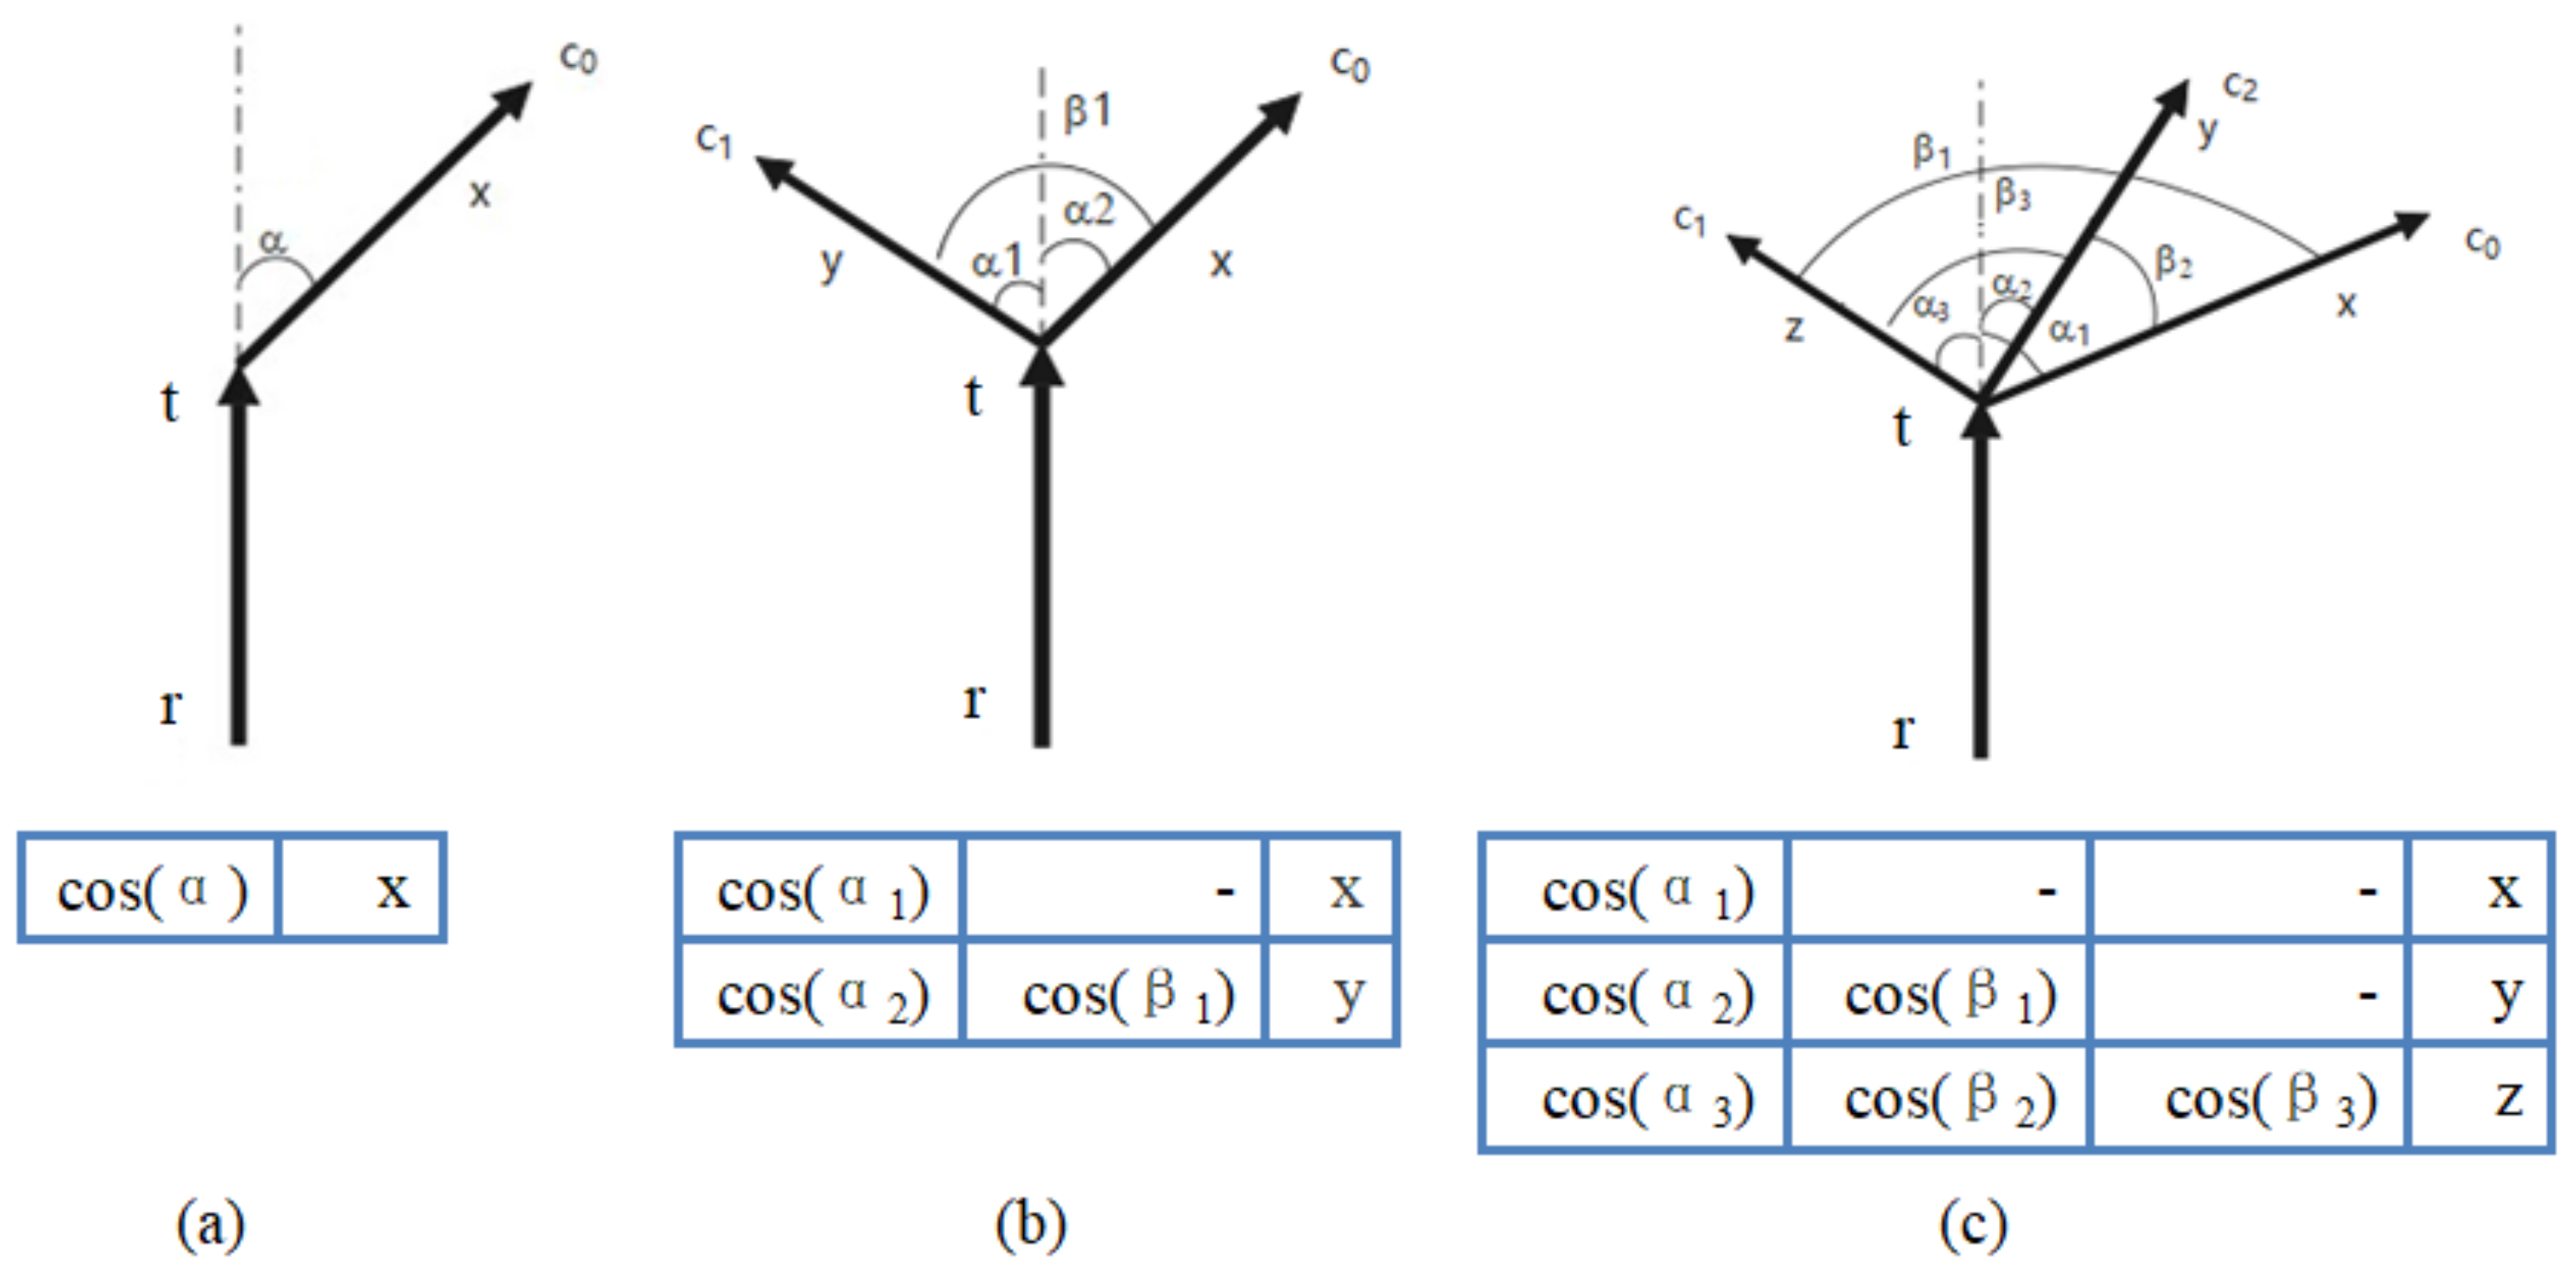
  • We calculate the structural features of each branch node ‘t’ and represent them as a two-dimensional feature matrix. Taking a branch node with three child nodes as an example, the structure is depicted in Figure 7.
In this context, vt represents the vector pointing from the parent node of t to node t, while vk signifies the vector from t to its k-th child node. ait denotes the cosine of the angle between vector vi and vt, bij signifies the cosine of the angle between vector vi and vj, and λi represents the magnitude of vector vi. The formula for the cosine of the angle between spatial vectors is provided in Equation (1):
cos θ = a · b a × b
For a node within a directed root tree, the principles governing its feature representation are depicted in Figure 8.
In the two-dimensional feature matrix for branch node t, the arrangement order of vi is not dependent on the search order of child nodes but, rather, is sorted in ascending order based on the cosine of the angle between vk and vt. This design is primarily rooted in tree morphology characteristics.
  • Two-Dimensional Feature Matrix Similarity Assessment
The similarity assessment of branch node two-dimensional feature matrices is considered in the following four scenarios:
  • For the two feature matrices to be evaluated, Am×m+1 and Bn×n+1, if m = n and for all aij and bij, |aijbij| < µ (µ being the similarity measurement threshold), they are considered fully isomorphic, and the node similarity is 1.
  • If m = n and for all aij and bij, |aijbij| ≥ µ (µ being the similarity measurement threshold), they are considered fully heterogeneous, and the node similarity is 0.
  • If m = n, then if the number of elements satisfying |aijbij| ≥ µ (µ being the similarity measurement threshold) is x, and the number of valid elements in A and B is y (N = (m × m + 3)/2), the node similarity is x/y.
  • If m < n, sequentially delete the rows and columns corresponding to the nm nodes in B, and calculate the similarity according to the above rules, taking the maximum value q × m/n as the node similarity.
  • Tree Similarity Assessment
When assessing node similarity within trees, we utilize the Jaccard similarity coefficient. The Jaccard coefficient serves as a measure for gauging the resemblance and divergence between finite sample sets. Larger values signify a greater degree of similarity among the samples. For a given pair of sets, A and B, the Jaccard coefficient is defined as the ratio of the intersection of A and B’s size to the size of their union, as outlined in Equation (2):
J ( A , B ) = A B A B = A B A + B A B
When both sets A and B are empty, J(A, B) is defined as 1.
For the comparison of two trees, Tm and T’n (where m and n represent the number of branch nodes in the trees, with mn), we compare each branch node in Tm with all branch nodes in T’n. If the similarity between the compared branch nodes exceeds a given threshold, the count of identical nodes, K, is incremented. After all comparisons are completed, the similarity between the two trees is computed using Equation (3):
δ T = K m + n K

2.2.3. Methods for Calculating Tree Height and Crown Diameter

In this section, we discuss the techniques employed to compute tree height and crown width.
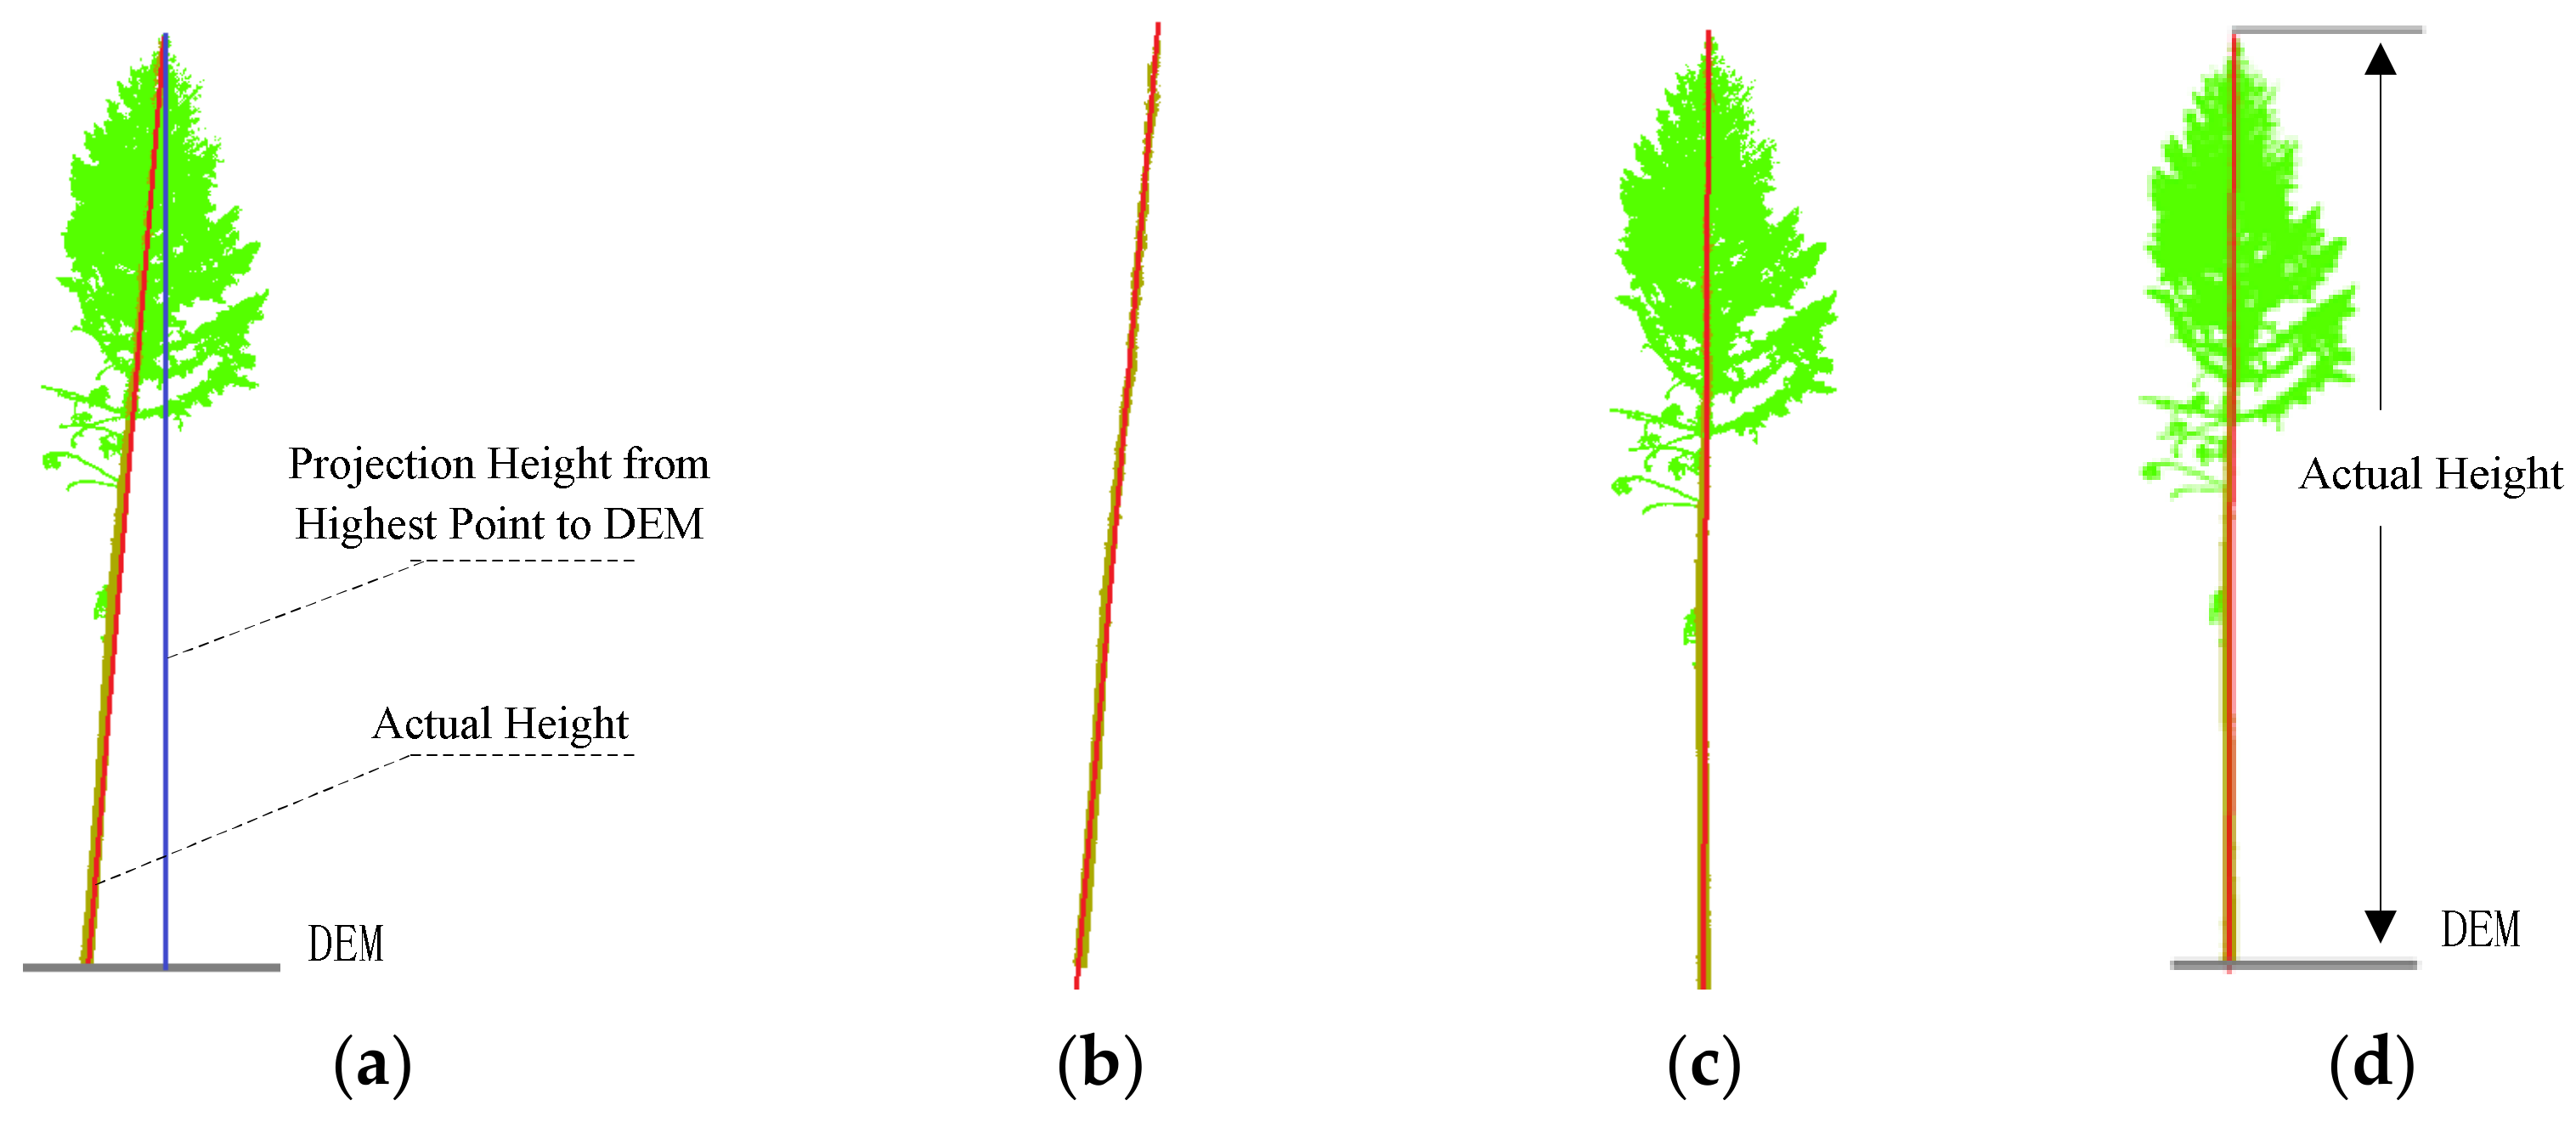
  • Tree Height Calculation
For single-tree point clouds obtained from ULS data, it is possible to directly calculate tree height by determining the maximum z-value projection of points onto the DEM. However, due to factors related to the tree’s growth environment and overall inclination, a simple calculation of tree height based on the direct projection of the highest point in the tree point cloud onto the DEM often results in significant errors compared to the actual tree height, as illustrated in Figure 9a.
To address this, this paper employs a least-squares fitting to estimate the geometric model of the tree trunk from the point cloud [47]. Principal component analysis (PCA) is applied to the points on the main trunk to determine the vector direction of the trunk, which serves as the direction of the tree’s central axis, as shown in Figure 9b. Subsequently, a rotation coordinate transformation matrix is computed based on this vector, transforming all points within the single-tree point cloud, as depicted in Figure 9c.
Within the transformed points, peak points of the tree (those with the highest z-values) are identified, and their projections onto the DEM are calculated as the tree’s height values, as illustrated in Figure 9d.
  • Calculation of Crown Diameter
In the model introduced in this paper, designed for segmenting single-tree point clouds obtained from ULS data, the point cloud is inherently categorized into two distinct components: tree crown and trunk. Consequently, the crown point cloud can be readily utilized to determine the CD employing Schneider’s method [47], as illustrated in Figure 10.
This methodology commences by delineating the effective region within the tree crown point cloud to ascertain the crown base height (CBH). Subsequently, it computes the crown diameter based on the projection area of points above the CBH. The calculation process consists of five sequential steps:
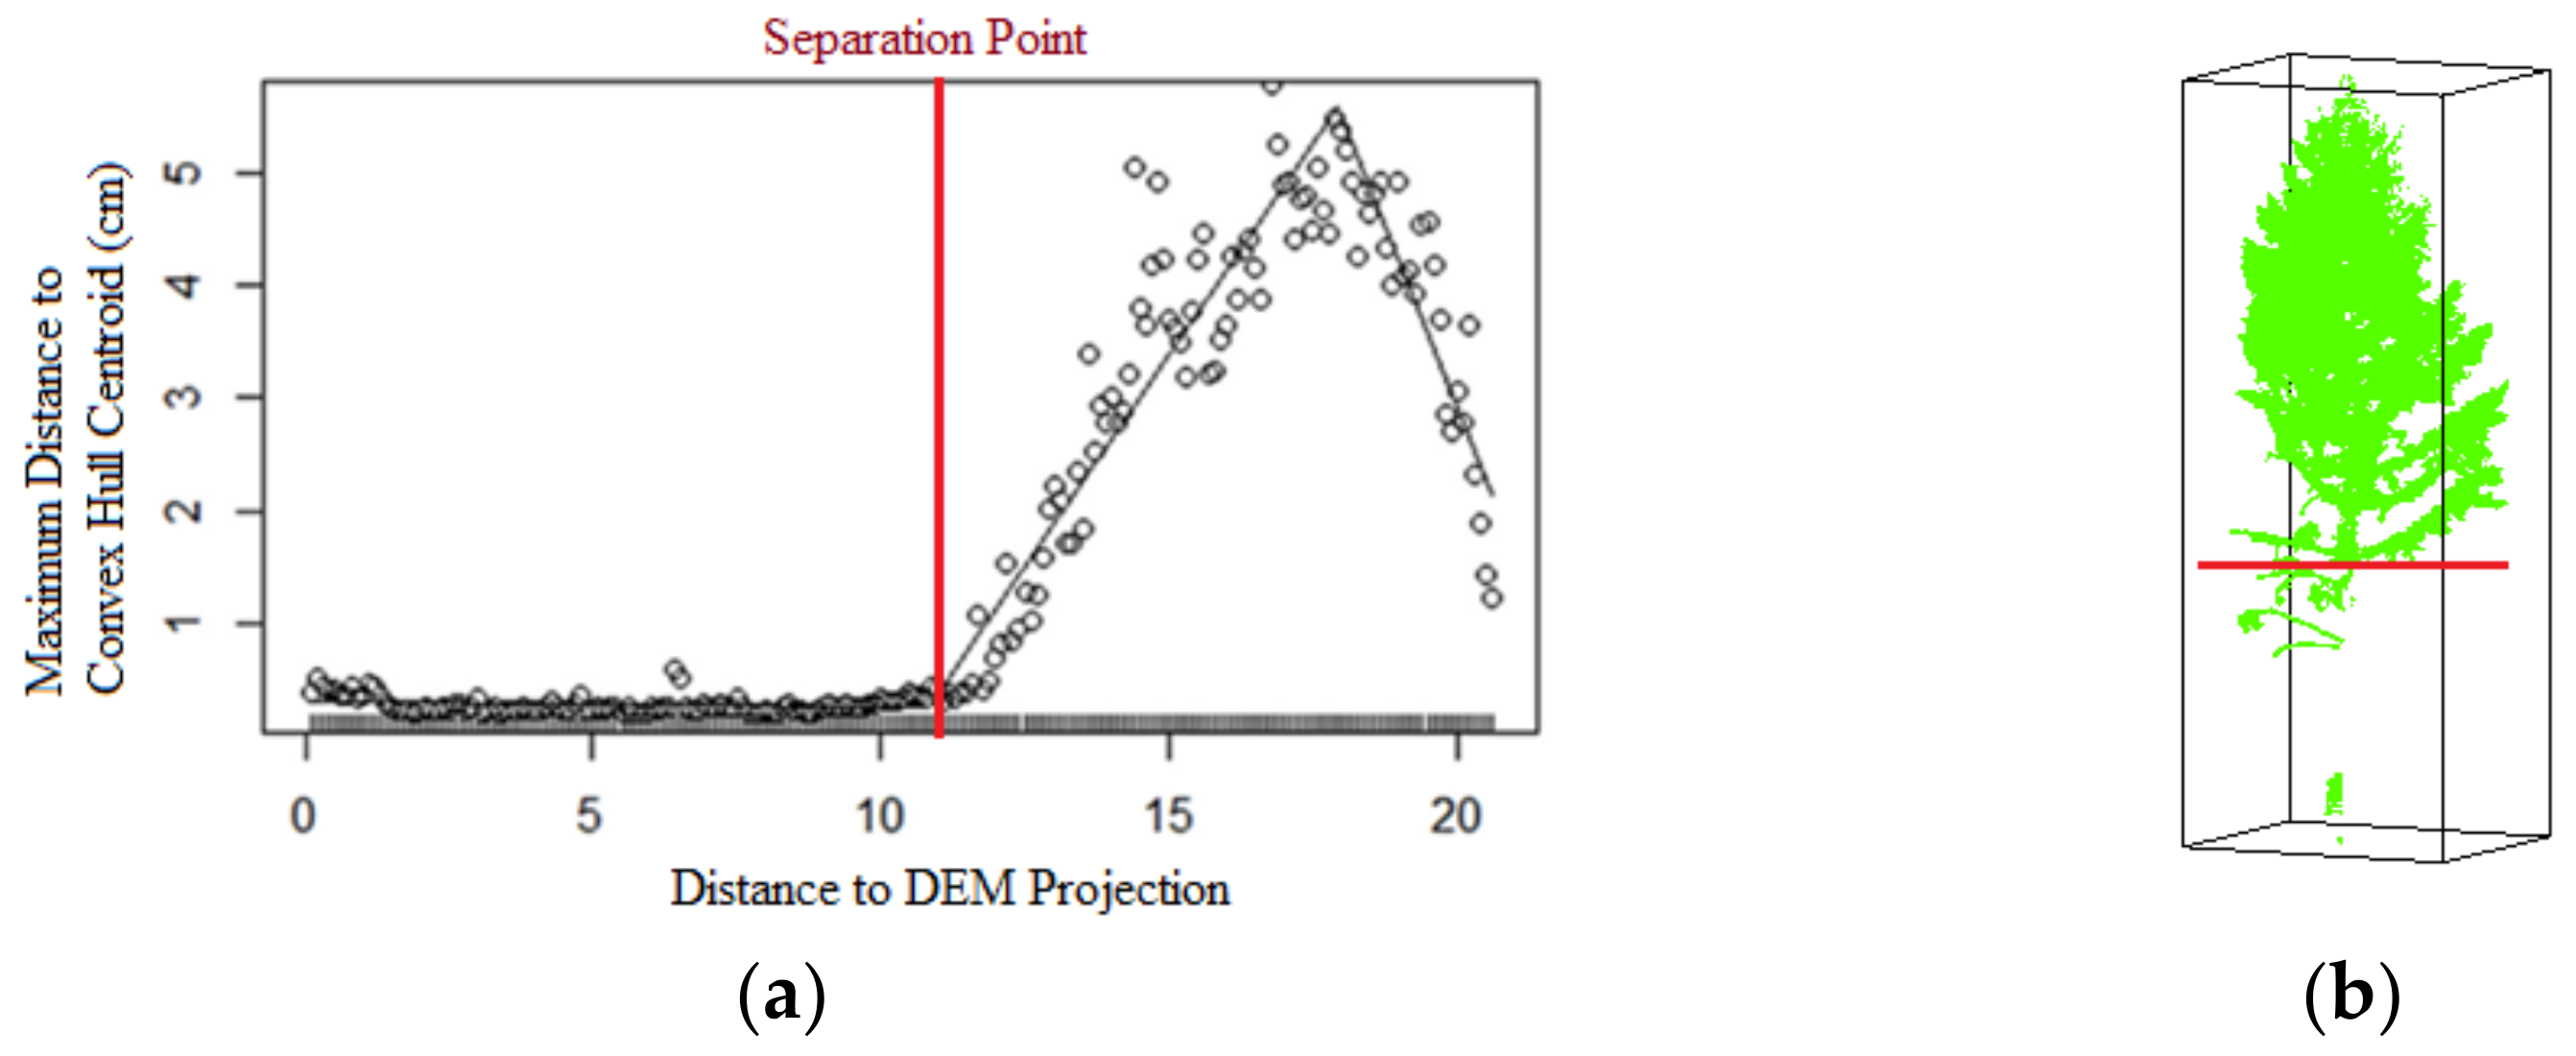
  • The tree crown point cloud undergoes vertical segmentation at 0.1 m intervals.
  • Each segment is subjected to a convex hull fitting process within the xoy coordinate system.
  • The maximum Euclidean distance between the centroids of these convex hulls is calculated, as exemplified in Figure 10a.
  • CBH is ascertained through segmented regression, pinpointing the height at which the regression slope experiences a pronounced increase, often indicative of the presence of branches.
  • Points situated above the CBH are categorized as part of the tree crown, as depicted in Figure 10b, and are employed for calculating the crown diameter (CD) using the formula defined in Equation (4), where ‘S’ denotes the crown projection area.
CD = 2   ×   S π

2.2.4. Calculation and Estimation Methods for DBH

While accurate DBH calculations are readily achievable for single-tree trunk point clouds obtained through TLS, due to their high point cloud quality, a substantial portion of single-tree trunks segmented from ULS point clouds encounter challenges in DBH measurement. The issues typically arise from suboptimal point cloud quality at the DBH measurement height (1.3 m~1.5 m), often attributed to factors such as occlusion. In certain instances, there may be an absence of identifiable trunk points within specific single-tree point clouds.
In such scenarios, the utilization of allometric growth models becomes imperative to estimate DBH based on tree height and crown diameter. This paper adopts a universal model proposed by Jucker et al. [48] and introduces a method for dynamically generating stand-level tree allometric models based on measured data, facilitating DBH estimation from ULS single-tree point clouds. The workflow for obtaining DBH from single-tree point clouds is outlined below.
  • Method for Calculating DBH Based on Point Clouds
Trunk point clouds obtained through TLS exhibit generally uniform point density and distribution, rendering them well-suited for DBH measurements. In contrast, trunk point clouds acquired via ULS often present persistent challenges, with a substantial portion of tree point clouds within the DBH estimation range (at a height of 1.25 m–1.35 m above ground) featuring significant data gaps or remaining non-individually segmented due to severe occlusion.
Since DBH, directly computed from trunk point clouds, serves as a crucial input for subsequent parameter estimation in allometric growth equations, the accuracy of DBH estimation can be compromised when calculated from lower-quality trunk point clouds. Hence, it is imperative to implement an automated assessment of these point clouds to determine whether DBH calculation should proceed.
Various software tools commonly employ RANSAC-based cylinder fitting methods to derive DBH. However, this approach typically necessitates the specification of a minimum of four parameters for precise cylinder fitting, often requiring manual parameter adjustments to achieve accurate DBH estimation in practical applications. Moreover, it may prove unsuitable for trunk segmentation in scenarios characterized by uneven point density distribution or dense point clouds.
To address this challenge, this paper developed a DBH calculation method based on trunk slicing, referencing a model proposed by Ekaterina Bogdanovich and colleagues [49]. The calculation workflow is outlined in Figure 11 and primarily comprises the following four steps:
  • The single-tree point cloud is first corrected, and at a vertical distance of 1.25–1.35 m above the lowest point in the corrected single-tree point cloud, the trunk point cloud is sliced, as depicted in Figure 11a.
  • Points within the tree slice are projected onto the x–y plane, convex hulls are computed to generate two polygons, and Gaussian smoothing is applied to them to better fit the actual trunk slice. It is assumed that the trunk boundary lies between the “inner” and “outer” polygon boundaries, as illustrated in Figure 11b.
  • Ten sets of perpendicular lines, passing through the centroids of the “inner” and “outer” contours, are randomly generated. Each set of lines takes the form of D1 and D2, as shown in Figure 11c. The average of D1 and D2 for each set is considered one measurement.
  • The mean square error is computed for the ten measurements. If the mean square error exceeds the slice thickness, the slice point cloud is deemed incomplete or inadequate for representing the trunk, and the DBH estimation for that instance is discarded. Otherwise, the average of the ten measurements is taken as the final DBH measurement, as illustrated in Figure 11c.
Figure 11. DBH calculation workflow: (a) trunk slicing, (b) convex hulls of inner and outer boundaries, and (c) DBH fitting.
Forests 14 02179 g011
  • Method for DBH Estimation Based on Tree Height and Crown Diameter
For single trees segmented from ULS point clouds, which lack complete trunk point clouds, their DBH needs to be predicted based on tree height and crown diameter. In this case, we choose to use the universal model proposed by Jucker et al. [48] as the fundamental model for DBH estimation, as shown in Equation (5):
D p r e d = e α + β l n H × C D × e σ 2 2
In this equation, H represents tree height, CD represents crown diameter, Dpred stands for the predicted DBH based on tree height and crown diameter, σ represents the root mean square error between estimated and actual values, and α and β are coefficients to be determined. For different study sites, fitting α and β requires using a set of tree samples with a known tree height, crown diameter, and DBH. The derivation of the fitting formula for α and β is as follows.
Taking the logarithm of both sides of Equation (5) yields Equation (6):
α + β l n H × C D = ln D p r e d e σ 2 2
Further rearranging leads to Equation (7):
α + β l n H × C D = ln D p r e d σ 2 2
where D, H, CD, and δ are known values. Assuming ln(H × CD) is represented as a, and ln D p r e d σ 2 / 2 as b, the above formula can be reformulated into Equation (8):
α + a β = b
To dynamically derive the DBH estimation equation for a given plot, it is essential to establish a system of simultaneous equations to solve for α and β. This system is based on n sets of quantitative structural parameters, including tree height, crown diameter, and diameter at breast height, which are obtained from direct measurements of both ULS and TLS point clouds. This is illustrated in Equation (9):
α + a 1 β = b 1 α + a 2 β = b 2 α + a n β = b n
Its matrix form is as Equation (10):
1 , a 1 1 , a 2 1 , a n α β = b 1 b 2 b n
Solving Equation (10) using the least squares method yields the solution as Equations (11) and (12):
α = i = 1 n b i   i = 1 n a i n i = 1 n a i b i i = 1 n a i i = 1 n b i   n i = 1 n a i 2 ( i = 1 n a i ) 2 n
β = i = 1 n a i n i = 1 n a i b i i = 1 n a i i = 1 n b i   n i = 1 n a i 2 ( i = 1 n a i ) 2
When quantifying structural parameters for different plots, one can automatically derive the DBH estimation equation for the current plot by substituting the sample data obtained directly from single-tree point clouds into Equations (11) and (12). All estimated DBH values for the samples, along with the median of the root mean square errors (RMSEs) between the estimated DBH values and the DBH values in the samples, serve as the residual estimation. Subsequently, this estimation equation can be used to estimate DBH accurately for single-tree point clouds, obtained from point clouds when tree height and crown diameter are known, enabling the precise estimation of DBH for point clouds that cannot be directly measured.
  • Method for Augmenting and Correcting ULS Point Cloud Sample Data
When performing regression for the DBH estimation equation, relying solely on measurement data obtained from ULS as samples can lead to a DBH estimation equation with substantial bias, due to errors in DBH calculations based on point clouds. Therefore, this paper introduces a method to augment and correct ULS point cloud sample data using DBH values calculated from TLS point clouds.
Consider T as the ensemble comprising all single-tree point clouds segmented from TLS point clouds, and let U represent the assembly encompassing all single-tree point clouds segmented from ULS point clouds. Mathematically, T = {ti|ti represents the ith single-tree TLS point cloud}, and U = {uj|uj denotes the jth single-tree ULS point cloud}. The foundational procedure for constructing a DBH regression equation is delineated as follows:
1.
Pairwise Point Cloud Matching and High-Precision Sampling
For each ti within T, a structural consistency matching method is employed to conduct a search within U, aiming to identify the corresponding uj and thus forming a point cloud pair. In principle, these point clouds within each pair should pertain to the same tree. Subsequently, the DBH of this tree is computed based on ti, while the tree height and crown diameter are derived from uj, yielding a set of samples characterized by high precision. This resultant collection of samples is designated as Pacc, with the quantity of samples, denoted as M, contingent upon the number of point cloud matches observed in T and U.
2.
Processing ULS Point Clouds
The successfully matched point clouds are removed from U to create the set U’. The tree height and crown diameter of the corresponding trees are calculated, based on the point clouds in U’. Subsequently, they are divided into two subsets, based on the feasibility of direct DBH measurement: one consisting of point clouds for which DBH can be directly measured (designated as set Q), and the other comprising point clouds for which direct DBH measurement is not possible (referred to as set Q’). The DBH is calculated, as well as tree height and crown diameter, for all point clouds in Q, forming a dataset with lower precision known as Pinacc. The number of samples in Pinacc, denoted as N, is determined by the count of point clouds in Q. For the point clouds in Q’ related to tree diameters, DBH can be predicted using regression equations.
  • Sample Precision and Regression Enhancement
Overall, Pacc comprises samples with high precision but in limited quantity, while Pinacc samples are more abundant but exhibit lower precision. Utilizing Pinacc samples directly or merging them with Pacc to create a DBH regression equation presents challenges in enhancing prediction accuracy. Here, we employ a weighted approach on Pacc samples to improve regression outcomes. The weights are determined based on the ratio of M to N.

3. Results

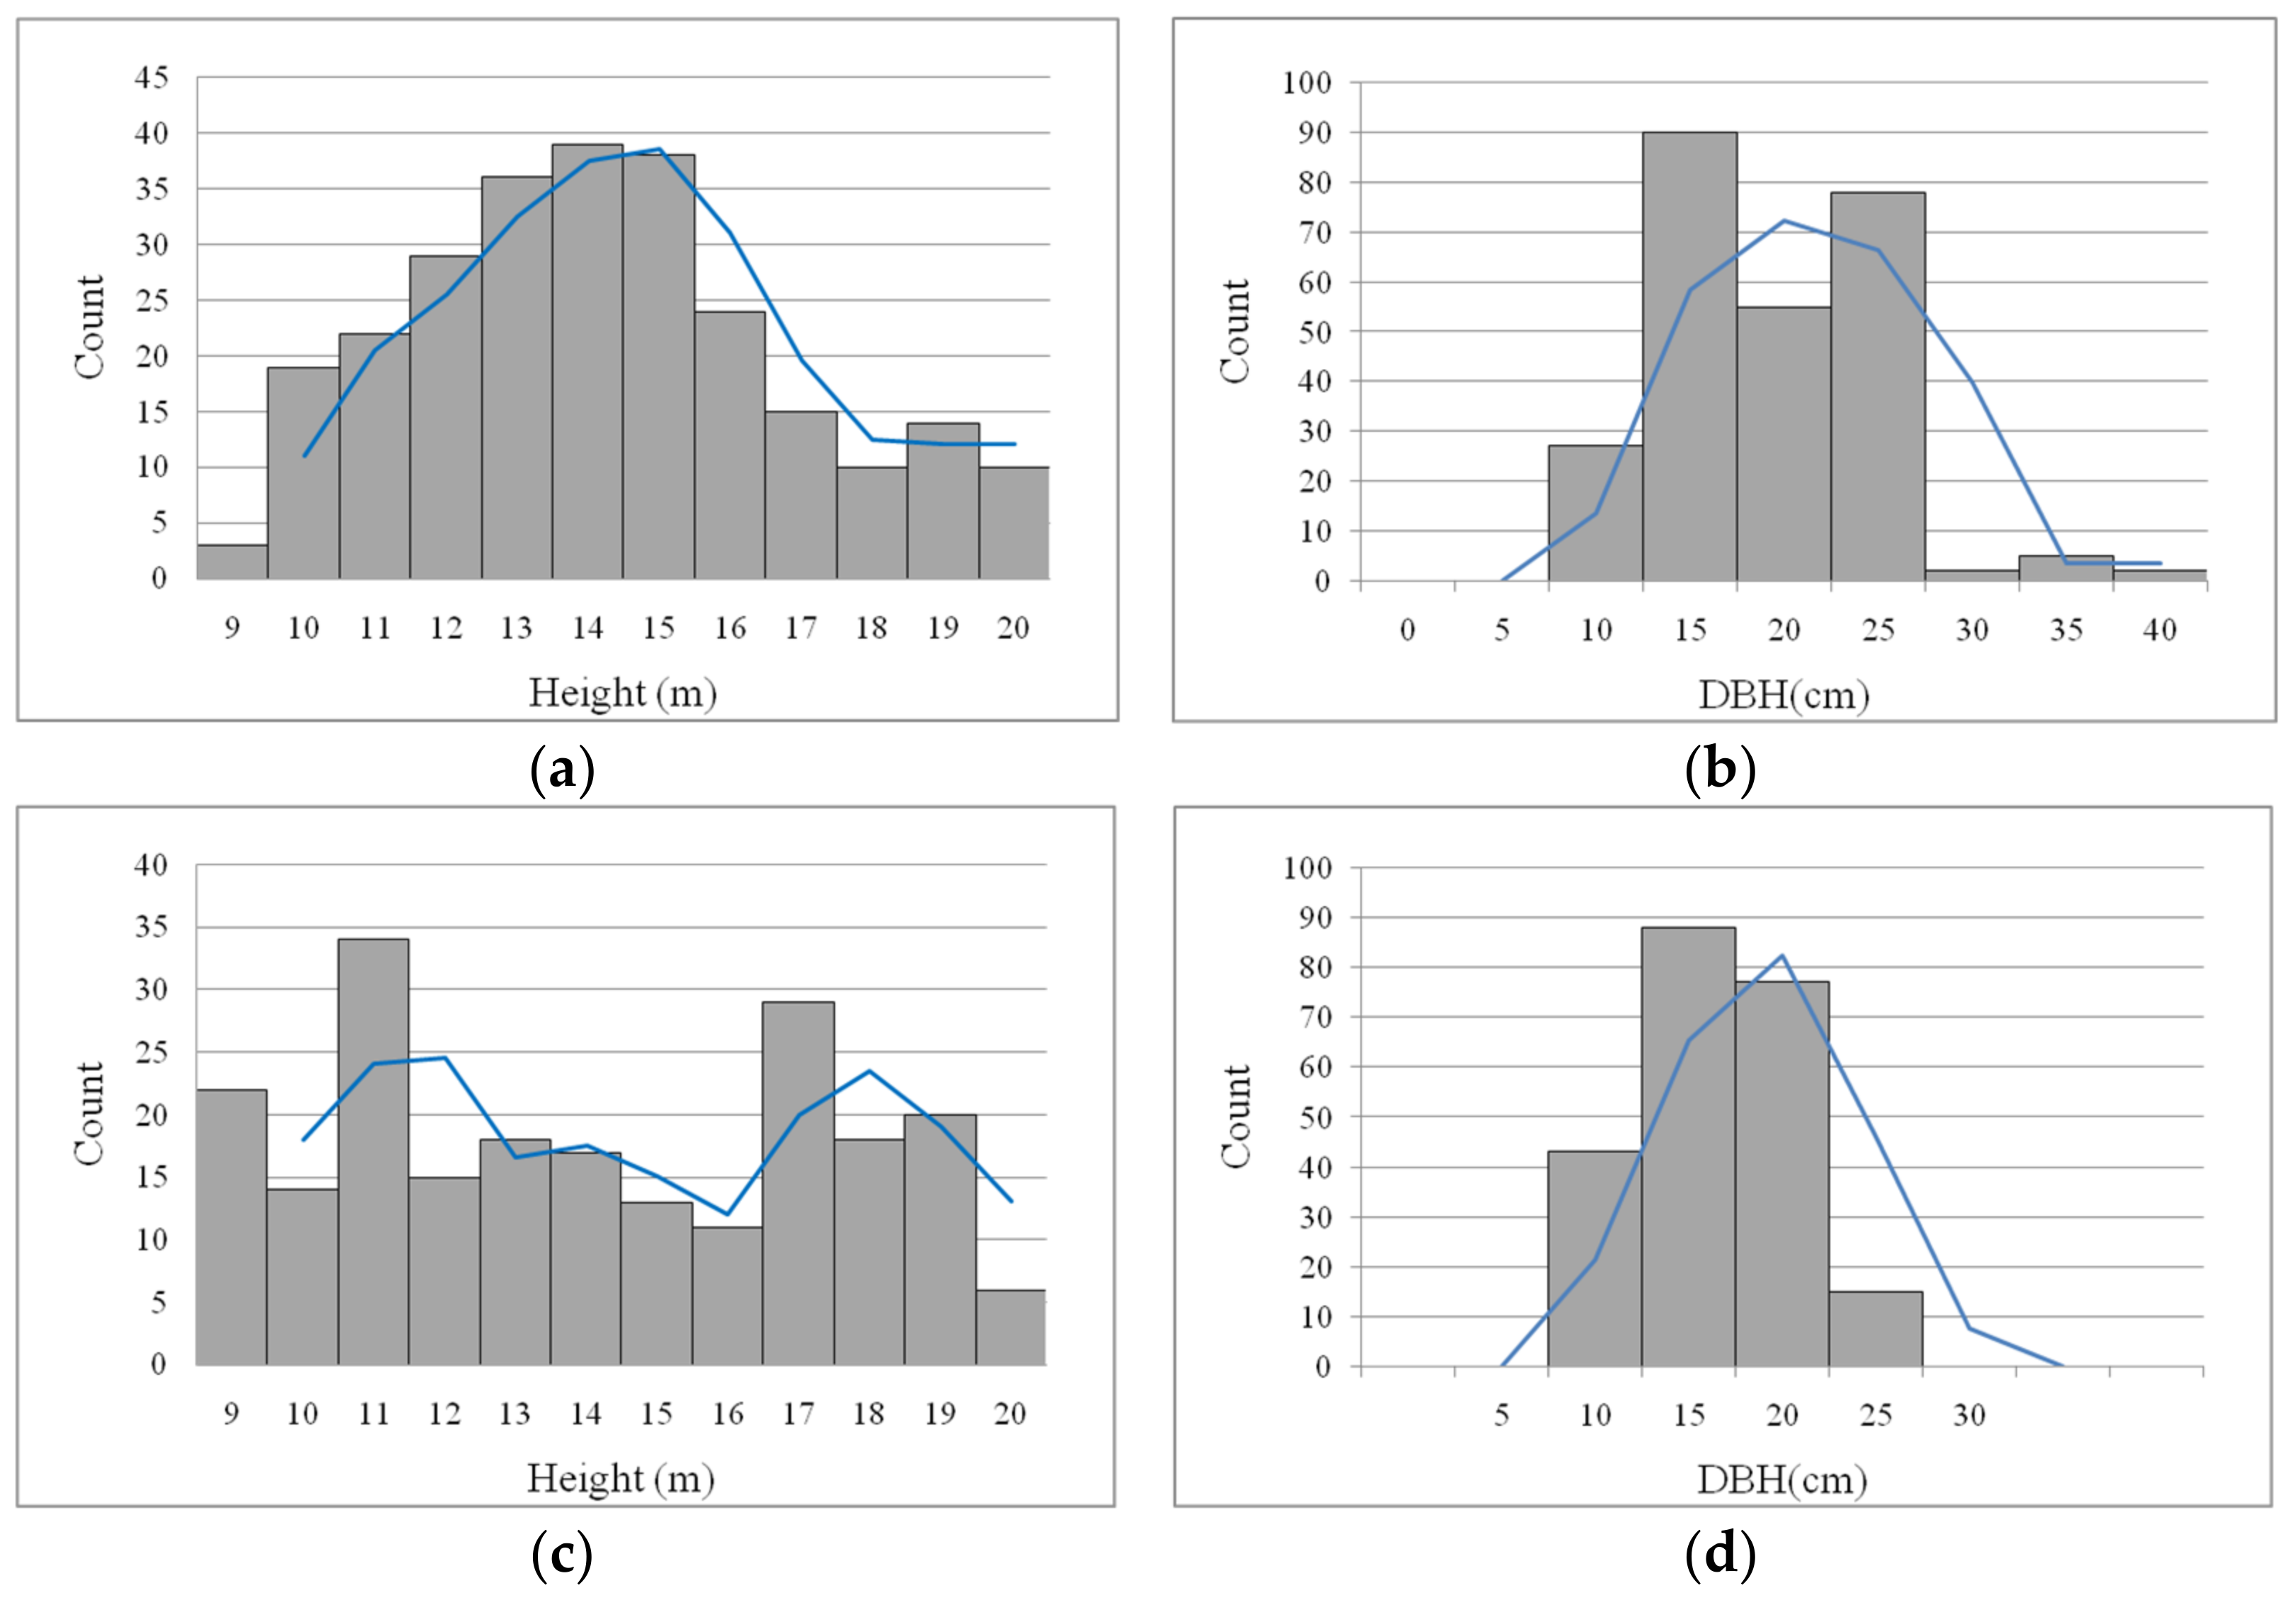
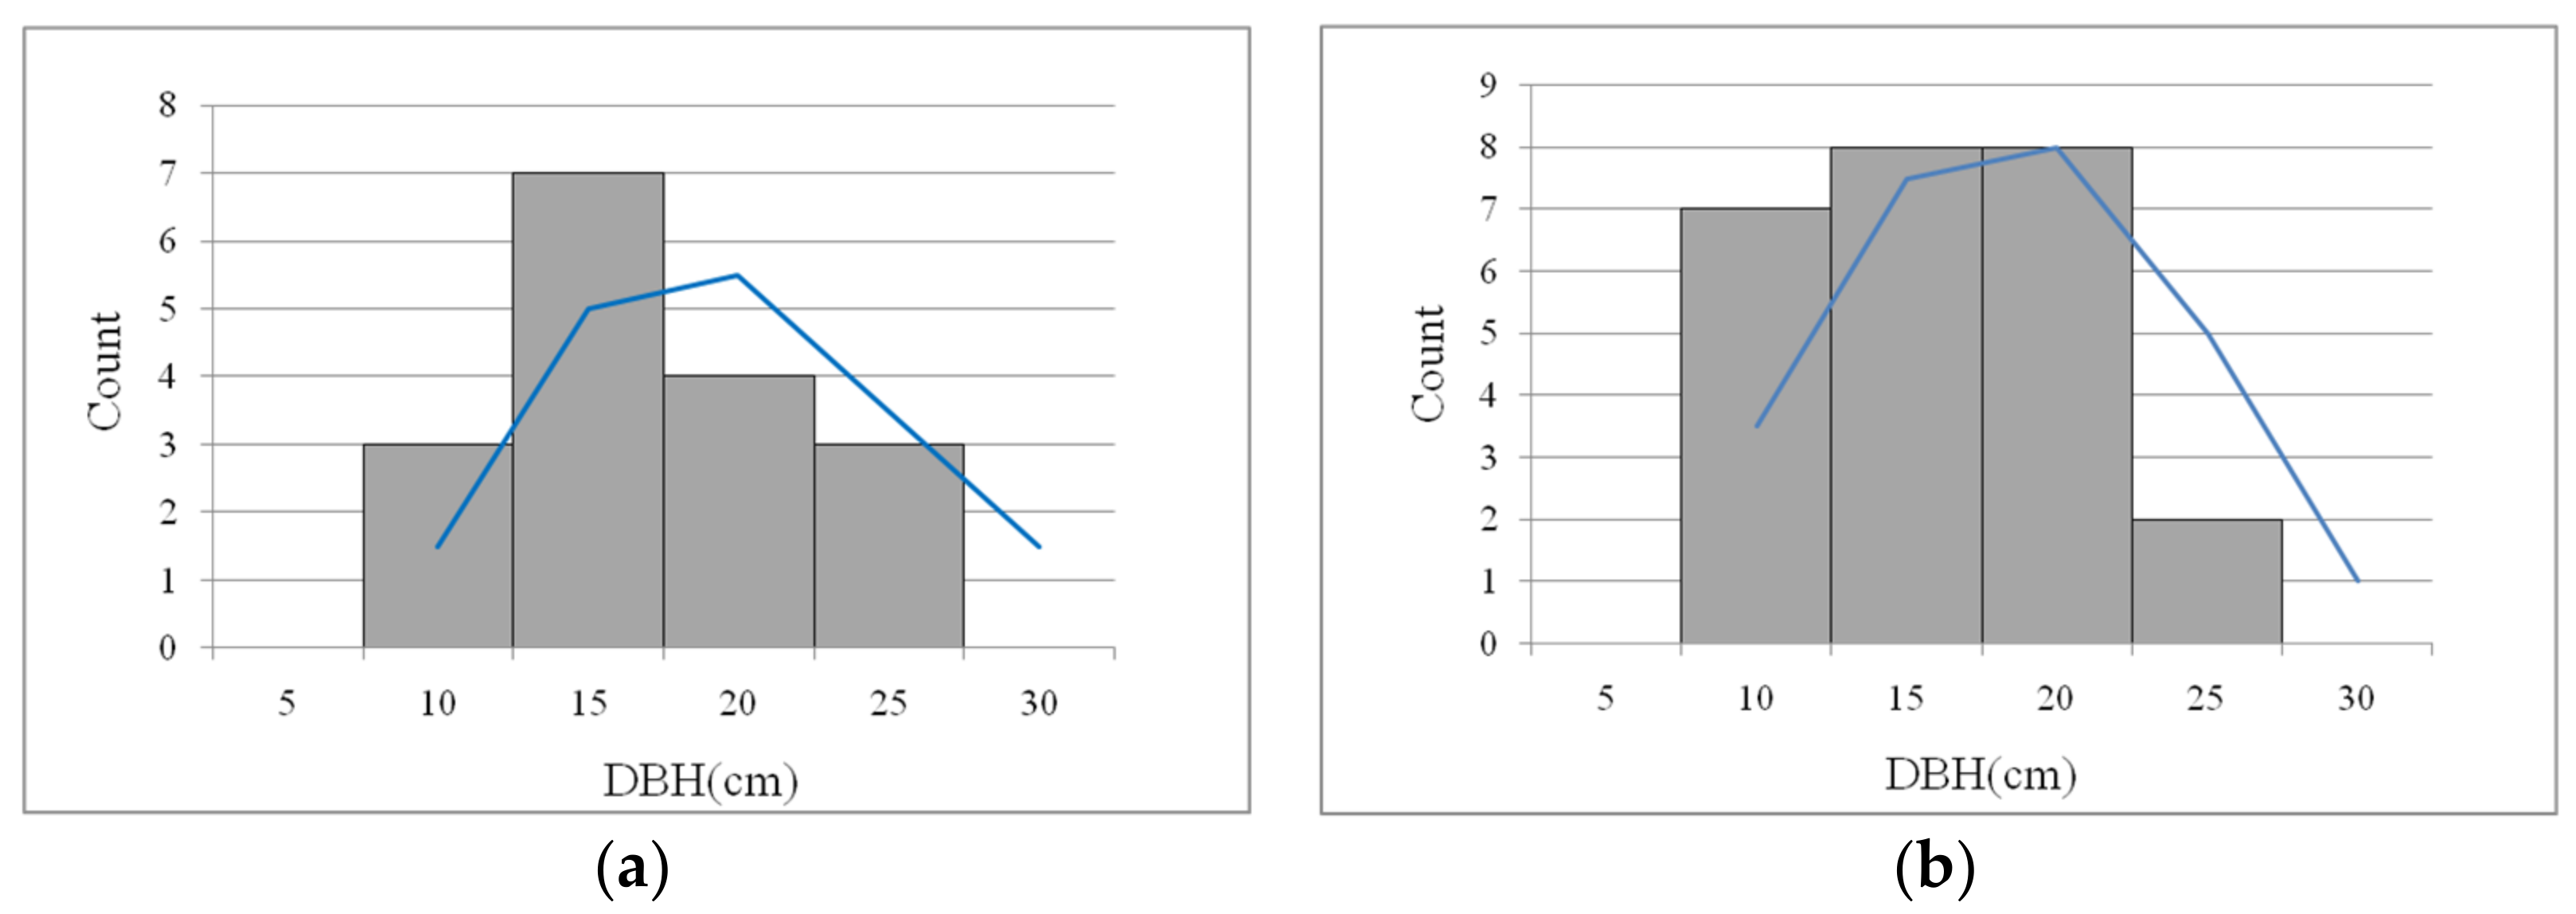
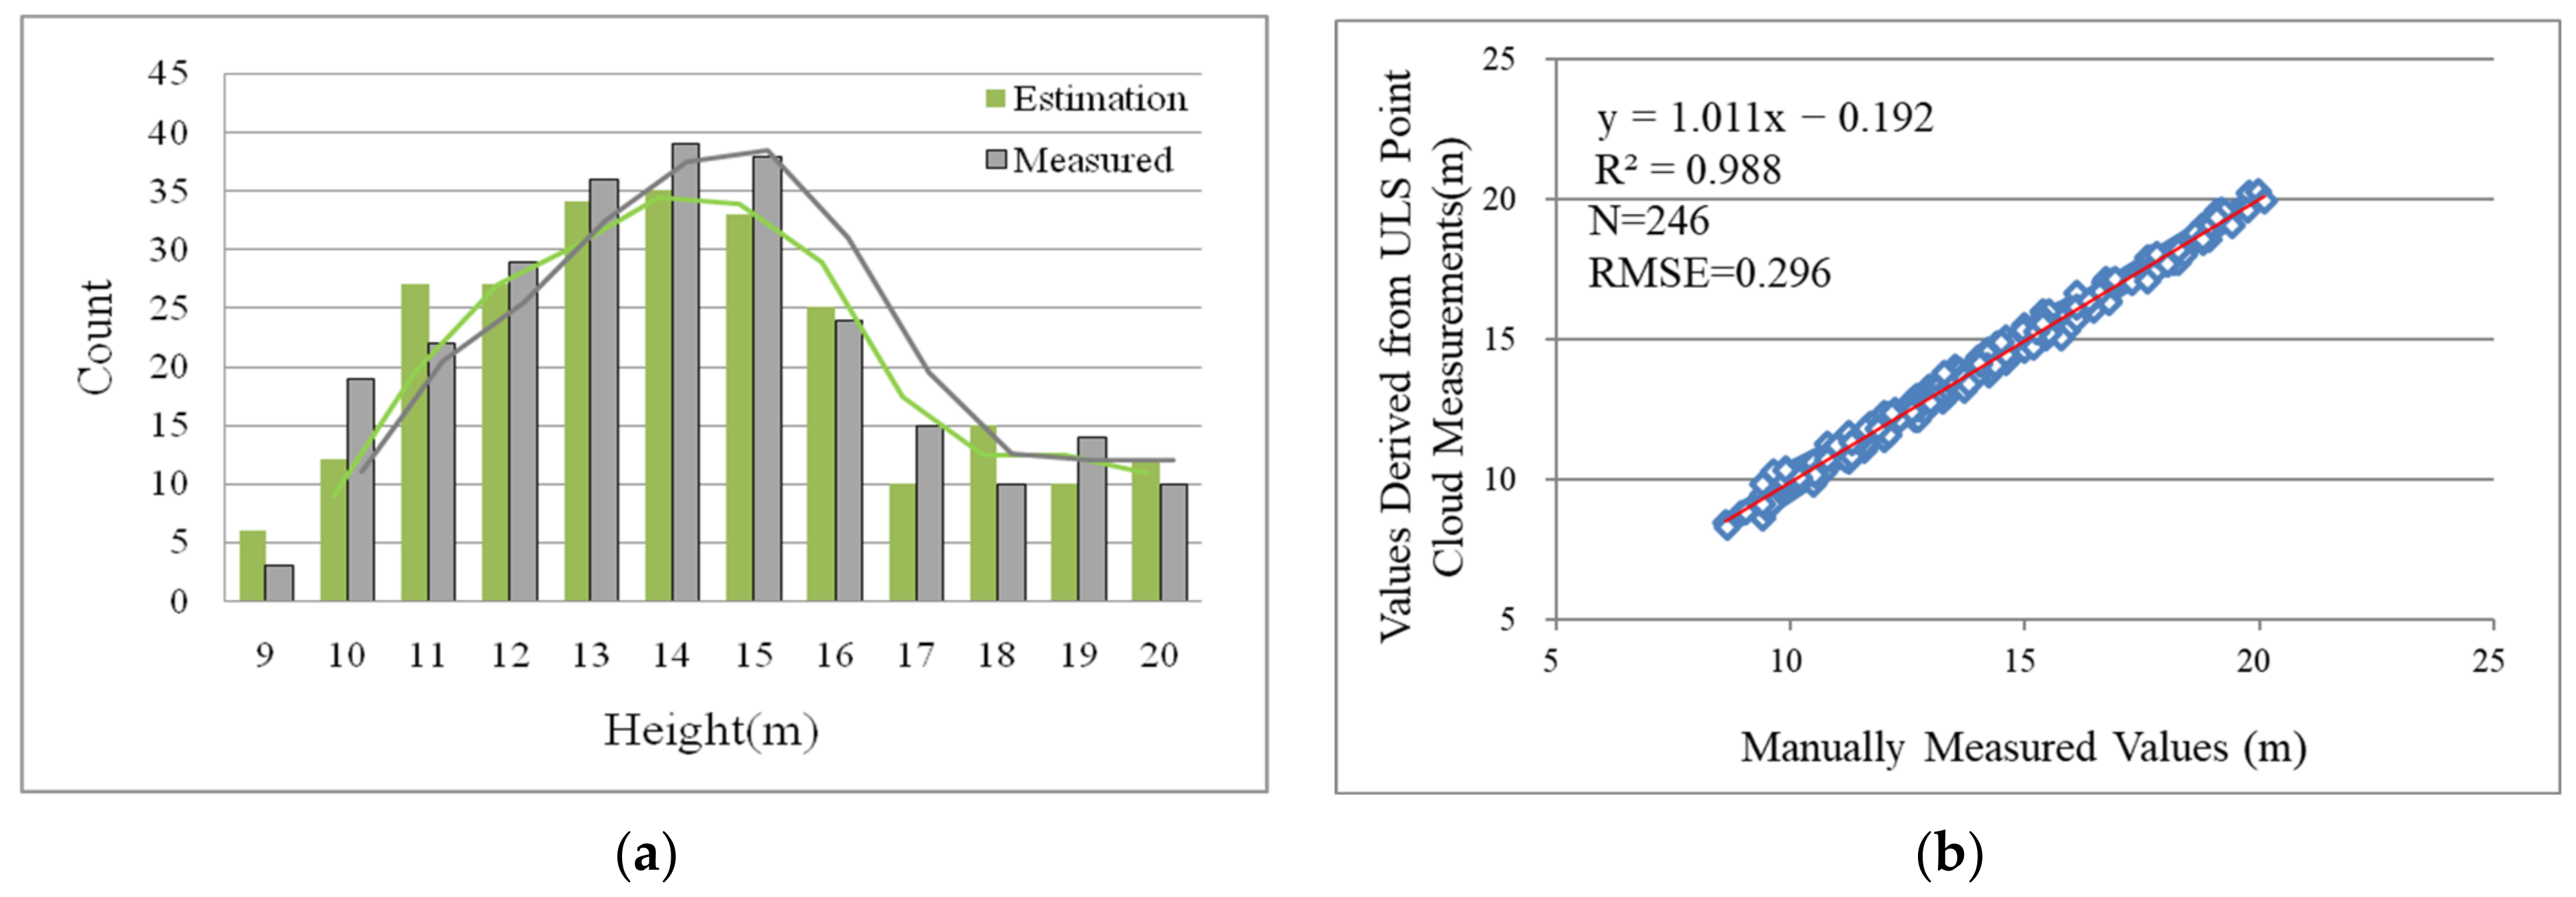
3.1. Experimental Results on Chinese Scots Pine Plot

The segmentation of individual trees from ULS point clouds yielded 246 separate tree point clouds, achieving an accuracy rate of 95%. This high level of accuracy can be attributed to the partial overlap between the plot’s point cloud data and the training data for the segmentation model.
Subsequently, tree height measurements were conducted using all 246 ULS individual tree point clouds obtained through segmentation. The distribution of these measurement results is presented in Figure 12a, and the error analysis comparing these outcomes with field measurements is illustrated in Figure 12b. It is apparent that the precision of tree height estimation using ULS was remarkably high, with a minimal RMSE (root mean square Error) of only 0.296 m and a substantial R2 coefficient of 0.988.
The segmentation of individual trees from TLS point clouds yielded the complete dataset for 17 trees that were surveyed in the field. By employing a single-tree diameter measurement method, we illustrated the discrepancies between the obtained diameters and those measured in the field in Figure 13a. It is evident that single-tree diameter measurements derived from TLS point clouds closely aligned with the field measurements, showcasing a small RMSE (root mean square error) of 1.35 cm and demonstrating a strong linear correlation across the range of tree heights (R2 = 0.966). These findings underscore the high accuracy of diameter measurements acquired from TLS point clouds, approaching the precision of manual measurements.
Among the 246 individual tree point clouds extracted through ULS segmentation within the plot, 117 of them were deemed suitable for diameter measurements. Figure 13b portrays the disparities between these point cloud-based measurements and the corresponding field measurements. Notably, 16 tree point clouds from the ULS dataset were successfully matched with TLS single-tree point clouds, all of which exhibited well-defined trunk point clouds. Figure 14 presents the errors in diameter measurements calculated from these point clouds when compared to field measurements. It is evident that diameter measurements derived from ULS point clouds manifested higher discrepancies in contrast to ground truth measurements, with a RMSE of 2.48 cm, consistent with expectations. However, it is worth noting that for high-density ULS point clouds, if we overlook issues such as occlusion and point cloud gaps resulting from scanning angles, the performance of direct diameter measurements from point cloud data was comparable to established diameter measurement techniques using TLS point clouds.
Direct measurements from ULS point clouds were employed for 117 trees, capturing tree height (H), CD, and DBH. A regression analysis was performed, and subsequently, the DBH of the remaining 129 trees was estimated using the obtained DBH estimation equation, as depicted in Figure 15a. The analysis revealed a relatively modest correlation between the estimated values and the ground truth values, characterized by a RMSE of 4.32 cm.
To enhance accuracy, a correction was applied, utilizing DBH measurements obtained from 16 trees within TLS point clouds that matched corresponding trees. This correction led to the development of a new DBH regression equation, with estimation results showcased in Figure 15b. It is notable that the RMSE decreased by 1.12 cm, signifying a discernible improvement in accuracy.
The summary of diameter measurements for plot trees, obtained through direct measurement methods utilizing TLS point clouds, direct measurement methods employing ULS point clouds, and regression equations corrected using TLS point cloud measurements, is presented in Table 2.
The variation in diameter measurements compared to field-measured values is depicted in Figure 16a. Figure 16b illustrates the errors in plot-level individual tree diameters obtained in comparison to field measurements.

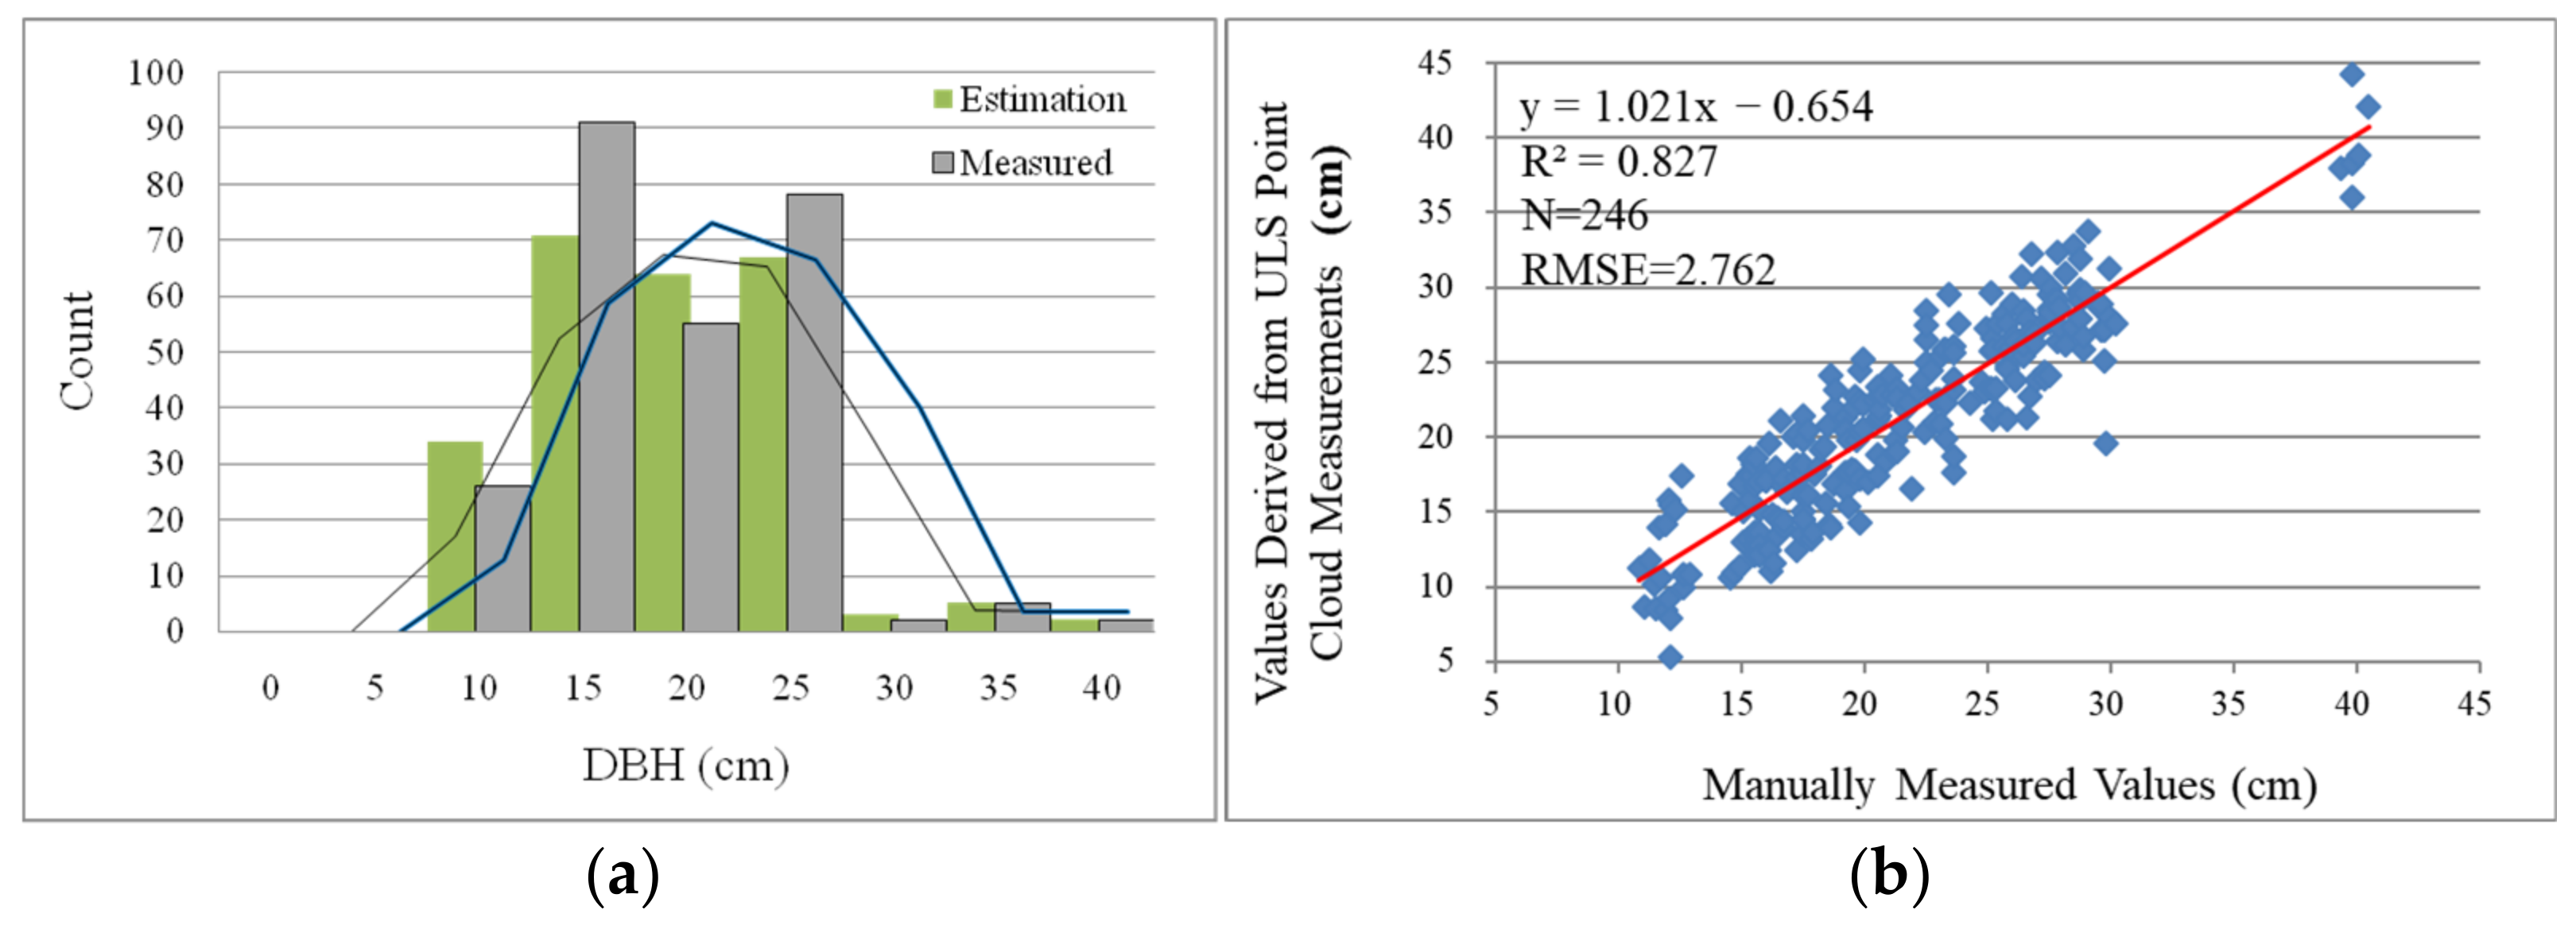
3.2. Experimental Results on Mongolian Oak Plot

The segmentation of individual trees from ULS point clouds yielded 191 individual tree point clouds, with an accuracy rate of 85.6%. This accuracy was influenced by the ULS data collection occurring during the leafy season and the presence of numerous young trees with diameters smaller than 9 cm due to the high tree density. These factors exacerbated occlusion issues, in comparison to the Mongolian oak plot.
Tree height measurements were conducted using all 191 individual tree point clouds obtained through segmentation. The distribution of measurement results is depicted in Figure 17a. Owing to a relatively substantial number of unsegmented individual tree point clouds, there was a notable bias in the average tree height within the 11m range when compared to field measurements. Figure 17b presents an error analysis between the tree heights measured from the 191 individual ULS tree point clouds and the field measurements. It is evident that the tree height values obtained using ULS measurements also exhibited a strong correlation with the ground truth measurements, as indicated by an R2 coefficient of 0.977. However, these measurements displayed a higher degree of error, with a RMSE of 1.116 m.
The segmentation of individual trees from TLS point clouds yielded a complete dataset, comprising point clouds for all 25 trees surveyed in the field. Employing a single-tree diameter measurement method, Figure 18a illustrates the disparities between the diameters obtained and those measured in the field. It is clearly evident that single-tree diameter measurements based on TLS point clouds closely matched the field measurements, demonstrating a relatively small RMSE of 2.196 cm. Furthermore, a robust linear correlation was observed across the entire range of tree heights, with an R2 coefficient of 0.913. This highlights the high accuracy of diameter measurements derived from TLS point clouds, approaching the precision of manual measurements.
From the 191 individual tree point clouds obtained through ULS segmentation in the plot, 144 tree point clouds were suitable for diameter measurements. The discrepancies between these point cloud measurements and field measurements are depicted in Figure 18b. Among them, 21 tree point clouds from ULS were successfully matched with TLS single-tree point clouds, all of which exhibited well-defined trunk point clouds. The errors between the diameter measurements derived from these point clouds and the field measurements are presented in Figure 19. It is noteworthy that the diameter measurements obtained from ULS point clouds showed larger discrepancies compared to the ground truth measurements, with a RMSE of 3.341 cm.
Utilizing direct measurements from ULS point clouds for 144 trees (including tree height H, crown diameter CD, and DBH), we performed a regression analysis. Subsequently, using the derived DBH estimation equation, we estimated the DBH for the remaining 47 trees, as illustrated in Figure 20a.
Following this analysis, it becomes apparent that the correlation between the estimated values and the ground truth values was relatively modest, with a RMSE (root mean square error) reaching 4.32 cm.
In pursuit of heightened accuracy, a correction was employed, utilizing the DBH measurements derived from 16 trees within TLS point clouds that corresponded with ULS point clouds. This correction led to the formulation of a fresh DBH regression equation, and the resulting estimations are showcased in Figure 20b. Evidently, the RMSE decreased by 1.12 cm, indicating a significant enhancement in precision.
Upon aggregating the diameter measurements for plot trees through direct measurement methods from TLS point clouds, direct measurement methods from ULS point clouds, and regression equations adjusted based on TLS point cloud measurements, the statistical parameters for structural attributes of plot trees are detailed in Table 3.
The discrepancy in the distribution of obtained diameter measurements compared to field-measured diameters is visualized in Figure 21a. Figure 21b illustrates the errors between the diameter measurements of individual trees at the plot level and the corresponding field measurements.

4. Discussion

This study demonstrated the automation and efficiency of the proposed method through independent experiments conducted in two distinct plots. A noteworthy innovation lies in the achievement of large-scale tree modeling and calibration with minimal manual adjustment of model parameters.

4.1. Selection of Experimental Plots

To validate the effectiveness of the automated modeling method, two different types of artificial forests, coniferous and broadleaf, were chosen as experimental plots. Field measurements of tree height and diameter at breast height were conducted for trees with diameters exceeding 9 cm in these plots, both manually and automatically. The homogeneity of tree species within the plots and favorable ground conditions provided an ideal environment for the experiments. However, this setup led to idealized experimental outcomes with generally elevated performance across various metrics. It is crucial to emphasize that this work primarily focused on constructing an automated measurement workflow for large-scale plots. The primary objective of the experiments was to showcase the potential of this automated workflow as a substitute for manual operations. Therefore, favorable experimental results do not necessarily indicate the localized performance of specific models or computational processes, nor do they validate that the models and algorithms involved can achieve high estimation accuracy for all types of forest stands.

4.2. Tree Height Measurement Performance Based on ULS Point Clouds

The experiments yielded tree height measurement results based on ULS point clouds. The high quality of the DEM and canopy point clouds resulted in remarkably accurate tree height measurements using ULS. For the Chinese Scots pine plot, the RMSE (root mean square error) for tree height measurements was only 0.296 m, with an R2 coefficient of 0.988. The R2 coefficient for the Mongolian oak plot reached 0.977. However, the RMSE was higher, at 1.116 m, for the Mongolian oak plot. This discrepancy is primarily attributed to the fact that the Mongolian oak trees in the plot tend to lean or have some degree of curvature, and the point cloud data were acquired during the leafy season. Nonetheless, overall, tree height measurements based on ULS point clouds prove to be a viable substitute for manual operations in both plots.

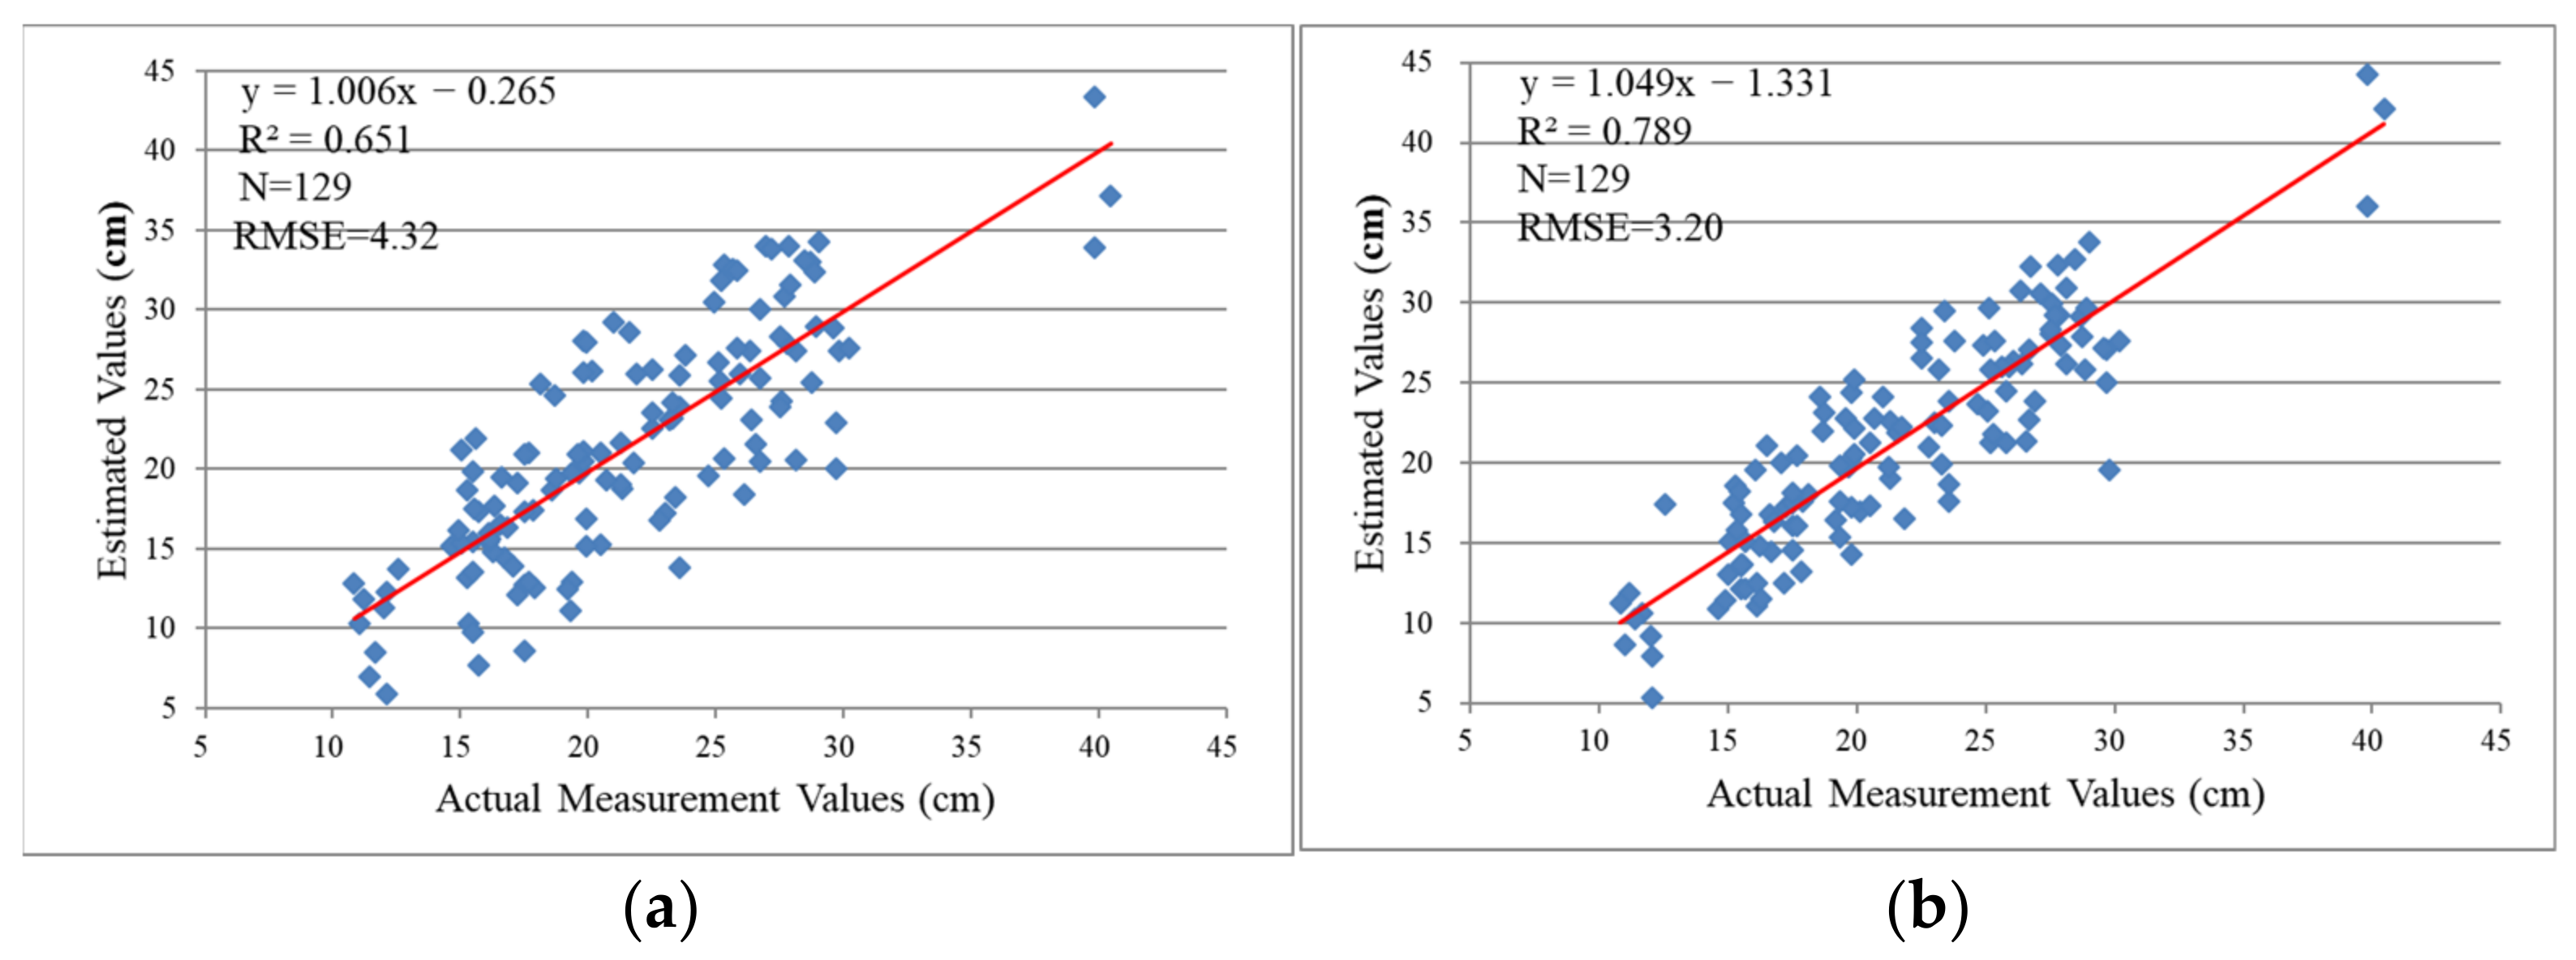
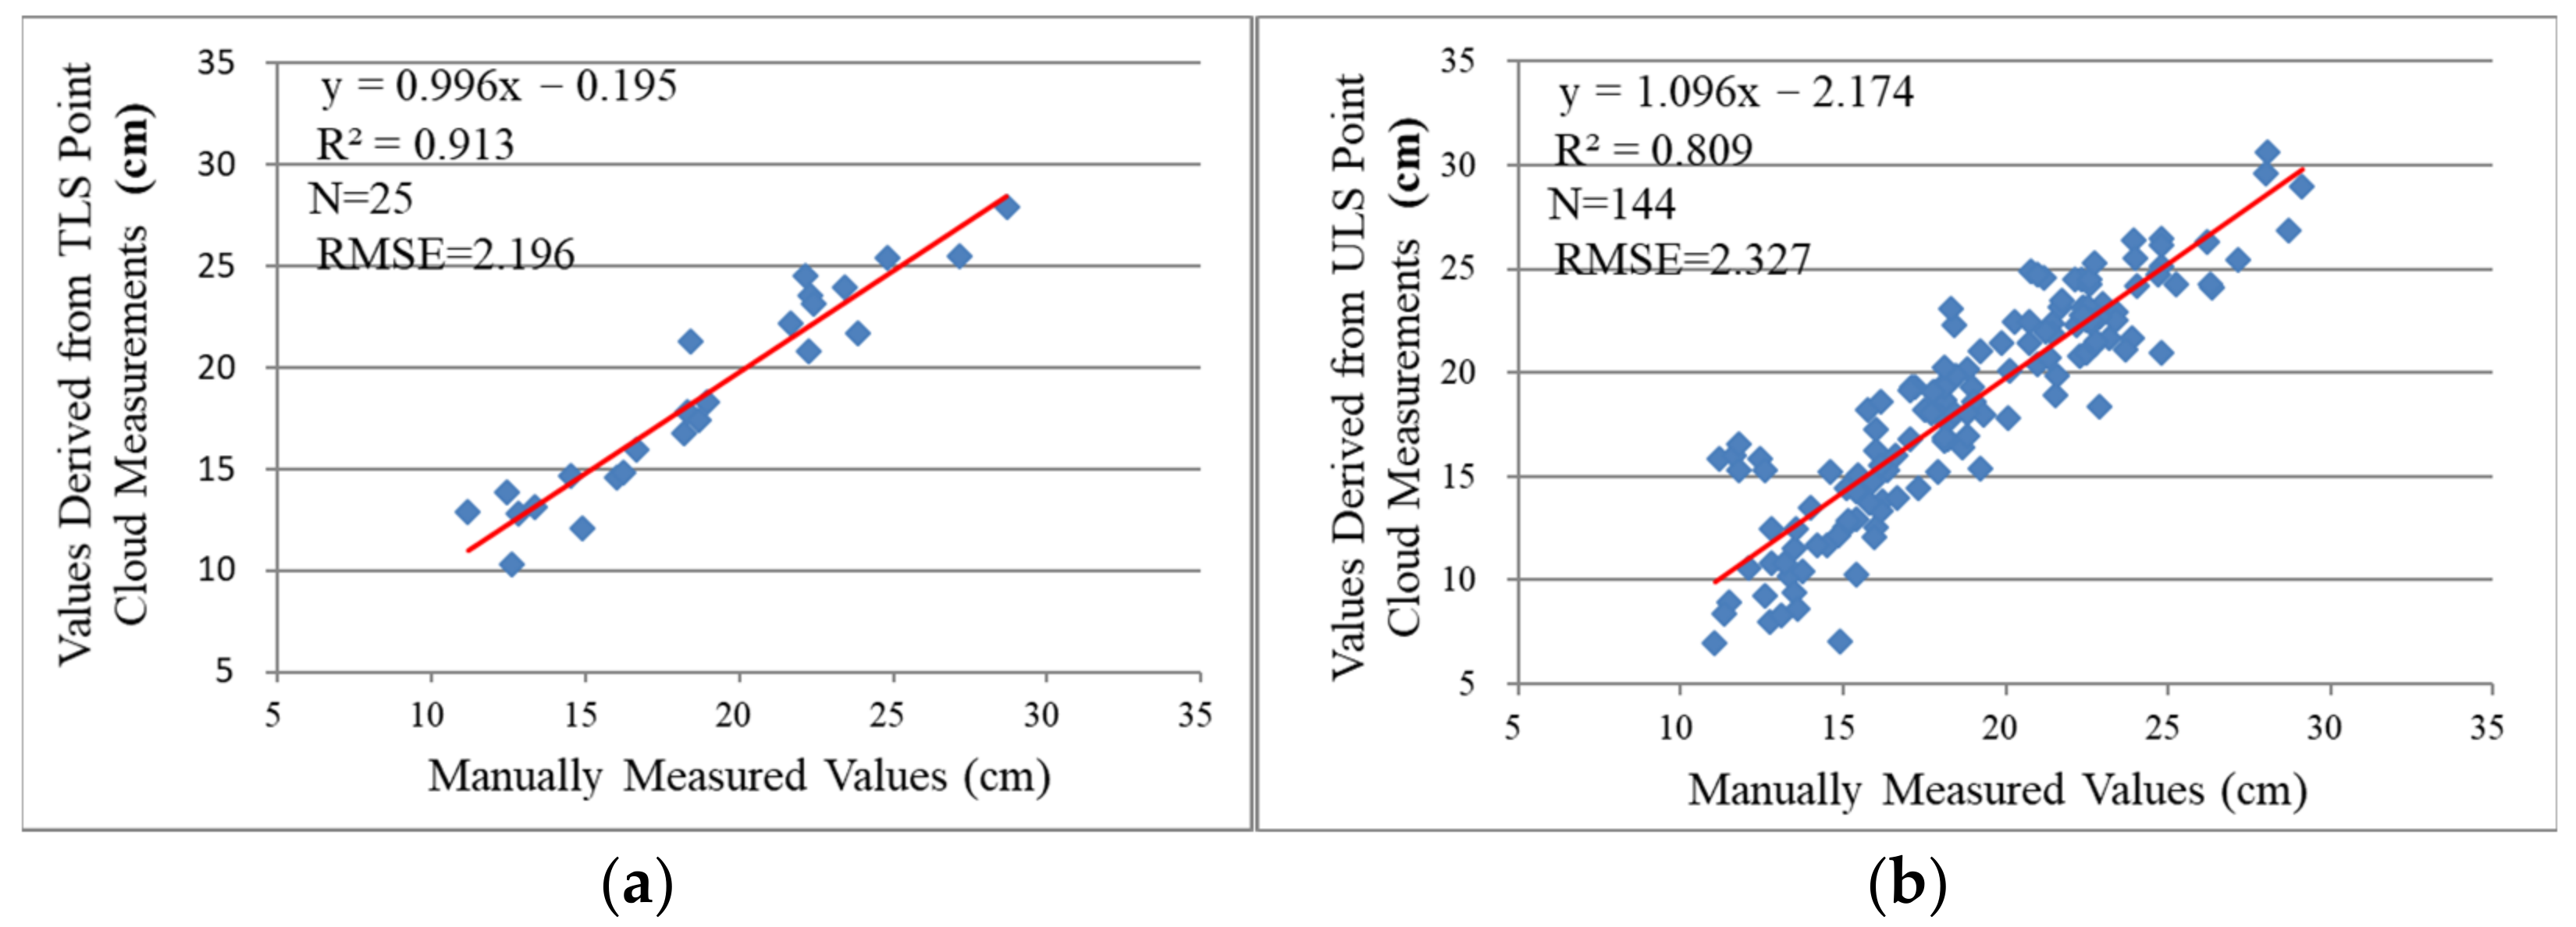
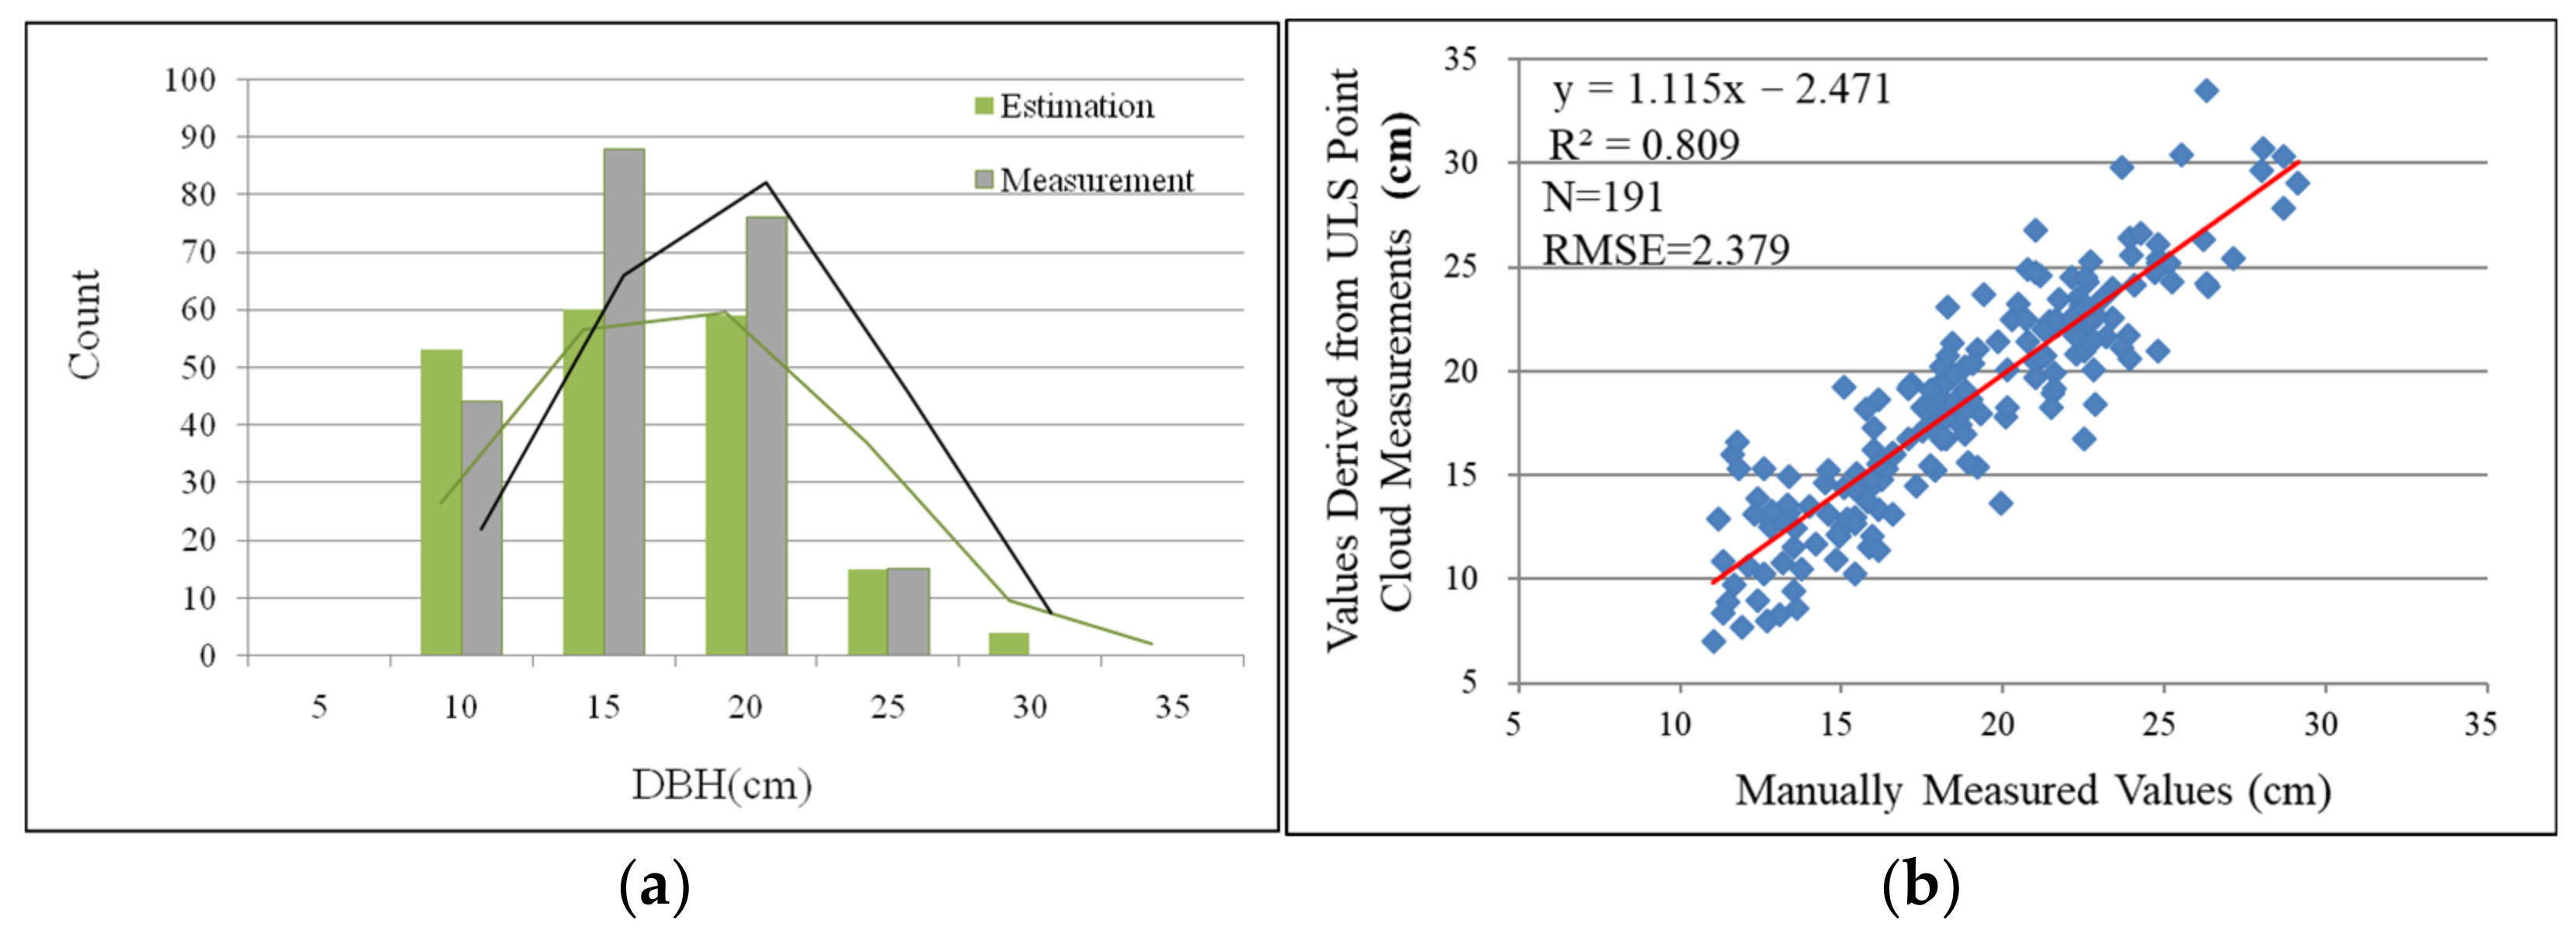
4.3. Diameter Measurement and Estimation Performance

The single-tree diameter measurement method based on TLS point clouds is well-established and demonstrates accuracy nearly equivalent to manual field measurements, especially when the quality of trunk point clouds is high. The results obtained in our experiments substantiate this claim. We achieved a high level of measurement precision for both the Chinese Scots pine plot (RMSE = 1.35 cm, R2 = 0.966) and the Mongolian oak plot (RMSE = 2.196 cm, R2 = 0.913). It is noteworthy that the diameter measurements for the Mongolian oak plot remained somewhat lower than those for the Chinese Scots pine plot, as depicted in Figure 16a. This discrepancy can be attributed to significant errors in the diameter measurements of three trees in the Mongolian oak plot, likely due to trunk curvature or partial occlusion at the measurement positions.
In contrast, diameter measurements obtained directly from ULS point clouds exhibit larger discrepancies compared to measurements acquired from TLS point clouds. For the Chinese Scots pine plot, the RMSE between point cloud measurements and field measurements is 2.48 cm, with an R2 of 0.875. In the case of the Mongolian oak plot, these values are RMSE = 3.341 cm and R2 = 0.809. Considering the relatively small average diameters (the average diameter for a Chinese Scots pine is 21.50 cm, and for a Mongolian oak it is 18.88 cm), the accuracy of diameter measurements directly from ULS point clouds is around 90%. Given the lower linear correlation between point cloud measurements and field measurements, there is room for improvement in the direct diameter estimation method from ULS point clouds. Furthermore, considering the lower proportion of usable trunk information available for diameter measurement from ULS point clouds, large-scale direct diameter measurement from extensive ULS point clouds remains unfeasible at present. Therefore, accurate modeling of diameter prediction equations becomes particularly crucial.

4.4. Diameter Prediction Performance Based on Point Cloud Measurement Data

In the process of large-scale forest parameter estimation using ULS point clouds, the automatic generation of diameter regression equations is crucial for the overall generalizability of the automated measurement workflow. Given the relatively high errors associated with diameter measurements obtained directly from ULS point clouds, relying solely on these measurements to establish dynamic diameter prediction regression equations for the plot can lead to substantial inaccuracies. This was demonstrated through experiments conducted in both the Chinese Scots pine and Mongolian oak plots. In the Chinese Scots pine plot experiment, a regression equation for diameter estimation was formulated using parameters (tree height, crown diameter, and diameter at breast height) directly measured from ULS point clouds for 117 trees. Subsequently, this equation was employed to estimate the DBH of the remaining 129 trees, resulting in a relatively weak correlation between estimates and ground truth values, with an R2 of only 0.651 and a RMSE of 4.32 cm. Similar findings were observed in the Mongolian oak plot, where parameters directly measured from ULS point clouds for 144 trees were utilized in the regression process. The estimated values for the remaining 47 trees also exhibited a limited correlation with the ground truth values, with an R2 of only 0.608 and a RMSE of 4.278 cm.
The introduction of the proposed diameter prediction equation, based on TLS point cloud measurement data with weighted regression correction, yielded substantial improvements in diameter estimation results. In the Chinese Scots pine plot, the estimated values exhibited an R2 of 0.789 and a RMSE of 3.20 when compared to ground truth values. Similarly, in the Mongolian oak plot, the prediction results demonstrated an enhanced correlation with ground truth values, achieving an R2 of 0.761 and a RMSE of 3.101 cm. These findings suggest that within the diameter prediction equation regression process, the judicious integration of small-sample TLS measurement results with large-sample ULS measurement results, through weighted fusion, can effectively enhance the accuracy of dynamically generated plot tree diameter prediction equations. When employing ULS point clouds for extensive forest structural parameter estimations, the combined utilization of ULS and TLS point clouds stands as a fundamental approach for achieving process automation.
Table 2 and Table 3 present the final measurement results for the two plots. The errors in mean and median tree height measurements using ULS point clouds for both plots were approximately 10 cm, with maximum errors reaching about 20 cm. However, an analysis of the minimum value measurements reveals significant underestimations for some trees in both plots. This suggests that when measuring tree height using ULS point clouds, there can be notable deviations for shorter trees, primarily stemming from over-segmentation of the point clouds during the extraction process. Similar trends were observed in the measurement results for tree diameter, with conspicuous disparities in the estimation of minimum diameter values compared to ground truth measurements, particularly for smaller-diameter trees, resulting in suboptimal estimation outcomes.

5. Conclusions

In this experiment, two objectives were accomplished. One was the automatic extraction process of forest structure parameters using point clouds. Another approach was to improve the accuracy of tree diameter prediction equations by utilizing the complementarity of point clouds from different sources.
First, ULS point clouds, as a sophisticated tool for forest surveys, hold significant potential in the domain of automated and intelligent forest management. The automated workflow proposed in this paper, leveraging extensive forest point clouds for the automated extraction of quantitative structural parameters, facilitates the computation of stand-level tree height, crown diameter, and diameter at breast height with minimal manual parameter adjustments. This approach is aptly tailored to fulfill practical application requirements. Experimental results underscore the method’s ability to deliver precise estimations of tree height and DBH, showcasing its substantial advantages for subsequent tasks such as biomass estimation. While this study concentrated on small plot sizes of 50 m × 50 m due to computational constraints, its capacity can be expanded through the segmentation of large-scale plot point clouds.
Second, the experimental results from the Chinese Scots pine and Mongolian oak plots demonstrated that employing the chest diameter prediction equation proposed in this paper, which is rectified by weighted regression based on TLS point cloud measurement data, can effectively ameliorate the accuracy of chest diameter estimation based on ULS point clouds. This suggests that it is feasible to address the accuracy issue caused by the truncation of tree trunks in ULS point clouds by utilizing ground-based radar point clouds during the regression process of the chest diameter prediction equation. This provides a viable technical route for conducting extensive forest structural parameter estimations, in conjunction with ULS and TLS, mobile laser scanning, personal laser scanning, and photogrammetry.
While the automated measurement method presented in this paper primarily computes parameters such as tree height, crown width, and DBH, it can readily be extended to encompass calculations of factors like total biomass for a given plot. The accuracy of large-scale tree modeling methods hinges not only on the precision of the local algorithms employed but also on the forest’s structure and the quality of the point cloud data. Enhancing the automatic measurement capabilities of forest quantitative structural parameters remains a formidable challenge. Addressing these challenges in practical applications necessitates more extensive testing, validation, and algorithm development. Further research is essential, but this approach opens up substantial possibilities for the practical utilization of forest remote sensing. For example, it can be employed to directly estimate volume and biomass from point clouds at the plot level, serving as foundational data for carbon storage calculations. Moreover, this method can function as a source of ground reference (true) data for calibrating forest aerial measurements.

Author Contributions

Methodology, D.X.; resources, G.C.; software, D.X. and S.Z.; writing, D.X; format calibration, G.C. and W.J. All authors have read and agreed to the published version of the manuscript.

Funding

This research was funded by the National Natural Science Foundation of China (No. 32271865).

Data Availability Statement

The data presented in this study are available on request from the corresponding author. The data are not publicly available due to them also being necessary for use in future research.

Conflicts of Interest

The authors declare no conflict of interest.

Correction Statement

This article has been republished with a minor correction to resolve spelling and grammatical errors. This change does not affect the scientific content of the article.

References

  1. Liu, J.; Hyyppä, J.; Yu, X.; Jaakkola, A.; Kukko, A.; Kaartinen, H.; Zhu, L.; Liang, X.; Wang, Y.; Hyyppä, H. A novel GNSS technique for predicting boreal forest attributes at low cost. IEEE Trans. Geosci. Remote Sens. 2017, 55, 4855–4867. [Google Scholar] [CrossRef]
  2. Zasada, M.; Sterenczak, K.; Dudek, W.M.; Rybski, A. Horizon Visibility and Accuracy of Stocking Determination on Circular Sample Plots Using Automated Remote Measurement Techniques. For. Ecol. Manag. 2013, 302, 171–177. [Google Scholar] [CrossRef]
  3. Wężyk, P.; Hawryło, P.; Szostak, M.; Zięba-Kulawik, K.; Winczek, M.; Siedlarczyk, E.; Kurzawiński, A.; Rydzyk, J.; Kmiecik, J.; Gilewski, W.; et al. Using LiDAR Point Clouds in Determination of the Scots Pine Stands Spatial Structure Meaning in the Conservation of Lichen Communities in “Bory Tucholskie” National Park. Arch. Photogramm. Cartogr. Remote Sens. 2019, 31, 85–103. [Google Scholar] [CrossRef]
  4. Wang, R.; Xu, Y.; Sotelo, M.A.; Ma, Y.; Sarkodie-Gyan, T.; Li, Z.; Li, W. A Robust Registration Method for Autonomous Driving Pose Estimation in Urban Dynamic Environment Using LiDAR. Electronics 2019, 8, 43. [Google Scholar] [CrossRef]
  5. Dassot, M.; Colin, A.; Santenoise, P.; Fournier, M.; Constant, T. Terrestrial laser scanning for measuring the solid wood volume, including branches, of adult standing trees in the forest environment. Comput. Electron. Agric. 2012, 89, 86–93. [Google Scholar] [CrossRef]
  6. Disney, M.I.; Boni Vicari, M.; Burt, A.; Calders, K.; Lewis, S.L.; Raumonen, P.; Wilkes, P. Weighing trees with lasers: Advances, challenges and opportunities. Interface Focus 2018, 8, 20170048. [Google Scholar] [CrossRef]
  7. Næsset, E.; Gobakken, T.; Solberg, S.; Gregoire, T.G.; Nelson, R.; Ståhl, G.; Weydahl, D. Model-assisted regional forest biomass estimation using LiDAR and InSAR as auxiliary data: A case study from a boreal forest area. Remote Sens. Environ. 2011, 115, 3599–3614. [Google Scholar] [CrossRef]
  8. Tauri, A.; Lang, M. Estimation of canopy cover in dense mixed-species forests using airborne lidar data. Eur. J. Remote Sens. 2018, 51, 132–141. [Google Scholar]
  9. Smith, A.M.; Falkowski, M.J.; Hudak, A.T.; Evans, J.S.; Robinson, A.P.; Steele, C.M. A cross-comparison of field, spectral, and lidar estimates of forest canopy cover. Can. J. Remote Sens. 2009, 35, 447–459. [Google Scholar] [CrossRef]
  10. Bruggisser, M.; Hollaus, M.; Otepka, J.; Pfeifer, N. Influence of ULS acquisition characteristics on tree stem parameter estimation. ISPRS J. Photogramm. Remote Sens. 2020, 168, 28–40. [Google Scholar] [CrossRef]
  11. Liu, G.; Wang, J.; Dong, P.; Chen, Y.; Liu, Z. Estimating Individual Tree Height and Diameter at Breast Height (DBH) from Terrestrial Laser Scanning (TLS) Data at Plot Level. Forests 2018, 9, 398. [Google Scholar] [CrossRef]
  12. Bouvier, M.; Durrieu, S.; Fournier, R.A.; Renaud, J.P. Generalizing predictive models of forest inventory attributes using an area-based approach with airborne LiDAR data. Remote Sens. Environ. 2015, 156, 322–334. [Google Scholar] [CrossRef]
  13. Vastaranta, M.; Yrttimaa, T.; Saarinen, N.; Yu, X.; Karjalainen, M.; Nurminen, K.; Karila, K.; Kankare, V.; Luoma, V.; Pyörälä, J.; et al. Airborne Laser Scanning Outperforms the Alternative 3D Techniques in Capturing Variation in Tree Height and Forest Density in Southern Boreal Forests. Balt. For. 2018, 24, 268–277. [Google Scholar]
  14. Naesset, E. Predicting forest stand characteristics with airborne scanning laser using a practical two-stage procedure and field data. Remote Sens. Environ. 2002, 80, 88–99. [Google Scholar] [CrossRef]
  15. Mokroš, M.; Mikita, T.; Singh, A.; Tomaštík, J.; Chudá, J.; Wężyk, P.; Kuželka, K.; Surový, P.; Klimánek, M.; Zięba-Kulawik, K.; et al. Novel Low-Cost Mobile Mapping Systems for Forest Inventories as Terrestrial Laser Scanning Alternatives. Int. J. Appl. Earth Obs. Geoinf. 2021, 104, 102512. [Google Scholar] [CrossRef]
  16. Gollob, C.; Ritter, T.; Kraßnitzer, R.; Tockner, A.; Nothdurft, A. Measurement of Forest Inventory Parameters with Apple IPad Pro and Integrated LiDAR Technology. Remote Sens. 2021, 13, 3129. [Google Scholar] [CrossRef]
  17. Henning, J.G.; Radtke, P.J. Detailed stem measurements of standing trees from ground-based scanning Lidar. For. Sci. 2006, 52, 67–80. [Google Scholar]
  18. Maas, H.G.; Bienert, A.; Scheller, S.; Keane, E. Automatic forest inventory parameter determination from terrestrial laser scanner data. Int. J. Remote Sens. 2008, 29, 1579–1593. [Google Scholar] [CrossRef]
  19. Liang, X.; Litkey, P.; Hyyppa, J.; Kaartinen, H.; Vastaranta, M.; Holopainen, M. Automatic Stem Mapping Using Single-Scan Terrestrial Laser Scanning. IEEE Trans. Geosci. Remote Sens. 2012, 50, 661–670. [Google Scholar] [CrossRef]
  20. Donager, J.J.; Sankey, T.T.; Sankey, J.B.; Sanchez Meador, A.J.; Springer, A.E.; Bailey, J.D. Examining Forest Structure with Terrestrial Lidar: Suggestions and Novel Techniques Based on Comparisons Between Scanners and Forest Treatments. Earth Space Sci. 2018, 5, 753–776. [Google Scholar] [CrossRef]
  21. Liang, X.; Wang, Y.; Jaakkola, A.; Kukko, A.; Kaartinen, H.; Hyyppä, J.; Honkavaara, E.; Liu, J. Forest Data Collection Using Terrestrial Image-Based Point Clouds from a Handheld Camera Compared to Terrestrial and Personal Laser Scanning. IEEE Trans. Geosci. Remote Sens. 2015, 53, 5117–5132. [Google Scholar] [CrossRef]
  22. Stovall, A.E.L.; Shugart, H.H. Improved Biomass Calibration and Validation with Terrestrial LiDAR: Implications for Future LiDAR and SAR Missions. IEEE J. Sel. Top. Appl. Earth Obs. Remote Sens. 2018, 11, 3527–3537. [Google Scholar] [CrossRef]
  23. Krisanski, S.; Taskhiri, M.; Turner, P. Enhancing Methods for Under-Canopy Unmanned Aircraft System Based Photogrammetry in Complex Forests for Tree Diameter Measurement. Remote Sens. 2020, 12, 1652. [Google Scholar] [CrossRef]
  24. Stovall, A.E.; Vorster, A.G.; Anderson, R.S.; Evangelista, P.H.; Shugart, H.H. Non-destructive aboveground biomass estimation of coniferous trees using terrestrial LiDAR. Remote Sens. Environ. 2017, 200, 31–42. [Google Scholar] [CrossRef]
  25. Wilkes, P.; Lau, A.; Disney, M.; Calders, K.; Burt, A.; de Tanago, J.G. Data acquisition considerations for Terrestrial Laser Scanning of forest plots. Remote Sens. Environ. 2017, 196, 140–153. [Google Scholar] [CrossRef]
  26. Saarinen, N.; Kankare, V.; Vastaranta, M.; Luoma, V.; Pyörälä, J.; Tanhuanpää, T.; Liang, X.; Kaartinen, H.; Kukko, A.; Jaakkola, A.; et al. Feasibility of Terrestrial laser scanning for collecting stem volume information from single trees. ISPRS J. Photogramm. Remote Sens. 2017, 123, 140–158. [Google Scholar] [CrossRef]
  27. Liang, X.; Kankare, V.; Hyyppä, J.; Wang, Y.; Kukko, A.; Haggrén, H.; Yu, X.; Kaartinen, H.; Jaakkola, A.; Guan, F.; et al. Terrestrial laser scanning in forest inventories. ISPRS J. Photogramm. Remote Sens. 2016, 115, 63–77. [Google Scholar] [CrossRef]
  28. Schneider, F.D.; Kükenbrink, D.; Schaepman, M.E.; Schimel, D.S.; Morsdorf, F. Quantifying 3D structure and occlusion in dense tropical and temperate forests using close-range LiDAR. Agric. For. Meteorol. 2019, 268, 249–257. [Google Scholar] [CrossRef]
  29. Yrttimaa, T.; Saarinen, N.; Kankare, V.; Viljanen, N.; Hynynen, J.; Huuskonen, S.; Holopainen, M.; Hyyppä, J.; Honkavaara, E.; Vastaranta, M. Multisensorial Close-Range Sensing Generates Benefits for Characterization of Managed Scots Pine (Pinus sylvestris L.). Stands. Int. J. Geo-Inf. 2020, 9, 309. [Google Scholar] [CrossRef]
  30. Liang, X.; Wang, Y.; Pyörälä, J.; Lehtomäki, M.; Yu, X.; Kaartinen, H.; Kukko, A.; Honkavaara, E.; Issaoui, A.E.; Nevalainen, O.; et al. Forest in situ observations using unmanned aerial vehicle as an alternative of terrestrial measurements. For. Ecosyst. 2019, 6, 20. [Google Scholar] [CrossRef]
  31. Wallace, L.; Musk, R.; Lucieer, A. An Assessment of the Repeatability of Automatic Forest Inventory Metrics Derived From UAV-Borne Laser Scanning Data. IEEE Trans. Geosci. Remote Sens. 2014, 52, 7160–7169. [Google Scholar] [CrossRef]
  32. Balsi, M.; Esposito, S.; Fallavollita, P.; Nardinocchi, C. Single-tree detection in high-density LiDAR data from UAV-based survey. Eur. J. Remote Sens. 2018, 51, 679–692. [Google Scholar] [CrossRef]
  33. Wallace, L.; Lucieer, A.; Watson, C.S. Evaluating Tree Detection and Segmentation Routines on Very High Resolution UAV LiDAR Data. IEEE Trans. Geosci. Remote Sens. 2014, 52, 7619–7628. [Google Scholar] [CrossRef]
  34. Wieser, M.; Mandlburger, G.; Hollaus, M.; Otepka, J.; Glira, P.; Pfeifer, N. A Case Study of UAS Borne Laser Scanning for Measurement of Tree Stem Diameter. Remote Sens. 2017, 9, 1154. [Google Scholar] [CrossRef]
  35. Brede, B.; Calders, K.; Lau, A.; Raumonen, P.; Bartholomeus, H.M.; Herold, M.; Kooistra, L. Non-destructive tree volume estimation through quantitative structure modelling: Comparing UAV laser scanning with terrestrial LIDAR. Remote Sens. Environ. 2019, 233, 111355. [Google Scholar] [CrossRef]
  36. Cao, L. Individual Tree Structural Parameter Extraction and Volume Table Creation Based on Near-Field LiDAR Data: A Case Study in a Subtropical Planted Forest. Sensors 2021, 21, 8162. [Google Scholar]
  37. Fekry, R.; Yao, W.; Cao, L.; Shen, X. Ground-based/UAV-LiDAR data fusion for quantitative structure modeling and tree parameter retrieval in subtropical planted forest. For. Ecosyst. 2022, 9, 18. [Google Scholar] [CrossRef]
  38. Terryn, L.; Calders, K.; Bartholomeus, H.; Bartolo, R.E.; Brede, B.; D’hont, B.; Disney, M.; Herold, M.; Lau, A.; Shenkin, A.; et al. Quantifying tropical forest structure through terrestrial and UAV laser scanning fusion in Australian rainforests. Remote Sens. Environ. 2022, 271, 112912. [Google Scholar] [CrossRef]
  39. Mandlburger, G.; Kölle, M.; Pöppl, F.; Cramer, M. EVALUATION OF CONSUMER-GRADE AND SURVEY-GRADE UAV-LIDAR. Int. Arch. Photogramm. Remote Sens. Spatial Inf. Sci. 2023, 48, 99–106. [Google Scholar] [CrossRef]
  40. Cai, S.; Zhang, W.; Liang, X.; Wan, P.; Qi, J.; Yu, S.; Yan, G.; Shao, J. Filtering Airborne LiDAR Data Through Complementary Cloth Simulation and Progressive TIN Densification Filters. Remote Sens. 2019, 11, 1037. [Google Scholar] [CrossRef]
  41. Windrim, L.; Bryson, M. Detection, Segmentation, and Model Fitting of Individual Tree Stems from Airborne Laser Scanning of Forests Using Deep Learning. Remote Sens. 2020, 12, 1469. [Google Scholar] [CrossRef]
  42. He, K.; Zhang, X.; Ren, S.; Sun, J. Deep residual learning for image recognition. In Proceedings of the IEEE Conference on Computer Vision and Pattern Recognition, Las Vegas, NV, USA, 27–30 June 2016; pp. 770–778. [Google Scholar]
  43. Ren, S.; He, K.; Girshick, R.; Sun, J. Faster R-CNN: Towards Real-Time Object Detection with Region Proposal Networks. IEEE Trans. Pattern Anal. Mach. Intell. 2017, 39, 1137–1149. [Google Scholar] [CrossRef]
  44. Qi, C.R.; Su, H.; Mo, K.; Guibas, L.J. PointNet: Deep Learning on Point Sets for 3D Classification and Segmentation. In Proceedings of the IEEE Conference on Computer Vision and Pattern Recognition, Honolulu, HI, USA, 21–27 July 2017; pp. 77–85. [Google Scholar]
  45. Brede, B.; Terryn, L.; Barbier, N.; Bartholomeus, H.M.; Bartolo, R.; Calders, K.; Derroire, G.; Moorthy, S.M.K.; Lau, A.; Levick, S.R.; et al. Non-destructive estimation of individual tree biomass: Allometric models, terrestrial and UAV laser scanning. Remote Sens. Environ. Interdiscip. J. 2022, 280, 113180. [Google Scholar] [CrossRef]
  46. Du, S.; Lindenbergh, R.; Ledoux, H.; Stoter, J.; Nan, L. AdTree: Accurate, Detailed, and Automatic Modelling of Laser-Scanned Trees. Remote Sens. 2019, 11, 2074. [Google Scholar] [CrossRef]
  47. Schneider, R.; Calama, R.; Martin-Ducup, O. Understanding Tree-to-Tree Variations in Stone Pine (Pinus Pinea L.) Cone Production Using Terrestrial Laser Scanner. Remote Sens. 2020, 12, 173. [Google Scholar]
  48. Jucker, T.; Caspersen, J.; Chave, J.; Antin, C.; Barbier, N.; Bongers, F.; Dalponte, M.; van Ewijk, K.Y.; Forrester, D.I.; Haeni, M.; et al. Allometric Equations for Integrating Remote Sensing Imagery into Forest Monitoring Programmes. Glob. Change Biol. 2017, 23, 177–190. [Google Scholar] [CrossRef] [PubMed]
  49. Bogdanovich, E.; Perez-Priego, O.; El-Madany, T.S.; Guderle, M.; Pacheco-Labrador, J.; Levick, S.R.; Moreno, G.; Carrara, A.; Martín, M.P.; Migliavacca, M. Using terrestrial laser scanning for characterizing tree structural parameters and their changes under different management in a Mediterranean open woodland. For. Ecol. Manag. 2021, 486, 118945. [Google Scholar] [CrossRef]
Figure 1. Study area and data collection sites.
Forests 14 02179 g001
Figure 2. Conditions of each site (a) Site 1 is Mongolian oak plantation. (b) Site 2 is Chinese Scots pine plantation.
Forests 14 02179 g002
Figure 3. Field measurement data for sample trees: (a) height distribution in Chinese Scots pine sample plot, (b) DBH distribution in Chinese Scots pine sample plot, (c) height distribution in Mongolian oak sample plot, (d) DBH distribution in Mongolian oak sample plot.
Forests 14 02179 g003
Figure 4. Field survey data of tree DBH within the TLS point cloud coverage area. (a) Chinese Scots pine. (b) Mongolian oak.
Forests 14 02179 g004
Figure 5. The automated workflow for acquiring forest structural parameters.
Forests 14 02179 g005
Figure 6. Illustrates the target search process in ULS point clouds using tree TLS point clouds.
Forests 14 02179 g006
Figure 7. The structure of 2D feature matrices for branch nodes.
Forests 14 02179 g007
Figure 8. An example of the feature matrix for a node within a directed root tree. (a) Single branch, (b) two branches, (c) three branches.
Forests 14 02179 g008
Figure 9. Principles of tree height measurement: (a) projection error, (b) main trunk direction vector, (c) point cloud correction, and (d) tree height measurement.
Forests 14 02179 g009
Figure 10. Crown diameter calculation principles. (a) Crown base determination and (b) point cloud of tree crown. The position of the red line in (a) determines the dividing line between the crown point cloud and the trunk point cloud represented by the red line in (b).
Forests 14 02179 g010
Figure 12. Analysis of tree height measurement results from ULS point clouds of Chinese Scots pine plot. (a) Distribution of tree height measurement results. (b) Error analysis, red line is Linear trend line.
Forests 14 02179 g012
Figure 13. DBH measurements of Chinese Scots pine plot. (a) TLS point clouds. (b) ULS point clouds. Red line is Linear trend line.
Forests 14 02179 g013
Figure 14. Errors in DBH measurements using single-tree ULS point clouds matched with TLS point clouds of Chinese Scots pine plot, red line is Linear trend line.
Forests 14 02179 g014
Figure 15. Errors in DBH estimation using point cloud measurements of Chinese Scots pine plot. (a) Estimation using ULS point clouds only. (b) Estimation with correction using TLS point clouds. Red line is Linear trend line.
Forests 14 02179 g015
Figure 16. Comparison of estimated and measured DBH of Chinese Scots pine plot. (a) Overall distribution of DBH estimates. (b) Overall DBH estimation errors, red line is Linear trend line.
Forests 14 02179 g016
Figure 17. Analysis of tree height measurement results from ULS point clouds of Mongolian oak plot. (a) Distribution of tree height measurement results. (b) Error analysis, red line is Linear trend line.
Forests 14 02179 g017
Figure 18. DBH measurements of Mongolian oak plot. (a) TLS point clouds. (b) ULS point clouds. Red line is Linear trend line.
Forests 14 02179 g018
Figure 19. Errors in DBH measurements using single-tree ULS point clouds matched with TLS point clouds of Mongolian oak plot, red line is Linear trend line.
Forests 14 02179 g019
Figure 20. Errors in DBH estimation using point cloud measurements of Mongolian oak plot. (a) Estimation using ULS point clouds only, red line is Linear trend line. (b) Estimation with correction using TLS point clouds. Red line is Linear trend line.
Forests 14 02179 g020
Figure 21. Analysis of tree height measurement results from ULS point clouds of Mongolian oak plot. (a) Distribution of tree height measurement results. (b) Error analysis, red line is Linear trend line.
Forests 14 02179 g021
Table 1. ULS scan parameter settings.
Equipment ParametersScanning Configuration
Flight altitude35 m
Flight speed3 m/s
Point cloud density1772 points/m2
Flight strip overlap65%
Heading angle28°
Echo modeTriple
Sampling rate160 kHz
Scanning modeRepeat
Table 2. DBH measurement results of individual trees in the Chinese Scots pine plot.
Data CategoriesParametersManual Measurement Values (cm)Values Estimated from ULS/TLS Point Clouds (cm)
HeightMean13.7113.70
Median13.6513.44
Maximum20.1020.29
Minimum8.618.28
DBHMean21.50 21.31
Median20.65 21.28
Maximum40.46 44.24
Minimum10.835.29
Number of trees 25924,695 (%)
Table 3. DBH measurement results of individual trees in the Mongolian oak plot.
Data CategoriesParametersManual Measurement Values (cm)Values Estimated from ULS/TLS Point Clouds (cm)
HeightMean13.72 13.77
Median13.53 13.48
Maximum22.99 23.26
Minimum6.21 3.97
DBHMean18.88 18.62
Median18.48 19.06
Maximum29.35 34.41
Minimum11.04 7.00
Number of trees 223191 (85.6%)
Disclaimer/Publisher’s Note: The statements, opinions and data contained in all publications are solely those of the individual author(s) and contributor(s) and not of MDPI and/or the editor(s). MDPI and/or the editor(s) disclaim responsibility for any injury to people or property resulting from any ideas, methods, instructions or products referred to in the content.

