Abstract
Plant leaf water content significantly influences photosynthetic efficiency and crop yield. Leaf water content (LWC) and equivalent water thickness (EWT) are indicators that reflect the water state within plant tissues, and they play a crucial role in assessing plant water supply and usage. In recent years, there has been a growing focus on the rapid and precise determination of plant water content. In this study, Cinnamomum camphora (C. camphora) was chosen as the subject of investigation. After acquiring spectral data, three types of vegetation indices were computed: the empirical vegetation index, the random combination dual-band vegetation index, and the ‘trilateral’ parameter. Four groups of optimal spectral index screening strategies were established, namely an empirical vegetation index group (G1), a random combination dual-band vegetation index group (G2), a ‘trilateral’ parameter group (G3), and a mixed group (G4). Three algorithms, specifically random forest (RF), radial basis function neural network (RBFNN), and support vector machine (SVM), were employed for the estimation of leaf water content (LWC) and equivalent water thickness (EWT) in mature C. camphora. The results demonstrated that the G4 group displayed superior performance, yielding five optimal spectral indices for LWC: water index (WI), optimized soil-adjusted vegetation index (OSAVI), difference vegetation index (DVI) at wavelengths 734 and 956 nm, first-order difference vegetation index (DVI-FD) at wavelengths 1009 and 774 nm, and red-edge amplitude (Dr). With regard to EWT estimation, the five optimal spectral indices encompassed the red-edge normalized difference vegetation index (RE-NDVI), simple ratio water index (SRWI), difference vegetation index (DVI) at wavelengths 700 and 1167 nm, first-order difference vegetation index (DVI-FD) at wavelengths 1182 and 1514 nm, and red-edge area (SDr). Utilizing these indices as inputs significantly enhanced the accuracy of the models, with the RF model emerging as the most effective for estimating LWC and EWT in C. camphora. Based on the LWC estimation model of the G4 group and the RF algorithm, the determination coefficient (R2) for both the training and test sets reached 0.848 and 0.871, respectively. The root mean square error (RMSE) was 0.568% for the training set and 0.582% for the test set, while the average relative error (MRE) stood at 0.806% and 0.642%, respectively. Regarding the EWT estimation model, R2 values of 0.887 and 0.919 were achieved for the training and test sets, accompanied by RMSE values of 0.6 × 10⁻³ g·cm−2 and 0.7 × 10⁻³ g·cm−2, and MRE values of 3.198% and 2.901%, respectively. These findings lay a solid foundation for hyperspectral moisture monitoring in C. camphora and offer valuable reference for the rapid assessment of crop growth status.
1. Introduction
Cinnamomum camphora (Linn.) Presl (C. camphora) is a significant source of natural camphor and spices, owing to its abundant essential oil content in its roots, trunks, branches, and leaves. It is extensively cultivated as an economic crop in the Yangtze River Basin and the southern regions of China [1,2]. However, in recent years, the frequent occurrences of high temperatures and droughts in the Yangtze River Basin have exerted a profound impact on the growth and industrial management of C. camphora plants. Enhancing irrigation water utilization efficiency is considered one of the strategies for mitigating drought effects, and the real-time assessment of crop water status holds utmost importance for irrigation scheduling [3]. Previous studies have revealed that C. camphora primarily utilizes shallow soil water during the early growing season (April–May), transitions to middle and deep soil water during the middle growing season (June–August), and relies on both shallow and deep soil water in the later growing season (September–October) [4]. These variations in soil water utilization by C. camphora become evident through parameters such as leaf water content (LWC), equivalent water thickness (EWT), and leaf water potentials.
Leaf water content (LWC) and equivalent water thickness (EWT) serve as crucial indicators for assessing the physiological condition of plants. Monitoring these parameters enables the timely diagnosis of water deficits in C. camphora and provides a means to evaluate its overall health. Various factors, including growth stage, soil moisture, and air temperature, influence the water content in plant leaves. Real-time and rapid measurements of LWC present significant challenges [5,6]. Conventional methods for monitoring plant water content, such as the oven-drying method, necessitate destructive sampling and are characterized by time-consuming and labor-intensive procedures. These approaches fail to effectively capture dynamic changes in water content and do not provide expedient and accurate field monitoring data [7]. The latest non-destructive methods for determining leaf water content include terahertz techniques. Terahertz waves refer to electromagnetic waves with frequencies in the range of 0.1 THz to 10 THz and wavelengths in the range of roughly 0.03 to 3 mm, between microwave and infrared. They are characterized by high penetrating power and strong detection ability for the properties of different substances. Moisture has a significant effect on how terahertz waves are absorbed and scattered, so terahertz and sub-terahertz waves can be utilized to monitor the moisture content of leaves. However, the technology is expensive and is still in the laboratory research stage, and further validation of its effect on use in natural environments is still needed [8,9]. Consequently, obtaining timely and inexpensive information on leaf water content and adjusting soil moisture management strategies in large-scale forestry management remains a challenging task.
The widespread adoption of hyperspectral technology in agriculture and forestry has significantly advanced the rapid acquisition and long-term dynamic monitoring of various elements within agro-forestry ecosystems, including vegetation, water, and soil [10,11,12]. Currently, research on the estimation of plant leaf water content (LWC) and equivalent water thickness (EWT) through hyperspectral data has been applied across various crops. For instance, Zhang et al. [13] extracted characteristic bands associated with LWC through canopy spectral reflectance and LWC data, utilizing the correlation coefficient method (CA) and x-loading method (x-Lw). Their results revealed that the prediction accuracy of newly developed differential spectral indices DVI (R1185, R1307) exceeded that of existing spectral indices, with determination coefficients (R2) of 0.85 for calibration and 0.78 for validation. Similarly, Yi et al. [14] employed original spectral reflectance (R) and first derivative reflectance (DR) from cotton leaves to compute the ratio vegetation index (RVI) and the normalized difference vegetation index (NDVI) across the entire spectral range (350–2500 nm). Their findings highlighted that the dual-band combinations introduced novel indices, such as DR1647/DR1133 and DR1653/DR1687, which proved to be the most effective for estimating EWT and fuel moisture content (FMC), respectively. Consequently, the prediction of leaf water content and equivalent water thickness through hyperspectral technology is not only feasible but also holds the potential for enhancing prediction accuracy.
Currently, numerous methodologies exist for estimating plant biochemical parameters utilizing hyperspectral data [15]. One common approach involves the establishment of regression models linking empirical or semi-empirical vegetation indices, spectral reflectance, or its derivatives to actual plant biochemical parameters. This method requires the selection of suitable empirical vegetation indices tailored to specific plant types to achieve enhanced estimation accuracy. As an illustration, Zhang et al. [16] computed recently developed spectral indices to estimate the equivalent water thickness (EWT) of kiwifruit leaves. Their findings demonstrated that the newly proposed three-band vegetation index (R2039–R2438)/R752 exhibited superior performance in estimating EWT for kiwifruit leaves, boasting an R2 value of 0.771, a root mean square error of 0.0024 g·cm−2, and a residual prediction deviation of 2.09. This method, characterized by its systematic approach, has contributed significantly to recent research articles on remote sensing-based plant monitoring. The results obtained through this approach are highly dependable, although the associated workload can be substantial.
Another approach involves the inversion method based on the radiative transfer model, which elucidates the intricate interaction dynamics between vegetation and incident spectra. In contrast to traditional empirical vegetation index methods, the radiative transfer model is imbued with greater physical significance and offers enhanced stability. Li et al. [17] conducted concurrent measurements of leaf reflectance (400–2500 nm), chlorophyll a + b content (Cab), and equivalent water thickness (Cw) data. They introduced and assessed a novel radiation transfer hybrid method termed “Spiking-Hybrid”. This newly proposed method was compared with three commonly employed techniques for estimating plant traits, namely the PROCOSINE inversion method with numerical optimization, the traditional hybrid method, and an empirical machine learning method. The outcomes of their study revealed the superiority of the proposed method and the empirical approach in estimating Cab and Cw when compared to the other methods. Nevertheless, it is noteworthy that this method demands a comprehensive investigation into underlying mechanisms, which can be challenging given the inherent complexity of the model.
Incorporating recent research advancements, this study introduces a more comprehensive optimal vegetation index screening method building upon prior empirical and semi-empirical index methodologies. The empirical/semi-empirical index method is a multiple regression analysis method. It is based on the principle that healthy vegetation usually has different absorption and reflection properties for different wavelengths of light. A number of vegetation indices can be developed by calculating spectral reflectance in different bands. These indices can be used for modeling and thus monitoring the health of plants. Vegetation indices are further categorized into “three-side” parameters, randomly combined two-band vegetation indices, and empirical vegetation indices, etc. Previous researchers have often conducted in-depth studies in only one of these directions. Few researchers have combined numerous vegetation indices to study the strengths and weaknesses of their performance and their impact on inverse modeling [11,12,13,14].
Focusing on C. camphora as the subject of investigation, hyperspectral data were acquired, and three vegetation indices highly sensitive to leaf water content (LWC) and equivalent water thickness (EWT) were identified through the correlation coefficient method: the ‘trilateral’ parameter, random combination dual-band vegetation index, and empirical vegetation index. Four screening strategies were subsequently devised. random forest (RF), radial basis function neural network (RBFNN), and support vector machine (SVM) were employed to estimate and model LWC and EWT, facilitating a comparative analysis of model accuracy. Ultimately, this study aims to identify spectral indices with heightened water sensitivity in C. camphora leaves while constructing estimation models for LWC and EWT. These findings serve as a technical reference for leaf-level LWC and EWT estimation in C. camphora.
2. Materials and Methods
2.1. Overview of the Study Area
The research site is situated within the camphor tree germplasm resource nursery of Nanchang Institute of Engineering, located in Nanchang City, Jiangxi Province, China, at coordinates 28°41′40.85″ N and 116°1′41.18″ E. As shown in Figure 1, the elevation map data are from the geospatial data cloud, and the aerial map is from the M300RTK UAV (DIJ Co., Ltd., Shenzhen, China) with a MS600Pro multispectral lens (Yusense Co., Ltd., Qingdao, China). The UAV photo was taken at 12:00 noon on 26 September 2022. This location lies at an altitude of 22 m, nestled between the Jiangnan Hills and the river plain. The climate in this region falls under the category of subtropical monsoon, characterized by an annual average temperature of 17.7 °C, annual average rainfall of 1600 mm, annual average relative humidity of 78.5%, and annual average evaporation of 1271.6 mm. The area enjoys an average of 1775 h of sunshine annually. The soil type prevalent in this region is red soil, exhibiting a slightly acidic to neutral pH value. It is notable for its rapid mineralization, strong leaching processes, and propensity for leaching water-soluble base ions. The soil’s capillary pore capacity is limited, resulting in poor retention of effective water [18].
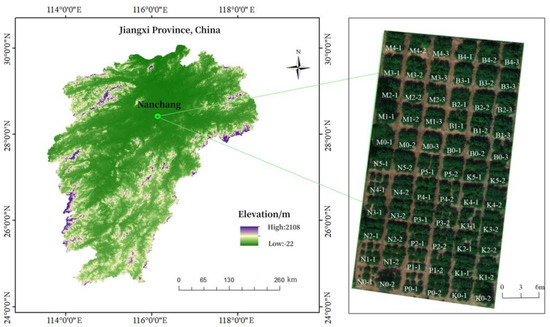
Figure 1.
Geographical location of study area.
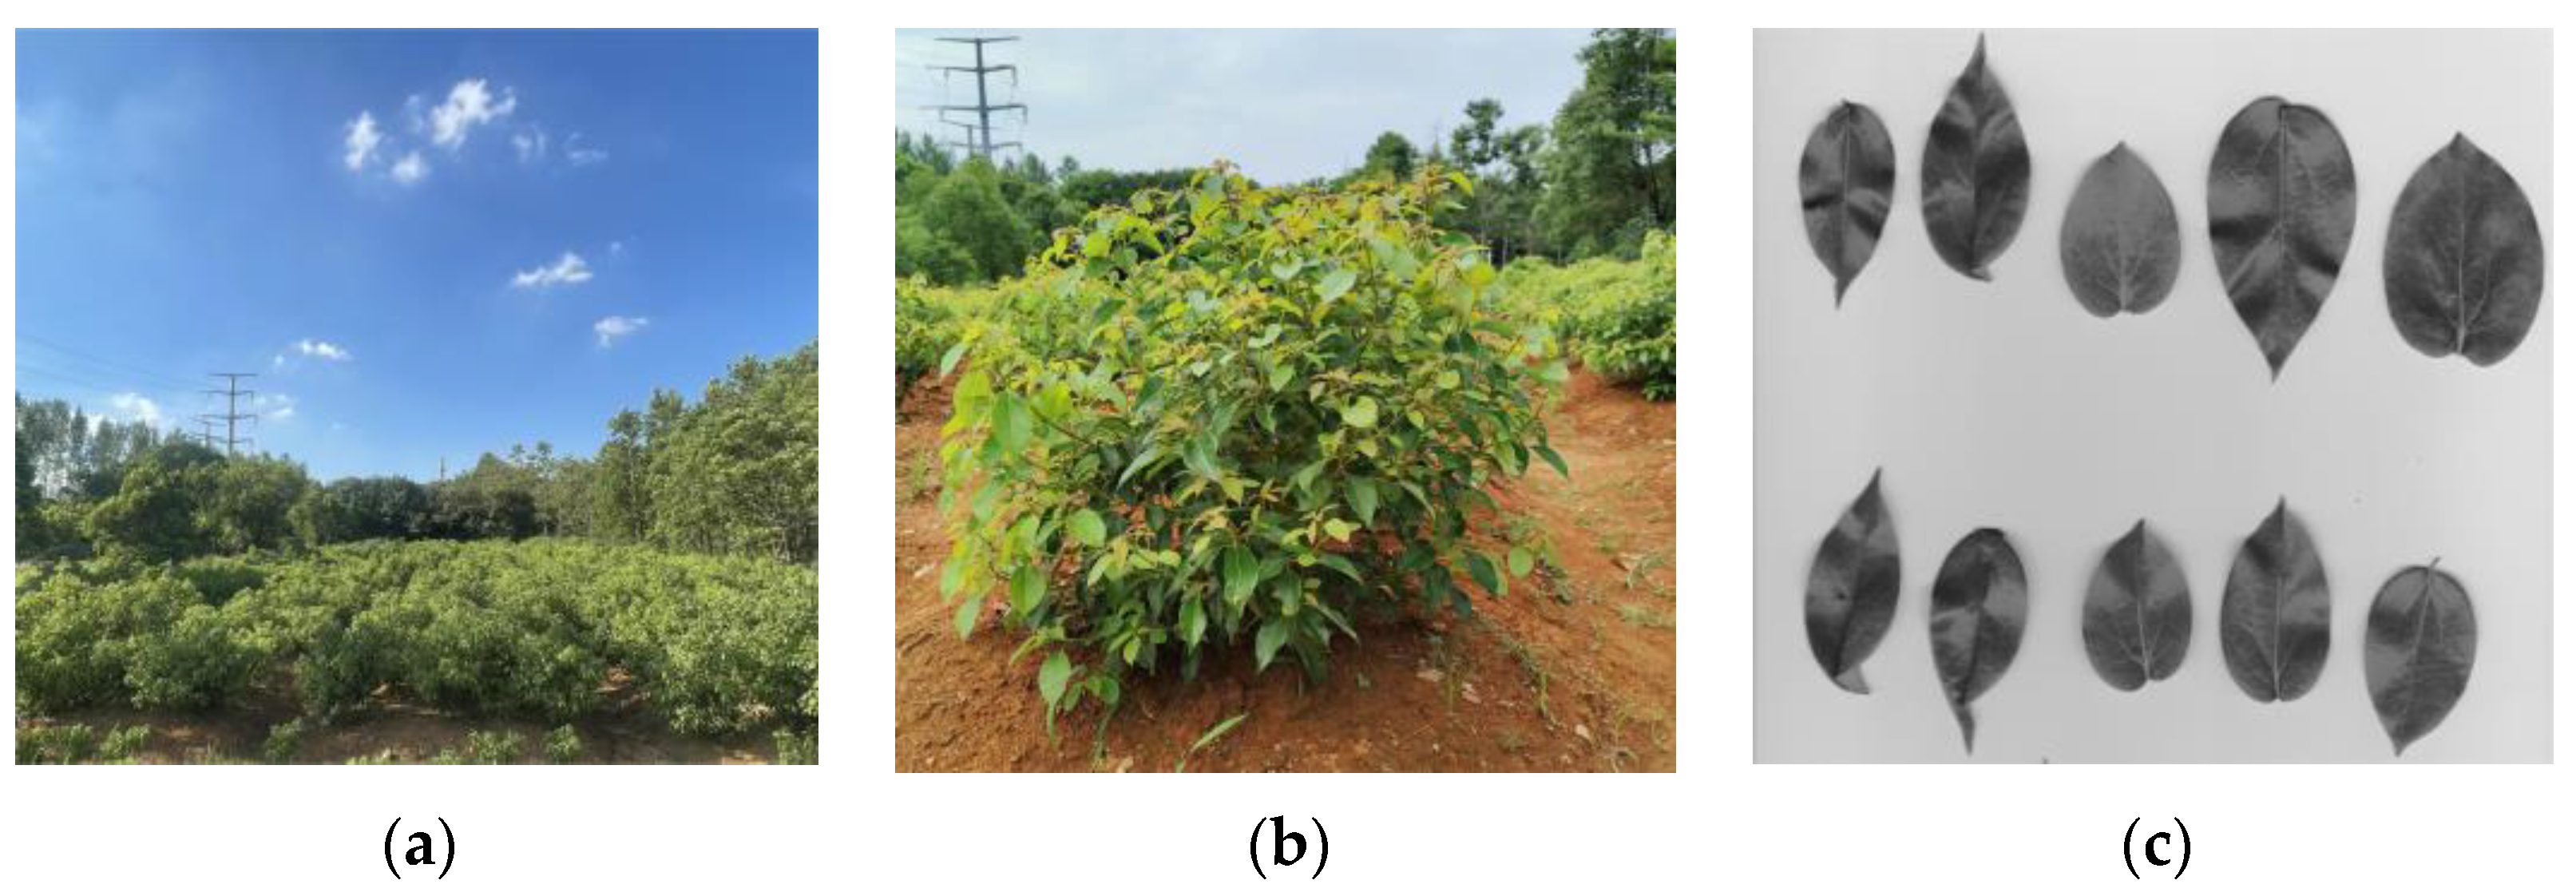
The test variety of dwarf camphor utilized in this study was ‘Ganfang No.1’, which was developed by the Jiangxi Camphor Tree Breeding and Development and Utilization Engineering Research Center. In the designated study area, a total of 66 plots were established, each measuring 3 m × 3 m in size. Within each plot, nine plants were cultivated with a row spacing of 1 × 1 m, resulting in a total of 594 plants. Planting took place in April 2021, utilizing 1-year-old cutting seedlings without the application of any chemicals. The maintenance involved manual weeding. Photos of the C. camphora are shown in Figure 2. The photo acquisition time was at the end of September 2022.

Figure 2.
Photos of the C. camphora. (a) is an overall photograph, (b) is a single C. camphora, and (c) is a gray scanning image of the leaves.
The experiment employed various nutrient treatments, including 12 plots treated with nitrogen fertilizer (N0-1~N5-2), 12 with phosphorus fertilizer (P0-1~P5-2), 12 with potassium fertilizer (K0-1~K5-2), 15 with organic fertilizer (M0-1~M4-3), and 15 with biochar (B0-1~B4-3). The concentration of fertilization for each treatment increased along a specific gradient. This experiment utilized a combination of natural rainfall and artificial supplementary sprinkler irrigation as the method of water supply.
2.2. Data Acquisition
2.2.1. Leaf Moisture Data Acquisition and Processing
The water content and equivalent water thickness of C. camphora leaves in 66 plots were measured and calculated. The water content of leaves was measured using a drying method: fresh leaves of different positions and different heights were picked from each C. camphora, and 300 g (FW) was weighed using an electronic balance. The samples were put in a kraft paper bag and numbered (there were 9 samples in each community, a total of 594 samples), then put in an oven at 105 °C for deactivation, adjusted to 80 °C after half an hour, and dried for 42 h to constant weight, and then the dry weight (DW) was measured. Nine groups of data of nine trees in the community were obtained. Finally, the average value was taken to represent the LWC of the community. The calculation formula [19] is
In the formula, LWC is average leaf water content, %; FW is leaf fresh weight, 300 g; DW is leaf dry weight, g; i is cell number (i = 1, 2, …, 66); and j is plant number (j = 1, 2, …, 9).
The equivalent water thickness of the leaves was determined as follows. For each tree within each plot, 50 leaves were collected from various positions and heights. The fresh weight (FW) of these leaves was meticulously measured using an electronic balance with a precision of 0.01 g. The total leaf area (S) of the 50 leaves was assessed using a YMJ-B handheld leaf area meter (Zhejiang Topu Yunnong Technology Co., Ltd., Hangzhou, China). Subsequently, all leaf samples were subjected to a drying process at 80 °C for 48 h, ensuring that a constant weight was reached using an oven. The dry weight (DW) was then measured. This methodology adheres to the style commonly found in SCI publications. The formula for calculating the equivalent water thickness of the leaf blade is as follows [20]:
Among which, EWT is average equivalent water thickness of leaves, g·cm−2; FW is leaf fresh weight, g; DW is leaf dry weight, g; S is leaf area, cm2; i is cell number (i = 1, 2, …, 66); and j is plant number (j = 1, 2, …, 9).
2.2.2. Hyperspectral Data Acquisition and Processing
The ASD Field-Spec 3 (Analytical Spectral Device, Longmont, CO, USA) was utilized in this study. The instrument’s spectral range extended from 350 to 1830 nm. Within the range of 350 to 1000 nm, the spectral resolution was 3 nm, and the sampling interval was 1.4 nm. For the range of 1000 to 1830 nm, the resolution was 10 nm, with a sampling interval of 2 nm. Notably, the instrument automatically interpolated the sampling data to provide an output with a 1 nm interval.
On 26 September 2022, spectral reflectance measurements of the leaves were conducted between 10:00 and 14:00 under clear and sunny weather conditions. To ensure that the spectrometer’s probe encompassed the entire sample leaves’ field of view in direct sunlight, the spectrometer sensor probe was positioned vertically downward, approximately 0.75 m in vertical height from the top of the C. camphora canopy, with a field of view of 25 degrees. Prior to each measurement, a standard whiteboard was employed for calibration. The measurements encompassed all nine camphor trees within the community on each occasion, with the average value of the nine datasets considered as the measurement value. Consequently, a total of 66 sets of hyperspectral data were acquired.
To mitigate the impact of background noise on the hyperspectral reflectance curve, this study employed Savitzkv–Golay convolution smoothing as a preprocessing step for the spectral data [21]. Additionally, the FOD (fractional-order derivative) algorithm was utilized to execute a first-order differential transformation on the hyperspectral reflectance data. The FOD algorithm extends the traditional integer-order differential to an any-order differential, allowing for a more comprehensive elucidation of subtle changes and overall information within the data. The differential formula of hyperspectral reflectance data in this experiment is as follows [22]:
In the formula, x is the value of the corresponding point; α is the differential order, and the value is 1; Г is the Gamma function; and n is the difference between the upper and lower limits of the differential.
2.3. Spectral Index Selection and Construction
In this study, three categories of vegetation indices were formulated for the estimation of LWC and EWT in C. camphora. (1) The first category involved the screening of empirical vegetation indices exhibiting strong correlations with crop water parameters. (2) The second category selected the random combination dual-band vegetation index with the highest correlation to LWC and EWT in C. camphora. (3) The third category encompassed the screening of ‘trilateral’ spectral parameters associated with water, as reported in prior studies. The chosen vegetation index was closely associated with plant water parameters [14,23,24,25,26,27,28,29,30,31,32,33,34,35,36]. The calculation formulas for these indices are provided in Table 1, Table 2 and Table 3.

Table 1.
Empirical vegetation index and its calculation formula.
Table 2.
Randomly combined dual-band vegetation index and its calculation formula.
Table 3.
“Three-edge” parameters and their calculation formulas.
2.4. Construction of Inversion Model
Firstly, the correlation between vegetation index and LWC and EWT of C. camphora was analyzed, and 4 screening strategies were designed: (1) five indices with the highest correlation coefficient with LWC and EWT of C. camphora were selected from eight groups of empirical vegetation indices as input variables of the model; (2) five indices with the highest correlation coefficient with LWC and EWT of C. camphora were selected from six groups of random combination dual-band vegetation indices as input variables of the model; (3) five parameters with the highest correlation coefficient with the LWC and EWT of C. camphora were selected from the eight groups of ‘trilateral’ spectral parameters as the input variables of the model; (4) five indices with the highest correlation coefficient with LWC and EWT of C. camphora were selected from twenty-two groups of vegetation indices as input variables of the model.
The measured LWC and EWT data were used as output variables, and then RF, RBFNN and SVM were used to estimate and model LWC and EWT.
2.5. Model Evaluation
To assess the predictive accuracy and capability of the model, this study employed three evaluation criteria: the determination coefficient (R2), root mean square error (RMSE), and mean relative error (MRE). The model’s accuracy was evaluated based on these measures, with a higher R2 value indicative of a closer fit to 1, and both RMSE and MRE approaching 0 signifying a superior model fitting effect. The calculation formula of the above indices is as follows:
In the formula, is model prediction value; is actual sampling value; is mean value; and n is number of samples.
2.6. Test of Significance
Based on the autocorrelation coefficient test table, it was observed that when the degree of freedom (i.e., sample size) equaled 66, a correlation coefficient value exceeding 0.24 signified a significant level of correlation (p < 0.05), while a value surpassing 0.31 indicated a highly significant level of correlation (p < 0.01). Similarly, with a degree of freedom of 44, a correlation coefficient greater than 0.38 denoted a highly significant correlation (p < 0.01), and for a degree of freedom of 22, a correlation coefficient exceeding 0.52 represented a highly significant correlation (p < 0.01). This description adheres to the style commonly found in SCI publications.
2.7. Software for Data Processing and Analysis
The measured data for the LWC and EWT of C. camphora were processed using Excel 2021, and the calculation of vegetation indices was based on reflectance data. The correlation coefficients between the vegetation indices and LWC, as well as EWT of C. camphora, were computed. Inversion models employing SVM, RBFNN, and RF were established using Matlab 2020a. For graphical representation, OriginPro 2021 was utilized to create correlation coefficient heatmaps and fitting maps for the inversion results. The software used to print the screen included Adobe Photoshop 2022, ArcMap 10.2, and ENVI 5.31, etc. These software packages also optimize and typesets the images.
3. Results
3.1. Statistical Characteristics of LWC and EWT Data of C. camphora
A total of 66 effective samples for LWC and 66 for EWT were collected during the harvest period of C. camphora. Subsequently, the three machine learning models randomly allocated 2/3 of the samples (44 groups) as the modeling set, while the remaining 1/3 of the samples (22 groups) were reserved for the validation set. Table 4 presents the statistical characteristics of LWC and EWT data for C. camphora.
Table 4.
Descriptive statistical characteristics of LWC and EWT of C. camphora.
3.2. Correlation Analysis between Vegetation Index and LWC and EWT Data of C. camphora
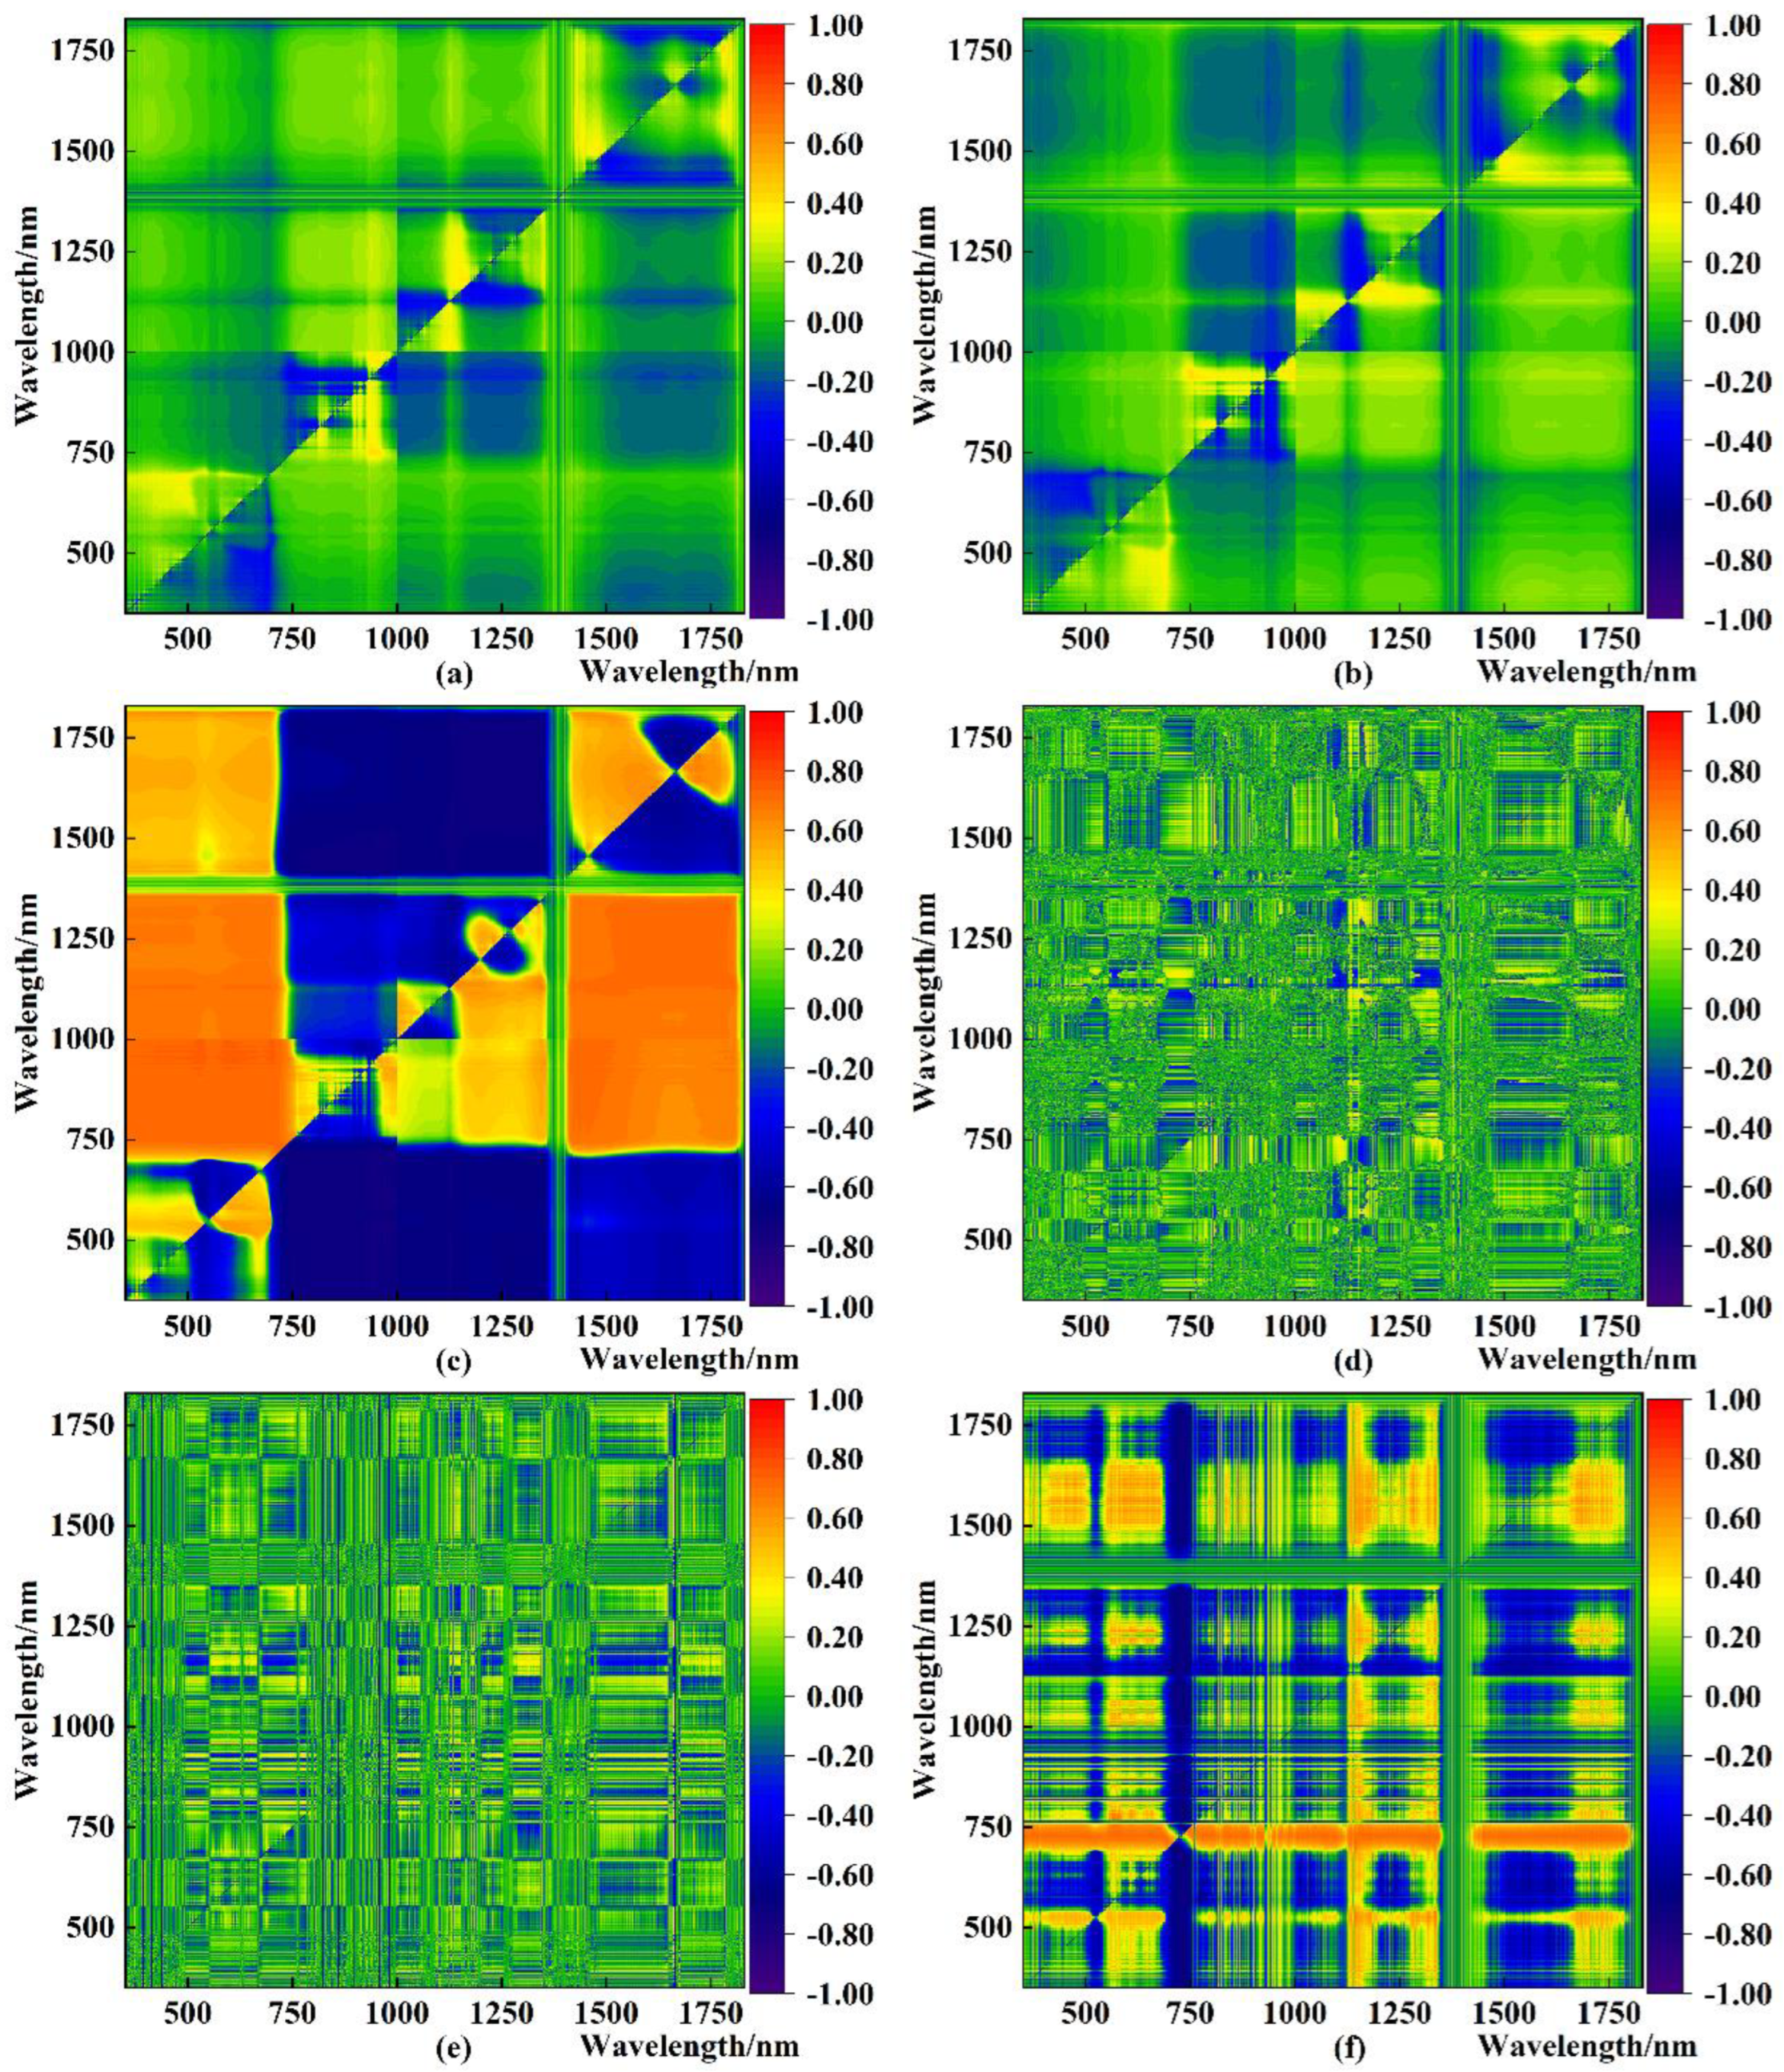
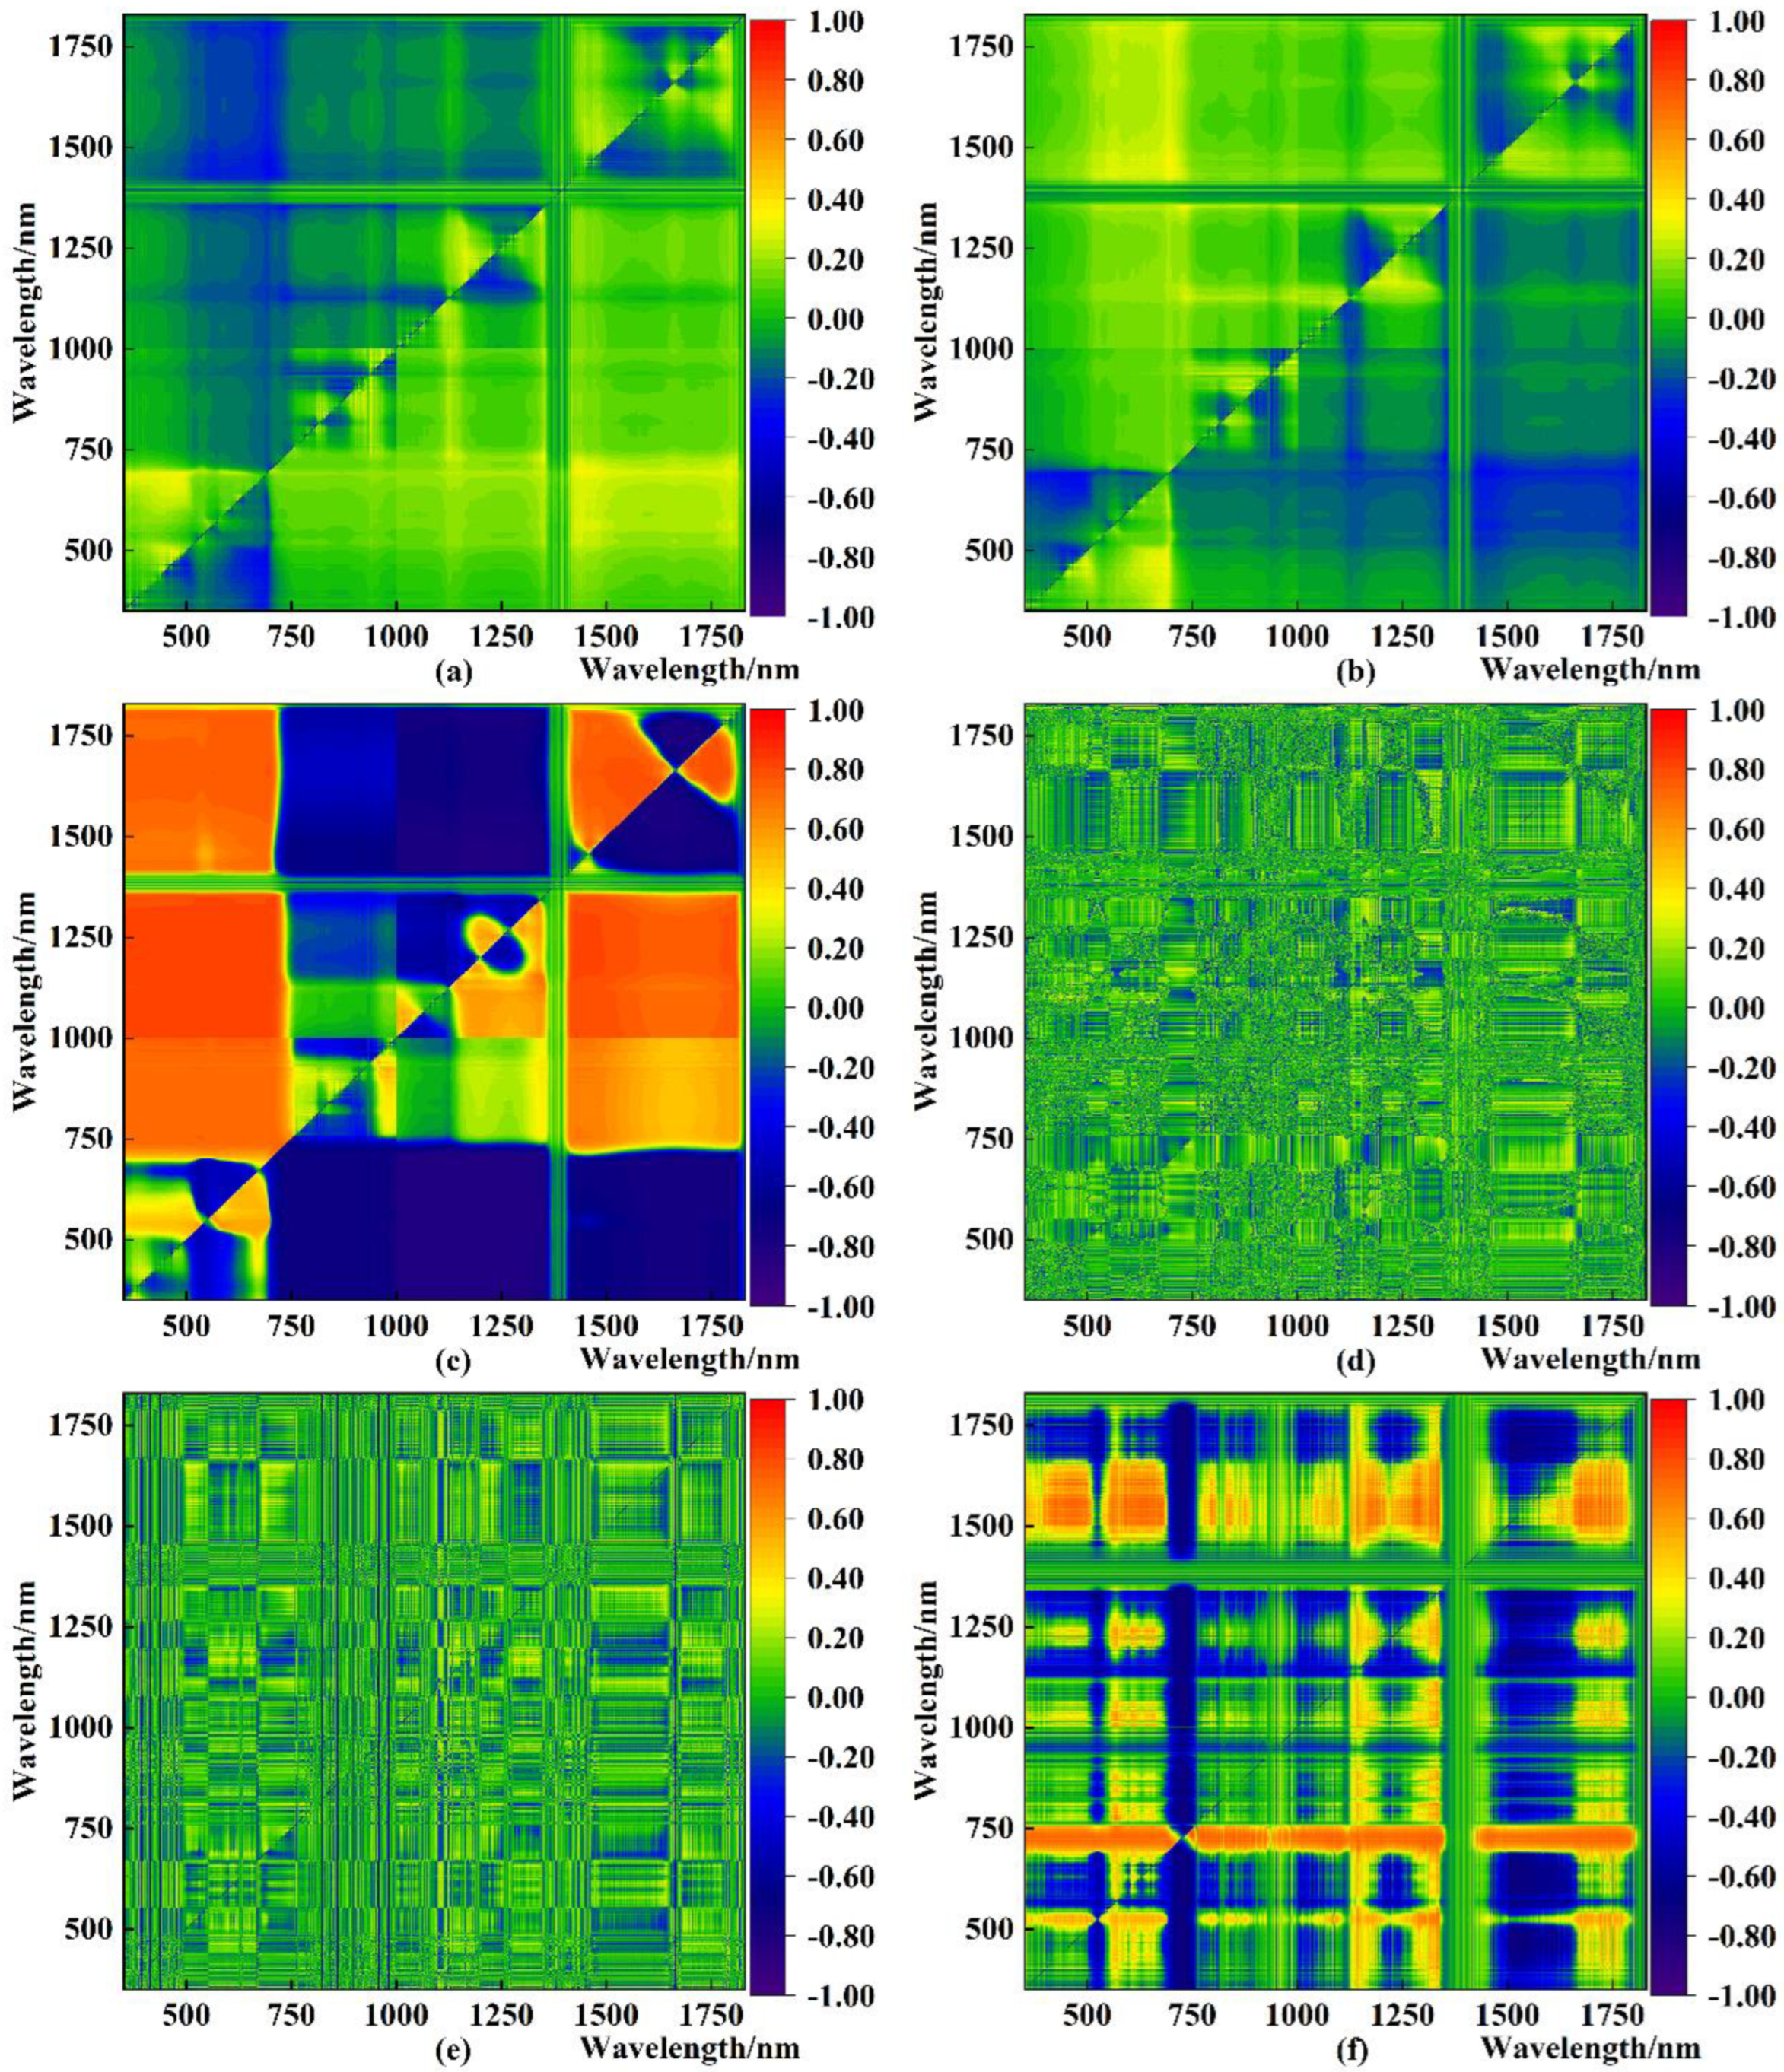
The correlation analysis results for each vegetation index with LWC and EWT in C. camphora are presented in Table 5, and the detailed screening process of the random combination dual-band vegetation index is illustrated in Figure 3 and Figure 4. The outcomes indicate that, overall, the correlation coefficient (R) between the ‘trilateral’ parameter and LWC and EWT in C. camphora is lower than that of the empirical vegetation index and the random combination dual-band vegetation index. The selected random combination dual-band vegetation index exhibited a correlation coefficient (R) with LWC and EWT exceeding 0.31, reaching a highly significant correlation level (p < 0.01). This suggests that the 12 random combination dual-band vegetation indices chosen in this study can effectively estimate the LWC and EWT in C. camphora. Notably, the highest correlation coefficient was observed between DVI-FD and LWC at 0.766, with a wavelength combination of 1009 nm and 774 nm. Furthermore, the correlation coefficient between RVI and EWT reached up to 0.820, with a wavelength combination of 700 nm and 1167 nm.
Table 5.
The correlation coefficients between vegetation index (wavelength position) and LWC and EWT of C. camphora were calculated.

Figure 3.
Thermograms of correlation coefficients between randomly combined dual-band vegetation indices and leaf water content; (a–f) show thermograms of correlation coefficients between NDVI, RVI, DVI, NDVI-FD, RVI-FD, and DVI-FD, respectively, and leaf water content.

Figure 4.
Thermograms of correlation coefficients of randomly combined two-band vegetation indices versus equivalent water thickness; (a–f) show thermograms of correlation coefficients of NDVI, RVI, DVI, NDVI-FD, RVI-FD, and DVI-FD versus equivalent water thickness.
3.3. Construction of LWC and EWT Inversion Models of C. camphora
In this study, four groups of screening strategies were devised using vegetation indices with high correlation coefficients, as discussed in Section 2.2: 1. Empirical vegetation index group (G1): This group included five indices with the highest correlation coefficients related to LWC and EWT in C. camphora from eight groups of empirical vegetation indices. Specifically, the indices chosen were (NDWI, WI, MSI, SRWI, OSAVI) and (WI, RE-NDVI, SRWI, OSAVI, NDI), which were utilized as input variables for the model. 2. Randomly combined dual-band vegetation index group (G2): Five indices with the highest correlation coefficients concerning LWC and EWT in C. camphora were selected from six groups of randomly combined dual-band vegetation indices. These selected indices included (NDVI (1488, 1485 nm), DVI (734, 956 nm), NDVI-FD (1561, 1532 nm), RVI-FD (802, 1181 nm), DVI-FD (1009, 774 nm)) and (NDVI (985, 988 nm), DVI (700, 1167 nm), NDVI-FD (1495, 1282 nm), RVI-FD (1328, 1701 nm), DVI-FD (1182, 1514 nm)) as input variables for the model. 3. ‘Trilateral’ spectral parameter group (G3): Five parameters (Rg, Dr, Db, SDr, SDb) and (Rr, Dr, Db, SDr, SDb) with the highest correlation coefficients related to LWC and EWT in C. camphora were selected from eight groups of ‘trilateral’ spectral parameters as input variables for the model, respectively. 4. Mixed group (G4): This group selected five indices with the highest correlation coefficients for LWC and EWT in C. camphora from the 22 groups of vegetation indices. The chosen indices were (WI, OSAVI, DVI (734, 956 nm), DVI-FD (1009, 774 nm), Dr) and (RE-NDVI, SRWI, DVI (700, 1167 nm), DVI-FD (1182, 1514 nm), SDr) as input variables for the model.
Finally, RF, RBFNN, and SVM were employed for modeling, and the model results are presented in Table 6 and Table 7. These tables provide the inversion results for the LWC and EWT models of C. camphora, encompassing both the modeling set and the validation set, with varying input variables and modeling methods.
Table 6.
Comparison of accuracy test results of LWC inversion model.
Table 7.
Comparison of accuracy test results of EWT inversion model.
As shown in Table 6, the inversion results of different models were compared. Utilizing the RF, RBFNN, and SVM algorithms, the average R2 values for the training set and test set of the established inversion model are (0.775, 0.785), (0.727, 0.760), and (0.724, 0.753), respectively, under the four screening strategies. The accuracy of the modeling set and test set of the model follows this order: RF > RBFNN > SVM. For the test set, the average RMSE of the three models was 0.67%, 0.68%, and 0.83%, respectively, and the average MRE of the test set was 0.81%, 1.16%, and 1.74%, respectively. The inversion values of the three models closely aligned with the measured values, with RF performing the best. Under each screening strategy, the test set R2 of the LWC inversion model based on RF was 0.058 to 0.194 higher than that of SVM and RBFNN.
Secondly, the inversion results under different screening strategies were compared. The three models achieve the highest accuracy for LWC inversion under the G4 screening strategy. The R2 values for both the training set and the test set are the largest (0.848, 0.871), and the RMSE and MRE are lower than those of the other groups. Under the G4 screening strategy, the RF, RBFNN, and SVM LWC inversion models constructed using sensitive vegetation indices have test set R2 values of 0.871, 0.823, and 0.813, respectively. When compared to other screening strategies, this approach exhibits the best linear fitting effect.
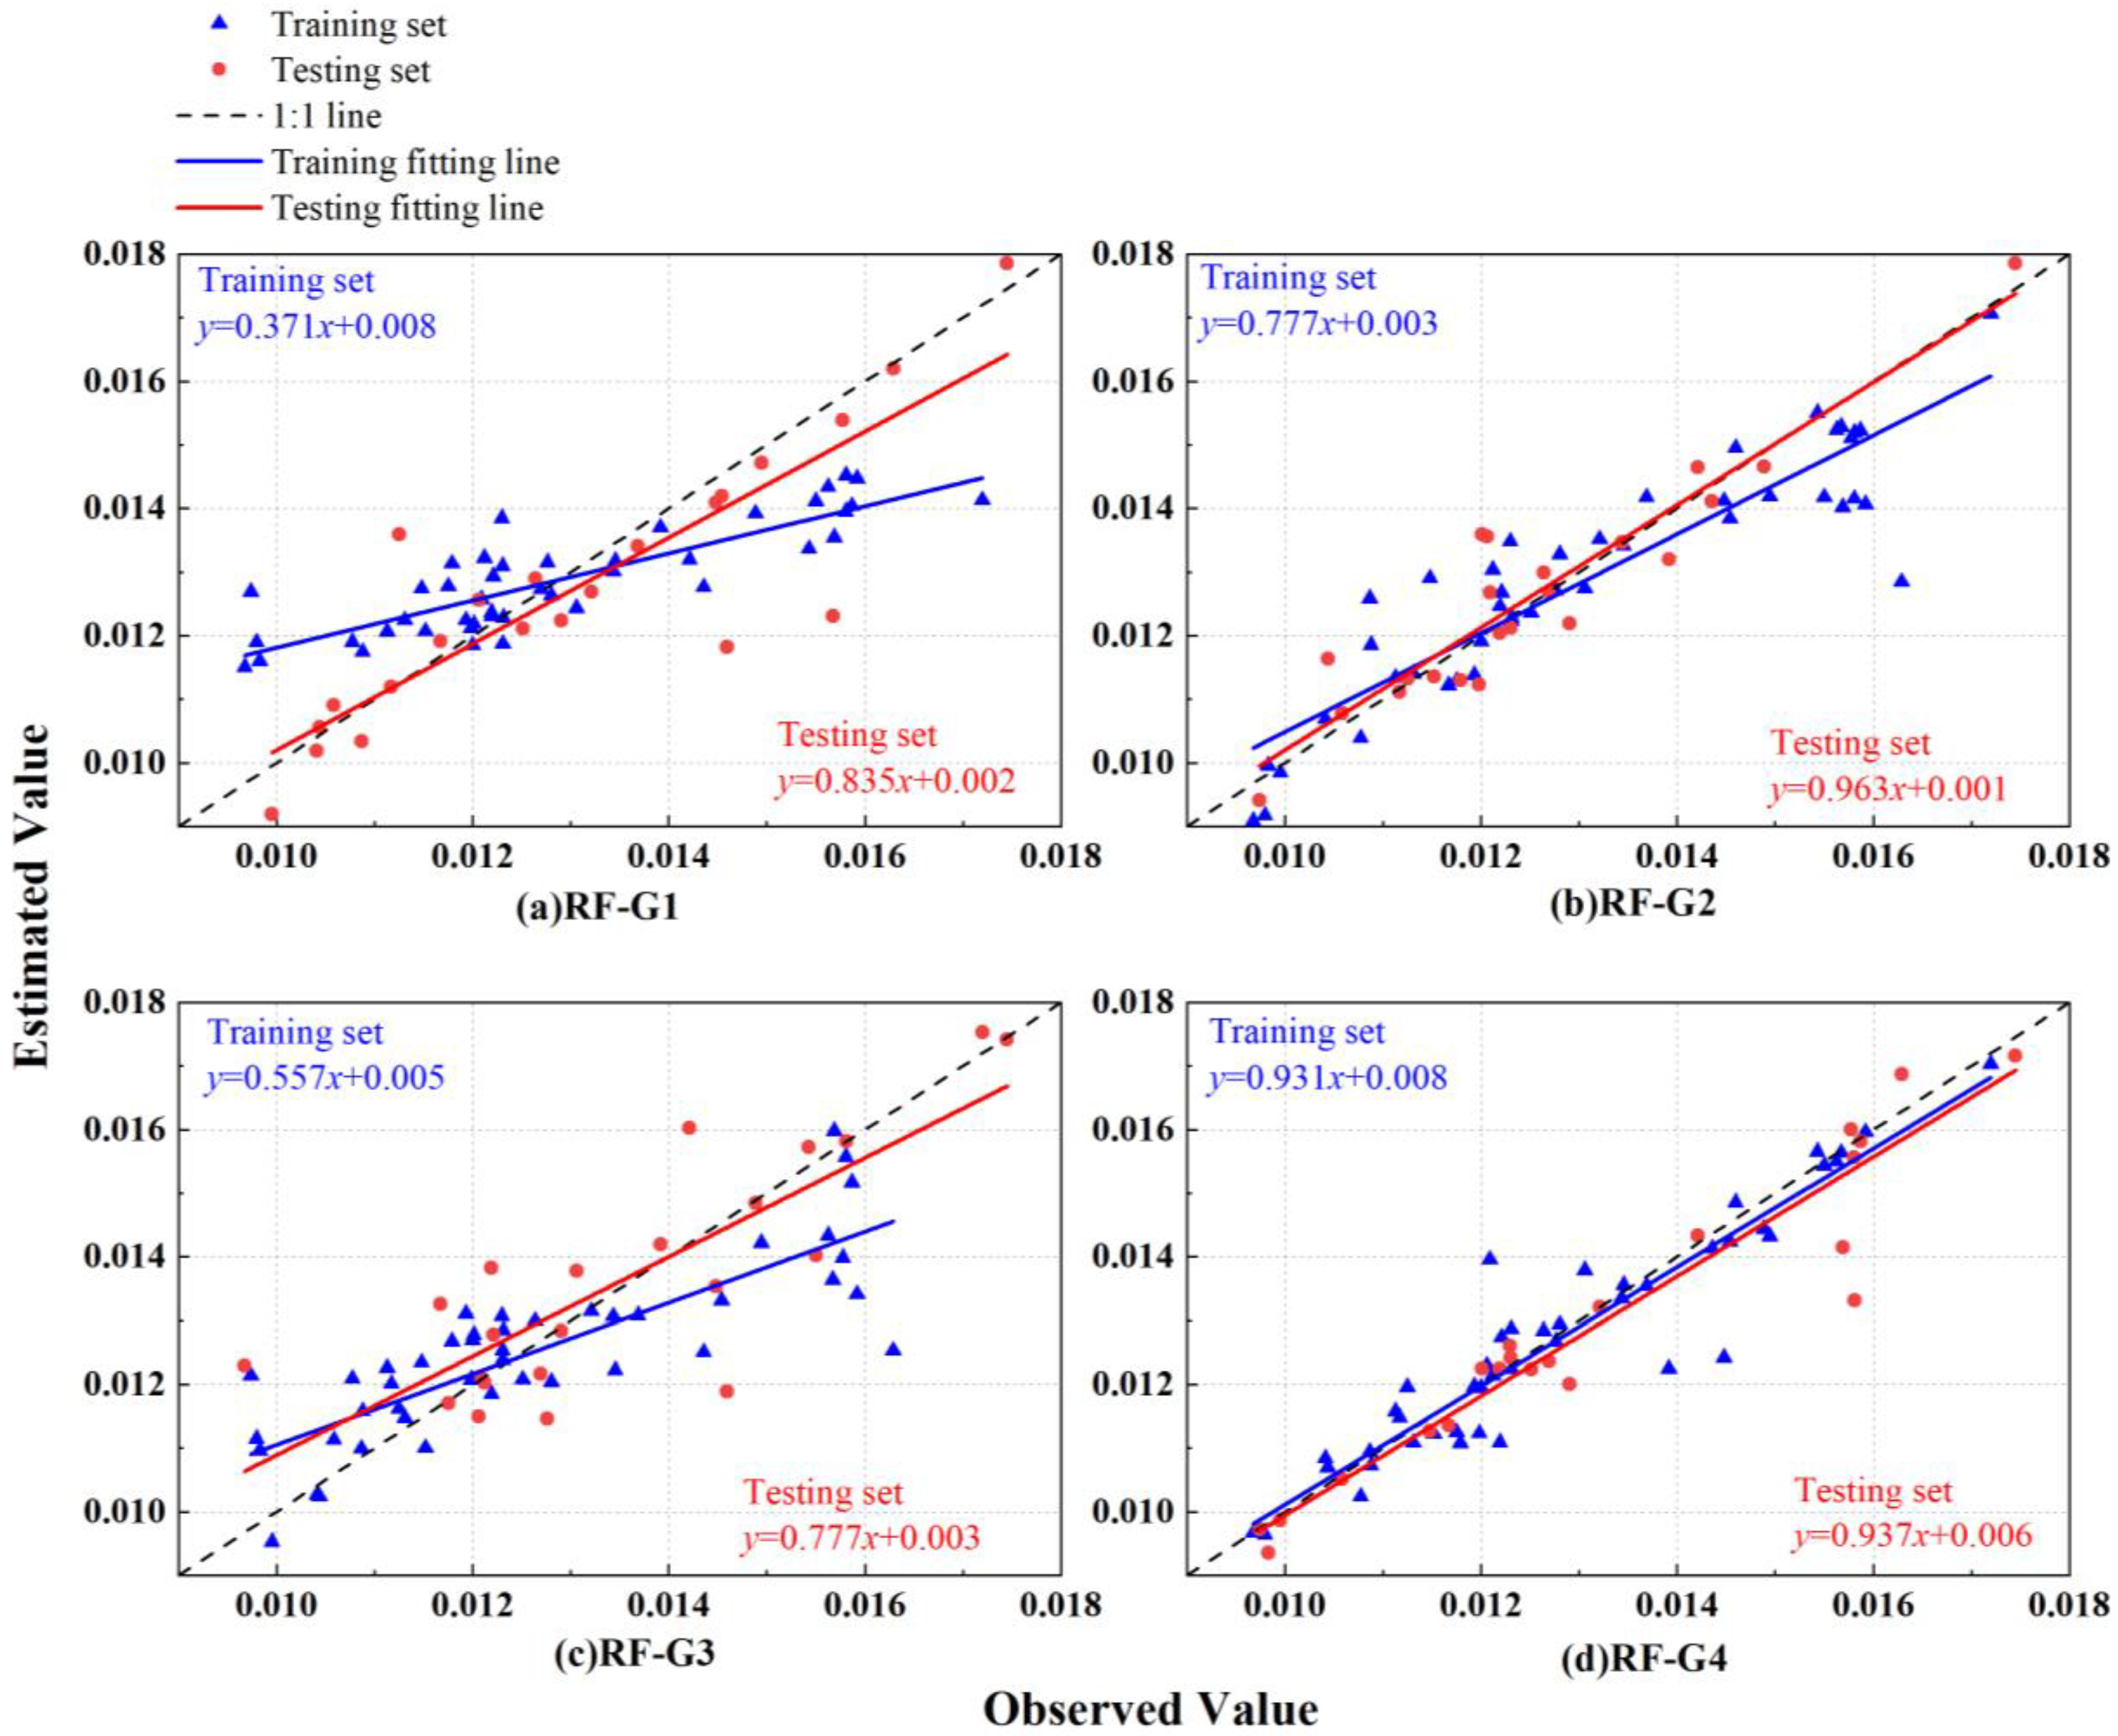
In summary, the G4 screening strategy and the RF method represent the optimal vegetation index screening strategy and model construction method, respectively, for LWC inversion in this study. The R2 values for the training set and the test set of the optimal LWC estimation model were 0.848 and 0.871, respectively. The RMSE values were 0.568% and 0.582%, while the MRE values were 0.806% and 0.642%, respectively. Figure 5 illustrates the linear fitting diagram under the RF model.
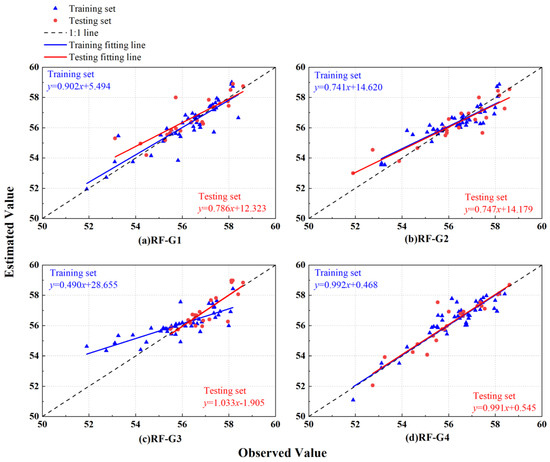
Figure 5.
(a–d) are the RF model inversion LWC fitting curves; (a) is the inversion LWC fitting curve under the G1 screening strategy, (b) is the inversion LWC fitting curve under the G2 screening strategy, (c) is the inversion LWC fitting curve under the G3 screening strategy, (d) is the inversion LWC fitting curve under the G4 screening strategy.
As shown in Table 7, it is evident that under the same screening strategy, the average R2 (0.777, 0.798) of the modeling set and the validation set in the EWT inversion model based on the RF algorithm is higher than the inversion model based on the RBFNN and SVM algorithms. Furthermore, the average RMSE (0.98 × 10⁻³ g·cm−2, 0.90 × 10⁻³ g·cm−2) and the average MRE (3.20%, 2.90%) demonstrate that the RF estimation model exhibits good fitting accuracy. Additionally, it can be observed that under the same model conditions, the R2 (0.887, 0.919) of the EWT estimation model for the modeling set and validation set under the G4 screening strategy are higher compared to the G1, G2, and G3 groups. Furthermore, the RMSE (0.6 × 10⁻³ g·cm−2, 0.7 × 10⁻³ g·cm−2) and MRE (5.68%, 4.67%) are low. These results indicate that the RF model is the most effective modeling method for EWT inversion, G4 represents the optimal spectral index screening strategy for EWT inversion, and Figure 6 depicts the linear fitting diagram under the RF model.

Figure 6.
(a–d) are the RF model inversion EWT fitting curves; (a) is the inversion EWT fitting curve under the G1 screening strategy, (b) is the inversion LWC fitting curve under the G2 screening strategy, (c) is the inversion EWT fitting curve under the G3 screening strategy, (d) is the inversion EWT fitting curve under the G4 screening strategy.
4. Discussion
Water serves as the fundamental component for photosynthesis and nutrient transport in plants. The water status of plant leaves plays a direct role in the growth processes of plants, subsequently impacting biomass and yield. Therefore, comprehending variations in leaf water potential and leaf water content is of paramount importance for understanding plant growth, assessing plant water status, and rational management of plant water resources [37,38]. Leveraging remote sensing technology allows for the effective monitoring and assessment of vegetation water status, including parameters like LWC and EWT. These parameters offer precise insights into the physiological condition of vegetation within the natural environment, enabling swift detection of drought conditions and timely implementation of irrigation measures [39,40].
4.1. The Optimal Spectral Index under Different Screening Strategies
In this study, hyperspectral remote sensing technology was employed to comprehensively examine and investigate the empirical/semi-empirical index methods utilized by previous researchers. The focus of this investigation centered on the inversion research of LWC and EWT, key water parameters relevant to C. camphora. Through an analysis of four distinct screening strategies and the application of three algorithm models, several noteworthy findings emerged:
The G1 group included empirical vegetation indices; specifically, eight indices closely related to plant water were chosen from a pool of hundreds of vegetation indices [23,24,25,26,27,28,29,30]. The investigation revealed that among these indices, the water index (WI) exhibited the highest correlation with LWC, with a correlation coefficient (R) of 0.713, utilizing bands at 900 nm and 970 nm. In the case of EWT, the Red Edge Normalized Vegetation Index (RE-NDVI) demonstrated the highest correlation, boasting a correlation coefficient (R) of 0.774 and utilizing bands at 705 nm and 750 nm. Conversely, other empirical vegetation indices yielded less favorable results. These findings align with prior research conducted by Penuelas [24], Alordzinu [41], Wang [25], Song [42], and others. Notably, measuring plant radiation through WI at 900 nm and 970 nm can significantly enhance the speed and precision of plant water assessment, proving valuable for on-site drought evaluation. Meanwhile, RE-NDVI proves highly effective in capturing vegetation water stress, affirming the robust predictive performance of WI and RE-NDVI in plant water estimation.
The G2 group employed a selection of random dual-band vegetation indices. Initially, three fundamental dual-band indices (DVI, RVI, NDVI) were chosen, and then fractional differentiation was applied to preprocess the original hyperspectral data. This process led to the construction of three first-order differential dual-band vegetation indices (DVI-FD, RVI-FD, NDVI-FD). Research has indicated that by utilizing various narrow-band spectral data or different band combinations, indices can often be further refined, allowing for the comprehensive exploitation of spectral information [30]. While there have been prior studies on plant water prediction, fractional differentials are infrequently employed for hyperspectral data preprocessing. However, research by Tang [31], Xia [43], and others has demonstrated that fractional order differentiation can significantly enhance the correlation between original hyperspectral data and selected parameters, ultimately improving model performance. It is important to note that there is typically no linear relationship between the band and the fractional order. Significant band changes only occur when the fractional order is an integer [44]. In this study, the use of first-order differential transformations effectively enhanced the correlation between dual-band vegetation indices and the water content of C. camphora. Matrix plots in Figure 3 and Figure 4 depict correlation coefficients between leaf water content and all DVI, RVI, and NDVI band combinations within the 1481 bands spanning the 350–1830 nm range. These plots demonstrate that first-order differentiation can effectively segment the original spectrum and accentuate spectral features’ details. Notably, the dual-band index with the highest correlation with LWC was DVI, featuring a correlation coefficient (R) of 0.739 and bands at 734 nm and 956 nm. After first-order differential transformation (DVI-FD), the correlation coefficient (R) increased to 0.766, with bands shifting to 1009 nm and 774 nm. Similarly, the dual-band index with the highest correlation with EWT was also DVI, exhibiting a correlation coefficient (R) of 0.820 and bands at 700 nm and 1167 nm. After first-order differential transformation (DVI-FD), the correlation coefficient (R) increased to 0.828, and bands shifted to 1182 nm and 1514 nm. Furthermore, it was observed that the selected random dual-band vegetation indices primarily resided within the red-edge (670–760 nm) and near-infrared (780–2526 nm) wavelength ranges. This aligns with the findings of Chen [45], Kolarik [46], Carter [47], and Zhuang [48]. Within the 400–700 nm range, reflectance is predominantly influenced by pigments like chlorophyll and carotenoids, which are directly impacted by plant water content. In the 800–1300 nm range, reflectivity is mainly attributed to changes in leaf internal structure induced by variations in plant water content. Finally, within the 1300–2500 nm range, reflectivity is influenced by the direct absorption of radiation by plant water.
The G3 group included the ‘trilateral’ parameters, which encompass spectral reflectance position, amplitude, area, and the spectral indices derived from them, all of which can elucidate the spectral characteristics of green vegetation [46]. Initially, eight ‘trilateral’ parameters closely associated with plant moisture were selected [34,35,36]. It was observed that the ‘trilateral’ parameter with the highest correlation with LWC was the red edge amplitude (Dr), featuring a correlation coefficient (R) of 0.664. In the case of EWT, the ‘trilateral’ parameter with the highest correlation was the red edge area (SDr), with a correlation coefficient (R) of 0.697. Notably, the correlation between the ‘trilateral’ parameters and the water content of C. camphora was lower compared to the empirical vegetation index and dual-band index. This observation aligns with findings from studies by Peng [49], Guo [50], Xie [51], and others. ‘Trilateral’ parameters exhibit greater sensitivity to factors such as leaf area index, nitrogen content, and chlorophyll content, while their response to plant water content varies at different growth stages.
Considering the strengths and weaknesses of the G1, G2, and G3 groups, we propose a more comprehensive hybrid group, G4, with the expectation of achieving more accurate inversion results. In the G4 group, all correlation coefficients (R) were compared, and five indices were selected for LWC: WI, OSAVI, DVI (734, 956 nm), DVI-FD (1009, 774 nm), and Dr. Additionally, five indices were chosen for EWT: RE-NDVI, SRWI, DVI (700, 1167 nm), DVI-FD (1182, 1514 nm), and SDr. The results are presented in Table 6 and Table 7, demonstrating varying degrees of improvement in the accuracy of the three models in the G4 group. According to the empirical/semi-empirical index method, the ten indices with the highest correlation coefficients with the moisture content of C. camphora, as selected in this study, leave room for optimization. Obtaining more water and spectral data at various growth stages could provide valuable insights, as the growth status of C. camphora can change significantly during different growth stages. Factors such as coverage, leaf area index, and chlorophyll content may also undergo alterations, thus impacting spectral reflectance. By refining the selection of more suitable vegetation indices using the empirical/semi-empirical index method, a more comprehensive theoretical foundation is established for future studies on water management in C. camphora.
4.2. Screening of Different Machine Learning Algorithms
Among the three modeling methods chosen in this study, the RF-based moisture estimation model for C. camphora demonstrates the highest accuracy, highlighting RF’s superiority over other models in the inversion of LWC and EWT. Previous research has shown that the choice of modeling methods significantly impacts prediction accuracy [52]. The findings in this study indicate that SVM yields lower prediction accuracy compared to the RF model. This can be attributed to the inherent challenge of SVM in determining the appropriate kernel function and associated parameters. Due to limitations in parameter selection, such as the kernel function and penalty factor, SVM’s applicability is somewhat constrained [53]. The RBFNN model slightly outperforms the SVM model, possibly due to several reasons. Plant water content is influenced by various factors, including vegetation cover, soil temperature, and air humidity. Multi-path spectral reflectance makes it challenging for the inversion model to be adequately characterized by simple linear or exponential models. However, the RBFNN algorithm employs the spherical basis function as the neuron’s activation function, imparting robust nonlinear mapping capabilities that can accommodate complex nonlinear relationships, such as nonlinear function approximation and pattern classification [54,55]. RF, as a machine learning method grounded in ensemble thinking, possesses strong self-learning capabilities. It is a composite model comprising multiple decision trees. Each decision tree is trained on a randomly selected feature subset, and the final prediction is reached through voting or averaging. This ensemble approach mitigates the risk of overfitting and enhances the model’s stability and accuracy [56]. Therefore, RF stands out as the preferred method for monitoring and modeling LWC and EWT in C. camphora. This study offers practical applications with real-time and efficient technical services for crop water status monitoring.
Currently, there remain several challenges in the inversion model for the LWC and EWT of C. camphora based on the preferred vegetation index. This study utilizes a limited amount of spectral information, and the spectral preprocessing method employed is singular. Therefore, it is advisable to explore a wider range of spectral index transformations, such as wavelet transform, in future research endeavors. Additionally, it is crucial to consider the incorporation of multi-source remote sensing data to comprehensively exploit the spectral information associated with C. camphora. The integration of more advanced machine learning algorithms should also be pursued to facilitate faster and more accurate predictions of LWC and EWT for C. camphora.
5. Conclusions
In this study, three categories of vegetation indices were computed, including empirical vegetation indices, random combination dual-band vegetation indices, and ‘trilateral’ parameters. Four distinct screening strategies were established, denoted as the empirical vegetation index group (G1), random combination dual-band vegetation index group (G2), ‘trilateral’ parameter group (G3), and mixed group (G4). Subsequently, the LWC and EWT of mature C. camphora were estimated employing the RF, RBFNN, and SVM algorithms. The key findings are summarized as follows:
(1) The empirical vegetation index group (G1) identified WI and RE-NDVI as the optimal spectral indices. The random combination dual-band vegetation index group (G2) selected DVI-FD (1009, 774 nm) and DVI-FD (1182, 1514 nm) as the optimal spectral indices. The trilateral parameter group (G3) determined Dr and SDr as the optimal spectral indices. The final mixed group (G4) screened five optimal spectral indices for LWC: WI, OSAVI, DVI (734, 956 nm), DVI-FD (1009, 774 nm), and Dr. Additionally, five indices were chosen for EWT: RE-NDVI, SRWI, DVI (700, 1167 nm), DVI-FD (1182, 1514 nm), and SDr.
(2) When using the same input variables, the RF model proves to be the most effective modeling method for both LWC and EWT estimation of C. camphora, with the highest model accuracy observed in the G4 group. The R2 values for the training set and the test set of the LWC inversion model were 0.848 and 0.871, the RMSE values were 0.568% and 0.582%, and the MRE values were 0.806% and 0.642%, respectively. For the EWT inversion model, the R2 values for the training set and the test set were 0.887 and 0.919, the RMSE values were 0.6 × 10⁻³ g·cm−2 and 0.7 × 10⁻³ g·cm−2, and the MRE values were 3.198% and 2.901%, respectively.
This study also presents an enhancement strategy for the extensive application of camphor and outlines the following prospective research directions for future investigations: validate the proposed vegetation indices over an extended temporal scale and gather comprehensive moisture data for C. camphora to precisely evaluate moisture content throughout various time periods, and Investigate more advanced models for screening vegetation indices and employ advanced machine learning algorithms.
Author Contributions
Conceptualization, J.Z. and Z.J.; methodology, B.Y.; software, H.W.; validation, H.Z. and B.Y.; formal analysis, B.Y.; investigation, B.Y.; resources, J.Z. and X.L; data curation, H.W. and Y.Z.; writing—original draft preparation, B.Y.; writing—review and editing, X.L.; visualization, H.Z.; supervision, J.Z.; project administration, X.L.; funding acquisition, X.L. and J.Z. All authors have read and agreed to the published version of the manuscript.
Funding
This research was funded by the National Natural Science Foundation of China, grant numbers 52269013 and 32060333, Jiangxi Provincial Natural Science Foundation Project of China, grant number 20232BAB205031, Jiangxi Provincial Science and Technology Department Major Science and Technology Project of China, grant number 20203ABC28W016-01-04, Jiangxi Forestry Bureau camphor tree research project of China, grant number 202007-01-04, and Jiangxi Provincial Department of Education Science and Technology Project of China, grant numbers GJJ190977 and GJJ190946.
Data Availability Statement
All data generated or presented in this study are available upon request from corresponding author. Furthermore, the models and code used during the study cannot be shared at this as the data also form part of an ongoing study.
Conflicts of Interest
The authors declare no conflict of interest.
References
- Ravindran, P.N.; Babu, K.N.; Shylaja, M. Cinnamon and Cassia: The Genus Cinnamonum; CRC Press: Boca Raton, FL, USA, 2004. [Google Scholar]
- Zhang, T.; Zheng, Y.; Fu, C.; Yang, H.; Liu, X.; Qiu, F.; Wang, X.; Wang, Z. Chemical Variation and Environmental Influence on Essential Oil of Cinnamomum camphora. Molecules 2023, 28, 973. [Google Scholar] [CrossRef]
- Sun, H.; Feng, M.; Xiao, L.; Yang, W.; Wang, C.; Jia, X.; Zhao, Y.; Zhao, C.; Muhammad, S.K.; Li, D. Assessment of Plant Water Status in Winter Wheat (Triticum aestivum L.) Based on Canopy Spectral Indices. PLoS ONE 2019, 14, e0216890. [Google Scholar] [CrossRef]
- Xia, Y.; Zhang, X.; Dai, J.; Wang, R.; Luo, Z. Water Use Characteristics of Cinnamomum camphora in Subtropical Monsoon Region. J. Soil. Water Conserv. 2022, 36, 195–205. [Google Scholar] [CrossRef]
- Wang, Z.; Huang, H.; Wang, H.; Peñuelas, J.; Sardans, J.; Niinemets, Ü.; Niklas, K.J.; Li, Y.; Xie, J.; Wright, I.J. Leaf Water Content Contributes to Global Leaf Trait Relationships. Nat. Commun. 2022, 13, 5525. [Google Scholar] [CrossRef]
- Glenn Downing, H.; Carter, G.A.; Holladay, K.W.; Cibula, W.G. The radiative-equivalent water thickness of leaves. Remote Sens. Environ. 1993, 46, 103–107. [Google Scholar] [CrossRef]
- Liu, S.; Peng, Y.; Du, W.; Le, Y.; Li, L. Remote Estimation of Leaf and Canopy Water Content in Winter Wheat with Different Vertical Distribution of Water-Related Properties. Remote Sens. 2015, 7, 4626–4650. [Google Scholar] [CrossRef]
- Ralf, G.; Martin, K. Monitoring leaf water content with THz and sub-THz waves. Plant Methods 2015, 11, 15. [Google Scholar] [CrossRef]
- Lorenzo, B.; Mario, P.; Luca, M.; Alessandra, T.; Giorgio, C.; Paolo, S.; Alwssandro, T. Non-invasive absolute measurement of leaf water content using terahertz quantum cascade lasers. Plant Methods 2017, 13, 51. [Google Scholar] [CrossRef]
- Flynn, K.C.; Baath, G.; Lee, T.O.; Gowda, P.; Northup, B. Hyperspectral Reflectance and Machine Learning to Monitor Legume Biomass and Nitrogen Accumulation. Comput. Electron. Agric. 2023, 211, 107991. [Google Scholar] [CrossRef]
- Cai, X.; Wu, L.; Li, Y.; Lei, S.; Xu, J.; Lyu, H.; Li, J.; Wang, H.; Dong, X.; Zhu, Y.; et al. Remote Sensing Identification of Urban Water Pollution Source Types Using Hyperspectral Data. J. Hazard. Mater. 2023, 459, 132080. [Google Scholar] [CrossRef]
- Khdery, G.A.; Helal, N.M.; Saleh, H.A. Using Hyperspectral Indices for Investigation Polluted Plants and Soil in Abu Zabaal Area, Egypt. Acta Ecol. Sin. 2022, 43, 776–784. [Google Scholar] [CrossRef]
- Zhang, J.; Zhang, W.; Xiong, S.; Song, Z.; Tian, W.; Shi, L.; Ma, X. Comparison of New Hyperspectral Index and Machine Learning Models for Prediction of Winter Wheat Leaf Water Content. Plant Methods 2021, 17, 34. [Google Scholar] [CrossRef]
- Yi, Q.; Bao, A.; Wang, Q.; Zhao, J. Estimation of Leaf Water Content in Cotton by Means of Hyperspectral Indices. Comput. Electron. Agric. 2013, 90, 144–151. [Google Scholar] [CrossRef]
- Hennessy, A.; Clarke, K.; Lewis, M. Hyperspectral Classification of Plants: A Review of Waveband Selection Generalisability. Remote Sens. 2020, 12, 113. [Google Scholar] [CrossRef]
- Zhang, Z.; Fu, Y.; Li, H.; Guo, J.; Pan, Y.; Zhang, Y.; Zhang, W.; Wang, J.; Liu, Y.; Liu, L. Monitoring the Leaf Equivalent Water Thickness of Kiwifruit in High Temperature Using Leaf Spectral Reflectance. Spectrosc. Lett. 2022, 55, 659–672. [Google Scholar] [CrossRef]
- Li, J.; Wijewardane, N.K.; Ge, Y.; Shi, Y. Improved Chlorophyll and Water Content Estimations at Leaf Level with a Hybrid Radiative Transfer and Machine Learning Model. Comput. Electron. Agric. 2023, 206, 107669. [Google Scholar] [CrossRef]
- Zhang, H.M.; Wang, B.R.; Xu, M.G.; Fan, T.L. Crop yield and soil responses to long-term fertilization on a red soil in southern China. Pedosphere 2009, 19, 199–207. [Google Scholar] [CrossRef]
- He, L.; Liu, M.R.; Zhang, S.H.; Guan, H.W.; Wang, C.Y.; Feng, W.; Guo, T.C. Remote Estimation of Leaf Water Concentration in Winter Wheat under Different Nitrogen Treatments and Plant Growth Stages. Precis. Agric. 2023, 24, 986–1013. [Google Scholar] [CrossRef]
- Lin, W.; Li, Y.; Du, S.; Zheng, Y.; Gao, J.; Sun, T. Effect of Dust Deposition on Spectrum-Based Estimation of Leaf Water Content in Urban Plant. Ecol. Indic. 2019, 104, 41–47. [Google Scholar] [CrossRef]
- Zimmermann, B.; Kohler, A. Optimizing Savitzky-Golay Parameters for Improving Spectral Resolution and Quantification in Infrared Spectroscopy. Proc. Appl. Spectrosc. 2013, 67, 892–902. [Google Scholar] [CrossRef]
- Hong, Y.; Liu, Y.; Chen, Y.; Liu, Y.; Yu, L.; Liu, Y.; Cheng, H. Application of Fractional-Order Derivative in the Quantitative Estimation of Soil Organic Matter Content through Visible and Near-Infrared Spectroscopy. Geoderma 2019, 337, 758–769. [Google Scholar] [CrossRef]
- Gao, B.C. NDWI—A Normalized Difference Water Index for Remote Sensing of Vegetation Liquid Water from Space. Remote Sens. Environ. 1996, 58, 257–266. [Google Scholar] [CrossRef]
- Penuelas, J.; Pinol, J.; Ogaya, R.; Filella, I. Estimation of Plant Water Concentration by the Reflectance Water Index WI (R900/R970). Int. J. Remote Sens. 1997, 18, 2869–2875. [Google Scholar] [CrossRef]
- Wang, X.; Zhao, C.; Guo, N.; Li, Y.; Jian, S.; Yu, K. Determining the Canopy Water Stress for Spring Wheat Using Canopy Hyperspectral Reflectance Data in Loess Plateau Semiarid Regions. Spectrosc. Lett. 2015, 48, 492–498. [Google Scholar] [CrossRef]
- Hunt, E.R.; Rock, B.N. Detection of Changes in Leaf Water Content Using Near- and Middle-Infrared Reflectances. Remote Sens. Environ. 1989, 30, 43–54. [Google Scholar] [CrossRef]
- Zarco-Tejada, P.J.; Rueda, C.A.; Ustin, S.L. Water Content Estimation in Vegetation with MODIS Reflectance Data and Model Inversion Methods. Remote Sens. Environ. 2003, 85, 109–124. [Google Scholar] [CrossRef]
- Rondeaux, G.; Steven, M.; Baret, F. Optimization of Soil-Adjusted Vegetation Indices. Remote Sens. Environ. 1996, 55, 95–107. [Google Scholar] [CrossRef]
- Gamon, J.A.; Peñuelas, J.; Field, C.B. A Narrow-Waveband Spectral Index That Tracks Diurnal Changes in Photosynthetic Efficiency. Remote Sens. Environ. 1992, 41, 35–44. [Google Scholar] [CrossRef]
- Kimes, D.S.; Markham, B.L.; Tucker, C.J.; McMurtrey, J.E. Temporal Relationships between Spectral Response and Agronomic Variables of a Corn Canopy. Remote Sens. Environ. 1981, 11, 401–411. [Google Scholar] [CrossRef]
- Tang, Z.; Guo, J.; Xiang, Y.; Lu, X.; Wang, Q.; Wang, H.; Cheng, M.; Wang, H.; Wang, X.; An, J.; et al. Estimation of Leaf Area Index and Above-Ground Biomass of Winter Wheat Based on Optimal Spectral Index. Agronomy 2022, 12, 1729. [Google Scholar] [CrossRef]
- Shi, H.; Guo, J.; An, J.; Tang, Z.; Wang, X.; Li, W.; Zhao, X.; Jin, L.; Xiang, Y.; Li, Z.; et al. Estimation of Chlorophyll Content in Soybean Crop at Different Growth Stages Based on Optimal Spectral Index. Agronomy 2023, 13, 663. [Google Scholar] [CrossRef]
- Zhang, W.; Li, Z.; Pu, Y.; Zhang, Y.; Tang, Z.; Fu, J.; Xu, W.; Xiang, Y.; Zhang, F. Estimation of the Leaf Area Index of Winter Rapeseed Based on Hyperspectral and Machine Learning. Sustainability 2023, 15, 12930. [Google Scholar] [CrossRef]
- Blackburn, G.A. Hyperspectral Remote Sensing of Plant Pigments. J. Exp. Bot. 2007, 58, 855–867. [Google Scholar] [CrossRef]
- Zheng, J.; Li, F.; Du, X. Using Red Edge Position Shift to Monitor Grassland Grazing Intensity in Inner Mongolia. J. Indian. Soc. Remote Sens. 2018, 46, 81–88. [Google Scholar] [CrossRef]
- Zhang, C.; Cai, H.J.; Li, Z.J. Estimation of Fraction of Absorbed Photosynthetically Active Radiation for Winter Wheat Based on Hyperspectral Characteristic Parameters. Guang Pu Xue Yu Guang Pu Fen Xi/Spectrosc. Spectr. Anal. 2015, 35, 2644–2649. [Google Scholar] [CrossRef]
- Badzmierowski, M.J.; McCall, D.S.; Evanylo, G. Using Hyperspectral and Multispectral Indices to Detect Water Stress for an Urban Turfgrass System. Agronomy 2019, 9, 439. [Google Scholar] [CrossRef]
- Kim, J.Y.; Glenn, D.M. Multi-Modal Sensor System for Plant Water Stress Assessment. Comput. Electron. Agric. 2017, 141, 27–34. [Google Scholar] [CrossRef]
- Zhang, L.; Zhou, Z.; Zhang, G.; Meng, Y.; Chen, B.; Wang, Y. Monitoring the Leaf Water Content and Specific Leaf Weight of Cotton (Gossypium hirsutum L.) in Saline Soil Using Leaf Spectral Reflectance. Eur. J. Agron. 2012, 41, 103–117. [Google Scholar] [CrossRef]
- Yi, Q.; Wang, F.; Bao, A.; Jiapaer, G. Leaf and Canopy Water Content Estimation in Cotton Using Hyperspectral Indices and Radiative Transfer Models. Int. J. Appl. Earth Obs. Geoinf. 2014, 33, 67–75. [Google Scholar] [CrossRef]
- Alordzinu, K.E.; Li, J.; Lan, Y.; Appiah, S.A.; Al Aasmi, A.; Wang, H.; Liao, J.; Sam-amoah, L.K.; Qiao, S. Ground-Based Hyperspectral Remote Sensing for Estimating Water Stress in Tomato Growth in Sandy Loam and Silty Loam Soils. Sensors 2021, 21, 5705. [Google Scholar] [CrossRef]
- Song, K.E.; Hong, S.S.; Hwang, H.R.; Hong, S.H.; Shim, S.I. Effect Analysis of Hydrogen Peroxide Using Hyperspectral Reflectance in Sorghum [Sorghum bicolor (L.) Moench] under Drought Stress. Plants 2023, 12, 2958. [Google Scholar] [CrossRef]
- Xia, Z.; Yang, J.; Wang, J.; Wang, S.; Liu, Y. Optimizing Rice Near-Infrared Models Using Fractional Order Savitzky–Golay Derivation (FOSGD) Combined with Competitive Adaptive Reweighted Sampling (CARS). Appl. Spectrosc. 2020, 74, 417–426. [Google Scholar] [CrossRef]
- Sun, J.; Yang, W.; Zhang, M.; Feng, M.; Xiao, L.; Ding, G. Estimation of Water Content in Corn Leaves Using Hyperspectral Data Based on Fractional Order Savitzky-Golay Derivation Coupled with Wavelength Selection. Comput. Electron. Agric. 2021, 182, 105989. [Google Scholar] [CrossRef]
- Chen, Z.; Dou, M.; Xia, R.; Li, G.; Shen, L. Spatiotemporal Evolution of Chlorophyll—A Concentration from MODIS Data Inversion in the Middle and Lower Reaches of the Hanjiang River, China. Environ. Sci. Pollut. Res. 2022, 29, 38143–38160. [Google Scholar] [CrossRef]
- Kolarik, N.E.; Ellis, G.; Gaughan, A.E.; Stevens, F.R. Describing Seasonal Differences in Tree Crown Delineation Using Multispectral UAS Data and Structure from Motion. Remote Sens. Lett. 2019, 10, 864–873. [Google Scholar] [CrossRef]
- Carter, G.A. Primary and secondary effects of water content on the spectral reflectance of leaves. Am. J. Bot. 1991, 78, 916–924. [Google Scholar] [CrossRef]
- Zhuang, T.; Zhang, Y.; Li, D.; Schmidhalter, U.; Ata-UI-Karim, S.T.; Cheng, T.; Liu, X.; Tian, Y.; Zhu, Y.; Cao, W.; et al. Coupling Continuous Wavelet Transform with Machine Learning to Improve Water Status Prediction in Winter Wheat. Precis. Agric. 2023, 24, 2171–2199. [Google Scholar] [CrossRef]
- Peng, Z.; Lin, S.; Zhang, B.; Wei, Z.; Liu, L.; Han, N.; Cai, J.; Chen, H. Winter Wheat Canopy Water Content Monitoring Based on Spectral Transforms and “Three-Edge” Parameters. Agric. Water Manag. 2020, 240, 106306. [Google Scholar] [CrossRef]
- Guo, B.B.; Zhu, Y.J.; Feng, W.; He, L.; Wu, Y.P.; Zhou, Y.; Ren, X.X.; Ma, Y. Remotely Estimating Aerial n Uptake in Winter Wheat Using Red-Edge Area Index from Multi-Angular Hyperspectral Data. Front. Plant Sci. 2018, 9, 675. [Google Scholar] [CrossRef]
- Xie, Q.; Dash, J.; Huang, W.; Peng, D.; Qin, Q.; Mortimer, H.; Casa, R.; Pignatti, S.; Laneve, G.; Pascucci, S.; et al. Vegetation Indices Combining the Red and Red-Edge Spectral Information for Leaf Area Index Retrieval. IEEE J. Sel. Top. Appl. Earth Obs. Remote Sens. 2018, 11, 1482–1493. [Google Scholar] [CrossRef]
- Duarte-Carvajalino, J.M.; Silva-Arero, E.A.; Góez-Vinasco, G.A.; Torres-Delgado, L.M.; Ocampo-Paez, O.D.; Castaño-Marín, A.M. Estimation of Water Stress in Potato Plants Using Hyperspectral Imagery and Machine Learning Algorithms. Horticulturae 2021, 7, 176. [Google Scholar] [CrossRef]
- Azarmdel, H.; Jahanbakhshi, A.; Mohtasebi, S.S.; Muñoz, A.R. Evaluation of Image Processing Technique as an Expert System in Mulberry Fruit Grading Based on Ripeness Level Using Artificial Neural Networks (ANNs) and Support Vector Machine (SVM). Postharvest Biol. Technol. 2020, 166, 111201. [Google Scholar] [CrossRef]
- Nie, S.; Wang, Y.; Tu, J.; Li, P.; Xu, J.; Li, N.; Wang, M.; Huang, D.; Song, J. Retrieval of Soil Moisture Content Based on Multisatellite Dual-Frequency Combination Multipath Errors. Remote Sens. 2022, 14, 3193. [Google Scholar] [CrossRef]
- Zeng, X.; Zhen, Z.; He, J.; Han, L. A Feature Selection Approach Based on Sensitivity of RBFNNs. Neurocomputing 2018, 275, 2200–2208. [Google Scholar] [CrossRef]
- Fu, Z.; Jiang, J.; Gao, Y.; Krienke, B.; Wang, M.; Zhong, K.; Cao, Q.; Tian, Y.; Zhu, Y.; Cao, W.; et al. Wheat Growth Monitoring and Yield Estimation Based on Multi-Rotor Unmanned Aerial Vehicle. Remote Sens. 2020, 12, 508. [Google Scholar] [CrossRef]


Disclaimer/Publisher’s Note: The statements, opinions and data contained in all publications are solely those of the individual author(s) and contributor(s) and not of MDPI and/or the editor(s). MDPI and/or the editor(s) disclaim responsibility for any injury to people or property resulting from any ideas, methods, instructions or products referred to in the content. |
© 2023 by the authors. Licensee MDPI, Basel, Switzerland. This article is an open access article distributed under the terms and conditions of the Creative Commons Attribution (CC BY) license (https://creativecommons.org/licenses/by/4.0/).