Article

Study on the Extraction and Identification of DNA from Ten Dalbergia Species

1
College of Art and Design, Southwest Forestry University, Kunming 650224, China
2
Industrial Engineering Institute, Yunnan Forestry Technological College, Kunming 650224, China
3
International Joint Research Center for Biomass Materials, Southwest Forestry University, Kunming 650224, China
*
Author to whom correspondence should be addressed.
Forests 2023, 14(12), 2318; https://doi.org/10.3390/f14122318
Submission received: 19 October 2023 / Revised: 22 November 2023 / Accepted: 24 November 2023 / Published: 26 November 2023
(This article belongs to the Special Issue DNA Barcoding for Species Identification of Forest Organisms)

Abstract

:
Most Dalbergia species are economically valuable and have been over-exploited, which has raised concerns. The regulation and protection of this genus require accurate and rapid authentication and identification processes. To address the issue of high residual inhibitors in extracted DNA from the Dalbergia xylem, an optimized DNA extraction experiment was performed on 10 species of Dalbergia wood stored for 1–5 years; in particular, no gene sequence for D. tsoi can be found in the NCBI database. Additionally, universal primers ITS2 were used for PCR amplification and sequencing to confirm the effectiveness of DNA extraction. The results revealed that rinsing the wood with 0.25 M ammonium acetate buffer produced DNA with a high purity, without a significant decrease in the DNA yield. To achieve an optimal DNA yield, the wood DNA should be rinsed with ammonium acetate fewer than three times. All the wood DNA obtained using the kit method and treated with the ammonium acetate buffer rinsing solution one to four times was successfully amplified. The NJ phylogenetic tree constructed based on ITS2 can distinguish D. tsoi from other Dalbergia spp., and the predicted ITS2 secondary structure showed the difference between species. This experiment extracted high-quality DNA from wood, without the need for purification kits, thereby improving the efficiency of the extraction process. The extracted DNA was directly used for follow-up molecular experiments.

1. Introduction

The genus Dalbergia, a pantropical member of the Fabaceae family, comprises various plant species found in Central South America, Africa, and Asia. The genus comprises about 269 species in the world, including trees, shrubs, and vines [1,2]. Most of these species have high economic value owing to the presence of precious rosewood species [1,3], while some of these species have vital medicinal properties [4]. The excessive trade in rosewood has raised concerns, leading to the inclusion of all Dalbergia species in Appendix II of the CITES convention in 2016, except for Dalbergia nigra, which is listed in CITES Appendix I [2,5]. The identification of Dalbergia species serves as a basis for implementing effective conservation measures, facilitating the assessment of species diversity, and evaluating population trends [6].
Traditional wood identification mainly depends on wood morphological traits, anatomical characteristics, and chemical composition. This identification process requires personnel with extensive professional expertise and experience and involves strong subjective judgment. Traditional identification methods often restrict classification to the genus level, and variations in anatomical structures are common in the same species, posing a significant challenge for accurate identification [7,8,9]. The introduction of DNA barcoding technology addresses the shortcomings of traditional methods and enables direct identification of the species level in wood analysis. These advancements overcome the limitations associated with factors such as tissue location, development period, and sample status [10]. DNA barcoding technology has become a research hotspot in modern biological taxonomy, promoting the development of wood identification technology [11,12,13,14].
Moreover, DNA barcoding is a method for identifying plant and animal species using developing systems that utilize DNA sequences as “barcodes” for taxonomic units. This process requires DNA fragments that are sufficiently variable, easily amplifiable, and relatively short to accurately represent the species. Standard barcodes for species [15,16,17] and various combinations of candidate DNA regions have been proposed for plant taxonomic identification [18,19,20]. However, commonly used standard DNA barcodes in plants, namely rbcL, matK, trnL-trnF, and trnH-psbA, are easily amplifiable but exhibit poor performance at the species level for Dalbergia. This limitation mainly originates from insufficient genetic variations [21,22,23]. Nevertheless, ITS barcodes feature a low success rate in the process of amplification but exhibit a relatively high resolution in the identification of wood species [24,25,26,27].
Extraction of high-quality DNA from wood tissues is a vital prerequisite for performing wood DNA barcoding. DNA extraction from fresh plant tissues (such as leaves or buds) is a routine procedure in molecular biology research, characterized by its relative ease, well-established process, and stability. This extraction can be efficiently performed with a high degree of purity using either general conventional methods or commercially available kits [28,29]. However, wood tissues often contain a small amount of DNA, with polysaccharides and polyphenols in sapwood and extractives such as resins, gums, essential oils, and pigments in heartwood. These components significantly influence the purity of extracted DNA from wood [9,30,31]. These contaminants feature a strong inhibitory effect on polymerase chain reaction (PCR) amplification. Consequently, PCR performed directly using an unpurified DNA stock solution extracted from heartwood may result in an inefficient amplification of the target bands. Therefore, previous studies have indicated the need to perform a second purification process on the extracted DNA stock solution using a purification kit. However, this secondary purification process often leads to a decrease in DNA yields [32,33].
In this study, 10 wood species from the genus Dalbergia were selected as research subjects to develop an efficient method for extracting total DNA from difficult-to-purify wood. This method leveraged the characteristic of an extended time required for DNA release from wood [33]. This approach involved rinsing the wood powder before DNA was released from the wood to eliminate most inhibitors. The extraction steps were optimized to improve the yield and purity of wood DNA, without the need for purification kits. The total extracted DNA served as a template for amplifying the ITS2 gene fragment and identifying molecular species to confirm the effectiveness of DNA extraction and identification.

2. Materials and Methods

Most samples were purchased from the market, while other samples were provided by Kaihong Li, president of Hainan Jiangzhenxiang Association. Notably, among these species, Dalbergia. odorifera, D. sissoo, D. oliveri, D. cochinchinensis, D. obtusifolia, D. melanoxylon, and D. cultrata were trees suitable for making high-grade furniture. Moreover, D. pinnata, D. tsoi, and D. benthamii were classified as woody vines and have significant value as medicinal herbs, known as descending incense in China. Further details about the sample sources are shown in Table 1.
Reagent: Trichloromethane (Shandian Pharmaceutical Co., Ltd., Yunnan, China); Tris (Shanghai Yuanye Biotechnology Co., Ltd., Shanghai, China); EDTA, sodium hydroxide purchased from Tianjin Fengchuan Chemical Reagent Technology Co., Ltd., Tianjin, China; TS-GelRed nucleic acid gel dyes Ver.2, 1.1×T3 Super PCR Mix, agarose were purchased from Beijing Qingke Biotechnology Co., Ltd., Beijing, China; B500350 molecular weight standard Marker DL2000, polyethylpyrrolidone (PVP), 50× TAE, anhydride ethanol and dithiothreitol purchased from Shanghai Shengong Biological Engineering Co., Ltd., Shanghai, China; Cetyltrimethyl ammonium bromide (CTAB), TE buffer, sodium chloride purchased from Langeco Technology Co., Ltd., Beijing, China.

2.1. Sample Pretreatment

2.1.1. Wood Powder Preparation

Before DNA extraction, the outer surface of all wood samples with a thickness of ~5 mm was removed using a blade treated with 75% alcohol to prevent contamination from exogenous sources. The wood samples were cut into cubes measuring 20 mm × 30 mm × 40 mm, and wood slice shavings with a thickness of about 5–10 μm were prepared using a slide-away slicer. Before grinding, polyvinylpyrrolidone powder was added to the wood slices to prevent browning. Liquid nitrogen was continuously added to the mortar to grind these wood slices into fine sand. Subsequently, the resulting fine sand was placed in a desiccator for over 4 h to maintain the constant moisture content in the wood powder. Approximately 100 mg of the wood powder was accurately weighed and transferred to 2 mL centrifugal tubes. These tubes were stored in a low-temperature refrigerator at −20 °C for future use.

2.1.2. Rinsing Treatment

Ammonium acetate plays a significant role in DNA extraction and purification and is commonly used for salt purification after material lysis [34,35,36]. In this study, ammonium acetate was added to nuclear isolate solution as a pre-treatment step to remove inhibitors before the wood was lysed in a water bath. A total of 1000 μL of ammonium acetate solution and nuclear isolate were added to each 2 mL centrifugal tube containing an inverted and mixed sample of wood powder and held for 1 min. Subsequently, the mixture was centrifuged at 1, 4000 r/min for 1 min, and the supernatant was discarded. The components of the nuclear isolation solution included 100 mM Tris-HCl (pH = 8.0), 20 mM EDTA (pH = 8.0), and 0.2 M NaCl. The concentration gradient of the ammonium acetate solution was 0.25, 0.5, 1, and 2 mol/L. The process was repeated once to enhance the removal of inhibitors from the sample. The effects of different gradient concentrations on the purity and yield of wood DNA were investigated to determine the optimal conditions for achieving the highest purity and yield of wood DNA. To achieve the maximum purity and total yield of DNA with the ammonium acetate washing concentration, the effect of the number of rinse times on the purity and yield of wood DNA at this concentration was explored. A total of five gradient rinse times were designed.

2.2. DNA Extraction

2.2.1. Modified Cetyltrimethylammonium Bromide (CTAB)

First, 600 μL of CTAB cleavage extract, preheated in a 65 °C water bath, was added to the wood powder samples in a 2 mL centrifuge tube after rinsing. The CTAB extract composition (pH = 8.0) comprised 2% CTAB, Tris-HCl 0.1 mol/L, EDTA 20 mmol/L, NaCl 1.4 mol/L, and 2% volume of dithiothreitol. During the incubation period in a water bath, the mixture was inverted, stirred every 2 h, and maintained at 65 °C for 5 h. After cooling for 2 min, 500 μL of chloroform–isoamyl alcohol (24:1) solution and 20 μL of 7.5 mol/L ammonium acetate solution were added to the mixture in the centrifugal tube. The mixture was inverted and stirred for 1 min, followed by centrifugation for 3 min at 12,000 r/min. Then, the supernatant was transferred into a new centrifugal tube, and 0.6 times the volume of ice-cold isopropanol was added, inverted, and thoroughly mixed. The resulting mixture obtained from this step was added to an adsorption column and subsequently transferred into a new centrifuge tube. The mixture obtained from the previous step was introduced into a nucleic acid purification adsorption column (EZ-10, produced by Shanghai Shenggong Biological Engineering Co., LTD, Shanghai, China), and the adsorption column was placed in a collection tube and centrifuged at 12 000 r/min for 30 s. The liquid in the collection tube was poured out, and the adsorption column (EZ-10) was returned to the collection tube. This process was repeated until the entire mixture passed through the adsorption column. Afterward, 500 μL of 75% ethanol solution was added to the column, and the supernatant was introduced into the column. The column was centrifuged at 12,000 r/min for 30 s, the liquid waste was discarded, and this operation was repeated once. The adsorbent column (EZ-10) was repositioned into the empty collection tube, centrifuged at 12 000 r/min for 2 min, and then placed on the ultra-clean bench to air-dry for 2–5 min. The dried adsorbent column was inserted into a new 1.5 mL centrifugal tube, and 60 μL of TE buffer, preheated in a metal bath, was added. The TE buffer was added to the middle part of the adsorbent membrane, left at room temperature for 2–5 min, and then centrifuged at 12,000 r/min for 1 min. To eliminate the effect of RNA, 1 μL of RNase enzyme (6 mg/mL) was added to the DNA of the sapwood samples for RNA digestion, and the mixture was incubated at 37.3 °C for 15 min. Subsequently, the concentration and purity of the total DNA in the samples were determined using a micro ultraviolet spectrophotometer. Finally, the samples were stored in the refrigerator at −20 °C for future use.

2.2.2. CTAB Plant Genome DNA Kit

CTAB plant genomic DNA rapid extraction kit method (DL114-01) involved introducing 700 μL of lysis solution PL, incorporating 2% volume of dithiothreitol, subjecting the sample to a 65 °C water bath for 5 h, and using 60 μL of elution buffer TE. However, all other operational steps remained consistent with the standard kit procedure.

2.2.3. DNeasy Plant Mini Kit

Qiagen DNeasy Plant Mini Kit (Z002454-0001) was used for DNA extraction. First, 600 μL of buffer AP1 was added to a 2% volume of dithiothreitol, and the mixture was incubated in a 65 °C water bath for 5 h. Then, 60 μL volume of elution buffer TE was added. The subsequent steps followed the standard kit procedure.

2.3. Statistical Analysis

The total DNA yield obtained from the wood was calculated based on the measured DNA concentration and the weight of the wood powder using Excel 2019 software (Microsoft Corp., Redmond, WA, USA). Statistical analysis was performed to evaluate significant differences in DNA yield and purity from the effects of different ammonium acetate concentrations and washing times using analysis of variance with SPSS 25.0 software (IBM Corp., Armonk, NY, USA).

2.4. PCR Amplification and Sequencing

PCR amplification was performed using a pair of universal primers of ITS2, according to the method reported in previous studies [24,37,38]. The forward primer ITS2-F sequence was 5′-ATGCGATACTTGGTGTGTGAAT-3′, and the reverse primer ITS2-R sequence was 5′-GACGCTTCTCCAGACTACAAT-3′. The expected fragment length of the amplified product was 485 bp. The PCR reaction comprised a 50 μL reaction system, including 45 μL of 1.1 × T3 Super PCR Mix, 2 μL each of forward and reverse primers, and 1 μL of template DNA. The reaction program involved pre-denaturation at 94 °C for 4 min, followed by 35 cycles of denaturation at 94 °C for 30 s, optimal annealing at 55 °C for 30 s, extension at 72 °C for 1 min, and a final extension at 72 °C for 10 min. The PCR-amplified products were visualized using 1.5% agarose gel electrophoresis at 300 V for 20 min. Finally, results were observed and captured using the TGel blue gel imaging system (OSE-470P), and PCR products with bright bands were sent to Shanghai ShengGong Biological Engineering Co., Ltd. for further analysis.

2.5. ITS2 Secondary Structure Prediction and Phylogenetic Analysis

The obtained sequences were manually corrected and assembled using SeqMan in DNASTAR Lasergene.v7.1 software (DNAStar Corp., Madison, WI, USA). Subsequently, the assembled sequences underwent annotations using the hidden Markov model for sequence splicing [39], with the removal of 5.8S and 28S regions at both ends of the sequences. The secondary structure of ITS2 was predicted using the ITS2 database established by Koetschan et al. and their corresponding website [40].
The composition and structural characteristics of the ITS2 sequences were analyzed using MEGA 11.0 software. Subsequently, Kimura 2-parameter (K2P) distance values were calculated to compare the inter- and intraspecific variability of the ITS2 sequences. The neighbor-joining (NJ) method was used to construct the phylogenetic tree, and 1000 bootstrap replications were conducted to estimate the bootstrap support for each branch.

3. Results

3.1. Effect of Ammonium Acetate Gradient Concentrations on the Purity and Yield of Total Wood DNA

Regarding the yield and purity of the total DNA extracted from the three wood types after washing with different gradient concentrations of ammonium acetate, selecting 0.25 M ammonium acetate for rinsing proved to be an optimal choice. This concentration ensured a maximum yield of DNA without a significant decrease. The purity and yield of total DNA extracted from the three wood species using the modified CTAB method were compared after rinsing with different gradient concentrations of ammonium acetate. The obtained results were compared with those from the Qiagen DNeasy plant mini kit and the CTAB kit methods, both of which served as the control methods (Table 2). Both the sapwood of D. benthamii and the wood from the transition zone of D. sissoo exhibited significant differences between 0.25 and 0.5 M. The heartwood of D. odorifera displayed a significant difference between 0.25 and 0.5 M, and the DNA yield of these samples significantly differed between 0.25 and 1 M. At 0.5 M ammonium acetate concentration, the DNA yield of the three wood species began to decrease. With increasing rinse concentration, the total DNA yield of the sapwood of D. benthamii significantly decreased. To achieve a stable result, the number of sample replicates was increased to six.
The average OD260/280 values of DNA extracted using the Qiagen DNeasy plant mini kit method were below 1.7, while those obtained using the CTAB kit method ranged from 1.7 to 1.9, consistent with the specified purity standard of the kit. The mean OD260/280 values for wood DNA in this study ranged from 1.7 to 2.1. Notably, only the sapwood of D. benthamii, when washed with ammonium acetate concentration of 0.25 M, featured a mean OD260/280 value higher than 2.0, while the remaining samples featured mean values between 1.7 and 1.9.

3.2. Effect of Rinse Frequency on the Purity and Yield of DNA from Wood

The results of the impact of different ammonium acetate gradient concentrations on the purity and yield of total wood DNA revealed that rinsing and extracting the wood powder with a 0.25 M concentration of ammonium acetate produced DNA with excellent purity and a high yield. Therefore, under the condition of a 0.25 M concentration of ammonium acetate, the effect of different rinse numbers on the purity and yield of total DNA in wood was investigated (Table 3). The OD260/280 values of the three wood types without acetate rinsing solution were higher than 1.65, failing to meet the extraction purity requirements specified by the kit method, which ranged from 1.7 to 1.9. The sapwood of D. benthamii featured a purity value higher than 2.0, indicating the presence of RNA residues. The total DNA yield of the three wood species was influenced by purity. The DNA yield obtained using the modified CTAB method without rinsing treatment was significantly higher than that obtained by rinsing one to four times with 0.25 M ammonium acetate, and this difference was statistically significant. No significant difference existed between the sapwood of D. benthamii and the transition of D. sissoo after rinsing one to four times. However, the heartwood of D. odorifera featured a significant difference after three rinses. Therefore, to achieve an optimal DNA yield, the wood sample should be rinsed fewer than three times. The mean value indicated that a higher number of rinses corresponded to a lower DNA yield.

3.3. Effects of Extraction Methods on PCR Amplification

PCR amplification of ITS2 barcodes was performed using total DNA from three wood species treated with Qiagen DNeasy plant mini kit, CTAB kit, and CTAB without rinsing solution, and 0.25 M ammonium acetate rinsing solution one to four times. The resulting DNA was used as a template. The results are shown in Figure 1. The DNA from the three wood species, subjected to PCR amplification using the Qiagen DNeasy plant mini kit method, CTAB kit method, and 0.25 M ammonium acetate rinsing solution one to four times, was successfully amplified. However, the heartwood of D. sissoo, extracted using the CTAB method without the rinsing solution treatment, was successfully amplified, while the other two species failed to amplify.

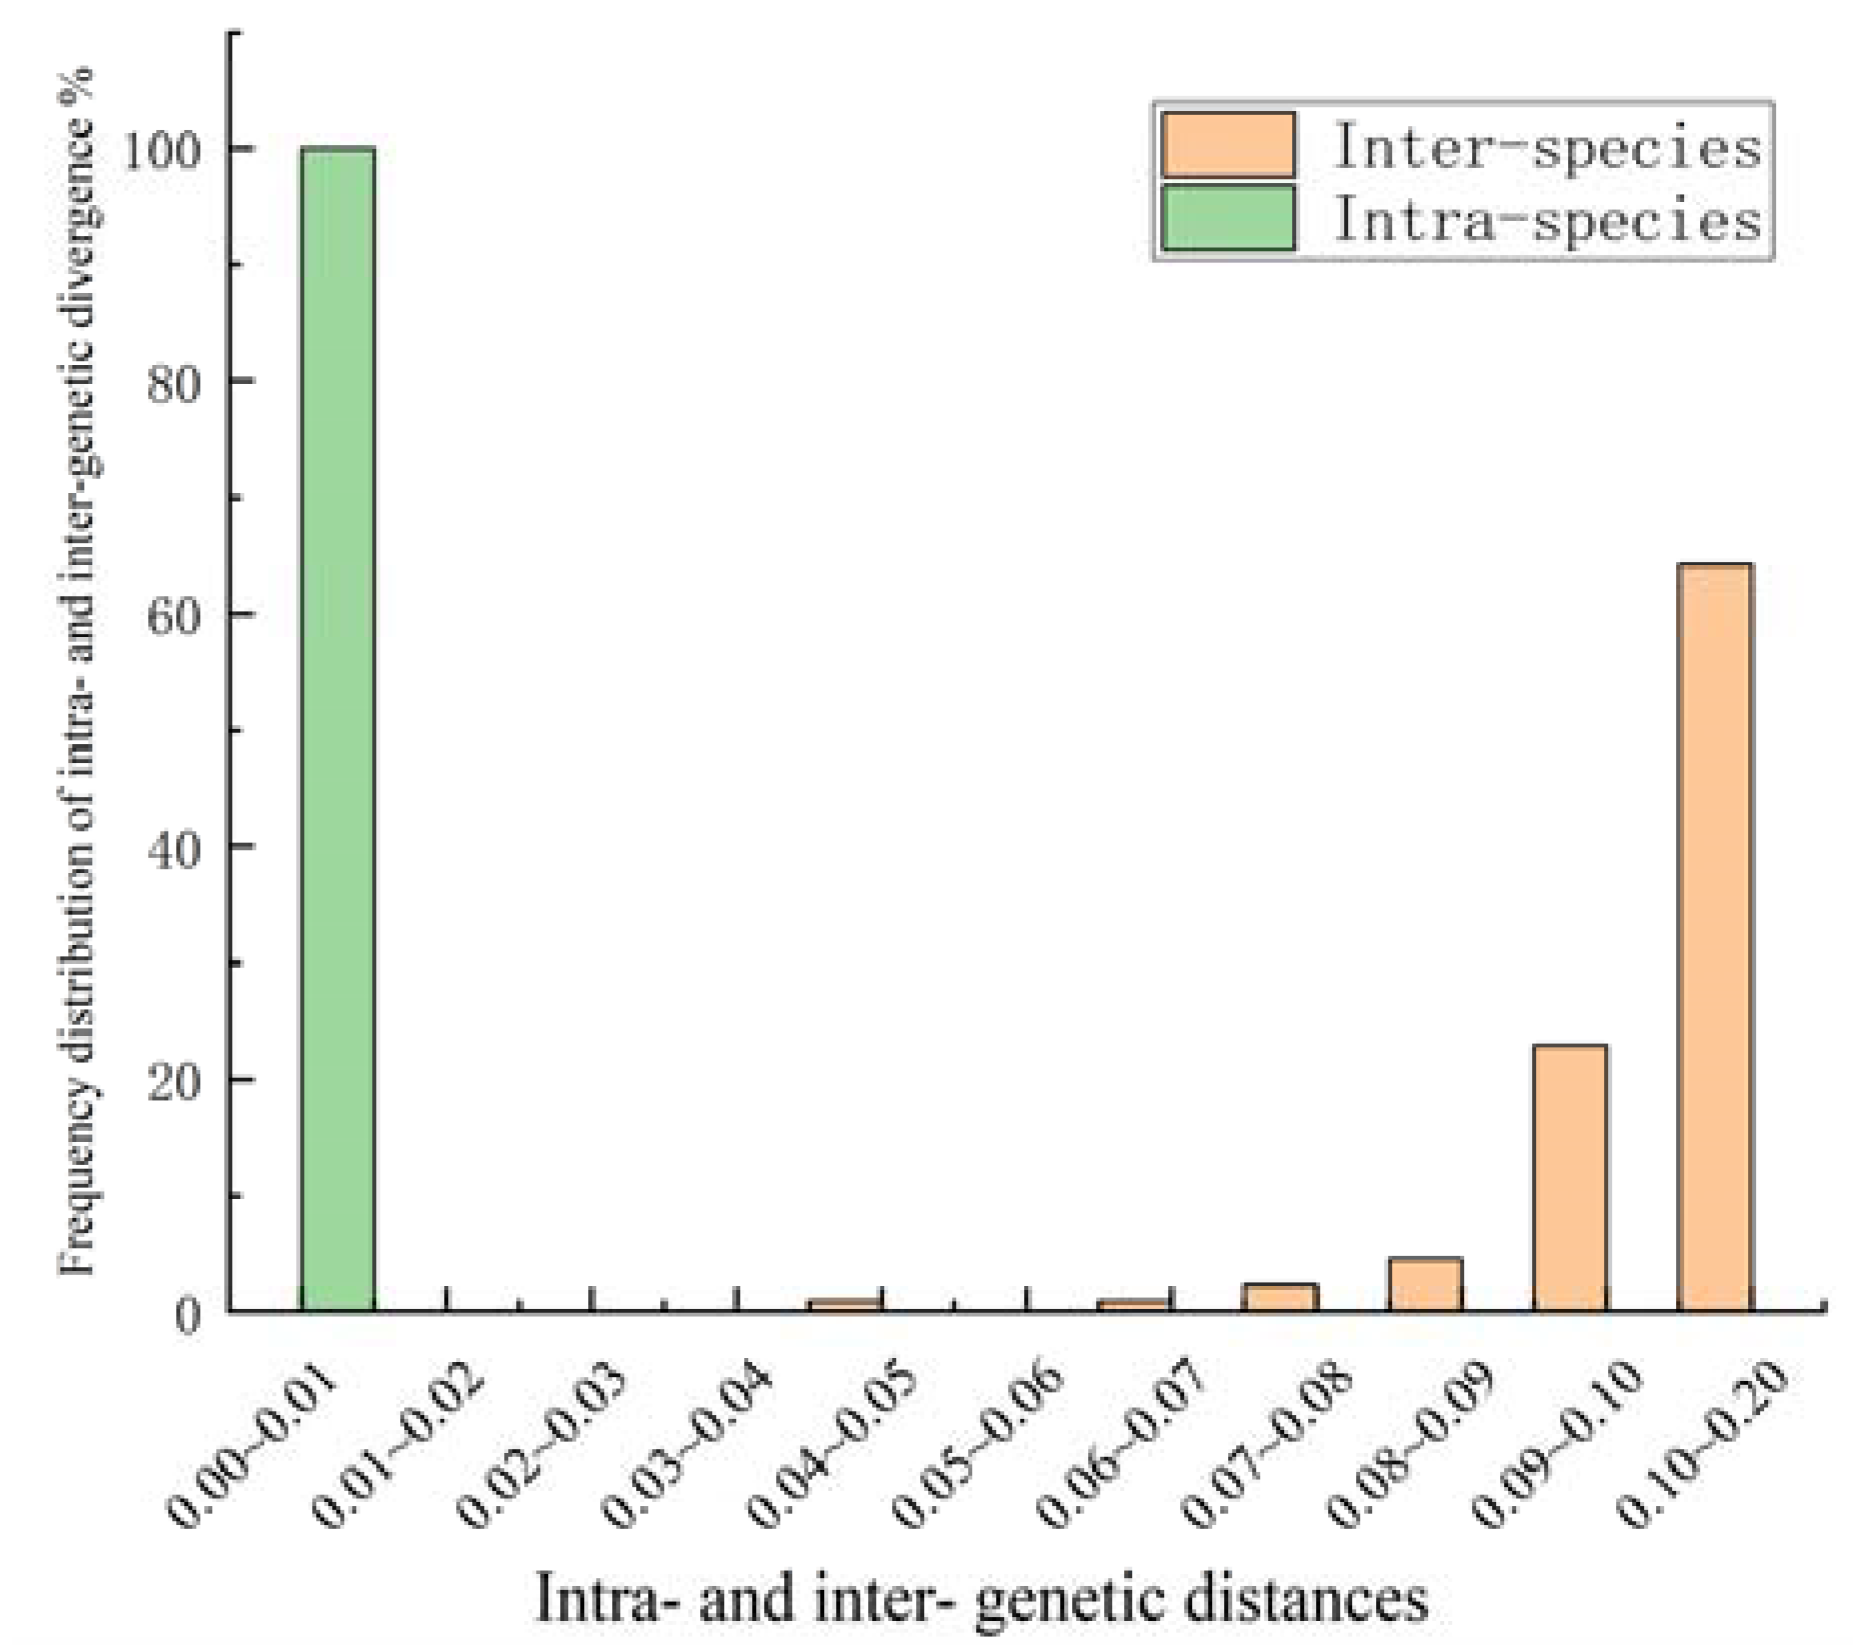
3.4. Sequence Length and Intra- and Inter-Species K2P Genetic Distance Analysis

All sapwood samples were successfully amplified and sequenced. However, only 80% of the heartwood could be amplified and sequenced. Particularly, the heartwood from wood stored for less than 2 years was successfully amplified and sequenced, while only 40% of the heartwood from wood stored for more than 5 years could be amplified and sequenced (Table 4).
The sequences of all the samples were compared using MEGA11.0. In this study, 24 complete ITS2 sequences from 10 samples of Dalbergia spp. were successfully sequenced. The analysis revealed that the ITS2 sequences featured a length of 199–218 bp. The full sequencing comparison involved 219 sites, with guanine–cytosine (GC) contents ranging from 64.3% to 72.3%. The average GC content was 68.6%, and a total of 73 variable sites were identified (Figure S1). Genetic variation analysis among the 25 samples (Figure 2) revealed a significant barcoding gap, indicating that the ITS2 sequence exhibited a strong ability to identify the wood samples at the species level [41]. Intra-species genetic distances were all below 0.01, while the inter-species genetic distances were mainly concentrated in the ranges of 0.09–0.10 and 0.10–0.2.

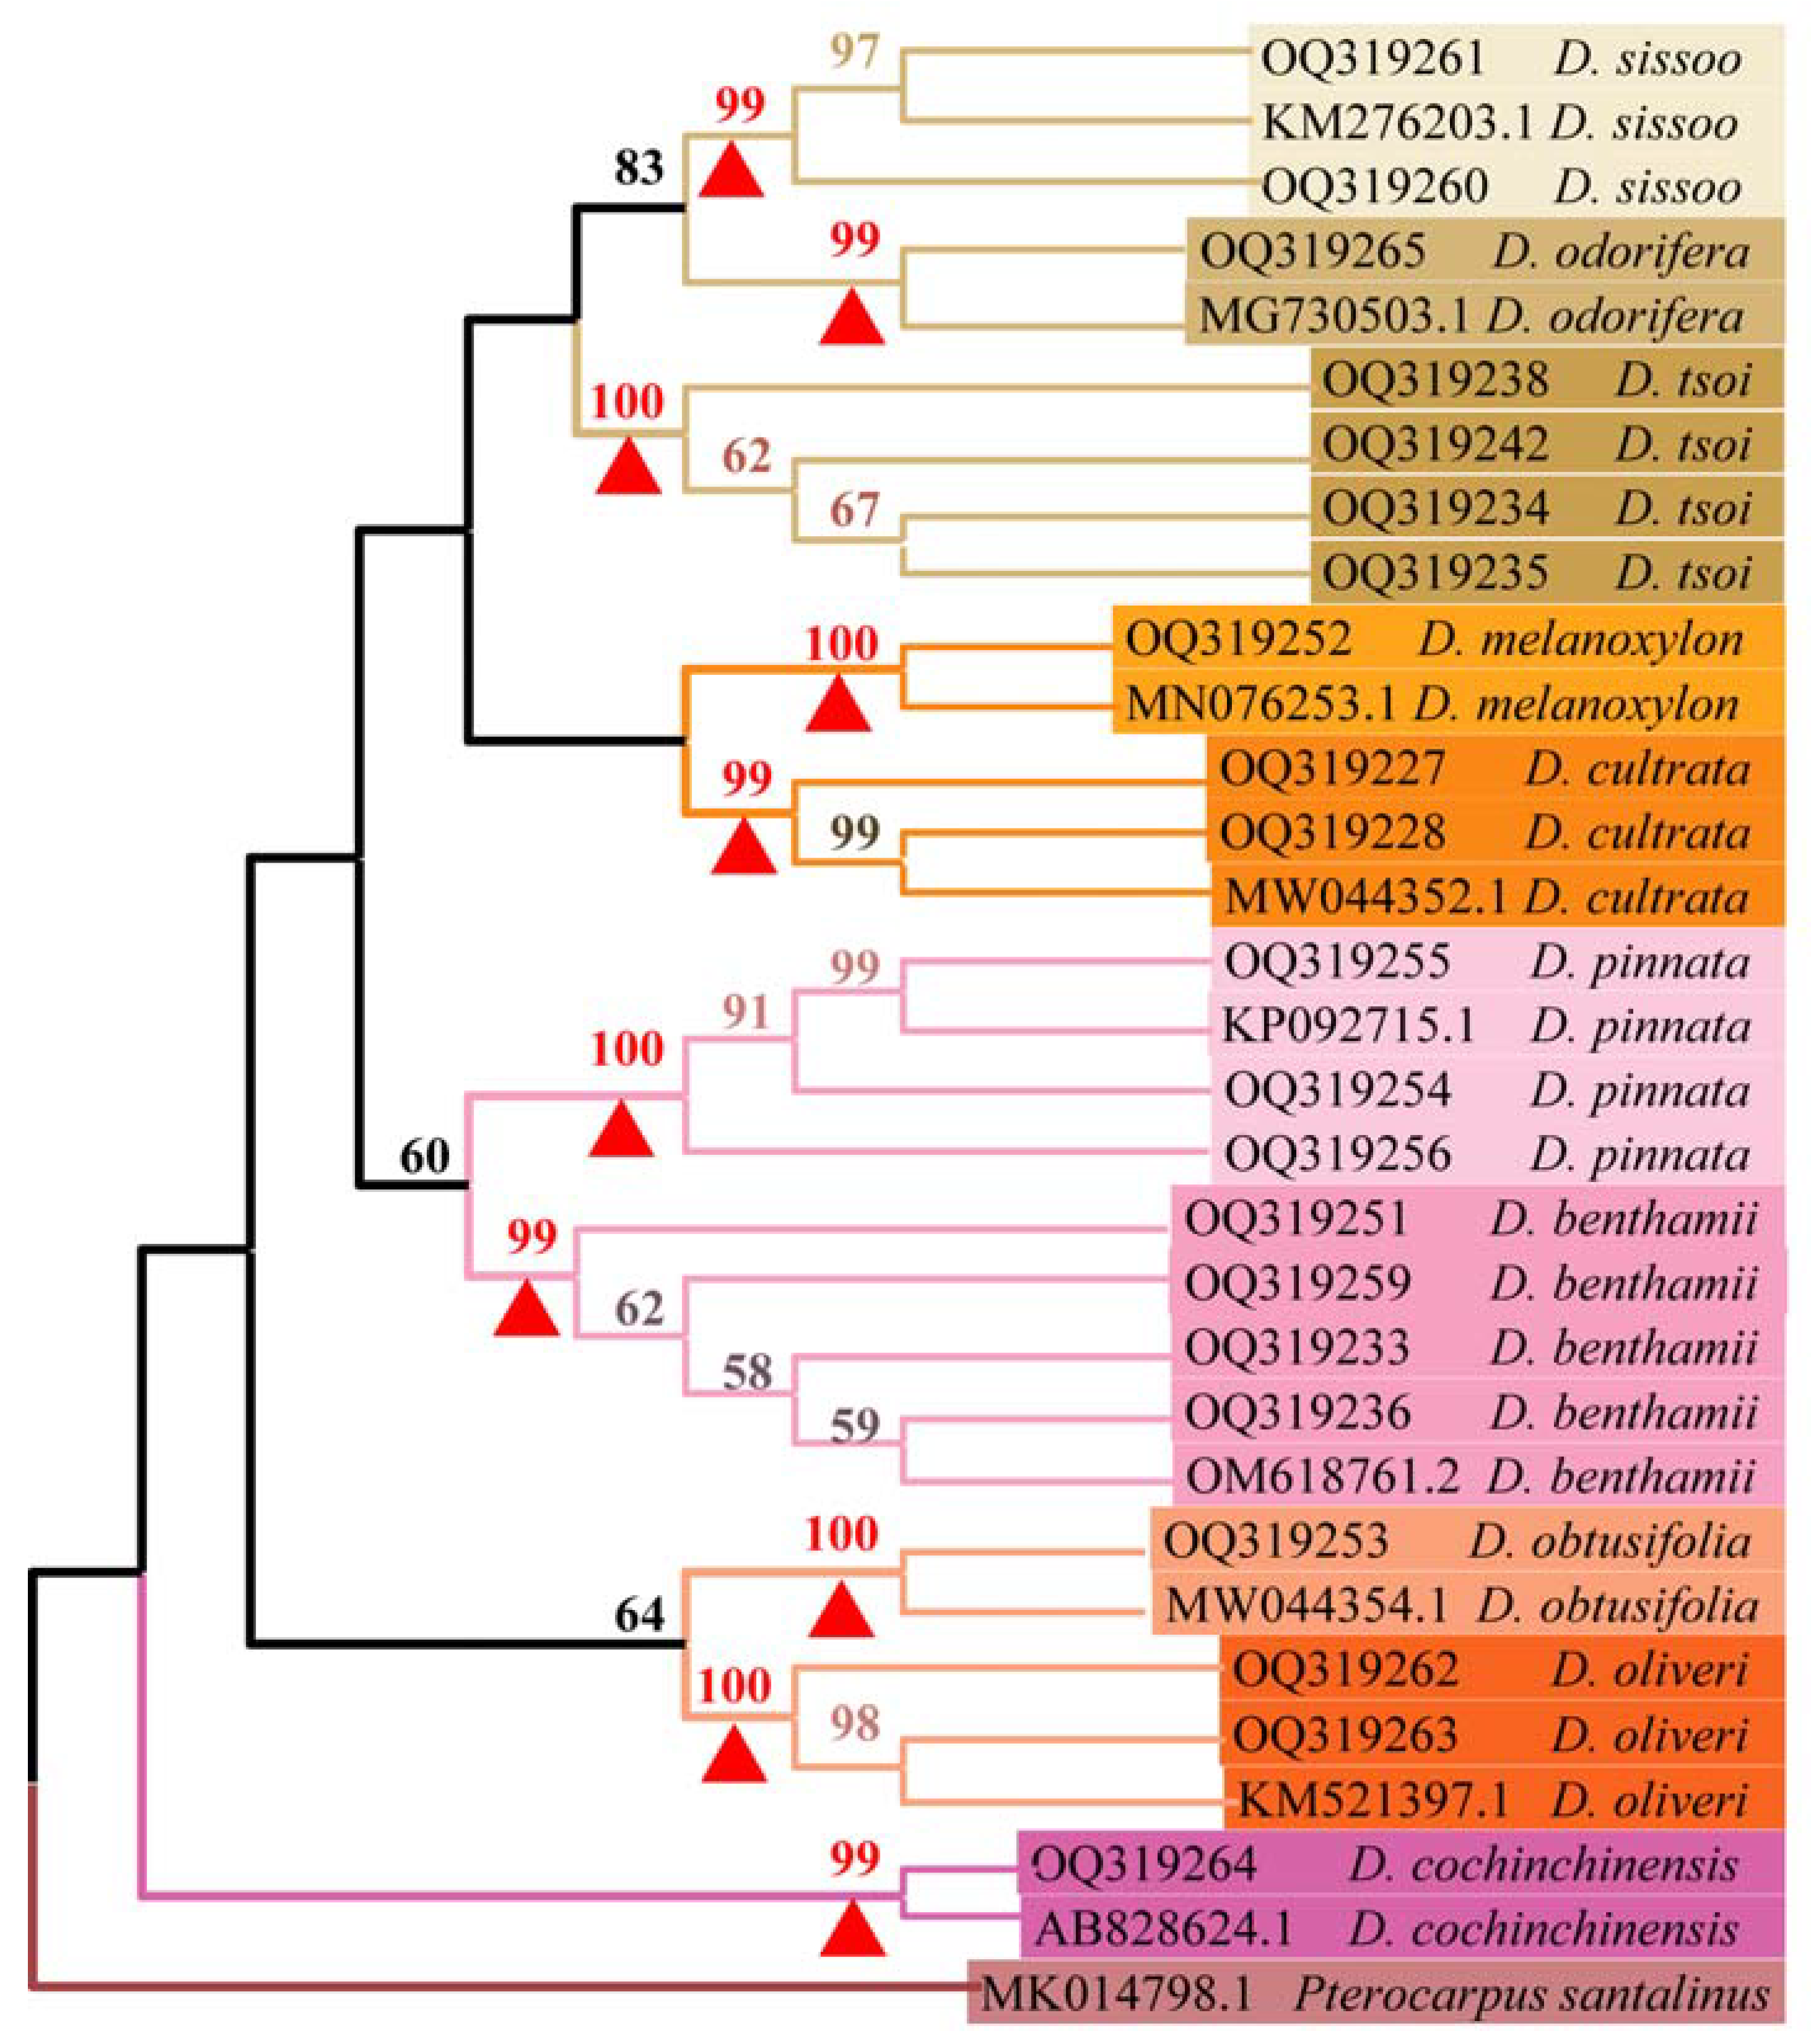
3.5. Phylogenetic Tree Analysis

A phylogenetic tree was constructed using MEGA 11.0 for all ITS2 sequences. The support for each branch was examined 1000 times using the bootstrap test. Only branches with a bootstrap value of 50% or higher were displayed on the phylogenetic tree (Figure 3). The NJ phylogenetic tree featured a distinct branch for the outgroup species Pterocarpus santalinus. Each sample from the Dalbergia genus, along with sequences downloaded from the GenBank database, clustered into nine small branches. Each species within these branches featured a bootstrap value greater than 99%, and the bootstrap values of the interspecific branches of the 10 species exceeded 50%. This indicates that the interspecific species were grouped into small clades that exhibited good monophyly. The phylogenetic tree confirmed that ITS2 sequences can distinguish D. tsoi from other Dalbergia spp.

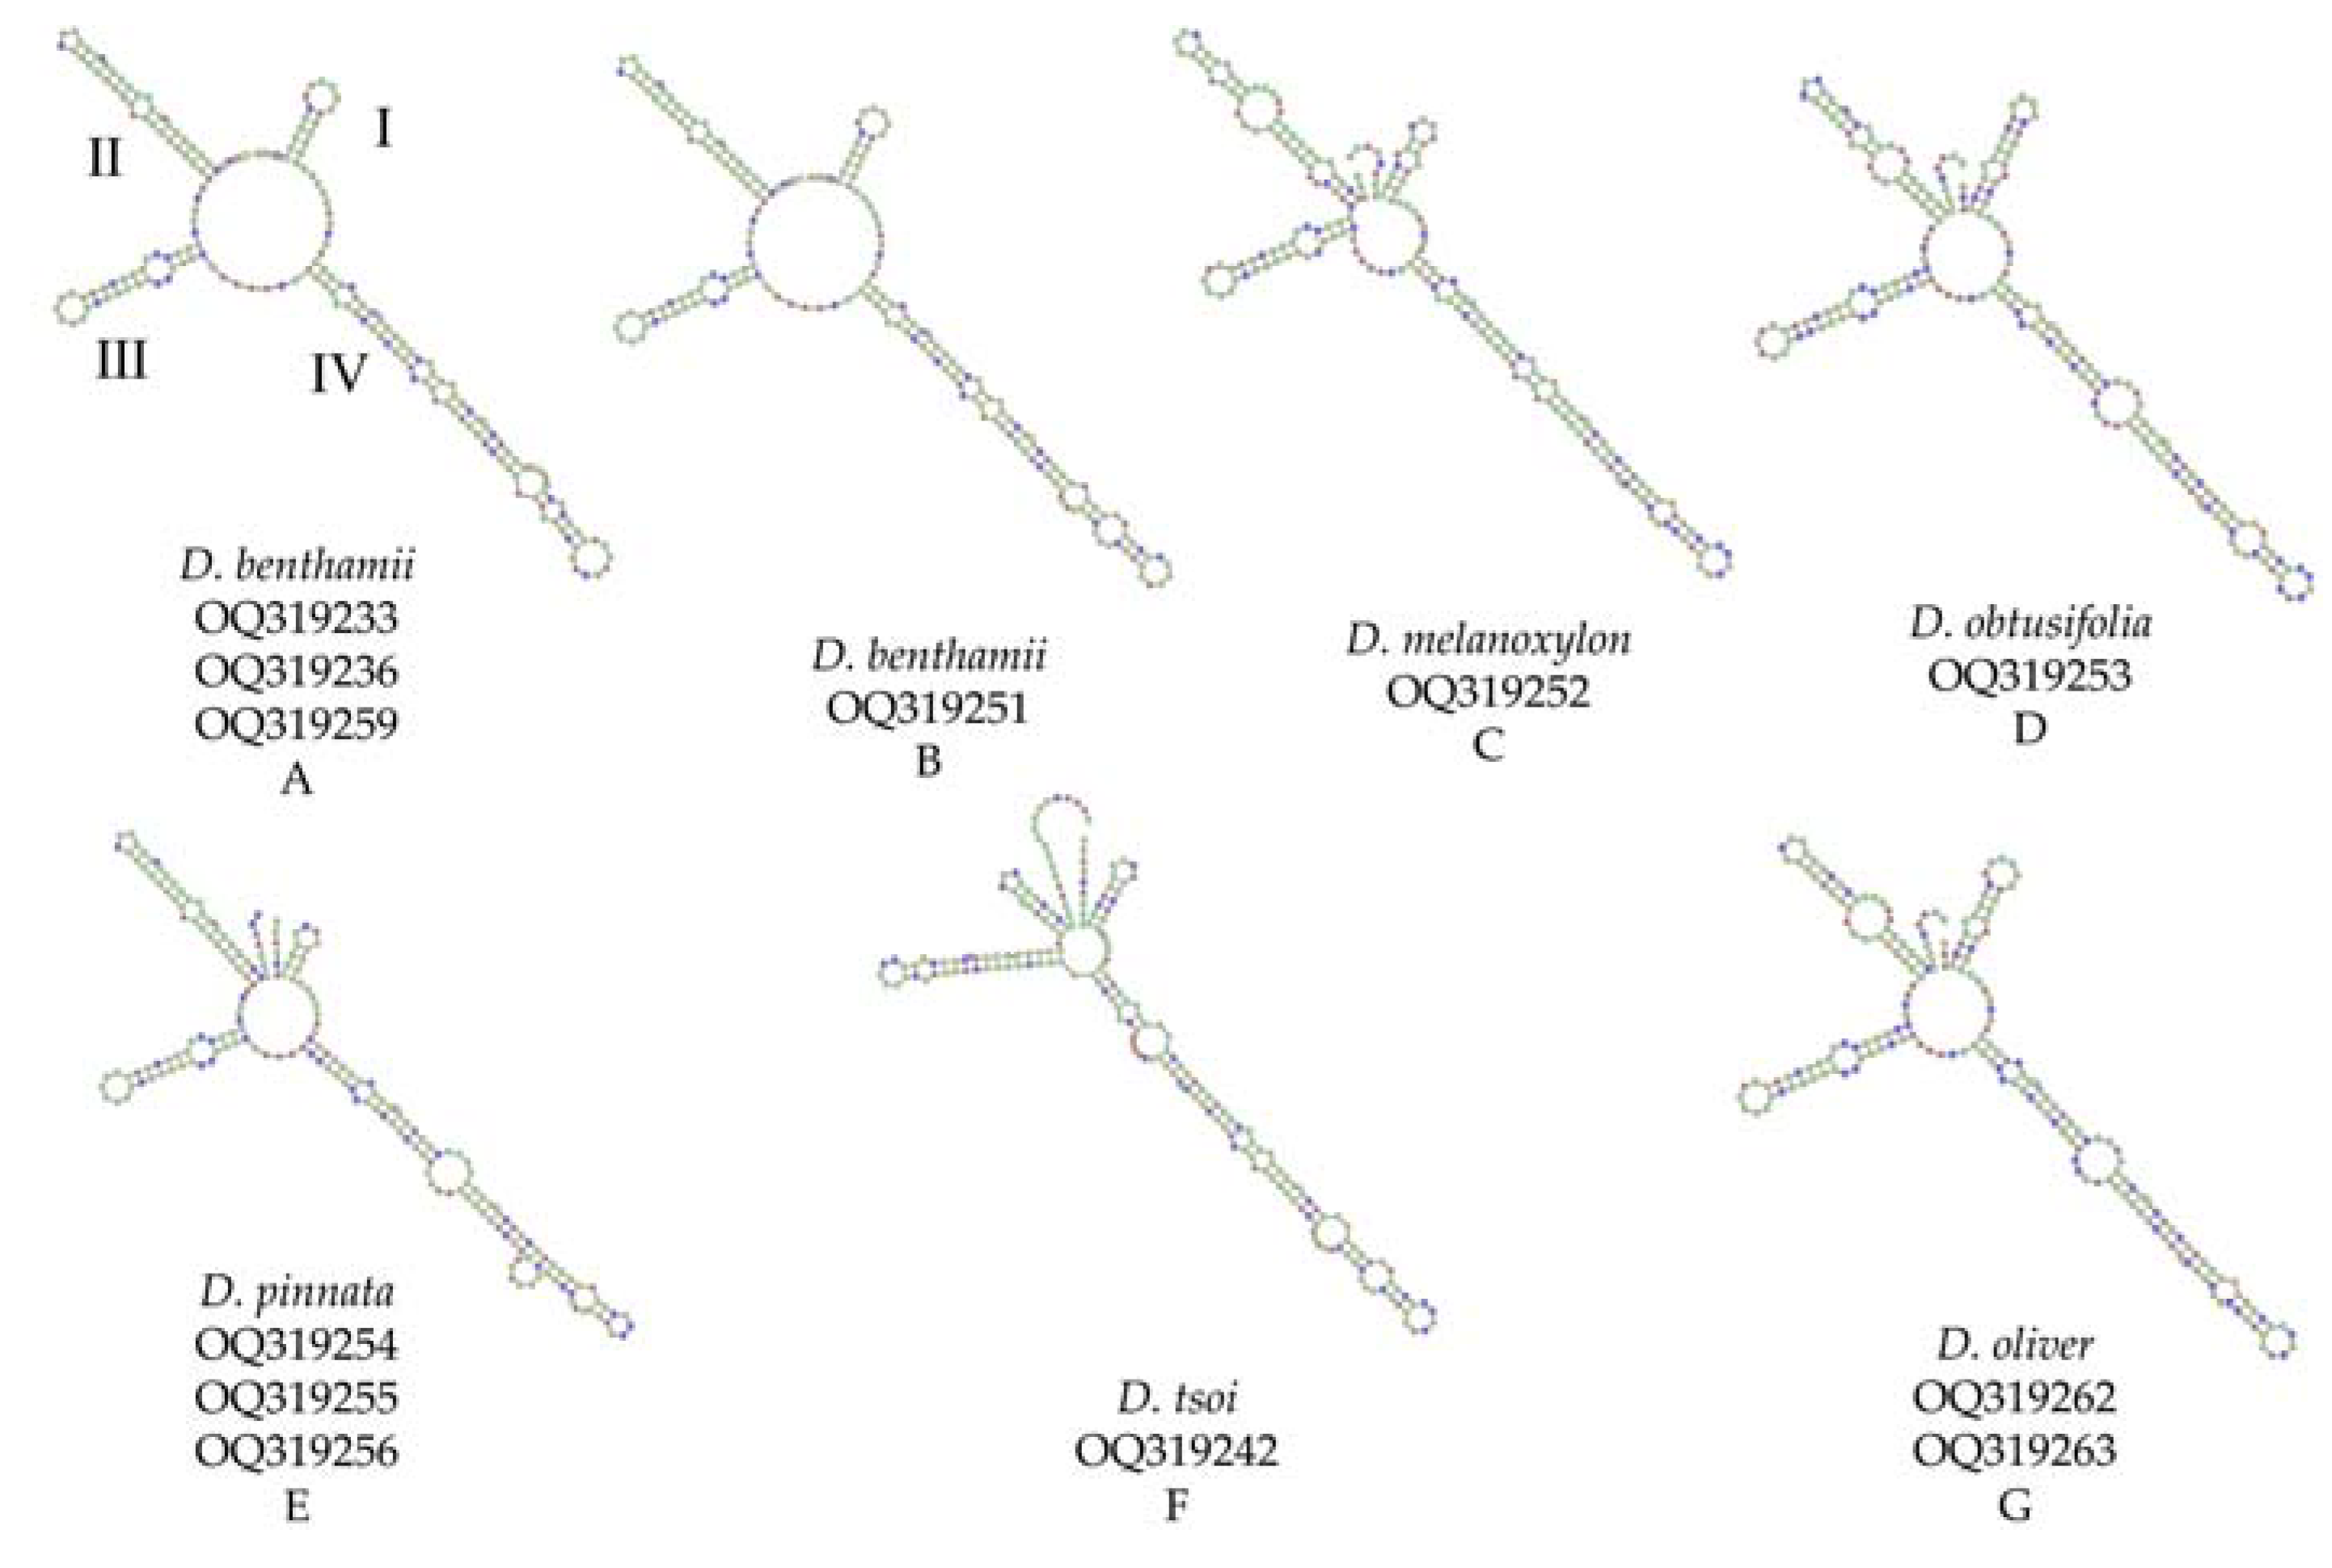
3.6. Secondary Structure Analysis

Among the ten species, secondary structures could be predicted for only six species, while those of D. odorifera, D. sissoo, D. cochinchinensis, and D. cultrata could not be successfully predicted (Figure 4). All the samples exhibited secondary structures comprising a center ring and four similar helices (helix I, II, III, and IV). Significant variations were observed in the number, size, and configuration of loops within each helix structure. Additionally, the loops significantly differed in quantity, size, position, and angle of the spiral. All species featured variations in helices I, II, and IV, with differences in whether helices were formed between helices I and II. Moreover, the species exhibited variations in the shapes, locations, sizes, and orientations of the helices. The secondary structure of D. benthamii A and B was very similar, except for the difference in the ring size of helix IV. D. melanoxylon and D. obtusifolia differed in the number of rings in helix II. D. pinnata exhibited distinct differences in the placement of one of the rings within region III. A significant difference was observed between D. tsoi, and the remaining five species in helix III. D. oliveri and D. obtusifolia have displayed a significant degree of structural similarity, except for a notable difference in the size of one of the rings located in helix II. While some species share similar secondary structures, each sample possesses unique characteristics that enable their intuitive and accurate discrimination.

4. Discussion

In some plant species, tissues can contain complex molecules, which become inhibitory compounds in fragment amplification reactions (PCR). This study optimized an extraction protocol, which can extract DNA from wood efficiently. The protocol demonstrates excellent performance and poses no issues in acquiring barcode sequences.

4.1. Optimization of DNA Extraction Methods for Wood

Ammonium acetate solution played a role in the extraction and purification of DNA [42,43]. In this experiment, the wood powder was rinsed with ammonium acetate solution before being lysed. This step effectively addressed the issue of the wood powder containing numerous inhibitor residues that could not be removed through the subsequent purification. Despite the prolonged duration of wood lysis, the rinsing treatment did not significantly reduce DNA yields. The comparison of the yield and purity of three wood species after rinsing with different gradient concentrations of ammonium acetate revealed that the total DNA purity of the wood extracted from D. benthamii, after rinsing with 0.25 M ammonium acetate, exhibited high values. This could be due to the storing of the wood for only one year, resulting in the extracted DNA containing RNA residues. Electrophoresis results (Figure 1) revealed that the PCR amplification of the total DNA extracted from D. benthamii wood was not affected, and the OD260/280 values for the DNA purity of the remaining wood ranged from 1.7 to 1.9, which met the purity requirements of the kit method. The decrease in the DNA yield with increasing ammonium acetate concentration could be attributed to the lower pH of the rinsing solution. The pH range favorable for DNA extraction ranged from 6.0 to 9.0, while the pH range of ammonium acetate buffer was 4.75–9.25 [44]. The increase in ammonium acetate led to a decrease in the pH of the rinsing solution, eventually resulting in lower DNA yields [45,46,47].
The experiments on the purity and yield of total DNA obtained at different rinse times revealed that DNA from wood pretreated with at least one rinse time could be successfully amplified. The OD260/280 values for the wood DNA without rinsing treatment were not higher than 1.65, indicating the insufficient purity of total DNA obtained from the unrinsed wood. Gel electrophoresis results (Figure 1) indicated that among the three samples without rinsing treatment, only the DNA of D. odorifera was successfully amplified. This further confirmed that the presence of residual inhibitors of DNA without rinsing treatment hindered PCR amplification. A higher number of rinse times corresponded to a lower DNA yield. After three rinses with ammonium acetate, D. odorifera featured a significantly lower DNA yield. Although the DNA yield of the other two species decreased with an increasing number of rinse times, the decrease in the yield was not statistically significant. This may be attributed to the presence of the majority of the DNA molecules in the wood cells or their existence in a free state within the wood powder. The simple pretreatment of rinsing the wood samples with ammonium acetate did not result in DNA loss. All the DNA obtained after rinsing pretreatment could be successfully amplified. indicating that the purity of the extracted DNA significantly influenced PCR amplification more than its concentration.

4.2. Effect of Storage Time on the Quality of DNA Extracted from Wood

Storage time significantly influenced DNA amplification in wood. Both heartwood and sapwood stored for less than 2 years were successfully amplified, while sapwood stored for more than 5 years was successfully amplified. However, only 40% of the heartwood stored for more than 5 years was successfully amplified. In the heartwood, only a minimal amount of wood DNA was present in the thin-walled cells. As the storage time increased, the remaining DNA in the wood cells underwent further degradation and fragmentation owing to enzymatic, hydrolytic, and oxidative reactions. The difficulty in extracting residual DNA from the heartwood affected PCR amplification [13].

4.3. Effect of ITS2 Barcode Identification

In recent years, owing to the continuous development of gene technology and DNA barcode technology, the benefits of DNA barcode identification for distinguishing between tree species have become increasingly significant [7,48,49]. The maturity of second-generation sequencing technology lays a foundation for designing high-resolution barcodes, further enhancing the accuracy of DNA barcode identification [50]. The Dalbergia species comprised a diverse range, and the value of each species significantly varied. Therefore, accurate and rapid recognition of species is crucial for implementing effective conservation measures. The small chloroplast genome served as an effective super barcode, but obtaining the complete chloroplast genome from wood, particularly from the heartwood, was even more challenging owing to severe DNA degradation. Hence, developing a short fragment barcode with a high differentiation rate is vital. The ITS2 barcode adopted in this study exhibited numerous variable sites with high resolution and successfully identified 10 species. The bootstrap support rate for the branching of each species exceeded 99%, indicating the excellent identification capability of ITS2.
The ITS2 secondary structure introduces an additional dimension for species identification at the level of molecular morphological characteristics. Although some samples have similar secondary structures, they still have their own characteristics and can be distinguished intuitively and accurately. It carries some degree of reference value for species identification.

5. Conclusions

This study optimized an efficient extraction protocol for genus Dalbergia plants. The results revealed that selecting 0.25 M ammonium acetate for pretreatment yielded high-quality DNA without a significant reduction in the DNA yield. To obtain the optimal DNA yield, the number of rinses should be limited to below three times, as a higher number of washings corresponded to a lower DNA yield. Additionally, both the NJ phylogenetic tree constructed based on ITS2 and the ITS2 secondary structure predicted from the website accurately distinguished between species, including D. tsoi. This method facilitated the extraction of high-quality DNA from Dalbergia species without the need for a purification kit or secondary purification treatment, thereby improving the efficiency of the extraction process and enabling direct molecular follow-up experiments with the extracted DNA. Therefore, this approach supports the rapid and efficient identification of Dalbergia species and provides strong technical support for regulating and protecting these plants.

Supplementary Materials

The following supporting information can be downloaded at: https://www.mdpi.com/article/10.3390/f14122318/s1, Figure S1: The variable sites in ITS2 sequences of samples.

Author Contributions

Conceptualization, C.G. and J.Q.; methodology, C.G.; software, C.G.; validation, H.H.; investigation, C.G.; resources, H.H.; data curation, H.H.; writing—original draft preparation, C.G.; writing—review and editing, C.G. and H.H.; funding acquisition, J.Q.; supervision, J.Q.; project administration, J.Q. All authors have read and agreed to the published version of the manuscript.

Funding

This research was funded by the Provincial Key Basic Research Project of China (202001AS070044).

Data Availability Statement

Data will be made available on request.

Acknowledgments

The authors gratefully thank the technicians and scientific associates from the College of Materials and Chemical Engineering of Southwest Forestry University. Thanks to Li Kaihong, President of the Hainan Jiangzhenxiang Association, for providing some samples.

Conflicts of Interest

The authors declare no conflict of interest.

References

  1. Hassold, S.; Lowry, P.P.; Bauert, M.R.; Razafintsalama, A.; Ramamonjisoa, L.; Widmer, A. DNA barcoding of Malagasy rosewoods: Towards a molecular identification of CITES-listed Dalbergia species. PLoS ONE 2016, 11, e0157881. [Google Scholar] [CrossRef] [PubMed]
  2. Wu, H.Y.; Wong, K.H.; Kong, B.L.H.; Siu, T.Y.; But, G.W.C.; Tsang, S.S.K.; Lau, D.T.W.; Shaw, P.C. Comparative analysis of chloroplast genomes of Dalbergia species for identification and phylogenetic analysis. Plants 2022, 11, 1109. [Google Scholar] [CrossRef] [PubMed]
  3. Hong, Z.; He, W.; Liu, X.; Tembrock, L.R.; Wu, Z.; Xu, D. Comparative Analyses of 35 Complete Chloroplast Genomes from the Genus Dalbergia (Fabaceae) and the Identification of DNA Barcodes for Tracking Illegal Logging and Counterfeit Rosewood. Forests 2022, 13, 626. [Google Scholar] [CrossRef]
  4. Vasudeva, N.; Vats, M.; Sharma, S.; Sardana, S. Chemistry and biological activities of the genus Dalbergia—A review. Pharmacogn. Rev. 2009, 3, 307–319. [Google Scholar]
  5. Garzon Arbelaez, M. Rosewood Trade: A Case Study of the Imports into the United States. Master’s Thesis, University of Washington, Seattle, WA, USA, 2022. [Google Scholar]
  6. Crameri, S.; Wilding, N.; Phillipson, P.B.; Rakotonirina, N.; Randrianaivo, R.I.; Ravaomanalina, H. An integrative phylogenomic approach to species delimitation in Dalbergia precious woods. In Proceedings of the AETFAT Conference, Livingstone, Zambia, 27 June–1 July 2022. [Google Scholar]
  7. Deguilloux, M.F.; Pemonge, M.H.; Petit, R.J. Novel perspectives in wood certification and forensics: Dry wood as a source of DNA. Proc. Biol. Sci. 2002, 269, 1039–1046. [Google Scholar] [CrossRef]
  8. Lowe, A.J.; Cross, H.B. The application of DNA methods to timber tracking and origin verification. IAWA J. 2011, 32, 251–262. [Google Scholar] [CrossRef]
  9. Jiao, L.; Yin, Y.; Xiao, F.; Sun, Q.; Song, K. Comparative analysis of two DNA extraction protocols from fresh and dried wood of Cunninghamia lanceolata (Taxodiaceae). IAWA J. 2012, 33, 441–456. [Google Scholar] [CrossRef]
  10. Dormontt, E.E.; Boner, M.; Braun, B.; Breulmann, G.; Degen, B.; Espinoza, E. Forensic timber identification: It’s time to integrate disciplines to combat illegal logging. Biol. Conserv. 2015, 191, 790–798. [Google Scholar] [CrossRef]
  11. Nithaniyal, S.; Newmaster, S.G.; Ragupathy, S.; Krishnamoorthy, D.; Vassou, S.L.; Parani, M. DNA barcode authentication of wood samples of threatened and commercial timber trees within the tropical dry evergreen forest of India. PLoS ONE 2014, 9, e107669. [Google Scholar] [CrossRef]
  12. Jiao, L.; Yu, M.; Wiedenhoeft, A.C.; He, T.; Li, J.; Liu, B. DNA Barcode Authentication and library development for the wood of six commercial pterocarpus species: The critical role of Xylarium specimens. Sci. Rep. 2018, 8, 1945. [Google Scholar] [CrossRef] [PubMed]
  13. Jiao, L.; Lu, Y.; He, T.; Guo, J.; Yin, Y. DNA barcoding for wood identification: Global review of the last decade and future perspective. IAWA J. 2020, 41, 620–643. [Google Scholar] [CrossRef]
  14. Murillo-Sánchez, I.E.; López-Albarrán, P.; Santoyo-Pizano, G.; Martínez-Pacheco, M.M.; Velázquez-Becerra, C. Molecular identification of timber species from sawn timber and roundwood. Conserv. Genet. Resour. 2021, 13, 191–200. [Google Scholar] [CrossRef]
  15. Hebert, P.D.N.; Cywinska, A.; Ball, S.L.; Dewaard, J.R. Biological identifications through DNA barcodes. Proc. R. Soc. Lond. Ser. B Biol. Sci. 2003, 270, 313–321. [Google Scholar] [CrossRef]
  16. Cowan, R.S.; Chase, M.W.; Kress, W.J.; Savolainen, V. 300,000 Species to Identify: Problems, Progress, and Prospects in DNA Barcoding of Land Plants. Taxon 2006, 55, 611–616. [Google Scholar] [CrossRef]
  17. Hollingsworth, P.M.; Forrest, L.L.; Spouge, J.L.; Hajibabaei, M.; Little, D.P. A DNA barcode for land plants. Proc. Natl. Acad. Sci. USA 2009, 106, 12794–12797. [Google Scholar]
  18. Chase, M.W.; Cowan, R.S.; Hollingsworth, P.M.; Berg, C.V.D.; Wilkinson, M.J. A proposal for a standardised protocol to barcode all land plants. Taxon 2007, 56, 295–299. [Google Scholar] [CrossRef]
  19. Kress, W.J.; Erickson, D.L.; Jones, F.A.; Swenson, N.G.; Perez, R.; Sanjur, O.; Bermingham, E. Plant DNA barcodes and a community phylogeny of a tropical forest dynamics plot in Panama. Proc. Natl. Acad. Sci. USA 2009, 106, 18621–18626. [Google Scholar] [CrossRef]
  20. Li, Q.; Yan, H.; Lin, D.; Wang, Y.; He, M.; Zhang, W.; Gao, X.; Zhu, S. Molecular Identification of Three Aquilaria (Thymelaeaceae) Species through DNA Barcoding. Biol. Pharm. Bull. 2018, 41, 967. [Google Scholar] [CrossRef]
  21. Fazekas, A.J.; Burgess, K.S.; Kesanakurti, P.R.; Graham, S.W.; Newmaster, S.G.; Husband, B.C.; Percy, D.M.; Hajibabaei, M.; Barrett, S.C. Multiple multilocus DNA barcodes from the plastid genome discriminate plant species equally well. PLoS ONE 2008, 3, e2802. [Google Scholar] [CrossRef]
  22. Li, D.Z.; Gao, L.M.; Li, H.T.; Wang, H.; Ge, X.J.; Liu, J.Q. Comparative analysis of a large dataset indicates that internal transcribed spacer (ITS) should be incorporated into the core barcode for seed plants. Proc. Natl. Acad. Sci. USA 2011, 108, 19641–19646. [Google Scholar]
  23. Yu, J.; Wu, X.; Liu, C.; Newmaster, S.; Ragupathy, S.; Kress, W.J. Progress in the use of DNA barcodes in the identification and classification of medicinal plants. Ecotoxicol. Environ. Saf. 2021, 208, 111691. [Google Scholar] [CrossRef]
  24. Chen, S.; Yao, H.; Han, J.; Liu, C.; Song, J.; Shi, L.; Zhu, Y.; Ma, X.; Gao, T.; Pang, X.; et al. Validation of the ITS2 region as a novel DNA barcode for identifying medicinal plant species. PLoS ONE 2010, 5, e8613. [Google Scholar] [CrossRef]
  25. Kalivas, A.; Ganopoulos, I.; Xanthopoulou, A.; Chatzopoulou, P.; Tsaftaris, A.; Madesis, P. DNA barcode ITS2 coupled with high resolution melting (HRM) analysis for taxonomic identification of Sideritis species growing in Greece. Mol. Biol. Rep. 2014, 41, 5147–5155. [Google Scholar] [CrossRef]
  26. Hartvig, I.; Czako, M.; Kjær, E.D.; Nielsen, L.R.; Theilade, I. The use of DNA barcoding in identification and conservation of rosewood (Dalbergia spp.). PLoS ONE 2015, 10, e0138231. [Google Scholar] [CrossRef] [PubMed]
  27. Hu, J.L.; Ci, X.Q.; Liu, Z.F.; Dormontt, E.E.; Conran, J.G.; Lowe, A.J.; Li, J. Assessing candidate DNA barcodes for Chinese and internationally traded timber species. Mol. Ecol. Resour. 2022, 22, 1478–1492. [Google Scholar] [CrossRef]
  28. Semagn, K. Leaf Tissue Sampling and DNA Extraction Protocols. In Molecular Plant Taxonomy; Humana Press: Totowa, NJ, USA, 2014; Volume 1115, pp. 53–67. [Google Scholar]
  29. Kenzo, T.; Yoneda, R.; Tanaka-Oda, A.; Azani, M.A. Growth performance and leaf ecophysiological traits in three Aquilaria species in Malaysia. New For. 2018, 50, 699–715. [Google Scholar] [CrossRef]
  30. Rachmayanti, Y.; Leinemann, L.; Gailing, O.; Finkeldey, R. DNA from processed and unprocessed wood: Factors influencing the isolation success. Forensic Sci. Int. Genet. 2009, 3, 185–192. [Google Scholar] [CrossRef] [PubMed]
  31. Verbylaite, R.; Beiys, P.; Rimas, V.; Kuusiene, S.J.B.F. Comparison of Ten DNA Extraction Protocols from Wood of European Aspen (Populus tremula L.). Balt. For. 2010, 16, 35–42. [Google Scholar]
  32. Yu, M.; Liu, K.; Zhou, L.; Zhao, L.; Liu, S. Testing three proposed DNA barcodes for the wood identification of Dalbergia odorifera T. Chen and Dalbergia tonkinensis Prain. Holzforschung 2016, 70, 127–136. [Google Scholar] [CrossRef]
  33. Lu, Y.; Jiao, L.; He, T.; Zhang, Y.; Jiang, X.; Yin, Y. An optimized DNA extraction protocol for wood DNA barcoding of Pterocarpus erinaceus. IAWA J. 2020, 41, 644–659. [Google Scholar] [CrossRef]
  34. Miller, D.; Bryant, J.; Madsen, E.; Ghiorse, W. Evaluation and optimization of DNA extraction and purification procedures for soil and sediment samples. Appl. Environ. Microbiol. 1999, 65, 4715–4724. [Google Scholar] [CrossRef]
  35. Ihase, O.L.; Horn, R.; Anoliefo, G.O.; Eke, C.R.; Afolabi, A.S.; Asemota, O. Development of a method for DNA extraction from oil palm leaves and the effects of pH and ionic strength on nucleic acid quantification. J. Biol. Methods 2016, 3, e37. [Google Scholar] [CrossRef]
  36. Mehta, D.; Sivan, P.; Shah, D. Statistical in vitro model for upscaling biofilm of Chroococcidiopsis cubana by media optimization and its protocol for DNA extraction. Biosci. Biotechnol. Res. Commun. 2020, 13, 1962–1966. [Google Scholar] [CrossRef]
  37. Yu, N.; Wei, Y.L.; Zhang, X.; Zhu, N.; Wang, Y.L.; Zhu, Y.; Zhang, H.P.; Li, F.M.; Yang, L.; Sun, J.Q.; et al. Barcode ITS2: A useful tool for identifying Trachelospermum jasminoides and a good monitor for medicine market. Sci. Rep. 2017, 7, 5037. [Google Scholar] [CrossRef]
  38. Ya-Na, L.V.; Chun-Yong, Y.A.N.G.; Lin-Chun, S.H.I.; Zhang, Z.L.; An-Shun, X.U.; Zhang, L.X.; Xue-Lan, L.I.; Hai-Tao, L.I. Identification of medicinal plants within the Apocynaceae family using ITS2 and psbA-trnH barcodes. Chin. J. Nat. Med. 2020, 18, 594–605. [Google Scholar]
  39. Keller, A.; Schleicher, T.; Schultz, J.; Müller, T.; Dandekar, T.; Wolf, M. 5.8 S-28S rRNA interaction and HMM-based ITS2 annotation. Gene 2009, 430, 50–57. [Google Scholar] [CrossRef]
  40. Koetschan, C.; Förster, F.; Keller, A.; Schleicher, T.; Ruderisch, B.; Schwarz, R.; Müller, T.; Wolf, M.; Schultz, J. The ITS2 Database III—Sequences and structures for phylogeny. Nucleic Acids Res. 2010, 38 (Suppl. S1), D275–D279. [Google Scholar] [CrossRef]
  41. Čandek, K.; Kuntner, M. DNA barcoding gap: Reliable species identification over morphological and geographical scales. Mol. Ecol. Resour. 2015, 15, 268–277. [Google Scholar] [CrossRef]
  42. Maxam, A.M.; Gilbert, W. A new method for sequencing DNA. Proc. Natl. Acad. Sci. USA 1977, 74, 560–564. [Google Scholar] [CrossRef]
  43. Lev, O.; Ramil, V.; Aram, G.; Vladislav, S.; Sergey, K.; Anastasia, R. Prospects for DNA authentication in wine production monitoring. Foods Raw Mater. 2018, 6, 438–448. [Google Scholar]
  44. Konermann, L. Addressing a common misconception: Ammonium acetate as neutral pH “buffer” for native electrospray mass spectrometry. J. Am. Soc. Mass Spectrom. 2017, 28, 1827–1835. [Google Scholar] [CrossRef]
  45. Frostegård, Å.S.A.; Courtois, S.; Ramisse, V.; Clerc, S.; Bernillon, D.; Le Gall, F.; Jeannin, P.; Nesme, X.; Simonet, P. Quantification of bias related to the extraction of DNA directly from soils. Appl. Environ. Microbiol. 1999, 65, 5409–5420. [Google Scholar] [CrossRef]
  46. Shi, S.R.; Cote, R.J.; Wu, L.; Liu, C.; Datar, R.; Shi, Y.; Liu, D.; Lim, H.; Taylor, C.R. DNA extraction from archival formalin-fixed, paraffin-embedded tissue sections based on the antigen retrieval principle: Heating under the influence of pH. J. Histochem. Cytochem. 2002, 50, 1005–1011. [Google Scholar] [CrossRef]
  47. Young, J.M.; Rawlence, N.J.; Weyrich, L.S.; Cooper, A. Limitations and recommendations for successful DNA extraction from forensic soil samples: A review. Sci. Justice 2014, 54, 238–244. [Google Scholar] [CrossRef]
  48. Dumolin-Lapègue, S.; Pemonge, M.-H.; Gielly, L.; Taberlet, P.; Petit, R.J. Amplification of oak DNA from ancient and modern wood. Mol. Ecol. 1999, 8, 2137–2140. [Google Scholar] [CrossRef] [PubMed]
  49. Wagner, S.; Lagane, F.; Seguin-Orlando, A.; Schubert, M.; Leroy, T.; Guichoux, E.; Chancerel, E.; Bech-Hebelstrup, I.; Bernard, V.; Billard, C.; et al. High-Throughput DNA sequencing of ancient wood. Mol. Ecol. 2018, 27, 1138–1154. [Google Scholar] [CrossRef]
  50. Qin, M.; Zhu, C.J.; Yang, J.B.; Vatanparast, M.; Schley, R.; Lai, Q.; Zhang, D.Y.; Tu, T.Y.; Klitgård, B.B.; Li, S.J.; et al. Comparative analysis of complete plastid genome reveals powerful barcode regions for identifying wood of Dalbergia odorifera and D. tonkinensis (Leguminosae). J. Syst. Evol. 2022, 60, 73–84. [Google Scholar] [CrossRef]
Figure 1. Agarose gel electrophoresis PCR products of ITS barcodes. M represents the 2000 bp marker, and CK is the negative control containing positive and negative primers and 1.1 × T3 Super PCR Mix.
Forests 14 02318 g001
Figure 2. Frequency distribution of intra- and inter-genetic divergence of ITS2 sequences of samples. Divergences were calculated using Kimura’s two parameter (K2P) model.
Forests 14 02318 g002
Figure 3. NJ tree of samples from genus Dalbergia based on ITS2 sequences. The red triangles are the bootstrap values for each species. Bootstrap values (>50%) are displayed above the relevant branches. The first two letters of the serial number denote sequences uploaded in this experiment, specifically starting with OQ, while the rest represent sequences downloaded from the NCBI database.
Forests 14 02318 g003
Figure 4. ITS2 secondary structures of genus Dalbergia. Latin name and serial number of sequences from NCBI database are marked below image A-G. All the samples exhibited secondary structures comprising a center ring and four similar helices (as shown in A: helix I, II, III, and IV).
Forests 14 02318 g004
Table 1. Sample source information.
TaxonSample IDLocationPositionTotalAge (Years)
Dalbergia odoriferaHSHainan, Chinasapwood31
Dalbergia odoriferaHHHainan, Chinaheartwood332
Dalbergia sissooBSYunnan, Chinasapwood35
Dalbergia sissooBHYunnan, Chinaheartwood35
Dalbergia sissooYSYunnan, Chinatransition335
Dalbergia oliveriESSoutheast Asiasapwood35
Dalbergia oliveriEHSoutheast Asiaheartwood35
Dalbergia cochinchinensisJSSoutheast Asiasapwood35
Dalbergia cochinchinensisJHSoutheast Asiaheartwood35
Dalbergia cultrataCSYunnan, Chinasapwood35
Dalbergia cultrataCHYunnan, Chinaheartwood35
Dalbergia benthamiiLHHainan, Chinasapwood32
Dalbergia benthamiiLSHainan, Chinaheartwood481
Dalbergia benthamiiLAHainan, Chinaheartwood32
Dalbergia benthamiiLBGuangdong, Chinaheartwood32
Dalbergia pinnataPSHainan, Chinasapwood32
Dalbergia pinnataPHHainan, Chinaheartwood32
Dalbergia pinnataPAHainan, Chinaheartwood32
Dalbergia tsoiTSHainan, Chinasapwood32
Dalbergia tsoiTHHainan, Chinaheartwood32
Dalbergia tsoiTAHainan, Chinaheartwood32
Dalbergia tsoiTBHainan, Chinaheartwood32
Dalbergia melanoxylonMSAfricasapwood35
Dalbergia melanoxylonMHAfricaheartwood35
Dalbergia obtusifoliaISGuangxi, Chinasapwood31
Table 2. Results of total DNA purity and yield of wood at different ammonium acetate concentrations. The DNeasy plant mini kit and CTAB kit methods served as the control group. The purity of total wood DNA, extracted using the modified CTAB method, was calculated as the mean value, and significance analysis was conducted on the yield. Each result represented the mean value of three replicate samples (except for D. benthamii, where six sample replicates were used), and data in the parentheses indicate standard deviation. The significant differences (p < 0.05) in the yield of total wood DNA are denoted by different alphabets.
DNA Extraction MethodOD260/280Yield/ (ng·mg−1)
D. benthamiiD. odoriferaD. sissooD. benthamiiD. odoriferaD. sissoo
DNeasy Plant Mini Kit1.65 (0.10)1.63 (0.15)1.21 (0.01)9.26 (2.47)17.16(1.12)7.33 (0.12)
CTAB Kit1.88 (0.02)1.81 (0.10)1.74 (0.04)29.36 (5.67)25.15 (10.54)17.95 (0.77)
Modified CTAB
(0.25 M ammonium acetate)
2.07(0.02)1.81(0.04)1.77(0.02)64.67 A (9.92)22.14 A (1.76)18.73 A (0.24)
Modified CTAB
(0.5 M ammonium acetate)
1.86 (0.08)1.89 (0.02)1.79 (0.08)15.11 B (2.67)20.36 AB (0.20)13.15 B (0.11)
Modified CTAB
(1 M ammonium acetate)
1.74 (0.24)1.88 (0.01)1.73 (0.02)5.34 C (1.05)19.29 B (1.40)11.63 C (0.12)
Modified CTAB
(2 M ammonium acetate)
1.85 (0.14)1.82 (0.11)1.73 (0.15)8.64 C (2.22)20.39 AB (0.81)12.25 C (0.84)
Table 3. Results of total DNA purity and yield of wood with different rinsing treatments. Mean values were calculated for the purity of total wood DNA extracted using the modified CTAB method with different numbers of rinses, and the yields were analyzed for statistical significance. Each result represented the mean of three replicate samples, with data in parentheses indicating standard deviation. Significant differences (p < 0.05) in the yields of total wood DNA are denoted by different alphabets.
DNA Extraction MethodOD260/280Yield/ (ng·mg−1)
D. benthamiiD. odoriferaD. sissooD. benthamiiD. odoriferaD. sissoo
Modified CTAB
(No rinsing treatment)
1.66 (0.05)1.61 (0.05)1.50 (0.05)92.87 A (5.14)50.48 A (4.70)56.37 A (5.63)
Modified CTAB
(Rinsing treatment 1 time)
2.07 (0.03)1.80 (0.02)1.71 (0.04)75.29 B (5.16)26.34 B (4.04)19.83 B (3.90)
Modified CTAB
(Rinsing treatment 2 times)
2.06 (0.02)1.81 (0.04)1.77 (0.02)71.56 B (8.68)22.14 BC (1.77)18.97 B (0.46)
Modified CTAB
(Rinsing treatment 3 times)
2.05 (0.02)1.88 (0.02)1.83 (0.08)66.63 B (3.44)16.60 C (0.35)17.32 B (0.14)
Modified CTAB
(Rinsing treatment 4 times)
2.04 (0.03)1.80 (0.11)1.71 (0.12)62.92 B (8.69)17.60 C (0.69)15.09 B (2.27)
Table 4. The amplification and sequencing efficiency of samples.
Type of SamplesAmplification Efficiency (%)Sequencing Efficiency (%)
Sapwood100100
Heartwood8080
Heartwood (under 2 years)100100
Heartwood (more than 5 years)4040
Disclaimer/Publisher’s Note: The statements, opinions and data contained in all publications are solely those of the individual author(s) and contributor(s) and not of MDPI and/or the editor(s). MDPI and/or the editor(s) disclaim responsibility for any injury to people or property resulting from any ideas, methods, instructions or products referred to in the content.

