Article

Effects of Afforestation Patterns on Soil Nutrient and Microbial Community Diversity in Rocky Desertification Areas

1
College of Forestry, Central South University of Forestry and Technology, Changsha 410004, China
2
College of Natural Resources and Environment, Northwest A&F University, Yangling, Xianyang 712100, China
3
College of Arts and Sciences, Saint Xavier University, Chicago, IL 60655, USA
4
National Engineering Laboratory for Applied Technology of Forestry & Ecology in South China, Changsha 410004, China
*
Author to whom correspondence should be addressed.
These authors contributed equally to this work.
Forests 2023, 14(12), 2370; https://doi.org/10.3390/f14122370
Submission received: 25 October 2023 / Revised: 26 November 2023 / Accepted: 2 December 2023 / Published: 4 December 2023
(This article belongs to the Section Forest Soil)

Abstract

:
Karst ecosystems are characterized by the dissolution of soluble rocks, displaying distinctive landscape features such as rugged peaks, steep slopes, and deep valleys. Afforestation is an effective approach for improving soil quality in rocky desertification areas because plants have evolved unique adaptations to thrive in such environments. However, the effects of tree species composition and cultivation patterns on the soil quality, microbial diversity, stability, and functions in rocky desertification areas remain unclear. In this work, four study plots including three types of forests—pure Pinus massoniana plantations, Toona sinensis plantations, mixed coniferous and broadleaf plantations (Pinus massonianaBetula luminifera forests), and unforested area as the control—were established in a karst desertification area in the Hunan province of China. Soil properties including soil bulk density, soil organic carbon, total nitrogen, total phosphate, soil ammonium nitrogen, nitrate, available phosphate, soil pH, and soil microbial diversity were investigated in the study area. The results showed that the forests significantly increased the soil organic carbon, total nitrogen, and ammonium nitrogen compared to the unforested area. The microbial diversity indicators in mixed forests were significantly higher than those in the Pinus massoniana forests. The dominant bacteria phyla included Proteobacteria, Acidobacteria, and Actinobacteria, while fungi species such as Ascomycota and Basidiomycota were identified in all study plots. In addition, the AVD index evaluation revealed that the mixed forests enhanced the stability of the soil microbial communities compared to the monoculture plantations and unforested plots in rocky desertification areas. The research results indicated that, among the various forest types, the mixed forest was the most effective choice for afforestation in terms of improving the soil quality by changing the soil’s physiological properties in rocky desertification areas. Our study provided guidance and insights for afforestation technology and the optimal allocation of different tree species in the cultivation and management of plantation forests in rocky desertification regions.

1. Introduction

Rocky desertification is emerging as a significant ecological and environmental challenge, impacting regions with carbonate rocks on a global scale. It is used to describe the process of transforming karst areas covered by vegetation and soil into rocky landscapes with little soil and vegetation. This phenomenon results from an unsustainable interplay between human activities and natural factors, triggering significant conflicts between communities and their environment. The consequences include the loss of vegetation, barren soil, and severe soil erosion, often giving rise to extensive areas of exposed bedrock and terrains resembling desertification [1,2]. Rocky desertification ranks among the top three major ecological disasters impeding the economic and social development of karst regions in China [3]. Xiangxi Autonomous Prefecture in Hunan Province is a typical rocky desertification area, characterized by low forest coverage, limited plant species diversity, simplified ecosystem structure, weakened local community self-regulation capabilities, and accelerated forest degradation [4]. In this context, the restoration of vegetation emerges as a pivotal strategy for advancing ecological rehabilitation and management in rocky desertification regions. The objective is to improve both the current ecological and economic conditions in the aim of sustainable regional development.
Soil microorganisms represent the most diverse and active components in soil ecosystems [5], play a vital role in maintaining plant diversity, promoting ecosystem stability, and exhibit high sensitivity to environmental changes during forest succession [6]. Due to their unique physiological properties and functions, they have direct or indirect effects on soil nutrient cycling [7], the enhancement of soil structure within forest ecosystems [8], and complex biogeochemical cycles [9]. In addition, soil microorganisms serve as pivotal indicators for assessing ecosystem health and sustainability [10]. The decline in soil organic matter content is correlated with a reduction in the overall microorganism population [11], and distinct vegetation types exert varying effects on soil microorganisms [12].
The intense soil erosion observed in rocky desertification regions has led to the erosion of soil layers and vegetation loss. As a result, there has been a noticeable decrease in biodiversity and a degradation of ecosystem functions, prompting significant concern and attention. Previous studies on rocky desertification have predominantly focused on management practices [13,14,15], ecological succession [16], plant diversity [17], and soil physiochemical properties [18]. However, the vital role of soil microbial communities in driving the biogeochemical cycles, decomposing organic matter, and promoting plant growth has received limited recognition [19]. The loss of soil microbial diversity has the potential to negatively impact crucial ecosystem functions and can also influence plant productivity. Therefore, the investigation of soil microbial communities and diversity in rocky desertification areas carries considerable research importance. However, there has been a lack of reports regarding the types and diversity of soil microorganisms associated with various afforestation patterns in rocky desertification areas. This study aimed to investigate the impact of different forest types on soil physicochemical properties and soil microbial community on these kinds of environments. The objectives of this study were: (1) to examine the alterations in soil physicochemical properties across various forest types; and (2) to explore the differences in soil microbial community among different forest types within rocky desertification areas.

2. Materials and Methods

2.1. Study Site

The study site was located within the Qingping Forest Ecology Research Experimental Station of Xiangxi Autonomous Prefecture, Hunan Province, China (109°10′ E, 27°44.5′ N). The region has an annual mean temperature and total precipitation of 16.3 °C and received a total annual precipitation of 1500 mm. The annual frost-free period ranges from 269 to 292 days with an approximate annual sunshine duration of 1340 h at the Xiangxi Autonomous meteorological station. The study area is characterized by a typical mountainous landform, with a covering of yellow-brown soil. The predominant parent rock in the area is limestone, and the average soil depth is 30 cm. The shrub and grassland displayed an average land coverage of 80% with an average height of 0.56 m in the unforested areas of the study site. Within this region, three types of plantations were established, each characterized by the dominant tree species of plant communities. The study area included the coniferous plantations of Pinus massoniana (CF), the broadleaf of Toona sinensis (BF), and the mix of coniferous and broad-leaved Pinus massonianaBetula luminifera (MF) communities, which were planted in 1976. The understory shrubs and herbs in this area primarily consisted of Zanthoxylum armatum DC., Viburnum dilatatum Thunb., Dichroa febrifuga Lour., and Rosa cymosa Tratt., while herbaceous plants included Woodwardia japonica (L.f.) Sm., Amphicarpaea edgeworthii Benth., Arthraxon hispidus (Thunb.) Makino, and Sanicula chinensis Bunge. Further details about the study site can be found in Table 1.

2.2. Experimental Design and Soil Sample Collection

The field study took place from July to August 2019 at the Qingping Forest Ecology Research Experimental Station, situated in the Xiangxi Autonomous Prefecture. For this study, a completely randomized design (CRD) was employed, involving three types of forests as treatment plots, and an unforested plot as the control, all within the same study area. The three forest types included the coniferous stands of Pinus massoniana (CF), broadleaf stands of Toona sinensis (BF), and mixed coniferous and broad-leaved stands of Pinus massonianaBetula luminifera (MF). In addition, unforested land was randomly designated as the control area within the study site. The dimensions of both the afforested and unforested plots were 20 m × 20 m, with four replications for each type, resulting in a total of 16 plots established within the study site. The dimensions of the understory shrubland plots measured 2 m × 2 m, and the grassland plots measured 1 m × 1 m. A minimum distance of at least 10 m was maintained between the four replicated areas of the same stand type.
The measurements were collected for trees with a diameter at breast height (DBH) of ≥3 cm, including data such as the DBH, tree height, crown width, and tree density within each plot. For shrubs (with DBH < 3 m), recorded information included the species name, height, coverage of crown width, and the number of plant clumps. Similarly, for herbs, the data collected included the species name, height, coverage, and the number of clumps. Soil samples were collected from the soil surface layer (0–20 cm) using a soil drill at three points as an S-shape within each plot. These samples were then thoroughly mixed to create one composite sample per plot, resulting in a total of 16 soil samples. Prior to analysis, stones and roots were removed from all soil samples, followed by sieving the soil through a 2 mm sieve. The sieved soil was then stored in a refrigerator freezer at 4 °C for soil chemical analysis, while separate portions were stored at −20 °C for deoxyribonucleic acid (DNA) extractions in the laboratory.

2.3. Analysis of Soil Physical and Chemical Properties

The soil physical indicators, including soil bulk density (SBD), soil saturated water holding (SWH), capillary water holding capacity (CWHC), and soil field water holding capacity (SFWH) were measured and calculated using “ring-cutting and water immersion” method. Additionally, the natural soil water content (SWC) was determined using the oven-drying method (105 °C, 12 h) [20]. The pH value was assessed using the water extraction potential method with a pH meter (InsMark™ IS126, Shanghai, China). Chinese Forestry Industry Standards were followed to process the soil samples, such as LY/T 1237-1999, LY/T 1228-1999, and LY/T 1232-1999, which were used to determine the soil organic carbon, total N, and total P [21].

2.4. Illumina MiSeq High-Throughput Sequencing

To initiate the deoxyribonucleic acid (DNA) extraction procedure, 250–500 mg of fresh sample was transferred to a 2.0 mL centrifuge tube, followed by the addition of grinding beads from the NucleoSpin Bead Tube into the sample tube. To this mixture, 700 μL of SL2 and 150 μL of Enhancer SX were added to the tube, ensuring a secure closure. The contents were thoroughly mixed using a vortex mixer, and the sample tube was then placed into a shaking mixer set at a temperature of 70 °C, shaking at 1000–1200 g for 10 min. Samples were lysed and centrifuged at 12 000× g for 2 min and approximately 700 μL of the supernatant was transferred to a new 2.0 mL centrifuge tube. The mixture was incubated at 4 °C for 5 min, followed by centrifugation at 12,000× g for 2 min to remove any inhibitors. The DNA binding process was initiated, including necessary washes, the drying of the silicon matrix membrane, and the final transfer of DNA to a new 1.5 mL centrifuge tube for elution and subsequent use.
The hypervariable V3–V4 region of the bacterial 16S Ribosomal Ribonucleic Acid (rRNA) gene was amplified using the primer pair 359F (5′-GGGGAATYTTCCGCAATGGG-3′) and 781R2 (5′-GACTACWGGGGTATCTAATCCCWTT-3′). For amplifying the fungal ITS1 region, ITS5F (5′-GGAAGTAAAAGTCGTAACAAGG-3′) and ITS1R (5′-GCTGCGTTCTTCATCGATGC-3′) were used [22]. Additionally, NEBQ5 DNA high-fidelity polymerase was used, and the number of amplification cycles was strictly controlled during the polymerase chain reaction (PCR) amplification of the target fragment. The DNA sequencing was performed on the PacBio platform. The quantitative determination, homogenization, library preparation, online sequencing, and data quality control of PCR amplification products were all completed by BMK Cloud (Biomarker Technologies Co., Ltd., Beijing, China. http://www.biocloud.net (accessed on 1 December 2023) [23].
Sequences with 97% similarity were clustered together, and species annotation was performed based on taxa. Sequencing error sequences and operational taxonomic units (OTUs) with abundance values of less than 0.001% of the total sequencing volume of all samples were removed. The resulting abundance matrix, with rare OTUs excluded, was used for subsequent serial analysis. The taxonomy information of the bacterial OTUs was identified using the Ribosomal Database Project (RDP) classifier (http://rdp.cme.msu.edu (accessed on 1 December 2023), and the UNITE (v 7.1) database was assigned to classify the information of fungal OTUs [24].

2.5. Statistical Analyses

The α diversity index is usually used to investigate species diversity within a community, reflecting the differentiation of ecological niches between species. It serves as a commonly used evaluation index in ecological studies [25]. Calculations, according to Whittaker’s method [26], are as follows:
Shannon diversity index (H): H = −∑IVilnIVi
Patrick richness index (R): R = S
Pielou evenness index (E): E = (−∑IVilnIVi)/lnS
where S is the number of species in the community; and IVi is the importance value of species i.
Community composition (β diversity) was evaluated using pairwise Bray–Curtis dissimilarity in all analyses [27].
D B r a y = i = 1 p y i j y i k i = 1 p y i j + y i k
where p is the number of species (number of species in the sample-species matrix) and yij and yik denote the corresponding species multiplicity in the two samples.
A one-way analysis of variance (ANOVA) was conducted followed by a least significant difference multiple comparison test (with a significance level of p < 0.05). These analyses were performed to assess the significant effects of the types of afforestation on soil properties (SBD, SOC, TN, TP, NH4+-N, NO3-N, AP, pH), the diversity indicators of the soil microbial community (Shannon, Patrick, and Pielou indices, respectively), and the compositions of the soil microbial community.
To distinguish the microbial community profiles among the four types of plots, nonmetric multidimensional scaling (NMDS) analysis was conducted on the OTU data for bacterial and fungal communities [28]. Constrained corresponding analysis (CCA) was performed to investigate the relationships between soil microbial communities and soil physicochemical properties. Separate co-occurrence networks were constructed for all types of plots to explore the differences in co-occurrence patterns using the R package ‘vegan’ [29]. These analyses were performed using the R statistical software (version 4.2.2, http://www.r-project.org/, accessed on 1 December 2023).

3. Results

3.1. Physicochemical Properties of Soil in Different Afforestation Patterns

The physical properties of the soil at the study site are presented in Table 2. Among the different forest types, the BF forest exhibited the highest soil saturated water holding capacity, capillary water holding capacity, and field water holding capacity, while the CF forest had the lowest values. The soil bulk density (SBD) significantly decreased after afforestation, with the highest bulk density found in the CF forest, followed by the BF forest, and the lowest SBD was observed in MF forest.
The soil chemical properties in the different types of plots are presented in Table 3. These properties exhibited significant variations among the different plot types, with forested areas showing notable differences in soil properties, particularly regarding the SOC and total nitrogen (TN) content when compared to the unforested area. There was a significant increase in both the SOC and TN contents, with the CF forest displaying the lowest levels for both parameters. The total phosphorus (TP) content was notably lower in the CF forest. Furthermore, the CF forest had a significantly lower ammonium–nitrogen (NH4+-N) content compared to both the BF and MF forests. In addition, the soil pH gradually decreased after afforestation, with the CF forest exhibiting the lowest pH among the forest types.

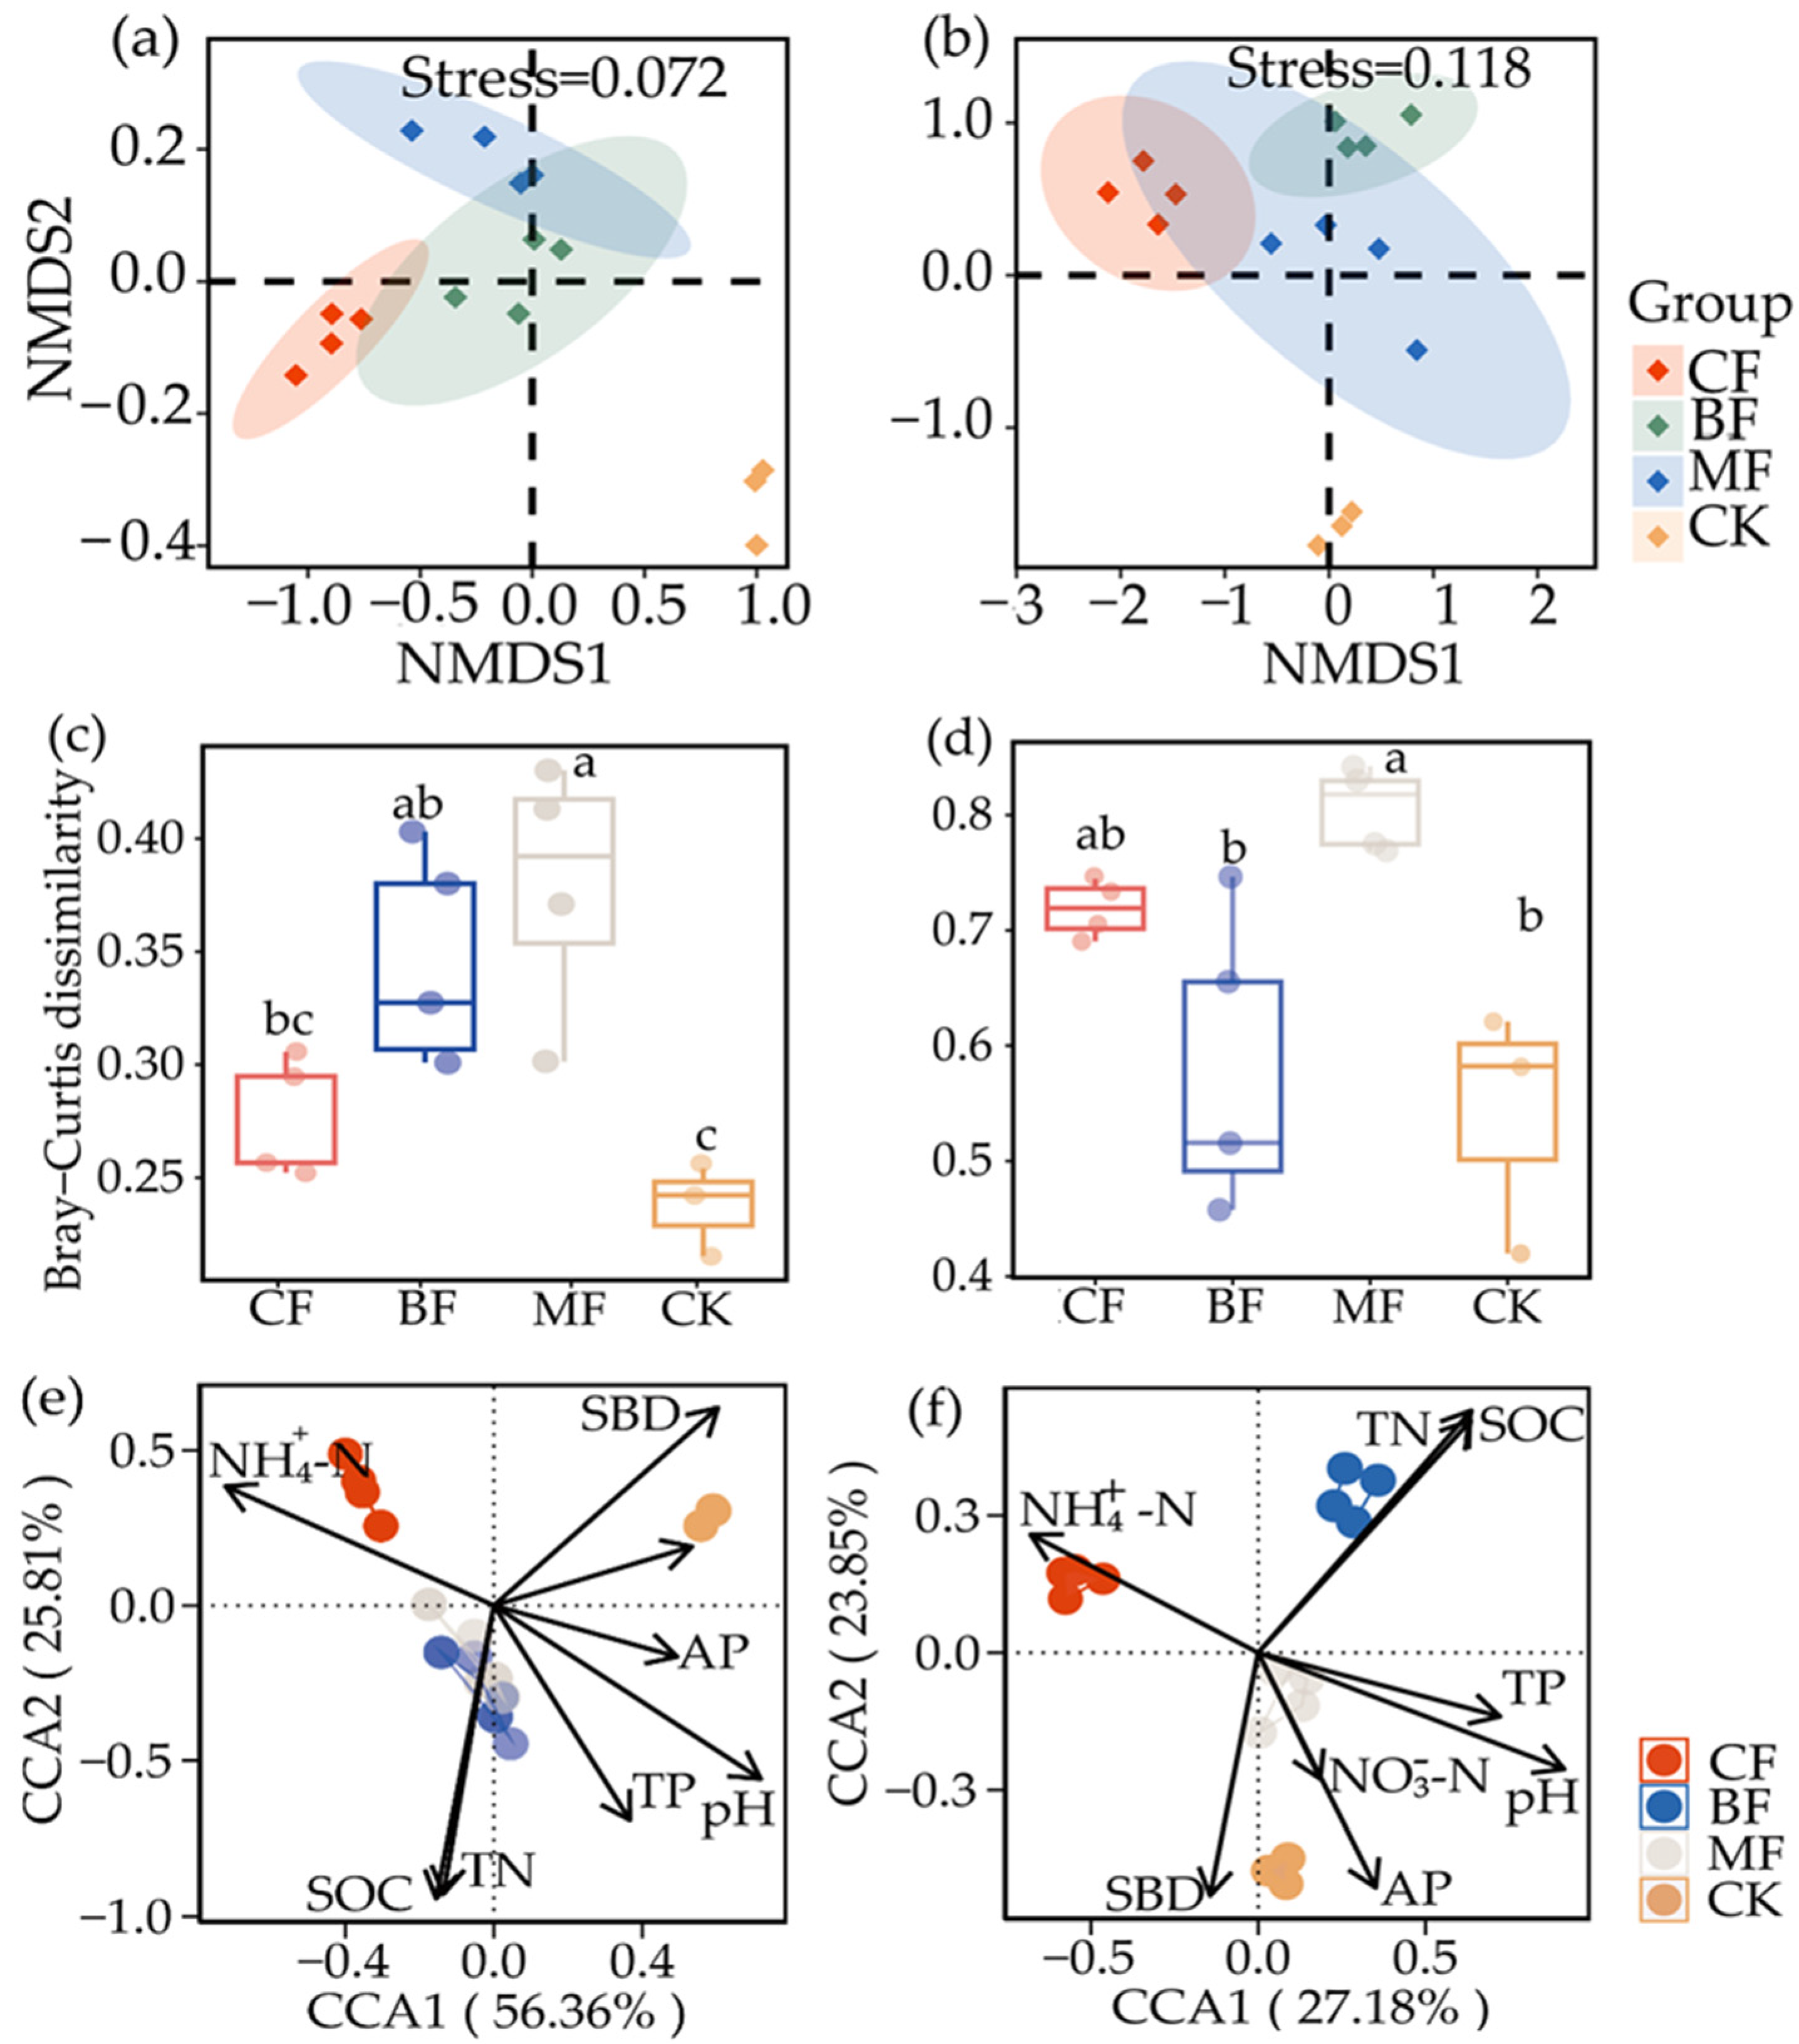
3.2. Soil Microbial Community Structure among Different Afforestation Patterns

Proteobacteria and Acidobacteria were identified as the dominant bacterial phyla across all samples. Additionally, in the forested areas, Verrucomicrobia and Rokubacteria were also dominant phyla, while they were not predominant in unforested areas (Figure 1a). Notably, in the microorganisms of the unforested area, the abundance of the bacterial phylum Gemmatimonadetes exceeded that in the planted forest. Ascomycota was identified as the dominant phylum in the unforested CK plot. In the MF plot, both Ascomycota and Basidiomycota were identified as dominant phyla. In the CF plot, Ascomycota was less abundant compared to Basidiomycota, while in the MF plot, the situation was reversed (Figure 1b). Remarkably, among the microorganisms in forested areas, there was a notably higher abundance of the fungal phylum Mortierellomycota than in the unforested CK plot.
The bacterial Shannon index serves as a measure of microbial diversity, with higher values indicating greater diversity. Notably, the BF plot exhibited a significantly higher Shannon index of the bacterial community compared to the CF plot (Figure 2a). However, the fungi Shannon index was lower in the forested plots than in the unforested CK plot (Figure 2d). The soil microbial diversity was higher in BF and MF than in CF among the types of forests.
Non-metric multidimensional scaling (NMDS) analysis revealed that the soil samples of the forested plots and the unforested CK plot formed distinct clusters in the ordination space (Figure 3a,b). These differences between MF and unforested soils were the largest for bacterial communities, followed by fungal communities; this indicates that the soil bacterial communities were more influenced by the forestation of the MF. Furthermore, we estimated the differences in beta-diversity among the different microbial community groups based on the Bray–Curtis distance (Figure 3c,d). Fungal communities showed the highest beta-diversity, indicating their higher dispersion. Bacterial and fungal communities showed the highest beta-diversity in the MF forest, indicating a higher dispersion in the MF forest. The land areas with forests led to a significant increase in beta diversity for both bacterial and fungal communities when compared to the control plots.
The constrained corresponding analysis (CCA) found that the soil properties explained 82.17% and 51.03% of the total variation in the bacterial and fungal communities, respectively (Figure 3e–f). The fitting of edaphic properties onto the CCA ordination suggested significant relationships between SOC, NH4+-N, TN, and SBD (p < 0.01), with strong variation in the bacterial community structure. Additionally, significant associations were observed between pH, SOC, TN, NH4+-N, and (p < 0.01) with changes in the fungal community structure (Table 4).

3.3. Co-Occurrence Patterns of Soil Microbial in Different Afforestation Patterns

The co-occurrence network analysis highlighted notable distinctions between the forested plots and unforested CK plot (Figure 4). To characterize the intricate relationships among the nodes, the topological properties of the network were computed. The bacterial network in afforested plots exhibits greater stability compared to the unforested CK plots, with both a higher node count and modularity index. In contrast, the bacterial network in the unforested CK plot is more vulnerable to environmental disturbances, as evidenced by a node count of 135 and a modularity index of 0.66. Based on the taxonomy annotation, the network in the afforested areas was primarily dominated by bacterial phyla such as Proteobacteria, Acidobacteria, Verrucomicrobia, and Actinobacteria. In contrast, the dominant bacterial phyla in the unforested CK plot include Proteobacteria, Acidobacteria, Actinobacteria, and Gemmatimonadetes. The fungal phyla Ascomycota and Basidiomycota were dominated across all soil samples.
The unforested CK plot exhibited a higher number of network nodes, edges, and average degree compared to forested areas in Fungi (Figure 4e–h). In addition, the stability of the microbial community was evaluated by examining the changes in community composition within the soil of both the forested and unforested CK plot. The results indicated that the bacterial community exhibited a lower AVD in the MF plot, indicating a higher level of stability and resistance to disturbance within the community (Figure 5).

4. Discussion

4.1. Physicochemical Properties of Soil at Different Afforestation Patterns

Tree species in forests within karst regions have evolved unique adaptations to their environment for enhancing soil quality. Forests play a vital role for improving ecological succession and soil properties in karst areas through vegetation restoration [30]. In our study, we discovered that forest types showed a significant impact on soil physicochemical properties in rocky desertification areas. The forest soils had a lower saturated water holding capacity compared to the control plots in this study. This phenomenon may primarily be due to the tree root infiltration and the above-ground vegetation cover, which reduces the soil pore spaces. In contrast, the looser surface soil and the absence of tree root infiltration resulted in more pore space in the soil, leading to increased rainwater retention in the unforested areas. Among the forested soil types within the 0–20 cm surface layer, the SBD ranked that the CF forest > BF forest > MF forest (Table 2). Our results are consistent with those of other findings regarding the soil bulk density (SBD) being lower in forest plots than in the unforested control plots [31], as well as the lowest SBD observed in mixed forests [32]. The high SBD in the unforested control plots is primarily attributed to the poor soil texture and compacted soils resulting from long-term water and wind erosion [33]. In contrast, forest plots tend to experience reduced soil compaction because of tree root penetration and soil improvement. In particular, the mixed forest plots had the lowest soil water holding capacity due to the intertwining of the root systems of multiple tree species. This pattern suggests that the soil permeability and water-holding capacity were superior in the mixed forests and broad-leaved forests compared to the coniferous forests in rocky desertification areas.
The content of the SOC and other elements in the soil of the MF plot were significantly higher than those in the CF plot (Table 3) in this study. This difference can be attributed to the low soil quality combined with the limited input and accumulation of plant residues in the CF plot, which may restrict the accumulation of soil organic matter (SOM). In contrast, MF has a relatively high SOC content due to a greater variety of sources of organic matter and the faster accumulation of organic carbon. In addition, the unforested CK plot also exhibited lower levels of total nitrogen (TN) compared to the forested plots, particularly in comparison to the MF plot (Table 3). This phenomenon can be attributed to the greater complexity of nutrient cycling in mixed forests, where the diversity of tree species promotes intricate nutrient cycling processes [34]. This complexity contributes to the accumulation of nitrogen in the soil. Additionally, SOM plays a role in the adsorption and retention of nitrogen in soils [35]. In the MF plot, the SOM content was relatively high due to the presence of numerous sources of organic matter. This increase in organic matter can enhance nutrient adsorption and retention, consequently resulting in elevated soil TP and TN contents. The soil pH was ranked that the BF > MF > CF, exhibited a declining trend across the various forest types in our study aligning with the observations of prior studies [36]. Afforestation led to a reduction in SBD, which confirmed that afforestation can enhance the physical characteristics of the soil. Several studies have also demonstrated that the soil nutrient concentration tends to increase following afforestation [37], mainly attributed to the increased biomass both above and below the soil surface [38]. Additionally, vegetation litter plays a role in improving soil properties, including organic matter and soil structure, and mitigating the nutrient loss arising from soil erosion [39].

4.2. Variety of Microbial Community Composition and Structure in Different Afforestation Patterns

The results of non-metric multidimensional scaling (NMDS) have revealed a distinct difference in the soil microbial community between the unforested CK plot and the other afforested plots, and revealed that the composition and structure of bacteria varied among CF, BF, and MF plots in our study (Figure 2). These observations implied that distinct tree species may lead to unique evolutionary traits in soil microorganisms [40]. In this study, the prevailing phyla of the soil bacteria across all forest types were Proteobacteria, Acidobacteria, Actinobacteria, and Verrucomicrobia. Previous studies have suggested that, beyond variations in the relative abundance of the same microbial taxa, soils under different land-use practices also host distinct indicator groups. Specifically, bacterial communities in karst forest soils comprise Acidobacteriales, Xiphinematobacter, and Mycobacterium, demonstrating high specificity to their respective habitats [41,42]. Some indicative microbial communities exhibited similar responses to the changes in the karst area across the different successional stages of vegetation. For example, Yang et al. (2022) found that, in terms of the compositional response of bacterial communities, the main responsive species include Pedomicrobium, Bradyrhizobium, and Nitrospira in the different vegetation conditions of rocky desertification areas. Pedomicrobium is a bacterial species that is widely distributed in the α-Proteobacteria phylum of terrestrial ecosystems. Similarly, Chen et al. (2019) discovered that the Proteobacteria phylum was dominant among the bacterial communities in the soil of karst mixed forests [43,44]. Acidobacteriota exhibited a strong association with soil nutrition. Generally, the abundance of Acidobacteriota is higher in nutrient-poor soils, suggesting their potential role as indicators of a soil degradation [45]. In our study, the forested plots resulted in a decrease in the relative abundance of Acidobacteriota. This suggests that afforestation contributed to the improvement of soil environment and quality. Previous studies indicated that the soil fungal composition varies across different successional stages in different intensities of rocky desertification areas. In potential and moderate rocky desertification areas, the dominant phylum of fungi in each successional stage is Ascomycota, while in highly rocky desertification areas, the dominant phyla of fungi change with vegetation succession, and include Basidiomycota, Ascomycota, and Zygomycota [46,47]. In our study, the abundance of Ascomycota was overwhelmingly dominant in CF, while Basidiomycetes exhibited absolute dominance in BF, the minor differences in the abundance of these two phyla was observed in the MF in our study. This phenomenon can be explained by the fact that MF also had a significant effect on changing the structure of the fungal community in the rocky desertification area, because Basidiomycota are capable of producing lignin-degrading enzymes, primarily responsible for decomposing lignin and other recalcitrant compounds. Conversely, Ascomycota specializes in the decomposition of cellulose and hemicellulose within litter [48].
Bacterial richness exhibited significant variation among the study sites, with the lowest richness observed for the CF forest and unforested CK plot (Figure 1b). This underscores the pivotal role of vegetation in shaping soil bacterial diversity. Surprisingly, the highest fungal diversity and evenness were found in the unforested CK plot. This statement aligns with numerous studies indicating that microbial communities are highly susceptible to human interference, potentially resulting in a decline in microbial community diversity [49]. This is also consistent with our hypothesis that the beta diversity of bacteria and fungi varied significantly among the different vegetation types. For instance, we noted a similar beta diversity in bacterial communities between MF and BF forests. Inversely, our study highlighted an increased dissimilarity between forested ecosystems and the unforested CK plot, indicating that forests modify the microbial niches shaped by the karst ecosystem across different vegetation types.
In natural environments, species are interdependent and create intricate network systems through the secretion of metabolites and interactions with other microorganisms [50,51]. A substantial number of connections among microbial taxa strengthens the network [52], and increased connectivity and network interactions enhance the microbial community stability [53,54]. In this study, we observed a closer coupling relationship and a more intricate interaction among bacterial taxa in the forested plots compared to the unforested CK plots. Especially in MF, the distinction was readily apparent (Figure 4). This is because the bacterial taxa in the MF forest exhibited heightened stability and increased resistance to environmental stress due to greater interconnectedness within the bacterial communities. Considering that associations in microbial networks may represent ecological interactions or niche sharing among microorganisms [55], the roots and litter from various tree species in MF provided a broader range of habitats and resources, resulting in a more abundant soil microbial community. Vegetation in MF is usually dense and effectively envelops the soil surface, safeguarding it against erosion by wind and water. This protective vegetation aids in preserving soil moisture and stability, creating an environment that supports the survival and reproduction of bacteria [56]. However, the vegetation in CF and the unforested CK plot displayed greater homogeneity and resulted in reduced diversity within soil microbial communities. In addition, competition in the ecological niches among different tree species and vegetation types within mixed forests contributed to the enhancement of bacterial community stability [57]. The specialized adaptation and competitive abilities of different bacteria within their respective ecological niches contribute to the maintenance of bacterial community diversity in MF, enhancing the community stability. In contrast, in the CF and unforested areas, the scope for ecotype competition might be more restricted, leading to a comparatively lower bacterial community stability. Therefore, the unforested soil bacterial community may be more sensitive to environmental changes compared with the forested soil bacterial community.
The co-occurrence network showed differences in fungal taxa between the forested and unforested CK plots. In the forested soils, the dominant and closely interacting taxa in the fungal networks included Basidiomycota and Mortierellomycota, whereas the unforested fungal networks included Ascomycota and Basidiomycota in our study. This finding was supported by numerous studies indicating that Basidiomycota and Ascomycota represent the primary soil fungi and play crucial roles in litter decomposition and soil nutrient cycling. Basidiomycota are capable of producing lignin-degrading enzymes which are primarily responsible for decomposing lignin and other recalcitrant compounds. Our results showed that most fungal taxa in the forested soils may adapt to the rocky desertification soil through cooperative symbiosis or mutualism, which is similar to the findings of other studies [54]. Higher plant abundance and diversity are associated with greater ecosystem productivity. Notably, distinctions exist in soil microbial communities, leaf litter decomposition, and mineralization processes among dominant tree species with varying botanical characteristics [58,59]. The increased fungal stability observed in the MF plot, compared to other forest types, can be attributed to the understory vegetation in MF providing a richer source of organic matter and nutrients, offering fungi a more abundant resource base and promoting greater biodiversity. Higher biodiversity is commonly linked to increased ecosystem stability [60]. The dominant understory vegetation in MF including Zanthoxylum armatum DC., Viburnum dilatatum Thunb., and Woodwardia japonica (L.f.) Sm. often establishes symbiotic relationships with mycorrhizal fungi, further enhancing its fungal stability. The unforested CK plot may have experienced more anthropogenic disturbances, such as changes in land use, vegetation destruction, or other environmental disruptions, which could lead to increased instability in the fungal community. Additionally, the soil in the unforested area may exhibit greater heterogeneity, potentially resulting in differences in the adaptability among fungal communities in different regions, and consequently reducing overall stability.

4.3. Correlation between Environmental Factors and Microbial Communities in Different Forest Types

It is well known that interactions between vegetation and soil conditions have a combined effect on soil microbes. Previous reports have indicated that forest types may influence soil microbial structure and activity due to the presence of different tree species for controlling the soil biota [61,62]. In this study, the correlation analysis revealed that SOC, TN, SBD, and soil pH were the main environmental factors influencing the soil bacterial and fungal communities. Bacterial communities showed greater sensitivity to environmental variables compared to fungal communities (Table 4). The explanation could be that the soil pH might directly affect the microbial communities by regulating the soil nutrient availability [63], and SOC serves as a pivotal resource for microorganisms, providing an energy source and foundational material for their growth and reproduction. Elevated levels of SOC contribute to heightened metabolic activity and accelerated microbial reproduction [6]. The impact of different forest types in rocky desertification areas can further influence the diversity and composition of soil microbial communities [64]. In this study, we focused on exploring the interactions between soil physical and chemical properties, soil microbial community composition, and forest types in karst areas. Investigating soil microbiology in karst regions is crucial for a deeper understanding of distribution patterns and influential factors on soil microorganisms in different forest stand types within these areas.

5. Conclusions

In this study, we found that afforestation efforts led to a gradual enhancement in the karst soil quality with a significant transformation in the soil microbial diversity. The various forest types exhibited a notable influence on the physicochemical properties of soil in rocky desertification areas. Specifically, the forested soils displayed a reduced saturated water holding capacity with the lowest soil bulk density compared to the control plots. Afforestation significantly changed the soil chemical properties, increasing the soil organic carbon (SOC) and total nitrogen (TN). Among the forest types, the mixed forest (MF) and broad-leaved forest (BF) had the higher soil pH, SOC, and TN, and the total phosphorus (TP) contents compared with the conifer forest (CF). The significantly lower ammonium–nitrogen (NH4+-N) was also observed in CF compared to the BF and MF forests.
The microbial diversity index of the mixed forest is higher than that of Pinus massoniana plantations. In both afforested and unforested areas, the dominant bacterial phyla were Proteobacteria and Acidobacteria, while fungi were primarily represented by Ascomycota and Basidiomycota. Key environmental factors influencing bacterial communities included SOC, TN, and the soil pH value, with the soil pH value and SOC having a predominant impact on fungal communities. Furthermore, the bacterial community structure demonstrated a greater sensitivity to environmental changes compared to fungi in various forest types within rocky desertification areas. The establishment of an artificial mixed forest promoted increased stability in both the soil bacterial and fungal communities in rocky desertification, as opposed to monoculture plantations and unforested areas. These findings contribute valuable insights into the dynamics of soil microbial communities in karst ecosystems, enhancing our understanding of ecosystem restoration and protection efforts.

Author Contributions

Conceptualization, N.Z. and P.D.; Methodology, P.D.; Validation, X.G. and Z.L.; Formal analysis, L.L.; Data curation, L.L. and T.H.; Writing—original draft, L.L. and T.H.; Writing—review & editing, Y.P. and P.D.; Funding acquisition, P.D. All authors have read and agreed to the published version of the manuscript.

Funding

This research was funded by the National Natural Science Foundation of China (32001303), the Changsha Municipal Natural Science Foundation (kq2014155), Forestry science and technology research and innovation project of Hunan Forestry Bureau (XLKY202330); the China Postdoctoral Science Foundation (2020M672524).

Data Availability Statement

Data will be made available on request.

Conflicts of Interest

The authors declare no conflict of interest.

References

  1. Lu, Z.-X.; Wang, P.; Ou, H.-B.; Wei, S.-X.; Wu, L.-C.; Jiang, Y.; Wang, R.-J.; Liu, X.-S.; Wang, Z.-H.; Chen, L.-J.; et al. Effects of different vegetation restoration on soil nutrients, enzyme activities, and microbial communities in degraded karst landscapes in southwest China. For. Ecol. Manag. 2022, 508, 120002. [Google Scholar] [CrossRef]
  2. Wang, S.J. Concept deduction and ITS connotation of Karst rocky desertification. China Karst 2002, 21, 101–105. [Google Scholar]
  3. Li, Y.B.; Shao, J.A.; Yang, H.; Xiong, Y.B. The relations between land use and karst rocky desertification in a typical karst area, China. Environ. Earth Sci. 2009, 57, 621–627. [Google Scholar] [CrossRef]
  4. Gao, L.; Wang, W.; Liao, X. Soil nutrients, enzyme activities, and bacterial communities in varied plant communities in karst rocky desertification regions in Wu shan County, Southwest China. Front. Microbiol. 2023, 14, 1180562. [Google Scholar] [CrossRef] [PubMed]
  5. Cheng, C.; Li, Y.; Long, M.; Gao, M.; Zhang, Y.; Lin, J.; Li, X. Moss biocrusts buffer the negative effects of karst rocky desertification on soil properties and soil microbial richness. Plant Soil 2020, 475, 153–168. [Google Scholar] [CrossRef]
  6. Chai, Y.; Cao, Y.; Yue, M.; Tian, T.; Yin, Q.; Dang, H.; Quan, J.; Zhang, R.; Wang, M. Soil abiotic properties and plant functional traits mediate associations between soil microbial and plant communities during a secondary forest succession on the Loess plateau. Front. Microbiol. 2019, 10, 895. [Google Scholar] [CrossRef] [PubMed]
  7. Zheng, W.Y.; Wang, Y.X.; Wang, Y.J. Effects of Different Vegetation Control Models on Soil Quality in Karst Rocky Desertification Areas. West. For. Sci. 2020, 49, 41–47. [Google Scholar]
  8. Wang, J.; Liu, Z.Q.; Bao, E.M. Effects of Forest and Grass Restoration on Soil Aggregates and Its Organic Carbon in Karst Rocky Desertification Areas. J. Soil Water Conserv. 2019, 33, 249–256. [Google Scholar]
  9. Zhang, Y.; Cong, J.; Lu, H.; Yang, C.; Yang, Y.; Zhou, J.; Li, D. An Integrated Study to Analyze Soil Microbial Community Structure and Metabolic Potential in Two Forest Types. PLoS ONE 2014, 9, e93773. [Google Scholar] [CrossRef]
  10. Fu, Y.; Zhuang, L.; Wang, Z.K. On the physical chemical and soil microbial properties of soils in the habitat of wild Ferula in Xinjiang. Acta Ecol. Sin. 2012, 32, 3279–3287. [Google Scholar]
  11. Trivedi, P.; Delgado-Baquerizo, M.; Trivedi, C. Microbial regulation of the soil carbon cycle: Evidence from gene-enzyme rela-tionships. ISME J. 2016, 10, 2593–2604. [Google Scholar] [CrossRef]
  12. Lin, S.; Zhuang, J.-Q.; Chen, T.; Zhang, A.-J.; Zhou, M.-M.; Lin, W.-X. Analysis of nutrient and microbial Biolog function diversity in tea soils with different planting years in Fujian Anxi. Chin. J. Eco-Agric. 2012, 20, 1471–1477. [Google Scholar] [CrossRef]
  13. Song, S.; Xiong, K.; Chi, Y.; He, C.; Fang, J.; He, S. Effect of cultivated pastures on soil bacterial communities in the karst rocky desertification area. Front. Microbiol. 2022, 13, 922989. [Google Scholar] [CrossRef]
  14. Meng, Z.Y.; Xie, G.; Chen, Y. Present Situation and Dynamic Variation of Rocky Desertification in Karst Area of Guizhou. China Soil Water Conserv. 2020, 53–56+7. [Google Scholar] [CrossRef]
  15. Wu, Q.; Zheng, W.; Rao, C.; Wang, E.; Yan, W. Soil Quality Assessment and Management in Karst Rocky Desertification Ecosystem of Southwest China. Forests 2022, 13, 1513. [Google Scholar] [CrossRef]
  16. Wang, X.F.; Huang, X.F.; Hu, J.W. Relationship among Soil Organic Carbon and Small Environment and Lithology in the Rocky Desertification Process in Different Karst Landforms. J. Soil Water Conserv. 2020, 34, 295–303. [Google Scholar]
  17. Ma, T.; Deng, X.; Chen, L.; Xiang, W. The soil properties and their effects on plant diversity in different degrees of rocky desertification. Sci. Total. Environ. 2020, 736, 139667. [Google Scholar] [CrossRef]
  18. Sheng, M.; Xiong, K.; Wang, L.; Li, X.; Li, R.; Tian, X. Response of soil physical and chemical properties to Rocky desertification succession in South China Karst. Carbonates Evaporites 2016, 33, 15–28. [Google Scholar] [CrossRef]
  19. Stokdyk, J.P.; Herrman, K.S. Effects of Frangula alnus on soil microbial communities and biogeochemical processes in Wisconsin forests. Plant Soil 2016, 409, 65–75. [Google Scholar] [CrossRef]
  20. Institute of Soil Science; Chinese Academy of Sciences. Soil Physical Properties Determination Method; Science Press: Beijing, China, 1978; Chapters 2, 4, 6. [Google Scholar]
  21. LY/T 1237-1999; National Forestry Bureau. Forestry Industry Standards of P. R. China. Determination of Organic Matter in Forest Soil and Calculation Carbon-Nitrogen Ratio Chinese Standards Press: Beijing, China, 1999.
  22. Edga, R.C. UPARSE: Highly accurate OTU sequences from microbial amplicon reads. Nat. Methods 2013, 10, 996. [Google Scholar] [CrossRef]
  23. Joshi, D.R.; Zhang, Y.; Zhang, H.; Gao, Y.; Yang, M. Characteristics of microbial community functional structure of a biological coking wastewater treatment system. J. Environ. Sci. 2018, 63, 105–115. [Google Scholar] [CrossRef] [PubMed]
  24. Abarenkov, K.; Nilsson, R.H.; Larsson, K.-H.; Alexander, I.J.; Eberhardt, U.; Erland, S.; Høiland, K.; Kjøller, R.; Larsson, E.; Pennanen, T.; et al. The UNITE database for molecular identification of fungi—Recent updates and future perspectives. New Phytol. 2010, 186, 281–285. [Google Scholar] [CrossRef] [PubMed]
  25. Whittaker, R.H. Evolution of Species Diversity in Land Communities. Evol. Biol. 1977, 10, 1–67. [Google Scholar] [CrossRef]
  26. Wu, G.L.; Du, G.Z.; Liu, Z.H. Effect of grazing exclusion and grazing on a Kobresia-dominated meadow in the Qinghai–Tibetan Plateau. Plant Soil 2009, 319, 115–126. [Google Scholar] [CrossRef]
  27. Legendre, P.; De Cáceres, M. Beta diversity as the variance of community data: Dissimilarity coefficients and partitioning. Ecol. Lett. 2013, 16, 951–963. [Google Scholar] [CrossRef] [PubMed]
  28. Catherine, L.; Rob, K. UniFrac: A New Phylogenetic Method for Comparing Microbial Communities. Appl. Environ. Microbiol. 2005, 71, 8228–8235. [Google Scholar]
  29. Oksanen, J. Multivariate analysis of ecological communities in R: Vegan tutorial. R Package Version 2011, 1, 1–43. [Google Scholar]
  30. Guan, H.; Fan, J. Effects of vegetation restoration on soil quality in fragile karst ecosystems of southwest China. PeerJ 2020, 8, e9456. [Google Scholar] [CrossRef]
  31. Gillespie, L.M.; Fromin, N.; Milcu, A.; Buatois, B.; Pontoizeau, C.; Hättenschwiler, S. Higher tree diversity increases soil microbial resistance to drought. Commun. Biol. 2020, 3, 377. [Google Scholar] [CrossRef]
  32. Long, H.F.; Su, W.C.; Xia, C. Relationship between Soil Organic Matter and Number of Microorganisms of Different Cropping Patterns in Desertification Region. Environ. Sci. Technol. 2013, 36, 57–62. [Google Scholar]
  33. Xiao, W.; Feng, S.; Liu, Z.; Su, Y.; Zhang, Y.; He, X. Interactions of soil particulate organic matter chemistry and microbial community composition mediating carbon mineralization in karst soils. Soil Biol. Biochem. 2017, 107, 85–93. [Google Scholar] [CrossRef]
  34. Yang, J.; Zhou, G.Y.; Tian, Y.Y. Differential analysis of soil bacteria diversity in different mixed forests of Dalbergia odorifera. Acta Ecol. Sin. 2015, 35, 8117–8127. [Google Scholar]
  35. Yang, X.; Chen, X.; Yang, X. Effect of organic matter on phosphorus adsorption and desorption in a black soil from Northeast China. Soil Tillage Res. 2019, 187, 85–91. [Google Scholar] [CrossRef]
  36. Hong, S.; Gan, P.; Chen, A. Environmental controls on soil pH in planted forest and its response to nitrogen deposition. Environ. Res. 2019, 172, 159–165. [Google Scholar] [CrossRef] [PubMed]
  37. Xie, H.; Tang, Y.; Yu, M.; Wang, G.G. The effects of afforestation tree species mixing on soil organic carbon stock, nutrients accumulation, and understory vegetation diversity on reclaimed coastal lands in Eastern China. Glob. Ecol. Conserv. 2021, 26, e01478. [Google Scholar] [CrossRef]
  38. Huang, C.; Zeng, Y.; Wang, L.; Wang, S. Responses of soil nutrients to vegetation restoration in China. Reg. Environ. Chang. 2020, 20, 82. [Google Scholar] [CrossRef]
  39. Wu, J.; Wang, H.; Li, G.; Ma, W.; Wu, J.; Gong, Y.; Xu, G. Vegetation degradation impacts soil nutrients and enzyme activities in wet meadow on the Qinghai-Tibet Plateau. Sci. Rep. 2020, 10, 21271. [Google Scholar] [CrossRef]
  40. Wu, Y.T.; Gutknecht, J.; Nadrowski, K.; Geißler, C.; Kühn, P.; Scholten, T.; Both, S.; Erfmeier, A.; Böhnke, M.; Bruelheide, H.; et al. Relationships between soil microorganisms, plant communities, and soil characteristics in Chinese subtropical forests. Ecosystems 2012, 15, 624–636. [Google Scholar] [CrossRef]
  41. Tian, W.; Xiang, X.; Ma, L.; Evers, S.; Wang, R.; Qiu, X.; Wang, H. Rare species shift the structure of bacterial communities across Sphagnum compartments in a subalpine Peatland. Front. Microbiol. 2020, 10, 3138. [Google Scholar] [CrossRef]
  42. Cheng, X.; Yun, Y.; Wang, H.; Ma, L.; Tian, W.; Man, B.; Liu, C. Contrasting bacterial communities and their assembly processes in karst soils under different land use. Sci. Total. Environ. 2021, 751, 142263. [Google Scholar] [CrossRef]
  43. Yang, Q.Y. Soil Microbial Community and Functional Response to Vegetation Succession under Rocky Desertification Conditions in Different Plant Types; Nanjing University of Information Science and Technology: Nanjing, China, 2022. [Google Scholar]
  44. Chen, L.; Song, T.Q.; Wang, H. Soil bacterial diversity and optimal sampling number in a karst evergreen and deciduous broad-leaved mixed forest. Acta Ecol. Sin. 2019, 39, 3287–3296. [Google Scholar]
  45. Wang, R.; Zhang, H.; Sun, L.; Qi, G.; Chen, S.; Zhao, X. Microbial community composition is related to soil biological and chemical properties and bacterial wilt outbreak. Sci. Rep. 2017, 7, 343. [Google Scholar] [CrossRef] [PubMed]
  46. Martínez-García, L.B.; Pugnaire, F.I. Arbuscular mycorrhizal fungi host preference and site effects in two plant species in a semiarid environment. Appl. Soil Ecol. 2011, 48, 313–317. [Google Scholar] [CrossRef]
  47. Si, B.; Yao, X.H.; Ren, H.D.; Li, S.; He, B.H. Species composition and diversity in the process of natural succession of karst vegetation in central Guizhou: Case study of puding country in Guizhou. For. Res. 2008, 21, 669–674. [Google Scholar]
  48. Egidi, E.; Delgado-Baquerizo, M.; Plett, J.M.; Wang, J.; Eldridge, D.J.; Bardgett, R.D.; Maestre, F.T.; Singh, B.K. A few Ascomycota taxa dominate soil fungal communities worldwide. Nat. Commun. 2019, 10, 2369. [Google Scholar] [CrossRef] [PubMed]
  49. Zhang, Y.; Zhang, C.; Wang, Z.; Chen, Y.; Gang, C.; An, R.; Li, J. Vegetation dynamics and its driving forces from climate change and human activities in the Three-River Source Region, China from 1982 to 2012. Sci. Total. Environ. 2016, 563–564, 210–220. [Google Scholar] [CrossRef]
  50. Liu, B.; Chen, C.; Lian, Y.; Chen, J.; Chen, X. Long-term change of wet and dry climatic conditions in the southwest karst area of China. Glob. Planet. Chang. 2015, 127, 1–11. [Google Scholar] [CrossRef]
  51. Peura, S.; Bertilsson, S.; Jones, R.I.; Eiler, A. Resistant microbial cooccurrence patterns inferred by network topology. Appl. Environ. Microbiol. 2015, 81, 2090–2097. [Google Scholar] [CrossRef]
  52. Morriën, E.; Hannula, S.E.; Snoek, L.B.; Helmsing, N.R.; Zweers, H.; de Hollander, M.; Soto, R.L.; Bouffaud, M.-L.; Buée, M.; Dimmers, W.; et al. Soil networks become more connected and take up more carbon as nature restoration progresses. Nat. Commun. 2017, 8, 14349. [Google Scholar] [CrossRef]
  53. Jiao, S.; Yang, Y.; Xu, Y.; Zhang, J.; Lu, Y. Balance between community assembly processes mediates species coexistence in ag-ricultural soil microbiomes across eastern China. ISME J. 2020, 14, 202–216. [Google Scholar] [CrossRef]
  54. Liu, H.; Huang, X.; Tan, W.; Di, H.; Xu, J.; Li, Y. High manure load reduces bacterial diversity and network complexity in a paddy soil under crop rotations. Soil Ecol. Lett. 2020, 2, 104–119. [Google Scholar] [CrossRef]
  55. Berry, D.; Widder, S. Deciphering microbial interactions and detecting keystone species with co-occurrence networks. Front. Microbiol. 2014, 5, 219. [Google Scholar] [CrossRef] [PubMed]
  56. Gou, Q.; Zhu, Q. Response of deep soil moisture to different vegetation types in the Loess Plateau of northern Shannxi, China. Sci. Rep. 2021, 11, 15098. [Google Scholar] [CrossRef] [PubMed]
  57. Sardans, J.; Vallicrosa, H.; Zuccarini, P.; Farré-Armengol, G.; Fernández-Martínez, M.; Peguero, G.; Gargallo-Garriga, A.; Ciais, P.; Janssens, I.A.; Obersteiner, M.; et al. Empirical support for the biogeochemical niche hypothesis in forest trees. Nat. Ecol. Evol. 2021, 5, 184–194. [Google Scholar] [CrossRef] [PubMed]
  58. Erb, K.-H.; Fetzel, T.; Plutzar, C.; Kastner, T.; Lauk, C.; Mayer, A.; Niedertscheider, M.; Körner, C.; Haberl, H. Biomass turnover time in terrestrial ecosystems halved by land use. Nat. Geosci. 2016, 9, 674–678. [Google Scholar] [CrossRef]
  59. Deltedesco, E.; Keiblinger, K.M.; Piepho, H.P.; Antonielli, L.; Poetsch, E.M.; Zechmeister-Boltenstern, S.; Gorfer, M. Soil mi-crobial community structure and function mainly respond to indirect effects in a multifactorial climate manipulation experiment. Soil Biol. Biochem. 2020, 142, 107704. [Google Scholar] [CrossRef]
  60. Genre, A.; Lanfranco, L.; Perotto, S.; Bonfante, P. Unique and common traits in mycorrhizal symbioses. Nat. Rev. Microbiol. 2020, 18, 649–660. [Google Scholar] [CrossRef]
  61. Bastida, F.; Eldridge, D.J.; García, C.; Kenny Png, G.; Bardgett, R.D.; Delgado-Baquerizo, M. Soil microbial diversity–biomass relationships are driven by soil carbon content across global biomes. ISME J. 2021, 15, 2081–2091. [Google Scholar] [CrossRef]
  62. Silva, L.C.R.; Lambers, H. Soil-plant-atmosphere interactions: Structure, function, and predictive scaling for climate change mitigation. Plant Soil 2020, 461, 5–27. [Google Scholar] [CrossRef]
  63. Zhalnina, K.; Dias, R.; De Quadros, P.D.; Davis-Richardson, A.; Camargo, F.A.O.; Clark, I.M.; McGrath, S.P.; Hirsch, P.R.; Triplett, E.W. Soil pH determines microbial diversity and composition in the park grass experiment. Microb. Ecol. 2014, 69, 395–406. [Google Scholar] [CrossRef]
  64. Devi, A.S. Influence of trees and associated variables on soil organic carbon: A review. J. Ecol. Environ. 2021, 45, 5. [Google Scholar] [CrossRef]
Figure 1. Relative abundances of bacteria (a) and fungi (b) at the phylum level were examined separately in forested and unforested areas.
Forests 14 02370 g001
Figure 2. Variations in the (a) Shannon index, (b) Patrick index, and (c) Pielou index across forested and unforested areas of the bacteria. Variations in the (d) Shannon index, (e) Patrick index, and (f) Pielou index across forested and unforested areas of fungal. CF: Pinus massoniana; BF: Toona sinensis; MF: Pinus massoniana–Betula luminifera; CK: unforested plot. The box and whisker plots show the median (center line), mean (cross), upper and lower quartiles (box limits), 1.5× the interquartile range (whiskers), and outliers (solid points). Individual data points are plotted in circles. Lowercase letters indicate substantial differences in the treatments at the 0.05 level, whereas the error bars represent SE (standard error).
Forests 14 02370 g002
Figure 3. Comparing bacterial (a) and fungi (b) community compositions across forested and unforested areas. The ordination analysis of the bacterial (c) and fungal (d) community: nonmetric multidimensional scaling (NMDS) in forested and unforested area. The canonical correlation analysis (CCA) of the bacterial (e) and fungal (f) community and variation partition analysis for significant influence factors. SOC: soil organic carbon; TP: total phosphorus; TN: total nitrogen; NH4+-N: ammonium–nitrogen; NO3-N: nitrate–nitrogen; AP: available phosphorous; pH: soil pH values; SBD: soil bulk density. CF: Pinus massoniana; BF: Toona sinensis; MF: Pinus massonianaBetula luminifera; CK: unforested plot. Lowercase letters indicate substantial differences in the treatments at the 0.05 level, whereas the error bars represent SE (standard error).
Forests 14 02370 g003
Figure 4. The microbial association networks where co-occurrence networks of (ad) bacterial and (eh) fungal of the size fractions of aggregates based on Spearman rank correlation coefficient matrices. Colored nodes indicate OTUs represented by phyla. An edge stands for a strong positive (Spearman ρ > 0.6) and significant (p < 0.01) correlation between the two nodes. For each network, the size of each node is proportional to the number of edges (degree). The size of a network for a size fraction is proportional to the size of the corresponding networking scope. The thickness of each edge is proportional to the correlation coefficient. The bar graphs were used to illustrate the topological properties employed in network analysis. These properties are intended to characterize the intricate patterns of interrelationships among operational taxonomic units (OTUs). Numbers (AH) in the bar chart correspond one-to-one with the numbers (ah) in the network diagram.
Forests 14 02370 g004
Figure 5. Average variation degree (AVD) of the bacterial (a) and fungi (b) communities in the different vegetation types. CF: Pinus massoniana; BF: Toona sinensis; MF: Pinus massonianaBetula luminifera; CK: unforested plot.
Forests 14 02370 g005
Table 1. The characteristics of the study site.
Dominant
Species
Elevation (m)Slope
(°)
Average Tree Height (m)Mean DBH (cm)Canopy DensityDensity
(plant/hm2)
CF4971517.116.70.931250
BF5402116.913.80.931316
MF4521816.621.80.771169
CK700130000
Note: CF: Pinus massoniana; BF: Toona sinensis; MF: Pinus massoniana–Betula luminifer; CK: unforested land.
Table 2. Soil physical properties in different afforestation patterns.
Different Afforestation ModesSoil Saturated Water Holding
Capacity (%)
Soil Capillary Water Holding
Capacity (%)
Soil Field Water Holding
Capacity (%)
Soil Bulk
Density (g/cm3)
CF10.73 ± 0.24 c10.15 ± 0.24 c9.60 ± 0.35 a1.52 ± 0.01 b
BF14.20 ± 0.15 b13.43 ± 0.39 b12.28 ± 0.14 a1.35 ± 0.01 c
MF12.42 ± 0.23 b11.23 ± 0.32 bc10.73 ± 0.21 a1.31 ± 0.03 c
CK28.34 ± 1.91 a23.58 ± 1.04 a11.85 ± 1.94 a1.70 ± 0.04 a
Note: The values are presented as mean ± standard error. Different letters indicate significant differences (p < 0.05) among the different types of treatment plots, as determined by a one-way ANOVA followed by LSD test. CF: Pinus massoniana; BF: Toona sinensis; MF: Pinus massoniana–Betula luminifera; CK: unforested plot.
Table 3. Soil chemical properties at different afforestation patterns.
Different Afforestation ModesSOC (g/kg)TP (g/kg)TN (g/kg)NH4+-N (mg/kg)NO3-N (mg/kg)AP (mg/kg)pH
CF23.57 ± 0.69 bc0.22 ± 0.00 b1.26 ± 0.06 bc34.98 ± 3.21 b10.08 ± 0.58 b0.64 ± 0.14 b5.48 ± 0.04 b
BF43.90 ± 1.68 a0.30 ± 0.01 a2.07 ± 0.05 a38.96 ± 2.33 a10.28 ± 0.13 b0.78 ± 0.01 ab5.73 ± 0.03 a
MF43.83 ± 1.64 a0.31 ± 0.01 a2.05 ± 0.13 a41.51 ± 0.95 a9.59 ± 1.33 b0.82 ± 0.07 a5.72 ± 0.06 a
CK20.40 ± 0.42 c0.27 ± 0.01 a1.13 ± 0.02 c27.15 ± 3.51 b12.93 ± 0.52 a0.88 ± 0.02 a5.78 ± 0.06 a
Note: The values are presented as mean ± standard error. Different letters indicate significant differences (p < 0.05) among the different types of treatment plots types, as determined based on a one-way ANOVA followed by LSD test. A one-way ANOVA followed by an LSD test. SOC: soil organic carbon; TP: total phosphorus; TN: total nitrogen; NH4+-N: ammonium–nitrogen; NO3-N: nitrate–nitrogen; AP: available phosphorous. CF: Pinus massoniana; BF: Toona sinensis; MF: Pinus massoniana–Betula luminifera; CK: unforested plot.
Table 4. Correlation of soil bacterial and fungal communities with physico-chemical properties.
BacteriaFungi
Soil PropertiesR2p-ValueR2p-Value
TP (g/kg)0.5920.0050.5310.019
SOC (g/kg)0.8910.0010.6660.004
NH4+-N (mg/kg)0.6390.0010.5170.019
NO3N (mg/kg)0.3070.1040.1060.517
TN (g/kg)0.8590.0010.6420.005
AP (mg/kg)0.2570.1480.3730.060
pH0.7920.0020.8830.001
SBD (g/cm3)0.7460.0010.2890.126
Note: SOC: soil organic carbon; TP: total phosphorus; TN: total nitrogen; NH4+-N: ammonium–nitrogen; NO3-N: nitrate–nitrogen; AP: available phosphorous; pH: soil pH values; SBD: soil bulk density.
Disclaimer/Publisher’s Note: The statements, opinions and data contained in all publications are solely those of the individual author(s) and contributor(s) and not of MDPI and/or the editor(s). MDPI and/or the editor(s) disclaim responsibility for any injury to people or property resulting from any ideas, methods, instructions or products referred to in the content.

