Article

Demand-Led Optimization of Urban Park Services

College of Landscape Architecture, Zhejiang Agriculture and Forestry University, Hangzhou 311300, China
*
Author to whom correspondence should be addressed.
These authors contributed equally to this work.
Forests 2023, 14(12), 2371; https://doi.org/10.3390/f14122371
Submission received: 8 November 2023 / Revised: 26 November 2023 / Accepted: 30 November 2023 / Published: 4 December 2023
(This article belongs to the Section Urban Forestry)

Abstract

:
As the demand for cultural and recreational services grows, the mismatch between the supply and demand of park services significantly affects residents’ well-being. Optimizing the spatial layout of park services is a focal point of urban park and green space research. Taking Hangzhou, Zhejiang Province, as a case study, this research analyzes the spatial patterns and balance of park service supply and demand. Utilizing the Grey Wolf Optimization Model optimized by the K-Nearest Neighbor Model (GWO-KNN), this study proposes construction objectives for optimizing park services. The results indicate the following: (1) significant differences exist in the park service demands of residents in different residential environments; (2) there is a noticeable spatial disparity in park service supply among various residential areas with an overall positive correlation between park service supply levels and resident demands, yet an imbalance exists; (3) this study categorizes spatial types into low-service coordination, high-service coordination, low-service imbalance, and high-service imbalance; (4) the GWO-KNN Model is applied with optimization objectives being the innovative aspect of this study. Strategies for each park category are proposed: emphasizing suburban park construction by utilizing surrounding green resources and adding diverse facilities; introducing facilities friendly to vulnerable groups to meet the needs of diverse populations; enhancing the complementary advantages between “new” and “old” cities by moderately increasing park sizes and improving cultural and facility development levels; optimizing spatial structure with limited land resources to construct an urban park network system. This study aims to provide theoretical and technical support for optimizing urban park and green space systems.

1. Introduction

As the demand for high-intensity recreational activities among the populace continues to grow, urban parks, serving as pivotal venues for such activities, are finding it increasingly challenging to meet ever-expanding social needs [1,2]. Against the backdrop of high-quality existing development models, urban parks confront a significant dilemma in balancing residents’ demand for daily recreational spaces and the supply of park services. The achievement of harmonious park layouts is particularly complex. Starting from the perspective of resident needs, the quantitative examination of the park supply–demand relationship and the optimization of parks are of paramount importance in enhancing residents’ well-being [3,4,5]. Therefore, investigating the disparities in residents’ access to park services in different residential environments, analyzing the spatial alignment of park supply and demand, and enhancing the distribution and quality of park spaces are crucial focal points for future research.
With the improvement of residents’ living standards, research on the level of park supply has gained increasing attention. Evaluating the level of park services is a crucial means of assessing the extent to which residents access park provisions [6,7,8,9]. Traditionally, measurements of park service levels have primarily relied on physical attributes such as park area, quantity, per capita park area, and vegetation coverage and nonmaterial attributes like accessibility within a certain travel threshold [10,11,12,13,14,15,16]. However, these approaches tend to overlook the impact of park-specific characteristics [17,18]. A promising direction for future research involves evaluating park quality within the travel threshold by combining accessibility with the physical attributes of parks. Park audit tools offer a comprehensive method for assessing park quality [19]. However, these tools have often relied on on-site surveys in individual parks, and assessing park service levels at a large scale remains a challenging aspect of existing research. This study focuses on all parks in the main urban area of Hangzhou. Given the numerous and large-scale parks in the area, traditional on-site surveys to gather park information are time-consuming and labor-intensive. POI data can overcome the problem of difficult data access. While China’s POI data includes all kinds of park-attributed data such as those on sports and amenities in addition to location information, POI data can better replace field research. So, this study overcomes limitations on data acquisition by utilizing Point of Interest (POI) data related to park attributes. By calculating the cumulative quality of parks accessible within a specified travel threshold, we analyze park service levels. This breakthrough in data collection provides a practical foundation for evaluating park service levels on a larger scale.
Both domestic and international research communities have increasingly emphasized the study of the park supply–demand relationship, with the level of park service demand serving as a pivotal factor influencing the optimization of park service provision [2,20,21,22]. Presently, park demand has not received adequate measurement and exploration. Park studies often overlook the measurement of demand or solely rely on demographic factors, such as population quantity, population density, population composition, and per capita green space area, to assess demand [23,24,25,26]. This approach overlooks the analysis of demand disparities among diverse residential population groups. Some scholars argue that housing prices are a significant indicator of residents’ economic status [27,28], and indicators like plot ratios, per capita residential green space area, and population quantity reflect the environmental quality and the extent to which green spaces meet the needs of residential areas [29,30,31,32]. Furthermore, high-precision big data analytical methods at the residential area scale can enhance research accuracy [33]. Therefore, adopting residential areas as the assessment scale and selecting four indicators, namely housing prices, per capita residential green space area, plot ratios, and population quantity, for a comprehensive evaluation of residential area quality, provides a more practical metric for measuring residents’ park service demand levels. This approach facilitates a more accurate analysis of the relationship between the diverse demands of residential populations and park service provisions.
Based on the measurement of park service supply and demand levels, the analysis of the alignment between park service levels and demand and the exploration of heterogeneity in areas with misaligned supply and demand, enhancing spatial coordination in park service levels is a core challenge and a critical factor in improving residents’ well-being. Research on park optimization primarily focuses on three major aspects: park quantity and distribution, spatial layout, and quality level improvement [21,32,34,35]. Regarding spatial layout, some scholars have used park Point of Interest (POI) data and employed methods like the Particle Swarm Optimization algorithm, Spatial Syntax, and Location-Allocation Models to assess the spatial location layout of parks and propose optimization strategies [34,36,37,38,39]. However, these methods do not adequately consider the heterogeneity in park quality and resident demand. Concerning park quality levels, most studies have focused on individual parks, primarily focusing on assessment, with limited exploration of strategies to enhance park quality [40,41,42]. This study focuses on and faces the challenge of comprehensively considering resident demands and park service supply, with the aim of optimizing areas with poor supply–demand alignment and proposing a rational park service layout. In this research, we intend to utilize machine learning-related optimization algorithms, with supply–demand mismatch areas as sample data, to optimize cross-over areas with supply-demand misalignment and determine the optimal park service level. Intelligent optimization algorithms are heuristic algorithms inspired by human intelligence, social behavior in biological populations, or natural laws, aiming to find optimal or near-optimal solutions based on rigorous theoretical foundations [43]. Commonly used intelligent optimization algorithms include Genetic algorithms, Simulated Annealing, Taboo Search, Particle Swarm Optimization, Ant Colony Optimization, and Grey Wolf Optimization, among others [44,45,46,47]. Among these, in cases of high complexity, the Grey Wolf Optimization algorithm exhibits greater generality and precision compared to other optimization methods. When combined with the K-Nearest Neighbors (KNN) algorithm based on predictive classifiers for data classification, it searches for the closest-neighbor values to find the optimal solution. The effectiveness of the optimization process will be validated through experimental sample data, ensuring the effectiveness of the prediction process. Therefore, in our pursuit of optimizing park service levels, this study employs the Grey Wolf Optimization-KNN (GWO-KNN) algorithm to optimize park supply–demand alignment, offering valuable insights for planning [48].
This study delves into the equilibrium between residents’ park service demand and the supply of park service levels, with the aim of quantitatively defining optimization objectives for park service levels to enhance residents’ well-being. It seeks to address the following questions: (1) How can we measure park service levels and residents’ demands? (2) Is there spatial alignment between the supply and demand of park services? (3) Based on residents’ needs, how can park service levels be optimized? The findings of this research will not only contribute to park optimization but will also outline an assessment framework for park service supply and demand, along with optimization strategies. This will serve as a scientific foundation for the development of harmonious, equitable, and sustainable urban park green spaces.

2. Study Area and Date Sources

2.1. Study Area

Hangzhou, as one of China’s major cities, boasts a developed socio-economic landscape and high levels of urban development. The residents’ growing demand for a high-quality life is increasingly evident. Urban parks, serving as crucial conduits for elevating residents’ quality of life, hold a significant position in Hangzhou’s urban development. As the residential spaces in Hangzhou continue to expand, the issue of coordinating residents’ green space service demands with park provisions has become pronounced. This study focuses on the primary urban areas of Hangzhou where residential concentrations are notable. It encompasses eight administrative districts, namely, Binjiang, Gongshu, Shangcheng, Xiaoshan, Xihu, Yuhang, Linping, and Qiantang, covering a total area of approximately 3365 km2. The total area of parks in this region amounts to approximately 180 km2. Parks are primarily characterized by small-scale patches and point-shaped parks, which include recreational parks, community parks, and riverfront green spaces. In addition, there are large-scale area-based parks such as the West Lake Scenic Area, Xixi National Wetland Park, Lingshan Scenic Area, Wuchaoshan National Forest Park, and Linping Park, among others. The spatial pattern of parks in this region generally exhibits a larger park area in the southwest and a higher number of green spaces in the northeast (Figure 1).

2.2. Date Sources and Processing

This research employs multi-source big data to investigate park service levels, park service demands, and park optimization. Data sources include the following. (1) Park space information: Park Area of Interest (AOI) data were derived from the 2022 Amap (high-precision digital map services), and they were further verified using satellite remote sensing data. The total park area is approximately 180 km2. Basic infrastructure Points of Interest (POI) data within parks were collected from the 2022 Amap open platform. (2) Residential community space information: Housing data were collected from the 2022 Anjuke housing transaction website (https://www.openstreetmap.org/, accessed on 11 July 2022) and included coordinates, housing prices, green coverage ratio, plot ratio, construction year, and the number of households in each community. After filtering out incomplete information, a total of 4875 residential community POIs were retained. The residential AOI data were obtained from Amap (https://lbs.amap.com/, accessed on 11 July 2022) and cross-verified with the POI data. The residential population data were calculated by multiplying the number of households in the housing area and the per-household population in the seventh census data. They were collated with the seventh census data and had reasonable errors, verifying the validity of the data. (3) Travel and transportation information: Road network data were acquired from OpenStreetMap (https://www.openstreetmap.org/, accessed on 11 July 2022) to understand the distribution of road networks within the research area. All data in this study are represented in the WGS 1984 UTM Zone 50N coordinate system. To facilitate computation, spatial information for residential communities and parks was aggregated into 1 km × 1 km grids.

3. Methods

To delve into the equilibrium between residents’ demand for park services and the supply of park service levels, an analysis of park attributes for various supply and demand spatial matching types was conducted. Based on the high degree of coordination in park service levels, the GWO-KNN Model was employed to quantitatively propose optimization objectives for park service levels. Ultimately, this study presents urban park planning recommendations and policy insights (Figure 2).

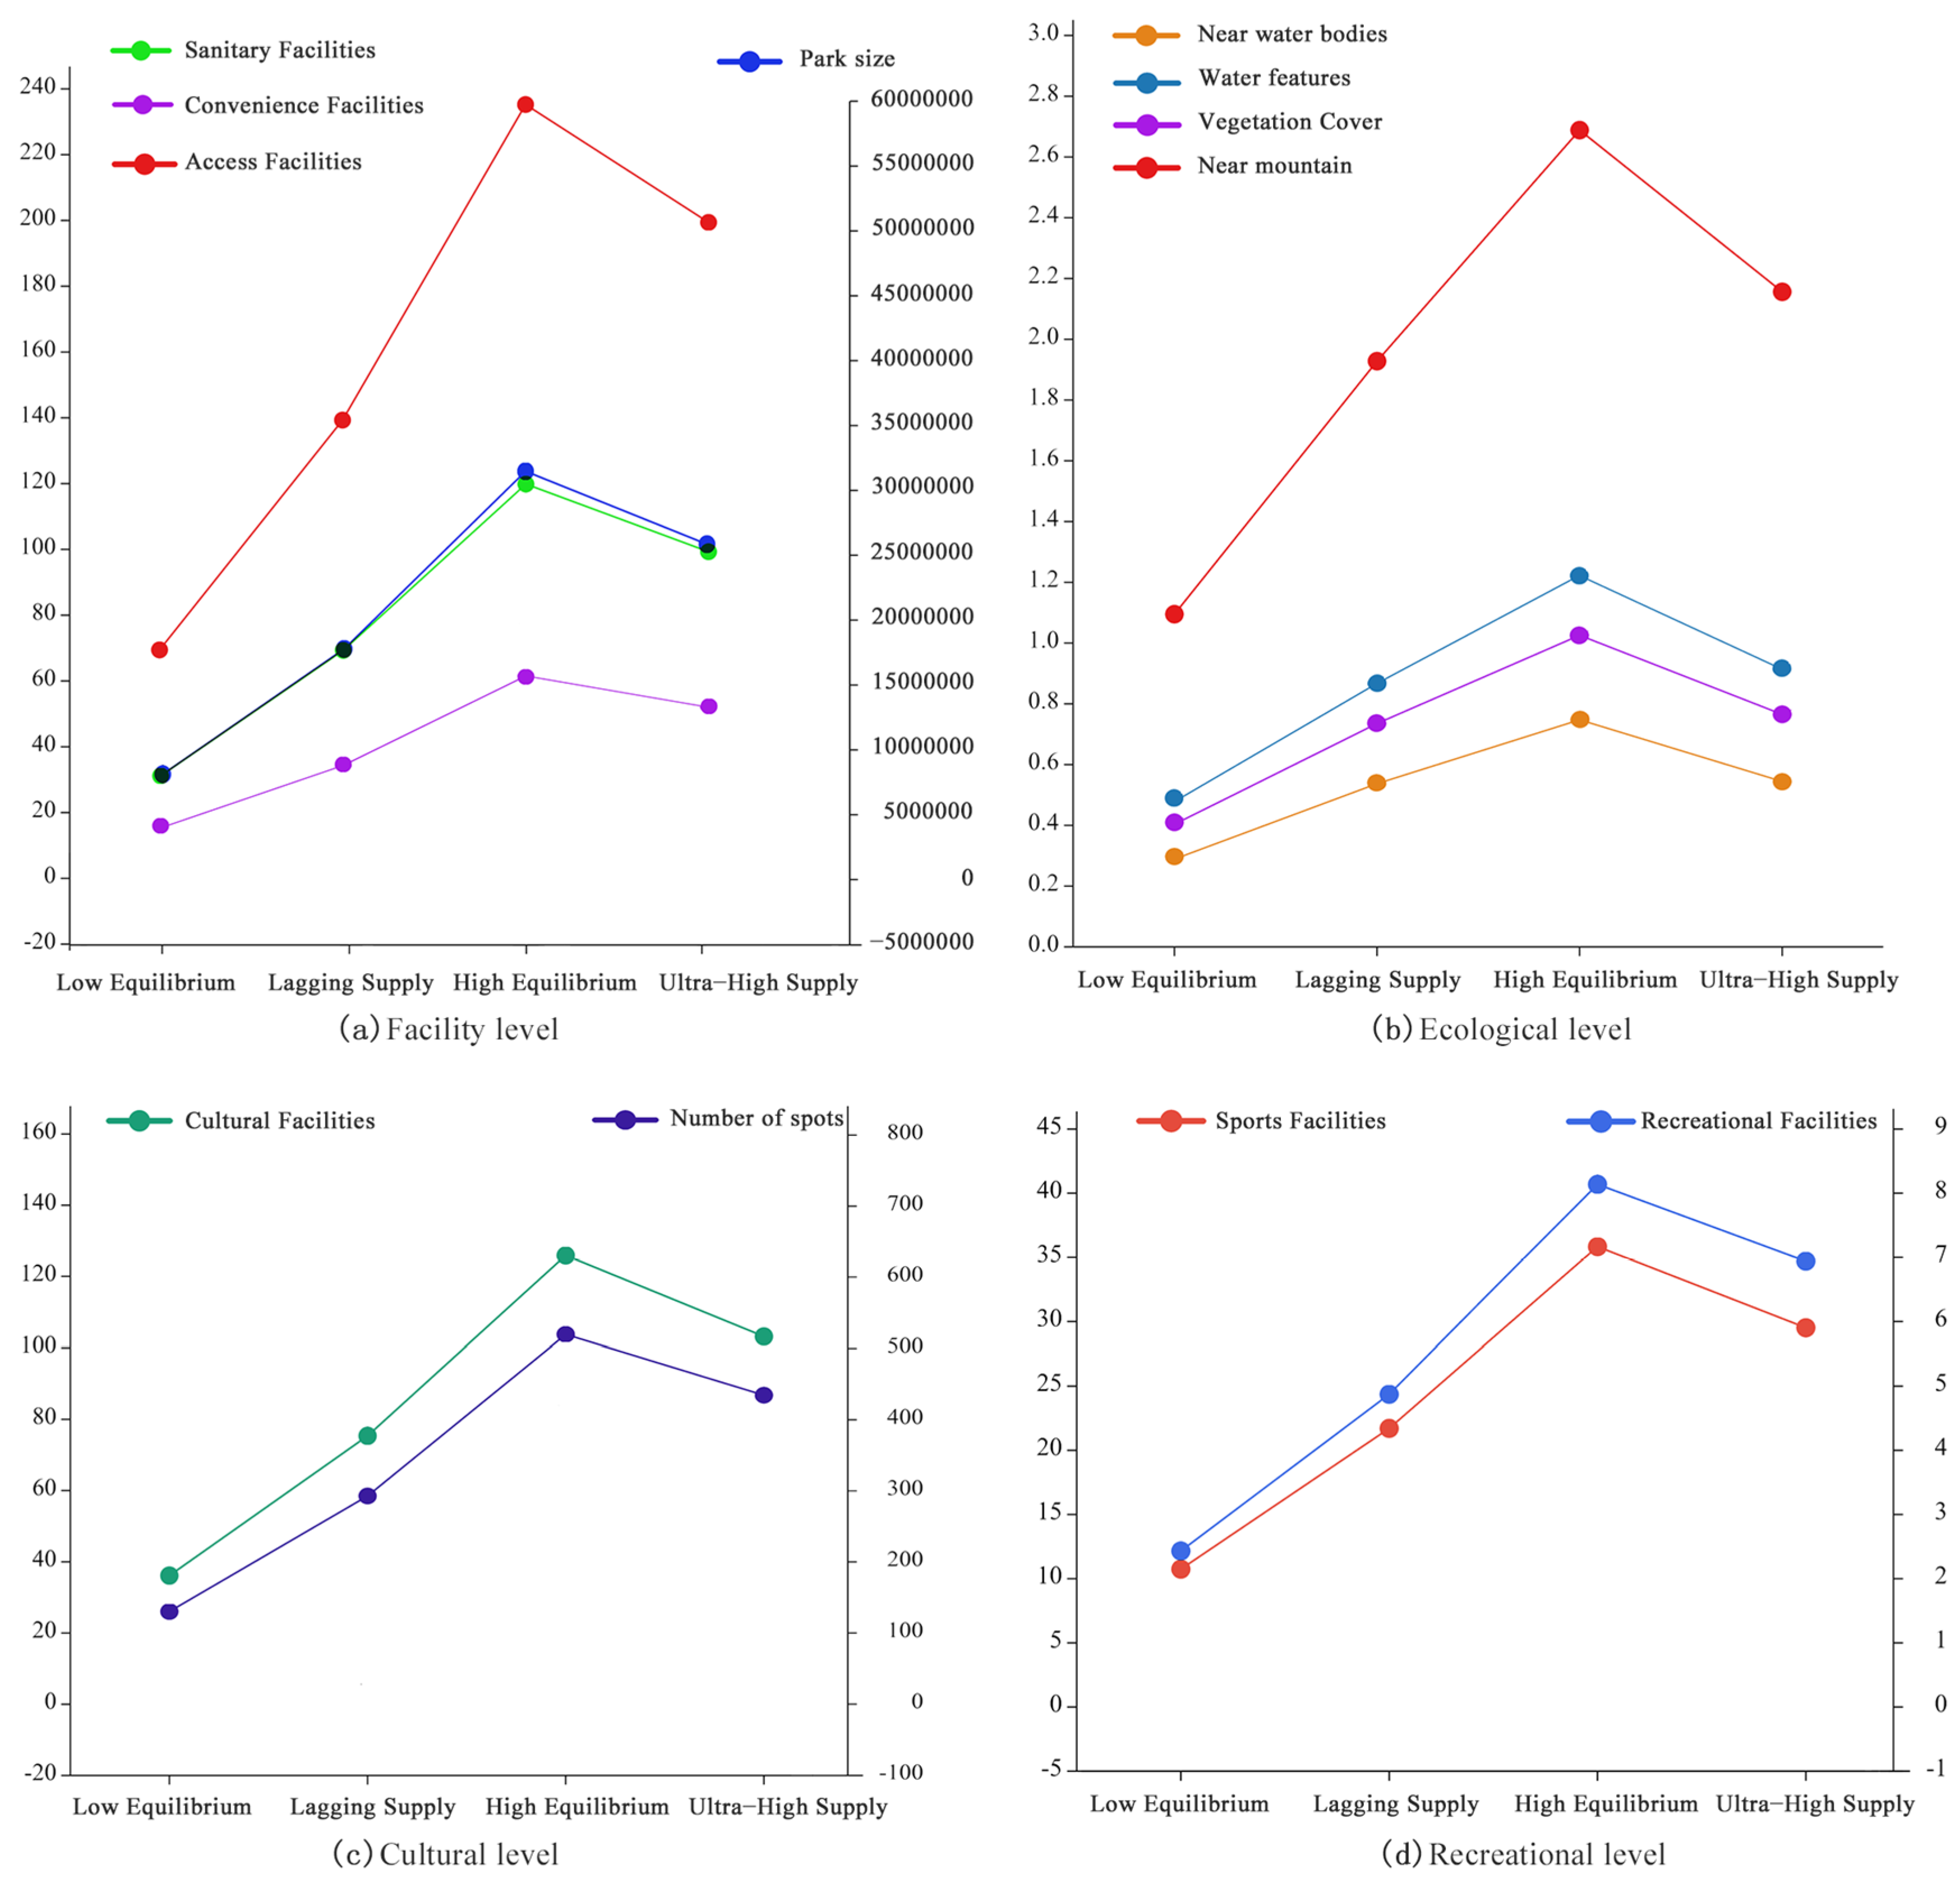
3.1. Evaluation of Park Service Levels

The measurement of park service levels reflects residents’ access to park supply. The measurement standard for park service levels is based on the assessment of the quality of parks that residents can access within a certain travel threshold [49]. Regarding the travel time threshold, we referred to previous research [5,50] and used a 15-min cycling reach for parks with an area smaller than 10 hectares and a 30-min drive for parks with an area greater than 10 hectares. The evaluation system for park quality levels consisted of primary indicators such as recreation, ecology, culture, and facilities levels. Each primary indicator’s fundamental components formed secondary indicators, and their weights were determined using the entropy-weight method (Table 1). The entropy weight method is calculated using SPSSPRO (Zhongyan Technology Co., Ltd., Shanghai, China).
The entropy weight method is a technique that objectively assigns weights based on the variability of indicators. Analyzing the numerical values of each indicator and calculating weights can provide a foundation for evaluating park quality. The calculation formulas are as follows.
(1) Standardization: We used the range normalization method to standardize the original data without dimensionality, and then shifted the data. Suppose there are m parks and n evaluation indicators in this study, the formulas are as follows:
For   positive   indicators :   y i j = x i j x j m i n x j m a x x j m i n + 1
For   negative   indicators :   y i j = x j m a x x j m i n x i j x j m i n + 1
where i = 1, 2, …, m; j = 1, 2, …, n; y i j is the dimensionless standardized and shifted value; and xij is the original data value of the j-th indicator for the i-th park, while xjmax and xjmin are the maximum and minimum original values of the j-th indicator.
(2) Entropy weight determination: The weight determination formula using the entropy weight method is as follows:
p i j = y i j i = 1 m y i j
d j = 1 + 1 ln m × i = 1 m ( p i j × ln p i j )
w j = d j i = 1 n d j
where pij is the proportion of the j-th indicator value for the i-th park in the sum of all park values for that indicator, dj is the information entropy redundancy, and wj is the indicator weight.
The formula for calculating park quality levels is as follows:
S A j = i = 1 12 W i × S j i G
where: i (i = 1, 2, ..., 12) denotes the identifier for evaluation criteria, Wi represents the weight of criterion i, j (j = 1, 2, ..., 1825) represents the park number, and SjiG signifies the score of the Ai-th criterion for the j-th park.

3.2. Park Service Demand Evaluation

To better measure whether there is a balanced match between residents’ park service supply and demand, park service demand is an important component. In this study, we assessed residential demand by measuring the quality of residential areas. The higher the comprehensive evaluation result, the greater the park service demand. Combining existing research results, we selected indicators for evaluating residential quality. The evaluation system for residential area quality encompasses four aspects: residential population, housing prices, residential area floor area ratio (FAR), and per capita green space. We determined the weights of each criterion using the entropy method and calculated the comprehensive measurement of residential quality level (CAj) (Table 2). The entropy weight method is calculated using SPSSPRO (Zhongyan Technology Co., Ltd., Shanghai, China). The formula is as follows:
C A j = i = 1 4 W i × S j i R
where: i (i = 1, 2, 3, 4) denotes the identifier for evaluation criteria, Wi represents the weight of criterion i, j (j = 1, 2, ..., 4986) represents the residential area number, and SjiR signifies the score of the Ai-th criterion for the j-th residential area.

3.3. Coupling Coordination and Matching

The coupling coordination model serves as an effective tool for assessing the overall level of coordinated development in a region [51]. Analyzing the spatial matching and coupling coordination of park service supply and demand can provide a better foundation for optimizing park services. This section uses SPSSPRO (Zhongyan Technology Co., Ltd., Shanghai, China). Based on coupling coordination, we categorized the types of coordinated development using the following formula:
C = [ 1 ( U 2 U 1 ) 2 ] × U 1 U 2 = [ 1 ( U 1 U 2 ) ] × U 1 U 2
T = α 1 U 1 + α 2 U 2 , α 1 + α 2 = 1
D = C × T
where: C represents the degree of coupling, and Ui denotes the evaluation indices for park service levels and residential demand. The distribution range for both is (0, 1]. T stands for the comprehensive supply–demand evaluation index, and since park service levels and residential demand are equally important, we set T to 0.5. D signifies the coupling coordination degree with a value range of [0, 1].
We employed the z-score method to standardize and quadrant-match park service levels and residential demand, dividing the study area into different supply–demand matching types using the following formula:
x = x i x ¯ s
where: x represents the standardized comprehensive supply or demand quantity based on z-scores, xi is the supply or demand value for the i-th community, x ¯ denotes the mean, and s is the standard deviation.

3.4. Optimizing Park Service Levels: The GWO-KNN Model

Based on the results of park service supply and demand measurements, the core contents of this study are analyzing the matching degree between park service supply and demand, exploring differences in park supply and demand matching, and proposing optimization goals. The GWO-KNN Model is an intelligent optimization algorithm capable of classifying existing datasets in highly complex situations, matching the nearest values. The model was trained based on datasets with high park service supply and demand matching, after which datasets with mismatched supply and demand were optimized and the optimal solution with high coordination of park service supply and demand was obtained. The calculation formula is as follows:
(1)
K-Nearest Neighbor (KNN)
The KNN model utilizes the nearest neighbor set for analysis and is often used for handling parameters with unknown probabilities that are difficult to estimate. This includes classifiers for classifying individual data points into their nearest neighbor categories and regression for predictive processes [48,52].
y = argma x c j x i N k ( x ) I ( y i = c j ) , i = 1,2 , . . . , N ; j = 1,2 , . . . , K
where I is the indicator function and I equals 1 when yi = cj, otherwise it is 0. N is the number of instances in the neighborhood of x, cj is a particular category, and K is the number of instance categories.
(2)
Grey Wolf Optimization (GWO)
The Grey Wolf Optimization (GWO) algorithm mimics the leadership and hunting mechanisms of grey wolves. Grey wolves coordinate, hunt, and attack based on their social hierarchy, allocating hunting tasks to different wolf packs and ultimately achieving global optimization [44,48,53]. In GWO, the strongest leader is labeled as α and is responsible for the decision-making process in optimization. The other wolves are ranked as β, δ, and ω in descending order of leadership. α represents the best solution, β is the second-best, and ω is the least dominant wolf. The distance (D) between prey and wolves is calculated using the formula:
D = G M p ( k ) M ( k )
M ( k + 1 ) = M p ( k ) P D
where k represents the number of iterations, Mp(k) is the prey’s position after the k-th iteration (i.e., the best solution), and M(k) is the position of the wolves after the k-th iteration (i.e., potential solutions). P and G are coefficient factors in the following calculation:
P = 2 η r 1 η
G = 2 r 2
As the number of iterations increases, the value of η approaches zero linearly. r1 and r2 are random numbers between 0 and 1. The mathematical model for the hunting behavior of grey wolves is as follows:
D α = G 1 M α ( k ) M ( k ) D β = G 2 M β ( k ) M ( k ) D δ = G 3 M δ ( k ) M ( k )
M 1 = M α ( k ) P 1 D α M 2 = M β ( k ) P 2 D β M 3 = M δ ( k ) P 3 D δ
M p ( k + 1 ) = ( M 1 + M 2 + M 3 ) 3
where D α , D β , D δ , represent the distances between α, β, δ, and ω wolves (i.e., other individuals). These formulas ensure that the grey wolf population attains positions better than the initial ones. When the best position is found, the algorithm updates to this superior position, Mp.

4. Results

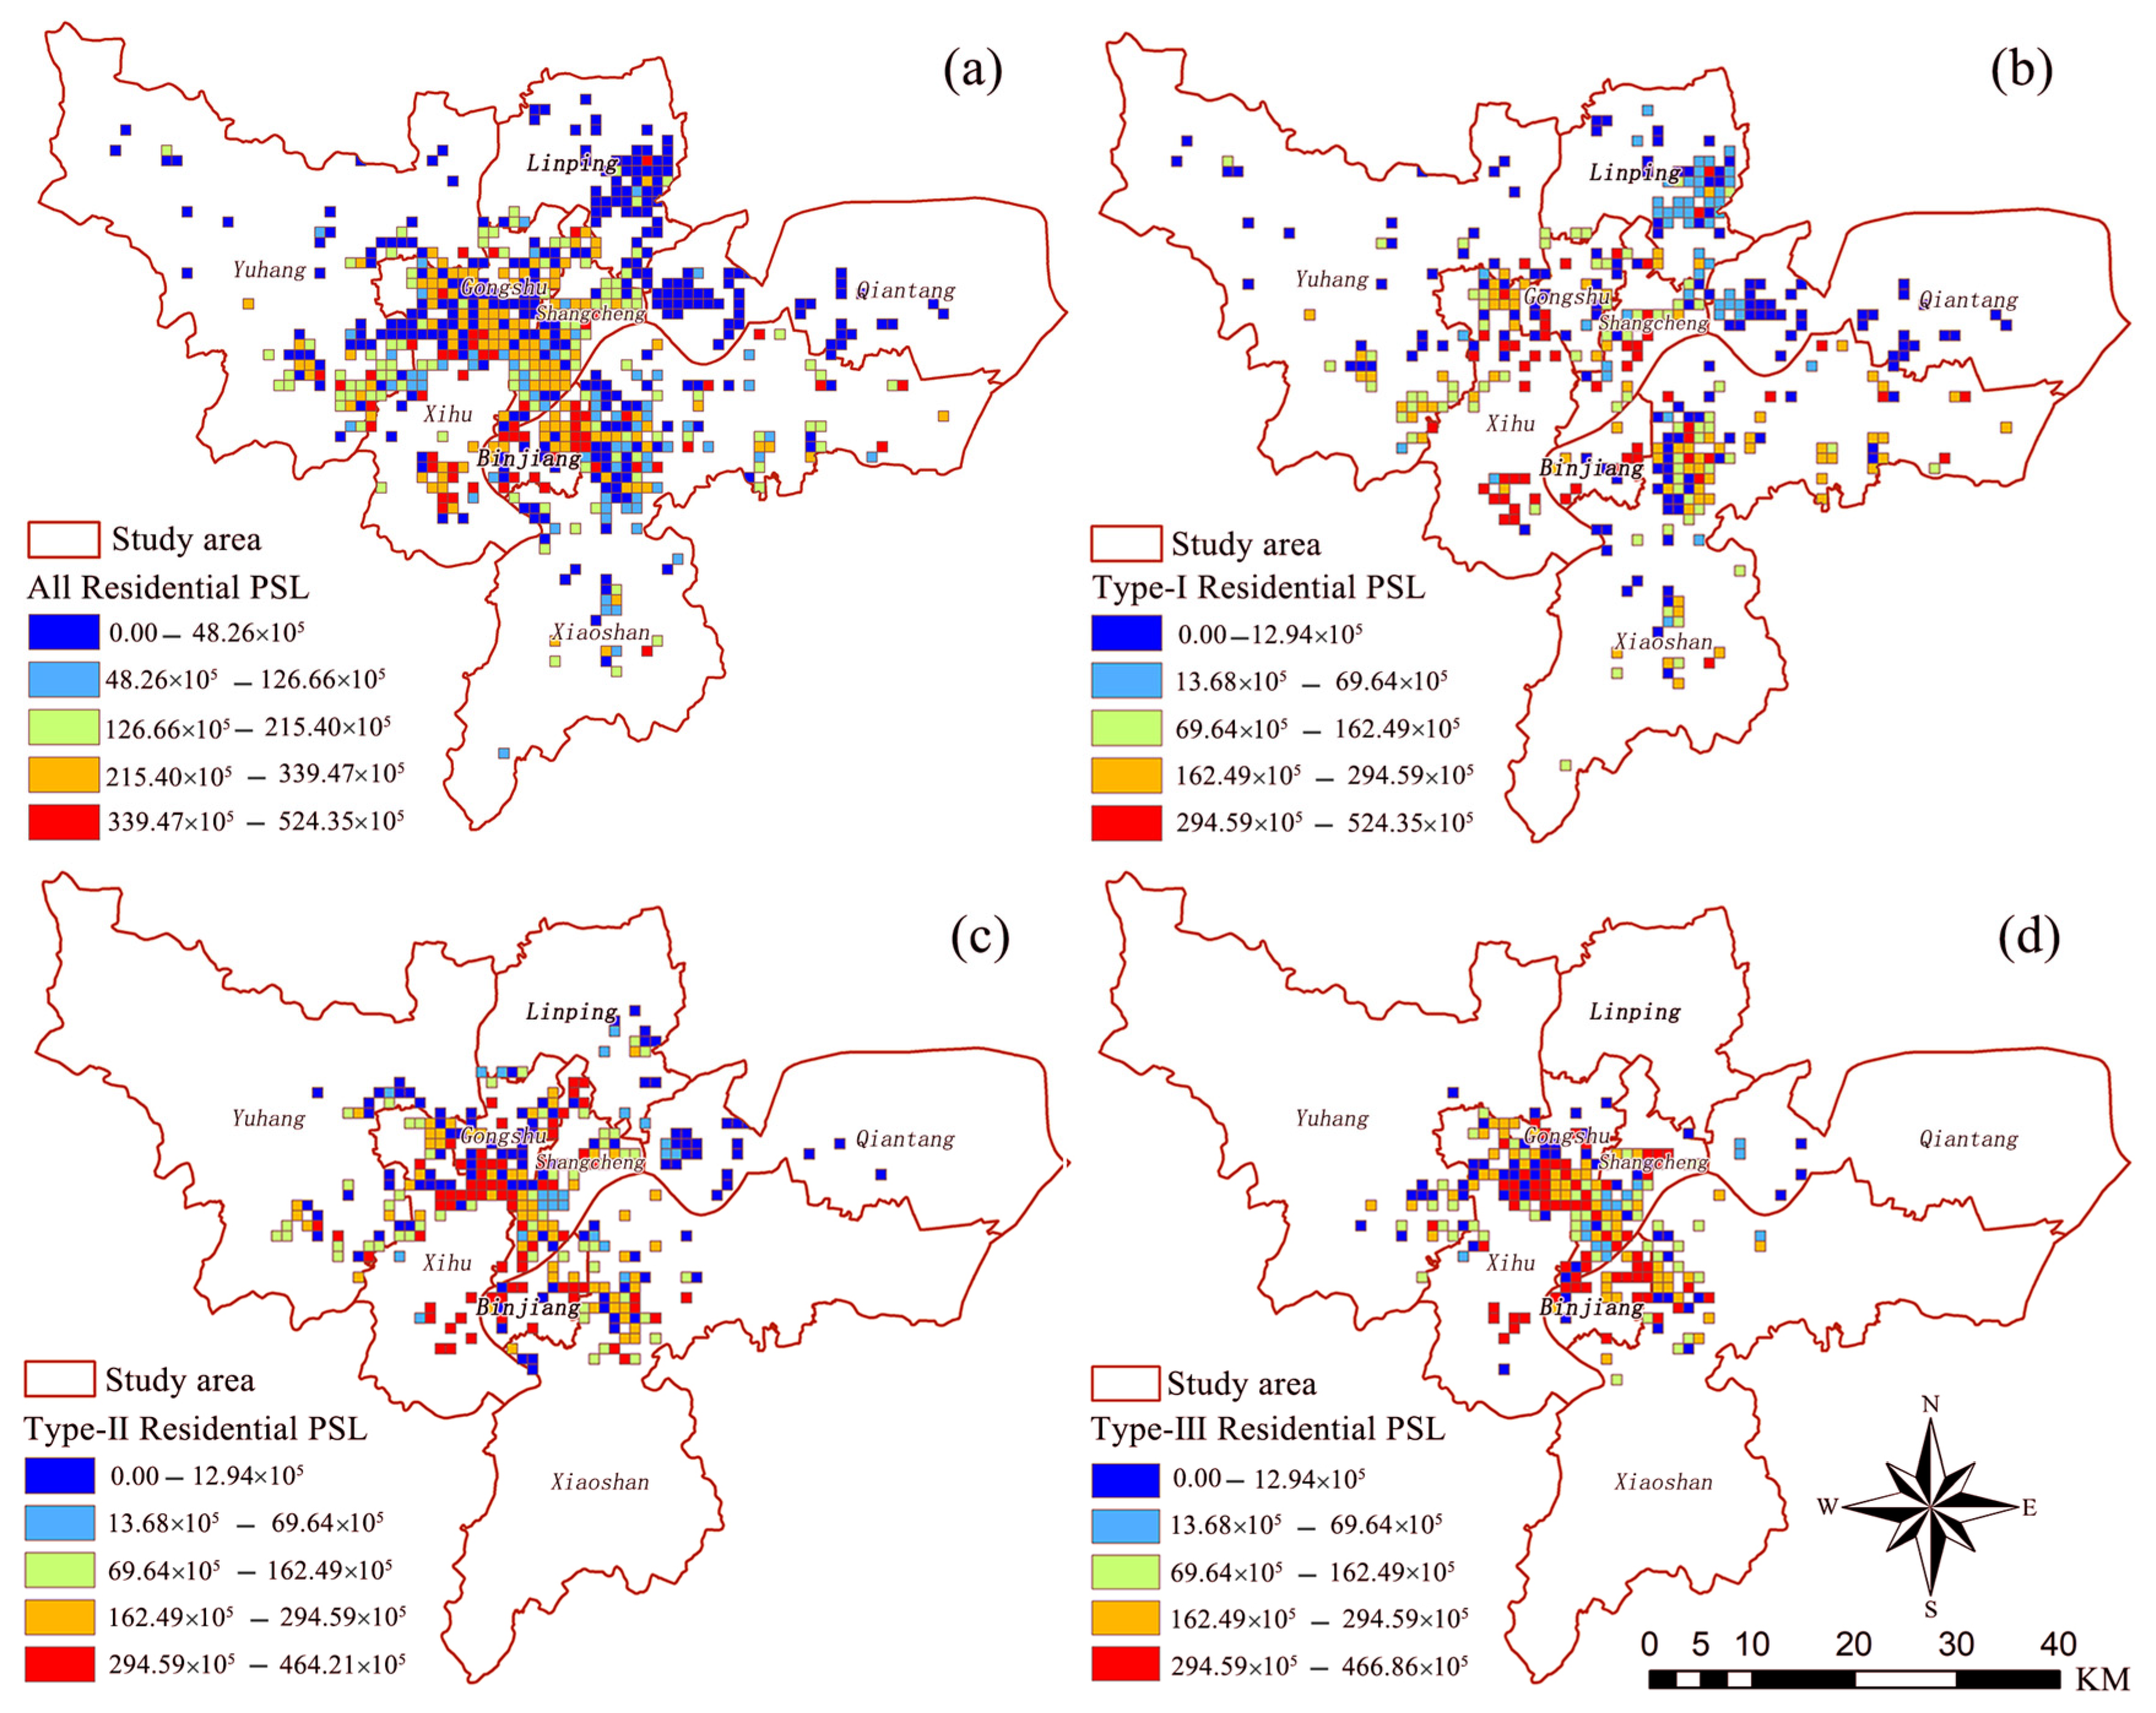
4.1. Analysis of Park Service Demand Levels

Within the framework of the residential quality evaluation system, the assessment of residential area quality was performed and the results were tabulated using a natural breakpoint method into 1 km × 1 km grid cells (Figure 3). The overall quality of residential areas exhibits a pattern that decreases from the core of the West Lake Scenic Area outward, with scattered high-value regions. By analyzing the spatial distribution characteristics of residential areas and considering the average residential quality (1.09 × 10⁴), residential areas were categorized into three classes. Low-quality residential areas were classified as Type I, relatively lower quality residential areas as Type II, and residential areas with moderate to high quality as Type III.
Type I residential areas are located primarily in the suburban and exurban regions, with a few in proximity to urban areas. These areas are characterized by lower property prices, higher population density, lower floor area ratios, smaller per capita green space, and longer distances from the West Lake Scenic Area. Within these areas, green facilities are insufficient to meet the demands of the densely populated residents, resulting in a higher demand for park green spaces. Type II residential areas are located around the core of the West Lake area, with a few in the suburban regions. They are characterized by higher property prices, greater population density, higher floor area ratios, larger per capita green space, and closer proximity to the West Lake Scenic Area. In this category of residential areas, space for green areas is limited due to land use restrictions. Consequently, there is a high demand for green space even though the space is limited. Type III residential areas are primarily located within the central urban areas around the core of the West Lake. Some are found in nearby urban areas. These areas feature higher property prices, greater floor area ratios, lower population density, and higher per capita green space. High-end villa communities in this category boast well-developed green facilities, which adequately satisfy the green space needs of their residents. In contrast, the older neighborhoods surrounding the West Lake Scenic Area face land constraints and high building densities, resulting in a significant demand for neighborhood parks and pocket parks to support daily resident activities.

4.2. Analysis of Park Service Supply Levels

The park service supply levels within the research area exhibit a pattern radiating outward from the core of the West Lake Scenic Area. The southwest and western areas have the highest service levels followed by the northwestern areas, marking a “core-edge” characteristic. A few high-service areas are scattered in the southeastern and northern parts of the central urban area. Based on the comprehensive evaluation of park service levels, an analysis of service levels specific to different types of residential areas was conducted (Figure 4). Type I residential areas generally have lower service levels compared to Type II and Type III areas, with most areas clustered at lower service levels. High-service areas are mainly located in the southeastern part near the West Lake area and around other large parks. Low-service clusters are primarily found in the northeastern suburban areas, with a smaller number in the southeastern suburban areas and the northwestern suburban areas. Medium-service levels are mainly concentrated in the northern and southeastern suburban areas. Type II residential areas have high-service areas concentrated in the northern part of the West Lake Scenic Area, the central urban area to the north, and the southwestern area along the Qiantang River. Low-service areas are mainly located in the northeastern suburban areas and the northwestern suburban areas, while medium-service areas are often clustered in the urban areas surrounding the West Lake Scenic Area. Type III residential areas generally enjoy higher service levels compared to Type I and Type II areas, indicating their advantage in terms of access to parks. In terms of spatial distribution, high-service areas are concentrated in the northern and southeastern parts of the central urban area, while low-service areas are predominant in the northwestern suburban areas. The medium-service areas are located in urban areas near the central urban area.

4.3. Analysis of Park Service Disparities in the Context of Supply and Demand Spatial Matching

Utilizing coupling coordination and spatial matching methods for analyzing the supply–demand relationship between residential needs and park service levels, we can further examine their spatial interconnection [54] as illustrated in Figure 5. Based on the coupling coordination analysis, Type I residential areas are predominantly characterized by coordinated development in the northeastern and southeastern suburban areas as well as excessive development in the southeastern and central suburban areas, with a small number of areas exhibiting imbalanced and declining development in the eastern suburban areas. Type II residential areas mainly show coordinated development in suburban areas with excessive development and imbalanced and declining development in the northern urban areas and a few suburban areas. Type III residential areas generally exhibit good overall coordination, with a small number of areas showing imbalanced and declining development in the northern urban areas and central urban areas. Regarding the spatial matching of supply and demand, Type I residential areas primarily display lagging Supply and low Equilibrium types. In Type II areas, there is a presence of lagging supply types in the northeastern and western urban areas, with predominating low equilibrium and lagging supply types. Type III areas exhibit significant differences in supply-demand spatial matching, with a dominance of Lagging Supply and High Equilibrium types.
Areas with Lagging Supply types are crucial for optimizing park service levels, and analyzing the spatial differences in the magnitudes of indicators for each spatial matching type is a prerequisite for enhancing the coordination of park service levels. The median values of primary and secondary indicators for each spatial matching type were statistically analyzed and presented in line charts and spatial distribution maps (Figure 6, Figure 7, Figure 8 and Figure 9). An analysis of the indicator values reveals consistent trends in primary indicator values (Figure 6 and Figure 7). In terms of Ecological Level B, the difference between Lagging Supply and Ultra-High supply types is relatively small. Among the secondary indicators, Leisure Level A, Educational Level C, and Facility Level D exhibit trends consistent with primary indicators. At the ecological level, Water Feature B1, Vegetation Coverage B2, Proximity to Near Water Bodies B4, and trends in secondary indicators are in line with primary indicators, with minimal differences between Lagging Supply and Ultra-High supply types. In the case of proximity to Near Mountain B3, Lagging Supply types only slightly surpass Low Equilibrium types. In summary, Lagging Supply types have lower values in primary indicators for Leisure A, Educational C, and Facility D as well as proximity to Near Mountain B3 when compared to Ultra-High supply types and High Equilibrium types. These results provide valuable insights for optimizing park service levels effectively.
As there are significant variations in the values of various indicators, it is essential to conduct an in-depth analysis of spatial heterogeneity to propose targeted optimization strategies. The results of these differences have been compiled in Figure 8 and Figure 9. Figure 8 reveals that, with the exception of Gongshu District that displays a relatively balanced Leisure Level A and a Lagging Supply type lower than other types in Yuhang District, the trend across other areas is generally “Ultra-High Supply type > High Equilibrium type > Lagging Supply type > Low Equilibrium type” for Leisure Level A. In terms of Ecological Level B, distribution is balanced in Gongshu and Shangcheng Districts. The ecological level of the Lagging Supply type is higher than that of other types in Binjiang District, indicating a high ecological quality. However, in Linping, Yuhang, and Xiaoshan districts, the ecological levels of the Lagging Supply type are lower than those of other types. For Educational Level C, Gongshu District displays a balanced distribution with Yuhang and Xiaoshan Districts exhibiting a lower level of the Lagging Supply type compared to other types. The spatial matching types and the quantity distribution trends in other areas are consistent, following the pattern of “Ultra-High Supply type > High-Level Equilibrium type > Lagging Supply type > Low-Level Equilibrium type.” When it comes to balanced areas, Facility Level D aligns with other primary indicators. However, in Yuhang, Xiaoshan, and Shangcheng Districts, the facility levels of the Lagging Supply type are lower than those of other types. In summary, within Gongshu District, all indicators of the Lagging Supply type are in a balanced state. In Yuhang and Xiaoshan Districts, the various indicators of the Lagging Supply type are lower than those of other types. Linping District exhibits a lower ecological level for the Lagging Supply type, while Shangcheng District shows a lower facility level for the Lagging Supply type. In other areas, the Lagging Supply type only surpasses the Low Equilibrium type.
Taking a closer look at the secondary indicators (Figure 9) within Leisure Level A, sports facilities A1 and recreational facilities A2 of the Lagging Supply type align with the trend of the primary indicators, both being lower than other types in Yuhang and Xiaoshan Districts. In Ecological Level B, Water Features B1, Vegetation Coverage B2, and Proximity to Near Mountain B3 of the Lagging Supply type follow the trend of the primary indicators and are lower than those of other types in Yuhang, Xiaoshan, and Linping Districts. However, in Proximity to Water Bodies B4, Linping District surpasses the Low-level Equilibrium type. In Educational Level C, the sizes of secondary indicators align with those of the primary indicators. In terms of Facility Level D, the scale of secondary indicators D1, access facilities D2, and sanitation facilities D3 for the Lagging Supply type is only lower than other types in Xiaoshan and Yuhang Districts. Convenience facilities for the Lagging Supply type in Binjiang District are also lower than those of other types.

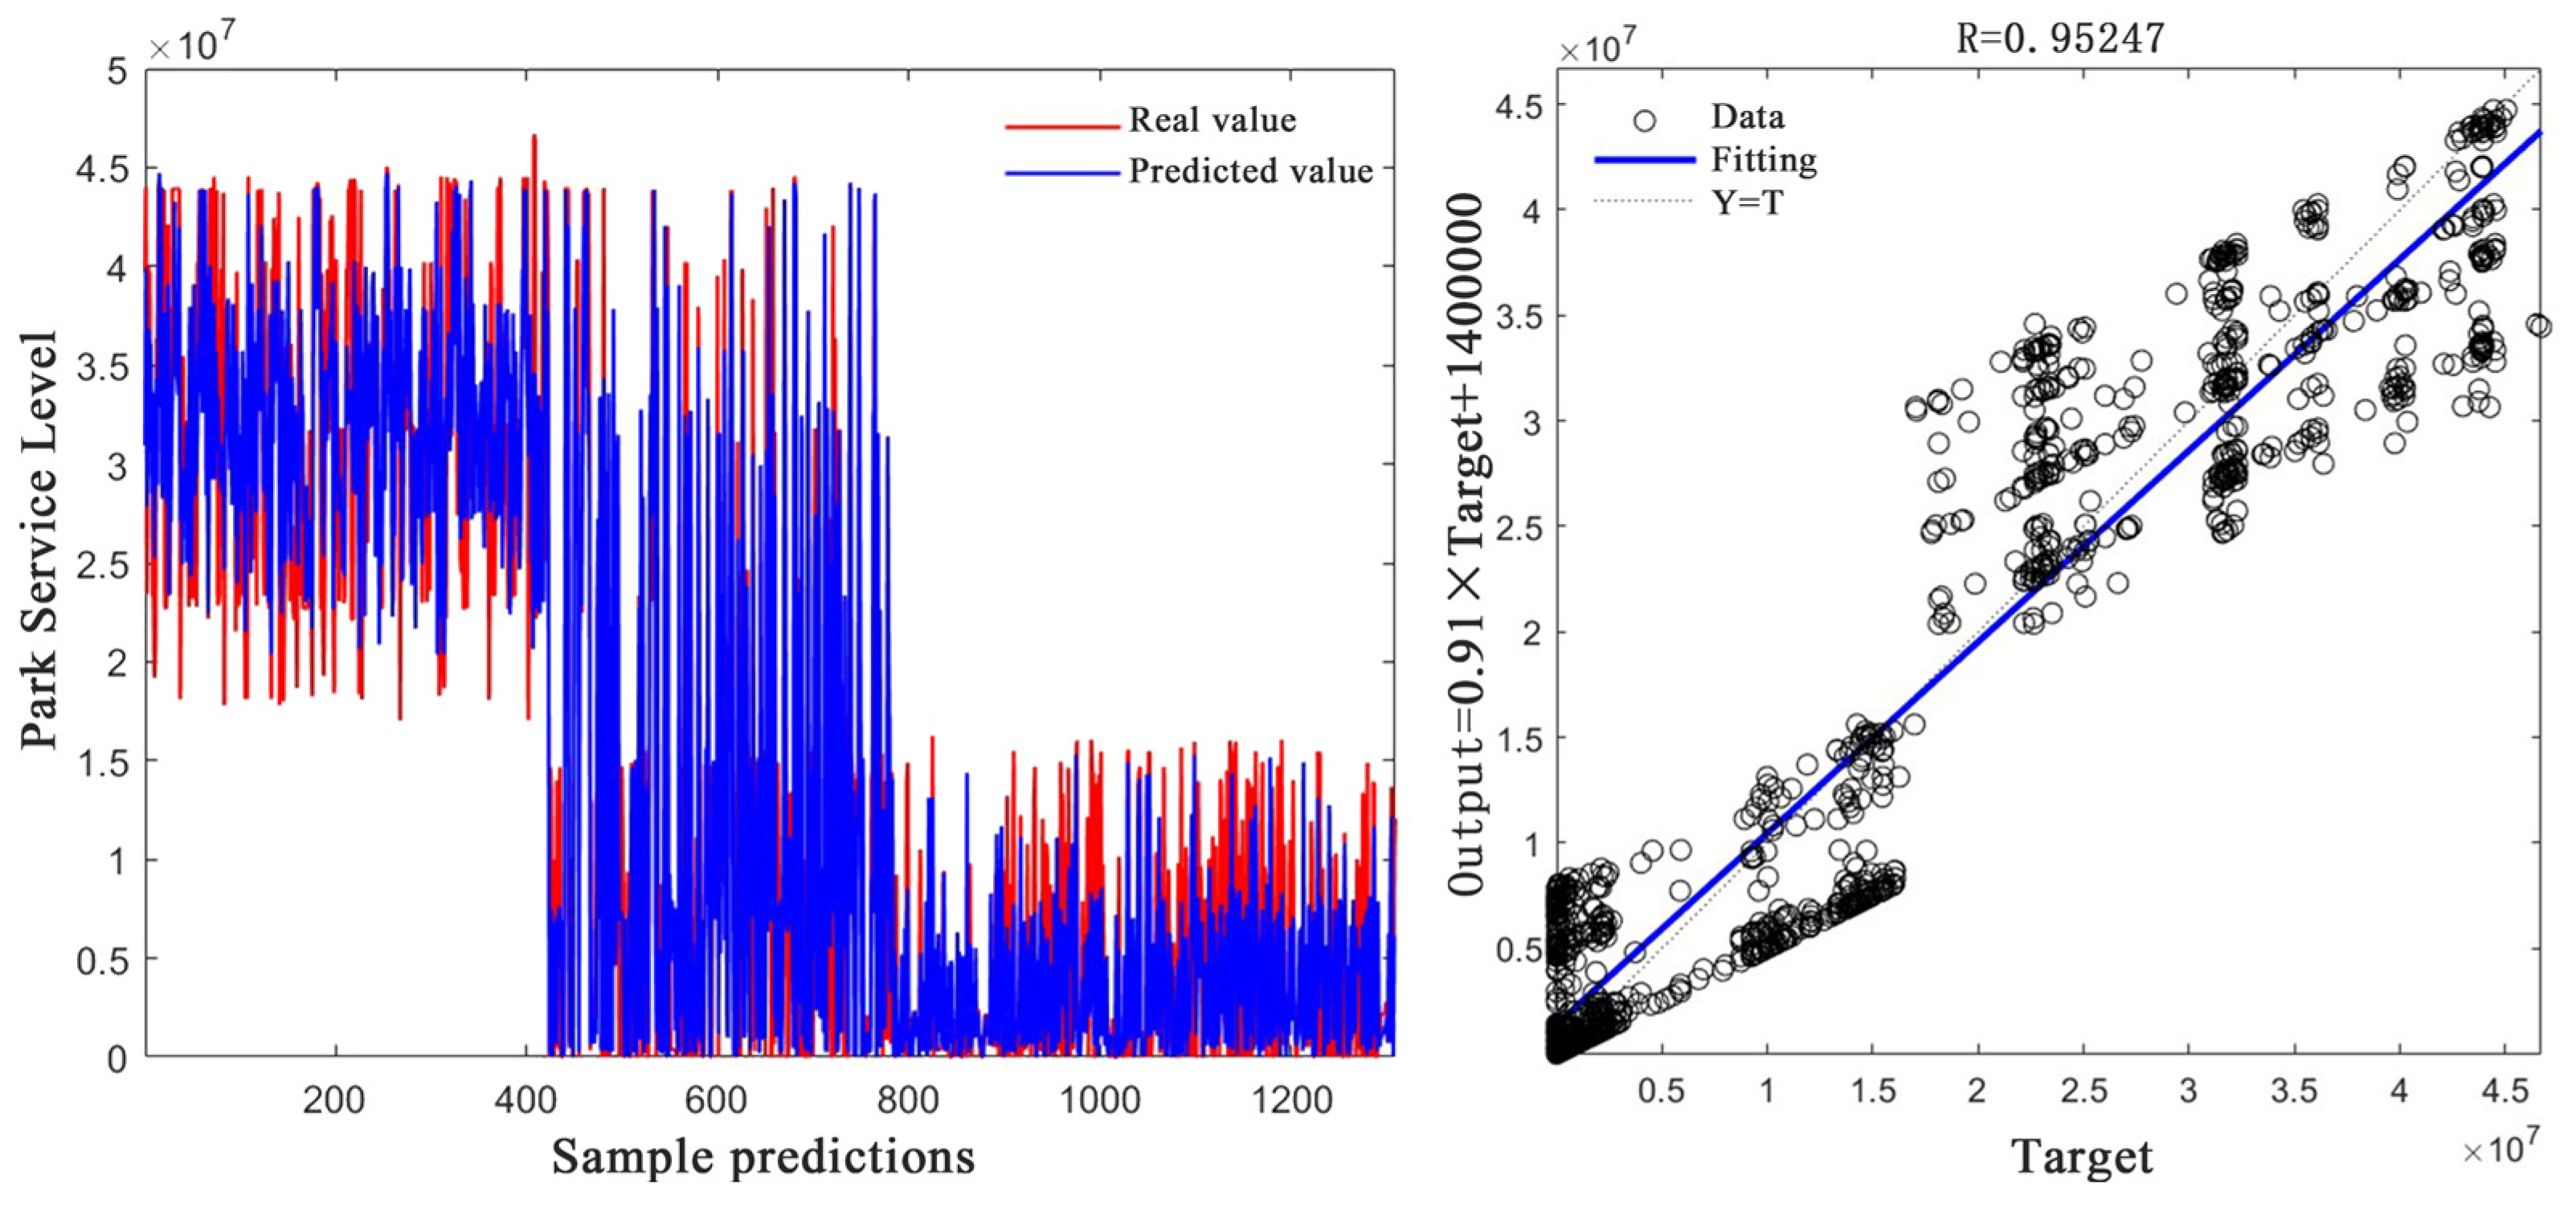
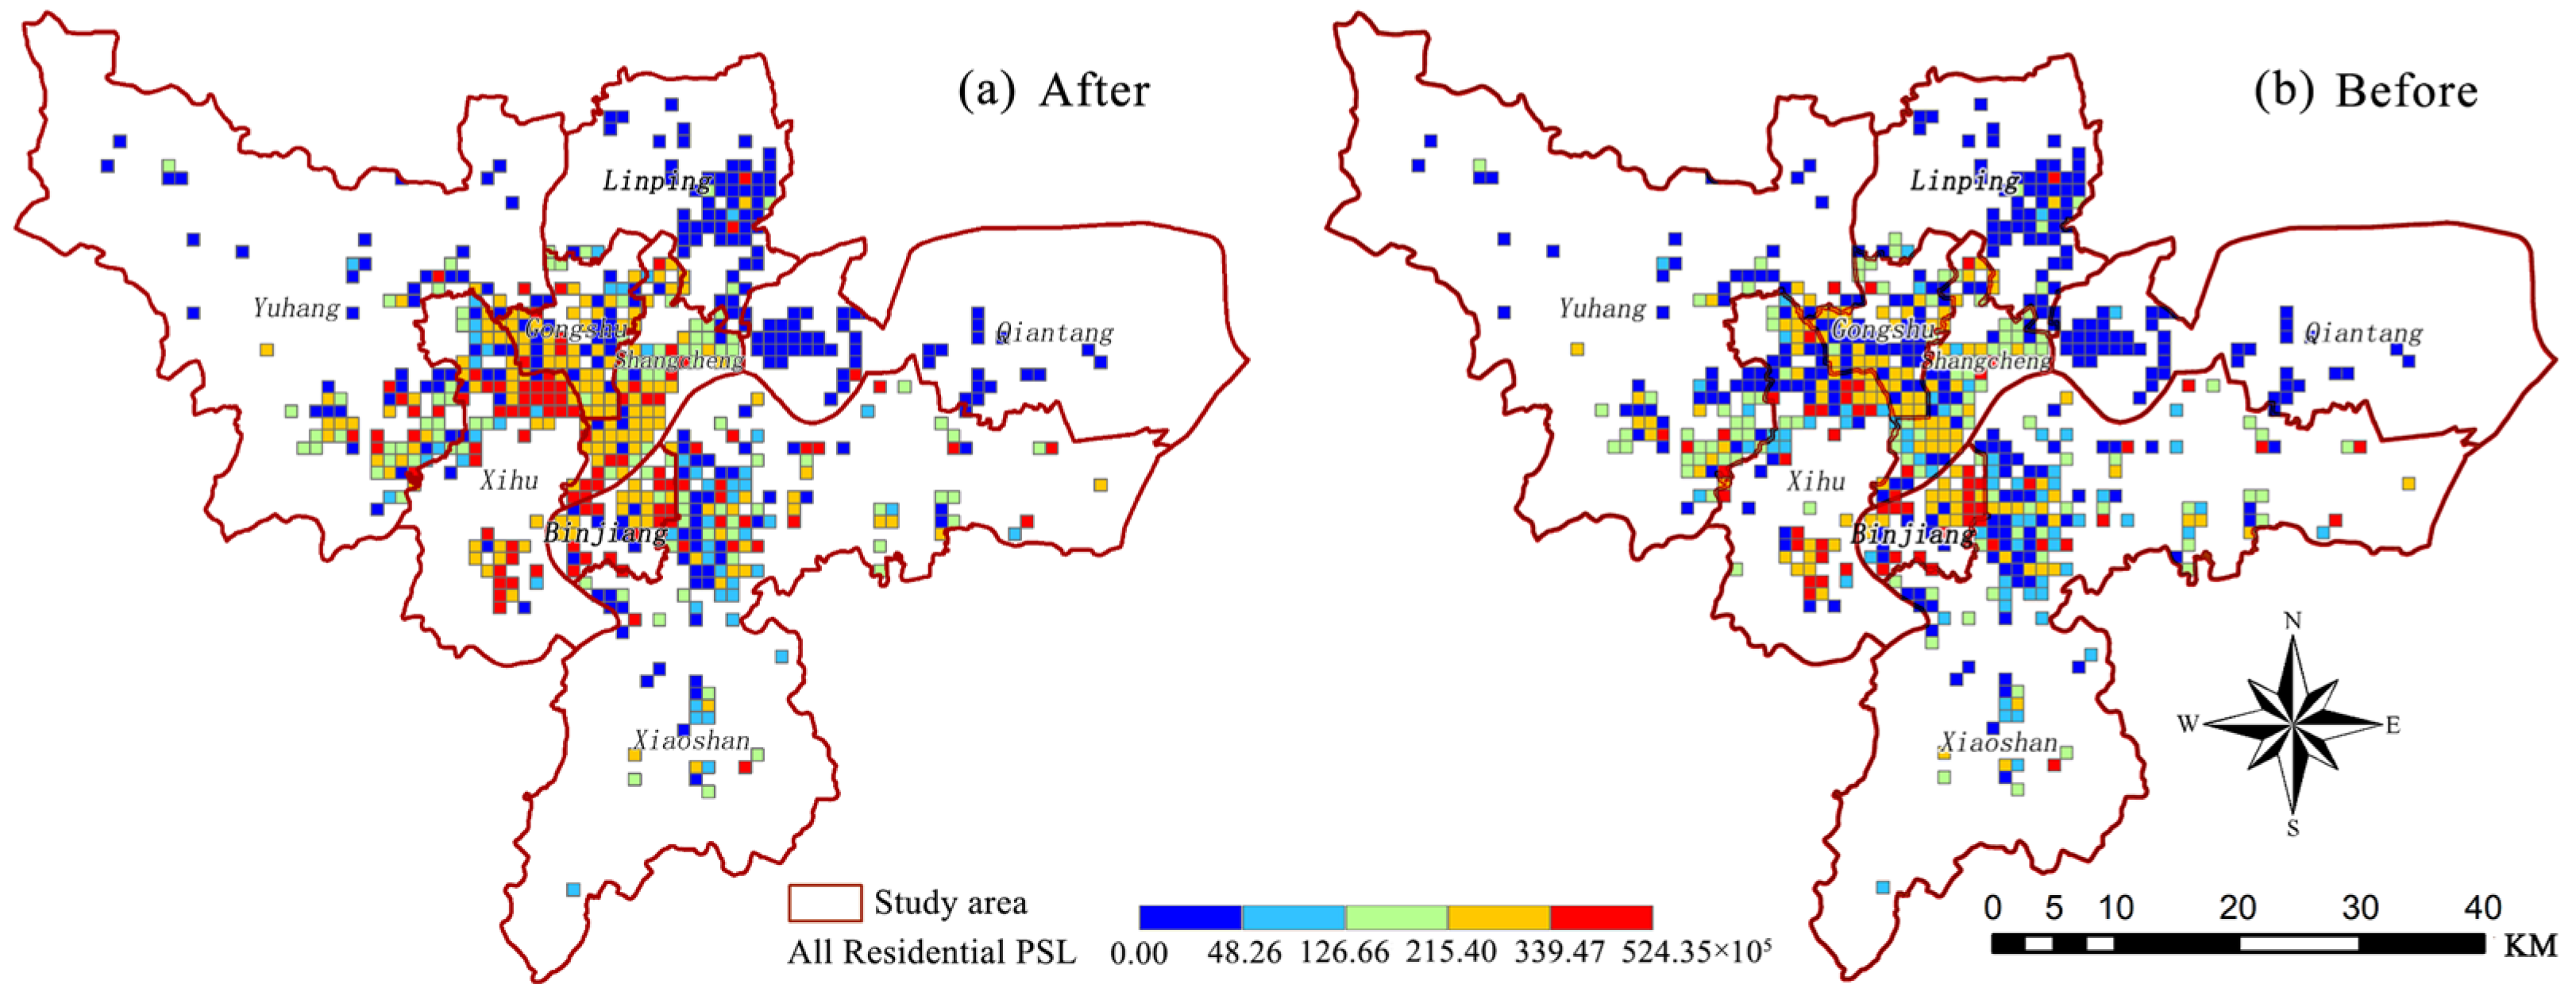
4.4. Utilizing the GWO-KNN Model for Optimizing Park Service Levels

In this study, we harnessed the power of the GWO-KNN Model by using high-level balanced and ahead-of-supply data as sample data. After training, we incorporated the demand from lagging residential areas to predict the park service levels, as illustrated in Figure 10. Notably, the observed values closely align with the predicted values and boast an R-value exceeding 0.95, indicating a high level of fitness. These results are a testament to the high credibility of the park service levels following optimization.
We further visualized the optimized spatial layout according to residential area types and compiled the pre- and post-optimization values into violin plots (Figure 11, Figure 12 and Figure 13). A comparative analysis of the park service levels pre- and post-optimization revealed a clear trend radiating outward from the core, which is West Lake. Based on demand as a foundation, the previously lagging areas primarily located in the vicinity of the city center and central urban regions witnessed a transformation from low-service imbalance to a harmonious state. This positive shift is most conspicuous in the northwestern, northern, and southern urban areas as well as some of the outlying southeastern regions. The areas with low-service imbalances, predominantly found in residential type III, take the lead in the optimization of park services, followed by residential type II. The outcomes of the park service level optimization, geared towards fulfilling the needs of residents, can serve as a compass for future urban planning, offering valuable guidance and objectives.

5. Discussion

5.1. Park Service Level Supply and Demand Matching Analysis

In recent years, Hangzhou has vigorously promoted its development as an urban park city, gradually enhancing the urban park system. However, there is still a lack of coordination between the park service demands of different residential types and the supply of park services [21,55]. Analyzing residential area characteristics and the coordination of park service level supply and demand provides valuable insights for strategic planning (Figure 14).
Low-service coordination parks predominantly consist of well-developed, small-scale parks. While their leisure, ecological, educational, and facility levels are relatively low, they adequately meet the basic park requirements of residential areas and achieve a state of low-service coordination. Limited urban land availability and high-quality, well-facilitated large parks are typically constructed on existing ecological foundations. The absence of such a foundation and policy guidance in certain areas is the fundamental reason behind the challenge of obtaining high-level park services.
High-service coordination parks have already met the demands of residents, boasting a high overall level of coordination. These parks are often located in close proximity to scenic areas, densely distributed, equipped with various facilities, and offering high ecological standards. The surrounding residential areas primarily comprise high-quality, upscale villa communities, close to scenic spots, where residents’ park needs have already been fulfilled [56].
Low service-imbalance parks are generally located near scenic areas, offering relatively high ecological standards. However, these parks tend to be small in scale with incomplete cultural and facility development and moderate recreational opportunities. Consequently, they struggle to meet the daily activity needs of residents. Due to the rapid urbanization process, land for construction is limited in these areas. With limited investments, the facilities are old and the greenery levels are low, resulting in lower park quality. As residents’ spiritual needs continue to grow, these parks have become increasingly inadequate to meet their service requirements. Additionally, the influence of prominent schools and proximity to scenic spots in the vicinity has turned these areas into significant locations for residents’ daily activities. However, these parks have relatively low levels of cultural and recreational facilities and the cost of traveling to high-quality parks is high, significantly impacting the park supply and leading to an imbalance in park service levels. This is contrary to some existing studies as not all wealthier communities enjoy better green spaces [57,58,59].
High service-imbalance parks are primarily located in urban areas, the outskirts, and some central city regions. These parks significantly exceed the demands of residents with all park features operating at high levels. However, their surroundings experience a lack of park service supply, leading to resource allocation inequalities.

5.2. Maximizing Coordination for Park Service Level Optimization Strategy

Simply considering resident demands or uniform supply has proven challenging in achieving overall coordination. Based on the results of supply–demand matching, optimizing park service levels can yield superior outcomes, offering valuable implications for green space planning [36]. Hangzhou’s main urban area exhibits significant disparities between park service level supply and demand coordination. Optimizing park service levels using the GWO-KNN Model can provide valuable recommendations and objectives for urban planning. This study compiles the park attributes associated with various spatial matching types. Using the optimized park service levels as development goals, enhancing park quality can better meet the park needs of residents.
(1)
Low service-coordination parks, mostly situated in suburban and outlying areas with small park sizes and abundant agricultural spaces, often struggle to meet basic recreational needs. In the future, attention should be directed toward the development of suburban parks with the addition of various facilities. These parks can utilize the surrounding green spaces to enhance park service levels. Take, for example, the area near Xixi Wetland Park and West Lake Scenic Area in the Yuhang District. This region is a key hub for innovative industrial parks in Hangzhou and is surrounded by farmland, cultivated land, and wetlands. While park service levels in this area are relatively low, the natural environment is favorable. In response, the approach should involve tapping into existing natural resources and historical culture. Without changing the existing land use, additional recreational features can be integrated to meet leisure and viewing activity requirements.
(2)
High service-coordination parks are positively influenced by ecological and picturesque national-level scenic areas such as West Lake Scenic Area, Xixi Wetland Park, and Wuchaoshan National Forest Park. Their levels of leisure, culture, facilities, and ecology are comparatively high. In the future, enhancing park construction quality and incorporating facilities friendly to vulnerable groups, such as the elderly and children, can create multi-functional parks to cater to the needs of diverse communities.
(3)
Low service-imbalance parks exhibit low levels of recreation, culture, facilities, and ecology, making it challenging to meet the needs of residents. Certain areas with insufficient facility levels in suburban and urban areas are especially concerning. Future park development should focus on expanding park sizes and increasing the quantity of park facilities and recreational infrastructure as an effective strategy to enhance park quality. Some areas have high ecological levels but low levels in culture, recreation, and facilities. They are located near scenic areas with well-developed ecological environments. Strengthening the complementary advantages between “new” and “old” cities and moderately expanding park sizes serve as the foundation for improving service levels. Increasing sports and cultural facilities, upgrading facility development, and boosting outdoor activities for residents and community park construction are key factors in optimizing service levels. Additionally, the region possesses the characteristic of dense water networks, which is commonly found in the Jiangnan region. Enhancing riverfront green space construction, integrating culture with facilities, and accommodating broad participation can serve as a reference for cities with similar intertwined water networks.
(4)
High service-imbalance parks exhibit high levels of recreation, culture, facilities, and ecology with an overall service level exceeding residents’ demands, resulting in resource wastage. To coordinate park service supply, spatial structures using limited land resources should be optimized and a city park network system should be constructed. Connections between high-quality parks and low-quality parks must be strengthened to reduce residents’ travel costs, enabling residents to enjoy green spaces. This approach will lead to fairer park service distribution.

6. Conclusions

Urban park service levels have to be optimized for maximum coordination and equitable distribution. Urban park space allocation and equitable distribution are significant challenges in China today. Hangzhou, as one of the mega-cities, faces pronounced disparities between the diverse residential demands and the supply of park services. This study focuses on Hangzhou’s main urban area, examining the park service supply–demand relationship from a residential perspective. Utilizing the GWO-KNN Model, we use spatially balanced regions as sample areas to propose optimization goals and strategies. This research aims to provide a theoretical basis for urban park development in Hangzhou and offer planning insights for other countries facing similar challenges.
The key findings are as follows:
(1)
Considerable variation exists in the park service demands of residents in different residential environments. Suburban and exurban areas with lower housing prices, high population density, limited green space per capita, and low floor area ratios experience high demand for parks. Areas with higher housing prices, larger population density, more green space per capita, and closer proximity to the city center favor community parks and pocket parks. The central urban area mainly consists of high-end villa communities and older neighborhoods. High-end villa communities generally have sufficient green spaces, while older neighborhoods have high demand for small recreational parks.
(2)
The overall trend in park service supply appears to radiate outward from the West Lake Scenic Area. However, there are significant differences between residential areas, and the general trend indicates that areas with higher living standards have higher park service supply levels. Despite these trends, discrepancies and coordination challenges persist, differing from existing research. Spatial characteristics led to the classification of spatial matching into four types: low-service coordination, high-service coordination, low-service discoordination, and high-service discoordination.
(3)
This study introduces an innovative approach to urban park service optimization by setting high-service coordination areas as sample regions and employing the GWO-KNN Model. For each of the four spatial types, specific strategies are proposed: (a) prioritizing the development of countryside parks, increasing the number of various facilities, utilizing the surrounding green resources, and enhancing park service levels; (b) adding facilities to cater to disadvantaged groups, creating multi-functional parks, and meeting the needs of diverse populations; (c) strengthening the complementary advantages of “new” and “old” areas, moderately increasing park sizes, combining culture and facilities, and comprehensively enhancing facility construction. (d) optimizing spatial structures, improving park quality, constructing an urban park network, enhancing connections between parks, and reducing residents’ travel costs.
While this study offers valuable insights, there are some limitations and areas for future research. Large datasets were used and for calculating travel times, the use of residential area POI data to reach the centroids of some small parks introduced some errors and overlooked the features of comprehensive park accessibility. Furthermore, optimizing park service levels to find the best solution for each criterion is challenging without standardized constraints. This issue presents a common challenge in global urban park planning. Future research should aim to explore more comprehensive and scientific approaches for park service level optimization.

Author Contributions

Conceptualization, A.T., X.Q. and L.X.; methodology, A.T., L.X., X.Q. and Y.W.; software, A.T., Q.M. and Y.S. validation, A.T., X.Q., Y.W. and L.X.; formal analysis, A.T., Z.L. and M.F.; investigation, A.T. and X.Q.; resources, L.X.; data curation, A.T. and X.Q.; writing—original draft preparation, A.T.; writing—review and editing, A.T. and X.Q.; visualization, A.T.; supervision, L.X.; project administration, L.X. All authors have read and agreed to the published version of the manuscript.

Funding

This research was funded by Zhejiang Provincial Natural Science Foundation Key Project, grant number No. Z23D010003, the Key Program of Zhejiang Province Philosophy and Social Science Planning Interdisciplinary, grant number No. 22JCXK06Z, Scientific Research Fund of Zhejiang Provincial Education Department, grant number No Y202250152, National Natural Science Foundation of China, grant number No. 41871216.

Data Availability Statement

The data presented in this study are available on request from the corresponding author.

Acknowledgments

The authors gratefully acknowledge the support of the funding.

Conflicts of Interest

The authors have no relevant financial or non-financial interest to disclose.

Correction Statement

This article has been republished with a minor correction to the readability of Figure 1. This change does not affect the scientific content of the article.

References

  1. Wang, M.M.; Wang, Y.C. Measurement and Optimization of Supply and Demand of Park Green Space at Urban Block Scale: A Case Study of Yangpu District, Shanghai. Landsc. Archit. 2021, 28, 22–27. [Google Scholar] [CrossRef]
  2. Liu, Y.; Zhang, X.Y.; Xu, M.J.; Guo, M.X.; Peng, A.Q.; Yu, C.T.; Yin, W.D. Spatial Differentiation Characteristics of Park from Perspective of Supply demand Synergy: Take Chaoyang District of Beijing as an Example. Urban Dev. Stud. 2022, 29, 12–19. [Google Scholar]
  3. Zhang, S.; Zhou, W. Recreational visits to urban parks and factors affecting park visits: Evidence from geotagged social media data. Landsc. Urban Plan. 2018, 180, 27–35. [Google Scholar] [CrossRef]
  4. Wang, Z.; Miao, Y.; Xu, M.; Zhu, Z.; Qureshi, S.; Chang, Q. Revealing the differences of urban parks’ services to human wellbeing based upon social media data. Urban For. Urban Green. 2021, 63, 127233. [Google Scholar] [CrossRef]
  5. Zhang, J.; Cheng, Y.; Wei, W.; Zhao, B. Evaluating Spatial Disparity of Access to Public Parks in Gated and Open Communities with an Improved G2SFCA Model. Sustainability. 2019, 11, 5910. [Google Scholar] [CrossRef]
  6. Verheij, R.; Maas, J.; Groenewegen, P. Urban—Rural Health Differences and the Availability of Green Space. Eur. Urban Reg. Stud. 2008, 15, 307–316. [Google Scholar] [CrossRef]
  7. Bryant, M.M. Urban landscape conservation and the role of ecological greenways at local and metropolitan scales. Landsc. Urban Plan. 2006, 76, 23–44. [Google Scholar] [CrossRef]
  8. Maas, J.; van Dillen, S.M.E.; Verheij, R.A.; Groenewegen, P.P. Social contacts as a possible mechanism behind the relation between green space and health. Health Place 2009, 15, 586–595. [Google Scholar] [CrossRef]
  9. Ozdil, T.R.; Modi, S.K.; Stewart, D.M. A ‘Texas three-step’ landscape performance research: Learning from Buffalo Bayou Promenade, Klyde Warren Park, and Ut Dallas Campus Plan. Landsc. Res. Rec. 2014, 2, 117–131. [Google Scholar]
  10. Chen, J.; You, W.B.; He, D.J.; Hu, X.S. Supply and demand relationship and its spatial heterogeneity of urban parks in downtown area of Fuzhou. J. Zhejiang AF Univ. 2023, 40, 1300–1310. [Google Scholar]
  11. Talen, E. The social equity of urban service distribution: An exploration of park access in pueblo, colorado, and macon, georgia. Urban Geogr. 1997, 18, 521–541. [Google Scholar] [CrossRef]
  12. He, P.; Chen, W.Z.; Cheng, Q.; Zhao, L. Research Progress of Chinese and International Spatial Justice in Urban Green Space. Chin. Landsc. Archit. 2019, 35, 28–33. [Google Scholar] [CrossRef]
  13. Yin, H.W.; Kong, F.H.; Zong, Y.G. Accessibility and equity assessment on urban green space. Acta Ecol. Sin. 2008, 28, 3375–3383. [Google Scholar]
  14. Zhang, J.G.; Song, A.Q.; Xia, T.Y.; Zhao, B. Evaluating the urban park green space exposure from the perspective of thecommunity life circle. J. Nanjing For. Univ. 2023, 47, 191–198. [Google Scholar] [CrossRef]
  15. Fan, P.; Xu, L.; Yue, W.; Chen, J. Accessibility of public urban green space in an urban periphery: The case of Shanghai. Landsc. Urban Plan. 2017, 165, 177–192. [Google Scholar] [CrossRef]
  16. Wu, J.; Feng, Z.; Peng, Y.; Liu, Q.; He, Q. Neglected green street landscapes: A re-evaluation method of green justice. Urban For. Urban Green. 2019, 41, 344–353. [Google Scholar] [CrossRef]
  17. Mao, Z.; Wang, W.; Ren, Z.; Zhang, D.; He, X. Recreational Attractiveness of Urban Parks and Implications for Their Management: A Case Study in Changchun, China. Chin. Geogr. Sci. 2022, 32, 456–466. [Google Scholar] [CrossRef]
  18. Wang, S.B.; Jiao, X.; Li, D.D.; Li, T.W. Review and Prospect of Research on Ecosystem Services: The Evolution from Functional Cognition and Value Accounting to Consumption Value Realization. For. Econ. 2021, 43, 49–67. [Google Scholar] [CrossRef]
  19. Kaczynski, A.T.; Stanis, S.A.W.; Besenyi, G.M. Development and Testing of a Community Stakeholder Park Audit Tool. Am. J. Prev. Med. 2012, 42, 242–249. [Google Scholar] [CrossRef]
  20. Wu, P.P.; Zhu, X.C.; Wang, W. Study on matching efficiency of supply and demand of public service function facilities in Shanghai: Analysis based on the heterogeneity characteristics of residents. Urban Probl. 2023, 04, 87–95. [Google Scholar]
  21. Jin, H.X.; He, G.; Huang, Q.S. Research on the Accessibility of Urban Green Space Through EnvironmentaJustice View: A Case Study of Hangzhou, China. J. Northwest For. Univ. 2022, 37, 261–267. [Google Scholar]
  22. Xu, H.F.; Xu, L.H.; Wu, Y.Q.; Shi, Y.J.; Lu, Z.W. Analysis on Accessibility and Fairness of Urban Public Green Space in Hangzhou. J. Southwest For. Univ. 2019, 39, 152–159. [Google Scholar]
  23. Peña, L.; Casado-Arzuaga, I.; Onaindia, M. Mapping recreation supply and demand using an ecological and a social evaluation approach. Ecosyst. Serv. 2015, 13, 108–118. [Google Scholar] [CrossRef]
  24. Crooks, A.; Pfoser, D.; Jenkins, A.; Croitoru, A.; Stefanidis, A.; Smith, D.; Karagiorgou, S.; Efentakis, A.; Lamprianidis, G. Crowdsourcing urban form and function. Int. J. Geogr. Inf. Sci. 2015, 29, 720–741. [Google Scholar] [CrossRef]
  25. Aamodt, G.; Nordh, H.; Nordbø, E.C. Relationships between socio-demographic/socio-economic characteristics and neighborhood green space in four Nordic municipalities—Results from NORDGREEN. Urban For. Urban Green. 2023, 82, 127894. [Google Scholar] [CrossRef]
  26. Liu, B.; Tian, Y.; Guo, M.; Tran, D.; Alwah, A.A.Q.; Xu, D. Evaluating the disparity between supply and demand of park green space using a multi-dimensional spatial equity evaluation framework. Cities 2022, 121, 103484. [Google Scholar] [CrossRef]
  27. Yu, S.; Zhu, X.; He, Q. An Assessment of Urban Park Access Using House-Level Data in Urban China: Through the Lens of Social Equity. Int. J. Environ. Res. Public Health 2020, 17, 2349. [Google Scholar] [CrossRef]
  28. Chen, L.; Yao, X.; Liu, Y.; Zhu, Y.; Chen, W.; Zhao, X.; Chi, T. Measuring Impacts of Urban Environmental Elements on Housing Prices Based on Multisource Data—A Case Study of Shanghai, China. ISPRS Int. J. Geo-Inf. 2020, 9, 106. [Google Scholar] [CrossRef]
  29. Dou, J.M.; Wang, G.L. Structure on Urban Land Price Research on the lnfluence Mechanism of Urban Polycentric Economic Spatia. Inq. Into Econ. Issues 2022, 119–134. [Google Scholar]
  30. Lu, Z.D. Relationship between City Expansion, City Transformation and Carbon Dioxide Emissions of China. Areal Res. Dev. 2014, 33, 121–126, 131. [Google Scholar]
  31. Yin, W.Y.; Shao, D.W.; Wu, D.M. Effect of Residential Space Differentiation on Park Green Space Pattern: A Case Study of Suzhou City. Areal Res. Dev. 2023, 42, 81–87. [Google Scholar]
  32. Meng, L.; Li, Q. Relationship between supply and demand of green open space in Haidian District of Beijing based on accessibility. J. Beijing For. Univ. 2023, 45, 108–119. [Google Scholar]
  33. Zhang, J.; Tan, P.Y. Assessment of spatial equity of urban park distribution from the perspective of supply-demand interactions. Urban For. Urban Green. 2023, 80, 127827. [Google Scholar] [CrossRef]
  34. Chen, Y.S.; Li, D.; Wang, Y.C.; Li, Y.Y. Evaluation and layout optimization of park green space in central urban area of Hefei City based on POl data. J. China Agric. Univ. 2023, 28, 87–97. [Google Scholar] [CrossRef]
  35. Xu, Y.-X.; Chen, Y.-X.; Su, J.; Yin, H.-W.; Cheng, L.; Zeng, H. Using the environmental justice approach to evaluate equitable allocation of urban parks: A case study of main urban area of Nanjing, China. Chin. J. Appl. Ecol. 2022, 33, 1589–1598. [Google Scholar] [CrossRef]
  36. Chen, Y.; Men, H.; Ke, X. Optimizing urban green space patterns to improve spatial equity using location-allocation model: A case study in Wuhan. Urban For. Urban Green. 2023, 84, 127922. [Google Scholar] [CrossRef]
  37. Xing, L.J. Optimization the Layout of Urban Park Green Space under the Guidance of the Concept of Equality. Ph.D. Thesis, Wuhan University, Wuhan, China, 2019. [Google Scholar] [CrossRef]
  38. Ma, J.; Cheng, Y.N. Research on Optimization of Urban Park Design Based on Swarm Intelligent Simulation and Spatial Syntax Analysis. Chin. Landsc. Archit. 2021, 37, 69–74. [Google Scholar] [CrossRef]
  39. Lu, Y.C.; Fang, S.M. Study on the Spatial Distribution Optimization of Park Green Spaces in the Main City of Wuhan from the Perspective of Both Equilibrium and Efficiency. Resour. Environ. Yangtze Basin 2019, 28, 68–79. [Google Scholar]
  40. Yu, M.; Xu, D.; Ding, K.; Li, Y.Y. Evaluation and Optimization of Recreation Service in the Great Wall NationaCultural Park (Beijing Section). Landsc. Archit. 2023, 30, 108–116. [Google Scholar] [CrossRef]
  41. Li, C.T.; Zhang, Y.C.; Zhang, G.Y.; Li, R.; Zhang, L. Quantitative Study on the Quality of Green Space in Urban Parks. J. Beijing Univ. Civ. Eng. Archit. 2021, 37, 20–31. [Google Scholar] [CrossRef]
  42. Tao, C.; Li, J.X.; Lai, D.Y. Public Activity Space Quality Evaluation and Optimization Strategy. Planners 2021, 37, 75–83. [Google Scholar]
  43. Xue, M.; Jiang, S.J.; Wang, R.C. Systematic review of test data generation based on intelligent optimization algorithm. Comput. Eng. Appl. 2018, 54, 16–23. [Google Scholar] [CrossRef]
  44. Lu, H.X. Classification Model of IoT Intrusion Detection Based on GWO-CatBoost. Master’s Thesis, Lanzhou University, Lanzhou, China, 2020. [Google Scholar] [CrossRef]
  45. Zhang, X.F.; Wang, X.Y. Comprehensive Review of Grey Wolf Optimization Algorithm. Comput. Sci. 2019, 46, 30–38. [Google Scholar] [CrossRef]
  46. Yan, X.J.; Wang, Y.L.; He, G.P. A Survey on the Active Set Methods for Box Constrained Optimization. Math. Pract. Theory 2012, 42, 100–107. [Google Scholar]
  47. Yuan, Z.Q.; Zhao, C.Y. Two improved simulated annealing algorithms for solving constraint satisfaction problems with large domains. Appl. Res. Comput. 2017, 34, 3611–3616. [Google Scholar]
  48. Adithiyaa, T.; Chandramohan, D.; Sathish, T. Optimal prediction of process parameters by GWO-KNN in stirring-squeeze casting of AA2219 reinforced metal matrix composites. Mater. Today Proc. 2020, 21, 1000–1007. [Google Scholar] [CrossRef]
  49. Zhang, R.; Peng, S.; Sun, F.; Deng, L.; Che, Y. Assessing the social equity of urban parks: An improved index integrating multiple quality dimensions and service accessibility. Cities 2022, 129, 103839. [Google Scholar] [CrossRef]
  50. Lu, N.; Li, J.Y.; Yan, H.W.; Shi, T.; Li, Y. Analysis on accessibility of urban park green space: The case study of Shenyang Tiexi District. Chin. J. Appl. Ecol. 2014, 25, 2951–2958. [Google Scholar] [CrossRef]
  51. Wu, S.; Wang, D.; Yan, Z.; Wang, X.; Han, J. Coupling or contradiction? The spatiotemporal relationship between urbanization and urban park system development in China. Ecol. Indic. 2023, 154, 110703. [Google Scholar] [CrossRef]
  52. Li, Y.; Sang, J.J.; Ao, R.H.; Ma, Y.; Wei, X. Research on inversion method of hyperelastic constitutive parameters of skeletal muscles based on simulation and intelligent algorithm. Chin. J. Theor. Appl. Mech. 2021, 53, 1449–1456. [Google Scholar] [CrossRef]
  53. Kumar, V.; Chhabra, J.K.; Kumar, D. Grey Wolf Algorithm-Based Clustering Technique. J. Intell. Syst. 2017, 26, 153–168. [Google Scholar] [CrossRef]
  54. Ma, X.; Zhang, Z.; Dong, J.; Gao, F.; Li, R. Spatial Distribution and Supply & Demand Matching of Parks-A Case Study of Lanzhou City. J. Northwest For. Univ. 2021, 36, 289–296. [Google Scholar]
  55. Wu, J.; He, Q.; Chen, Y.; Lin, J.; Wang, S. Dismantling the fence for social justice? Evidence based on the inequity of urban green space accessibility in the central urban area of Beijing. Environ. Plan. B Urban Anal. City Sci. 2020, 47, 626–644. [Google Scholar] [CrossRef]
  56. Woo, Y.; Webster, C. Co-evolution of gated communities and local public goods. Urban Stud. 2014, 51, 2539–2554. [Google Scholar] [CrossRef]
  57. Astell-Burt, T.; Feng, X.; Mavoa, S.; Badland, H.M.; Giles-Corti, B. Do low-income neighbourhoods have the least green space? A cross-sectional study of Australia’s most populous cities. BMC Public Health 2014, 14, 292. [Google Scholar] [CrossRef] [PubMed]
  58. Chen, Y.; Yue, W.; La Rosa, D. Which communities have better accessibility to green space? An investigation into environmental inequality using big data. Landsc. Urban Plan. 2020, 204, 103919. [Google Scholar] [CrossRef]
  59. Barbosa, O.; Tratalos, J.A.; Armsworth, P.R.; Davies, R.G.; Fuller, R.A.; Johnson, P.; Gaston, K.J. Who benefits from access to green space? A case study from Sheffield, UK. Landsc. Urban Plan. 2007, 83, 187–195. [Google Scholar] [CrossRef]
Figure 1. The study area location.
Forests 14 02371 g001
Figure 2. Study framework.
Forests 14 02371 g002
Figure 3. The quality of residential areas in the main part of Hangzhou.
Forests 14 02371 g003
Figure 4. All types of residential access to PSL.
Forests 14 02371 g004
Figure 5. Park green space Coordinated Development Types (A) and Matching Supply with Demand Types (B).
Forests 14 02371 g005
Figure 6. The analysis of obtaining park-level indicators for different matching types of residential areas. (a) is the ecological and facility level map, (b) is the recreational and cultural level map.
Forests 14 02371 g006
Figure 7. Residential areas of different matching types obtain park secondary indicators.
Forests 14 02371 g007
Figure 8. Spatial distribution of park-level indicators obtained by different matching types of residential areas.
Forests 14 02371 g008
Figure 9. Spatial distribution of park secondary indicators obtained by different matching types of residential areas.
Forests 14 02371 g009
Figure 10. Fitting results of park service level optimization values based on residents’ needs (GWO-KNN Model).
Forests 14 02371 g010
Figure 11. Before and after optimizing park service levels.
Forests 14 02371 g011
Figure 12. Before and after optimizing park service levels in three types of residential areas.
Forests 14 02371 g012
Figure 13. Violin plot of park service levels in three types of residential areas before and after optimization.
Forests 14 02371 g013
Figure 14. Analysis chart of residential area characteristics of different service coordination types.
Forests 14 02371 g014
Table 1. Quality evaluation system for park green spaces.
Level 1 IndicatorsWeightLevel 2 IndicatorsIndicator DetailsWeight
A Recreational level0.2127A1 Sports facilitiesCourts, fitness facilities, etc.0.0806
A2 Recreational facilitiesAmusement rides, campgrounds, theaters, etc.0.1321
B Ecological level0.0815B1 Water featuresPercentage of water0.0278
B2 Vegetation cover/0.0063
B3 Near mountainYes is 1, No is 00.0448
B4 Near water bodiesYes is 1, No is 00.0026
C Cultural level0.2315C1 Cultural facilitiesExhibition halls, museums, art galleries, etc.0.0849
C2 Number of spotsNumber of spots (POI)0.1466
D Facility level0.4743D1 Park sizeArea of park (AOI)0.1160
D2 Access facilitiesNumber of parkings0.1124
D3 Sanitary facilitiesNumber of restrooms0.1160
D4 Convenience facilitiesNumber of convenience stores0.1299
Table 2. Quality evaluation system for residential areas.
Residential Quality IndicatorsNature of IndicatorWeight
Population sizeNegative0.09
House pricePositive0.27
Floor area ratio of the residential areaNegative0.25
Green space per capita in the residential areaPositive0.39
Disclaimer/Publisher’s Note: The statements, opinions and data contained in all publications are solely those of the individual author(s) and contributor(s) and not of MDPI and/or the editor(s). MDPI and/or the editor(s) disclaim responsibility for any injury to people or property resulting from any ideas, methods, instructions or products referred to in the content.

