Article

An Updated Cyclic CBR Test with Realistic Stress Values under the Plunger for Resilient Modulus Calculation

1
Department of Civil Engineering, Institute of Technology and Business in České Budějovice, Okružní 517/10, 370 01 Ceske Budejovice, Czech Republic
2
Department of Landscape Management, Faculty of Forestry and Wood Technology, Mendel University in Brno, Zemědělská 3, 613 00 Brno, Czech Republic
3
Department of Statistics and Operation Analysis, Faculty of Business and Economics, Mendel University in Brno, Zemědělská 3, 613 00 Brno, Czech Republic
*
Author to whom correspondence should be addressed.
Forests 2023, 14(12), 2425; https://doi.org/10.3390/f14122425
Submission received: 31 October 2023 / Revised: 4 December 2023 / Accepted: 10 December 2023 / Published: 12 December 2023
(This article belongs to the Section Forest Operations and Engineering)

Abstract

:
The design and assessment of forest and rural road pavements made from unbound natural and recycled materials require the careful determination of their physical-mechanical properties. The fundamental parameter for characterizing the soil material property is considered to be the resilient modulus Mr. The generally accepted alternative solution for its calculation is the cyclic CBR test, which uses standard CBR testing equipment. To perform tests on intact specimens and under stress conditions corresponding to expected states of stress in a pavement structure, an updated cyclic CBR test is proposed. In contrast to the standard cyclic CBR test, the applied loading force for repeated loadings is not determined in the first loading step by the plunger penetration to the prescribed depth, but by the stress value that is expected in an actual pavement structure. The updated test was verified on 240 tested specimens taken from a total of 40 soil samples belonging to nine soil types according to the USCS system. The resilient modulus results obtained are compared with those obtained using the standard cyclic CBR test and the cyclic triaxial test.

1. Introduction

Forest as well as rural roads have low traffic volume and are essential for the social and economic development of small, often mountainous, forested or semi-desert human communities. They grant access to areas that need to be accessed for, e.g., economic, social, recreational, or safety reasons. These roads are part of low volume road networks, which form a large part of the national road networks in various countries, not only developing ones, but also in the USA, Canada, Australia, etc. Especially in developing countries, their presence and quality is particularly important, as they link remote, often highly populated regions with essential social, cultural, and economic centers [1].
Low volume roads are designed to carry low traffic volume and are classified by the American Association of State Highway and Transportation Officials (AASHTO) as carrying less than 400 vehicles per day [2]. These roads must often meet criteria that are in conflict with each other. Although they are less traffic-intensive compared to standard roads, the natural conditions require special attention in the design of pavement layers. Roads frequently pass through areas where the subgrade exhibits an unfavorable water regime, a low load-bearing capacity, steep longitudinal gradients, or extremely high moisture content, which leads to intensive pavement deterioration [3].
Mostly natural materials are commonly used for forest road pavement construction, but the proportion of recycled materials is continually increasing and can be expected to become more common in the near future [4]. These materials’ physical-mechanical properties are highly variable and uncertain, making it very difficult to study them in situ as well as in a laboratory. A small change in the material basic conditions, such as grain size or moisture content, directly affects the material behavior and thus its physical-mechanical properties. The design and assessment of pavements made of these types of materials require a careful determination. The current Mechanistic-Empirical Pavement Design Guide (MEPDG) methodology for the road design and construction used by AASHTO [5] is based on the mechanistic–empirical method [6]. The fundamental parameter for characterizing the material property is considered to be the resilient modulus Mr. It is a measure of material stiffness and provides a means to analyze the stiffness of materials under different conditions, where, e.g., the moisture, density, or state of stress varies. The resilient response of granular materials in pavement depends primarily on their loading history, current stress level, and degree of saturation.
As a typical granular material, soils do not exhibit a completely elastic response and undergo irreversible plastic deformation after each loading. Soil is a natural, heterogeneous, and discontinuous environment. The deformation behavior, stiffness, and strength, as well as the variability of mechanical properties, depend on many factors. These factors include soil genesis, soil type, the lay-off of unbound materials, compaction rate given by the Proctor Standard energy, liquid phase amount, the number of repeated loading cycles, and maximum load-bearing capacity [4,7,8]. The resilient modulus should consider these factors [9] and should be obtained from an appropriate laboratory test that realistically simulates expected loadings by repeated passages of transport vehicles and taking into account the expected state of stress in an actual structure. At the same time, the test must not violate the soil specimen being tested or exceed the maximum load-bearing capacity of the material [10,11]. After applying numerous loads, the irreversible plastic deformation in the last loading step becomes smaller compared to the total deformation. In this phase of cyclic loading, the resilient modulus Mr can be calculated.
The resilient modulus Mr can be obtained by the cyclic triaxial test performed using cyclic triaxial test equipment [12]. However, the use of this sophisticated equipment is a time-consuming and especially costly task that is generally not suitable for testing forest road materials. For low volume roads, the MEPDG methodology allows the cyclic triaxial test to be replaced by another, simpler laboratory cyclic test. The generally accepted solution to this problem is the cyclic CBR test, which uses standard CBR testing equipment.
The present paper summarizes the results of long-term research on the deformation behavior of subgrade soils in the Czech Republic and an analysis of resilient modulus Mr values obtained via cyclic CBR testing. The main objective of the research initiated at MENDELU University Brno was to adapt the standard cyclic CBR test to perform tests on undamaged material specimens and, in particular, under stress conditions corresponding to the expected states of stress in an actual pavement structure. A new cyclic CBR test procedure that uses realistic stress values under the plunger was developed. A statistical analysis of the results obtained using the new updated method for nine subgrade soil types according to the Unified Soil Classification System [13,14] is presented. The results are compared with those obtained using the standard cyclic CBR test [15] and the cyclic triaxial test.

2. Materials and Methods

2.1. The Standard Cyclic CBR Test

The cyclic CBR test procedure for estimating the resilient modulus Mr was developed by the Delft University [16] employing standard CBR test equipment. Compared to the traditional CBR test, cyclic loading is applied. The application of repeated loadings on a specimen simulates the effect of moving vehicles. At the same time, the above procedure allows for the separation of irreversible plastic deformations and reversible elastic ones, thus allowing for the calculation of the resilient modulus. The cyclic CBR test uses a standard device for CBR determination in accordance with valid standards for specimen preparation [17] and for the implementation of the CBR test [18], i.e., penetration with the standard speed of 1.27 mm/min, a penetration depth of 2.54 mm, and a plunger with a diameter of 50 mm. The cyclic loading procedure is automated and controlled by a control unit with appropriate software.
In the first loading step, the specimen is loaded to a penetration depth of 2.54 mm and then unloaded. In the next steps, cyclic loading is performed with the force value set to the maximum force value reached in the first step. The loading and unloading is repeated until a certain condition is fulfilled. Different authors use different conditions to terminate the loading process, but the decision should be based on a comparison of the change in irreversible plastic deformation in the few last cycles and not simply on limiting the number of loading cycles to, e.g., 10, 20, or 50.
The method has been tested and used by a number of authors [15,16,19,20,21,22,23,24,25,26,27,28,29,30,31,32,33]. Although the influence of the state of stress on the modulus has been correctly mentioned in some papers, and some studies have even been performed under an intuitively lower loading force not set up according to the standard CBR test [25,29], the question of the magnitude of the stress under the plunger has been overlooked. In the first papers dealing with this problem [15,31], the effect of the plunger stress on the calculated resilient modulus was measured, analyzed, and discussed. The authors also discussed how the plunger stress affects the calculated resilient modulus and how these values are consistent with the reality of in-situ soil behavior.
First, it was found from 276 specimens tested [15,31] that the plunger stress values can be high, up to 3000 kPa, and when these values are recalculated from published available data from other authors (e.g., [20,25,26,30]), they can be as high as 9000 kPa. Second, when testing more specimens taken from one soil sample, the individual specimens are cycled under a wide range of plunger stress values, because when penetrating to a depth of 2.54 mm, a different loading force is required for individual specimens and thus a different plunger stress will arise. The above problems are a result of using the standard CBR methodology to set the loading force value in the first loading step. When applying the load to a constant penetration depth of 2.54 mm, according to the standard CBR test, high plunger stress values are generally observed. These findings have several consequences.
If we compare the plunger stress values with the assumed maximum soil load-bearing capacity according to Terzagi’s theory, the maximum value of the soil load-bearing capacity is assumed to be between 150 and 650 kPa [34], depending on the soil type [35]. In many cases, these limit values are exceeded many times during the standard cyclic CBR test. Thus, the resilient modulus Mr is determined for a large number of specimens on the damaged material. However, for any test of any material, it is required that the specimen is not damaged and that the maximum load-bearing capacity of the material is not exceeded [10,11]. The reason why the soil specimen can resist such a high stress value is the unrealistic storage of the specimen in a CBR mold. The specimen is confined by a steel ring with high stiffness, so it can resist the stress values highly exceeding its load-bearing capacity.
Another consequence of high plunger stress values are high resilient modulus values too, as there is a high positive correlation between modulus and plunger stress [15,31]. That is, if cyclic loading is performed with high plunger stress values, we can expect with a high probability high resilient modulus values, and vice versa. These high resilient moduli are of course meaningless, because they are obtained under unrealistic loading conditions, but they are considered correct and taken into account.
The wide range of plunger stress values, under which individual specimens taken from the same soil sample are tested, results in a wide range of resilient moduli obtained. High resilient modulus values will be obtained when testing with high plunger stress values, and low resilient modulus values will be obtained when testing with low plunger stress values. When these data are statistically analyzed, we can expect high random variability and higher mean values compared to the reality.
Civil engineers can expect that any material is tested under the conditions in which it will act in an actual structure. In the case of forest roads, where the pavement surface layer is predominantly built from unbound materials, no one can expect that it can resist the load that caused the stress in MPa units. In addition, vehicle loading is limited by government regulations and in most countries is between 100 and 120 kN per design (characteristic) axle—see, e.g., [36,37]—which implies stresses under the tire in the order of hundreds of kPa and not thousands of kPa.
As a result, the standard cyclic CBR test generally does not meet the basic requirement for determining the deformation characteristics of unbound materials, which is to perform the test on intact specimens and optimally under stress conditions that correspond to the expected stress conditions of the material used in the pavement structure.

2.2. The Updated Cyclic CBR Test Proposed

Research has been initiated at the MENDELU University Brno to adapt the standard cyclic CBR test to perform tests on undamaged material specimens and, in particular, under stress conditions corresponding to the expected state of stress in a pavement structure. In contrast to the Dutch procedure, the applied loading force for repeated loadings is not determined in the first loading step by plunger penetration to the prescribed depth, but by the stress value that is expected in an actual pavement structure. This means that the applied loading force is not dependent on the penetration depth, but is defined by the plunger stress value. It should be noted that the material being tested may occur in different layers in the pavement structure and therefore may be subjected to different stress conditions. As a result, the same material should be tested under different stress conditions depending on the depth of its placement, so it may have a different resilient modulus, as the plunger stress value may vary. In our analysis, the plunger stress value was set to 210 kPa.
To determine the plunger stress value acting on a material, and thus the loading force value for cyclic loading, the Finite Element Method (FEM) is currently the only correct method [4,38,39,40]. A commonly used assumption about the angle of stress propagation α = 45 ° is not fully correct for the stress distribution in pavement structures. A typical example of stress distribution in pavement structures is shown in Figure 1, which clearly demonstrates that the stress distribution differs from an angle of 45 ° . The displayed stresses, both vertical and horizontal, were obtained in a study [40] that used a non-linear FEM model respecting the actual behavior of the unbound materials forming the individual pavement layers [39].
To calculate the resilient modulus, the following equation is used [34]:
M r = C 1 ( 1 μ C 2 ) σ 0 a w C 3
where
M r = resilient modulus estimate of the material tested (MPa),
w = elastic deformation (mm),
a = radius of the circular plunger (mm),
σ 0 = stress under the plunger (kPa),
µ = Poisson’s ratio of the material tested,
C 1 = 1.5865,
C 2 = 1.0875, and
C 3 = 1.0920.

2.3. Study Area, Soil Sampling, and Specimen Preparation

The soil samples for testing were collected from the subgrade active zone at a depth of 500 mm from a total of 11 forest roads in order to include as wide a range of subgrade soils according to USCS classifications [13,14] as possible. The forest roads built in different geological environments from different regions of the Czech Republic were included in the analysis [15,31]. Soil samples were collected at locations where a low load-bearing capacity of the subgrade was expected. A total of 40 samples were collected. Six specimens were prepared from each sample, i.e., a total of 240 specimens were prepared for the corresponding updated cyclic CBR test for the determination of the Mr value. The specimens were conditioned to an optimum moisture content and the maximum dry density according to standard CSN EN ISO 17892-1 [41]. They were compacted into the CBR test mold with a diameter of 152 mm and a height of 117 mm using the Proctor standard energy according to standard CSN EN ISO 13286-2 [17].

2.4. Geotechnical Analysis

Geotechnical tests necessary for the soil classification according to relevant European standards (EN standards) were performed for each sample. The geotechnical analyses consist of a humidity test according to standard CSN ISO/TS 17892-1 [41], a sieving and aerometry test according to standard CSN ISO/TS 17892-4 [42], and a consistency (plastic-liquid limit) or Atterberg limit test according to standard CSN ISO/TS 17892-12 [43]. These tests are used for basic soil classification based on their granulometric composition and Atterberg plastic-liquid limits. Soils were classified according to the Unified Soil Classification System (USCS) using CSN EN ISO 14689-1 [13] and CSN EN ISO 14688-2 [14] standards.
Geotechnical tests were carried out for all 40 soil samples. After completion of the geotechnical tests, the individual soil samples were classified into a total of nine soil types. The classification results, including the number of samples as well as specimens, and the mean values of maximum dry density and humidity are presented in Table 1.

2.5. Statistical Analysis

A total of 240 specimens taken from 40 soil samples belonging to nine soil types were tested, and Mr values were obtained. Each set of six Mr values was statistically analyzed. The set of Mr values for the whole soil type, consisting of all specimens belonging to that soil type, was also statistically evaluated. The number of samples, and therefore the number of specimens tested, was different for each soil type, depending on the number of samples taken from the soil type after its geotechnical classification (see Table 1). The following statistics were calculated for each data set: mean value, standard deviation, coefficient of variation, minimum and maximum values, and 0.05 and 0.95 quantiles [15].

3. Results

The Updated Cyclic CBR Test Results

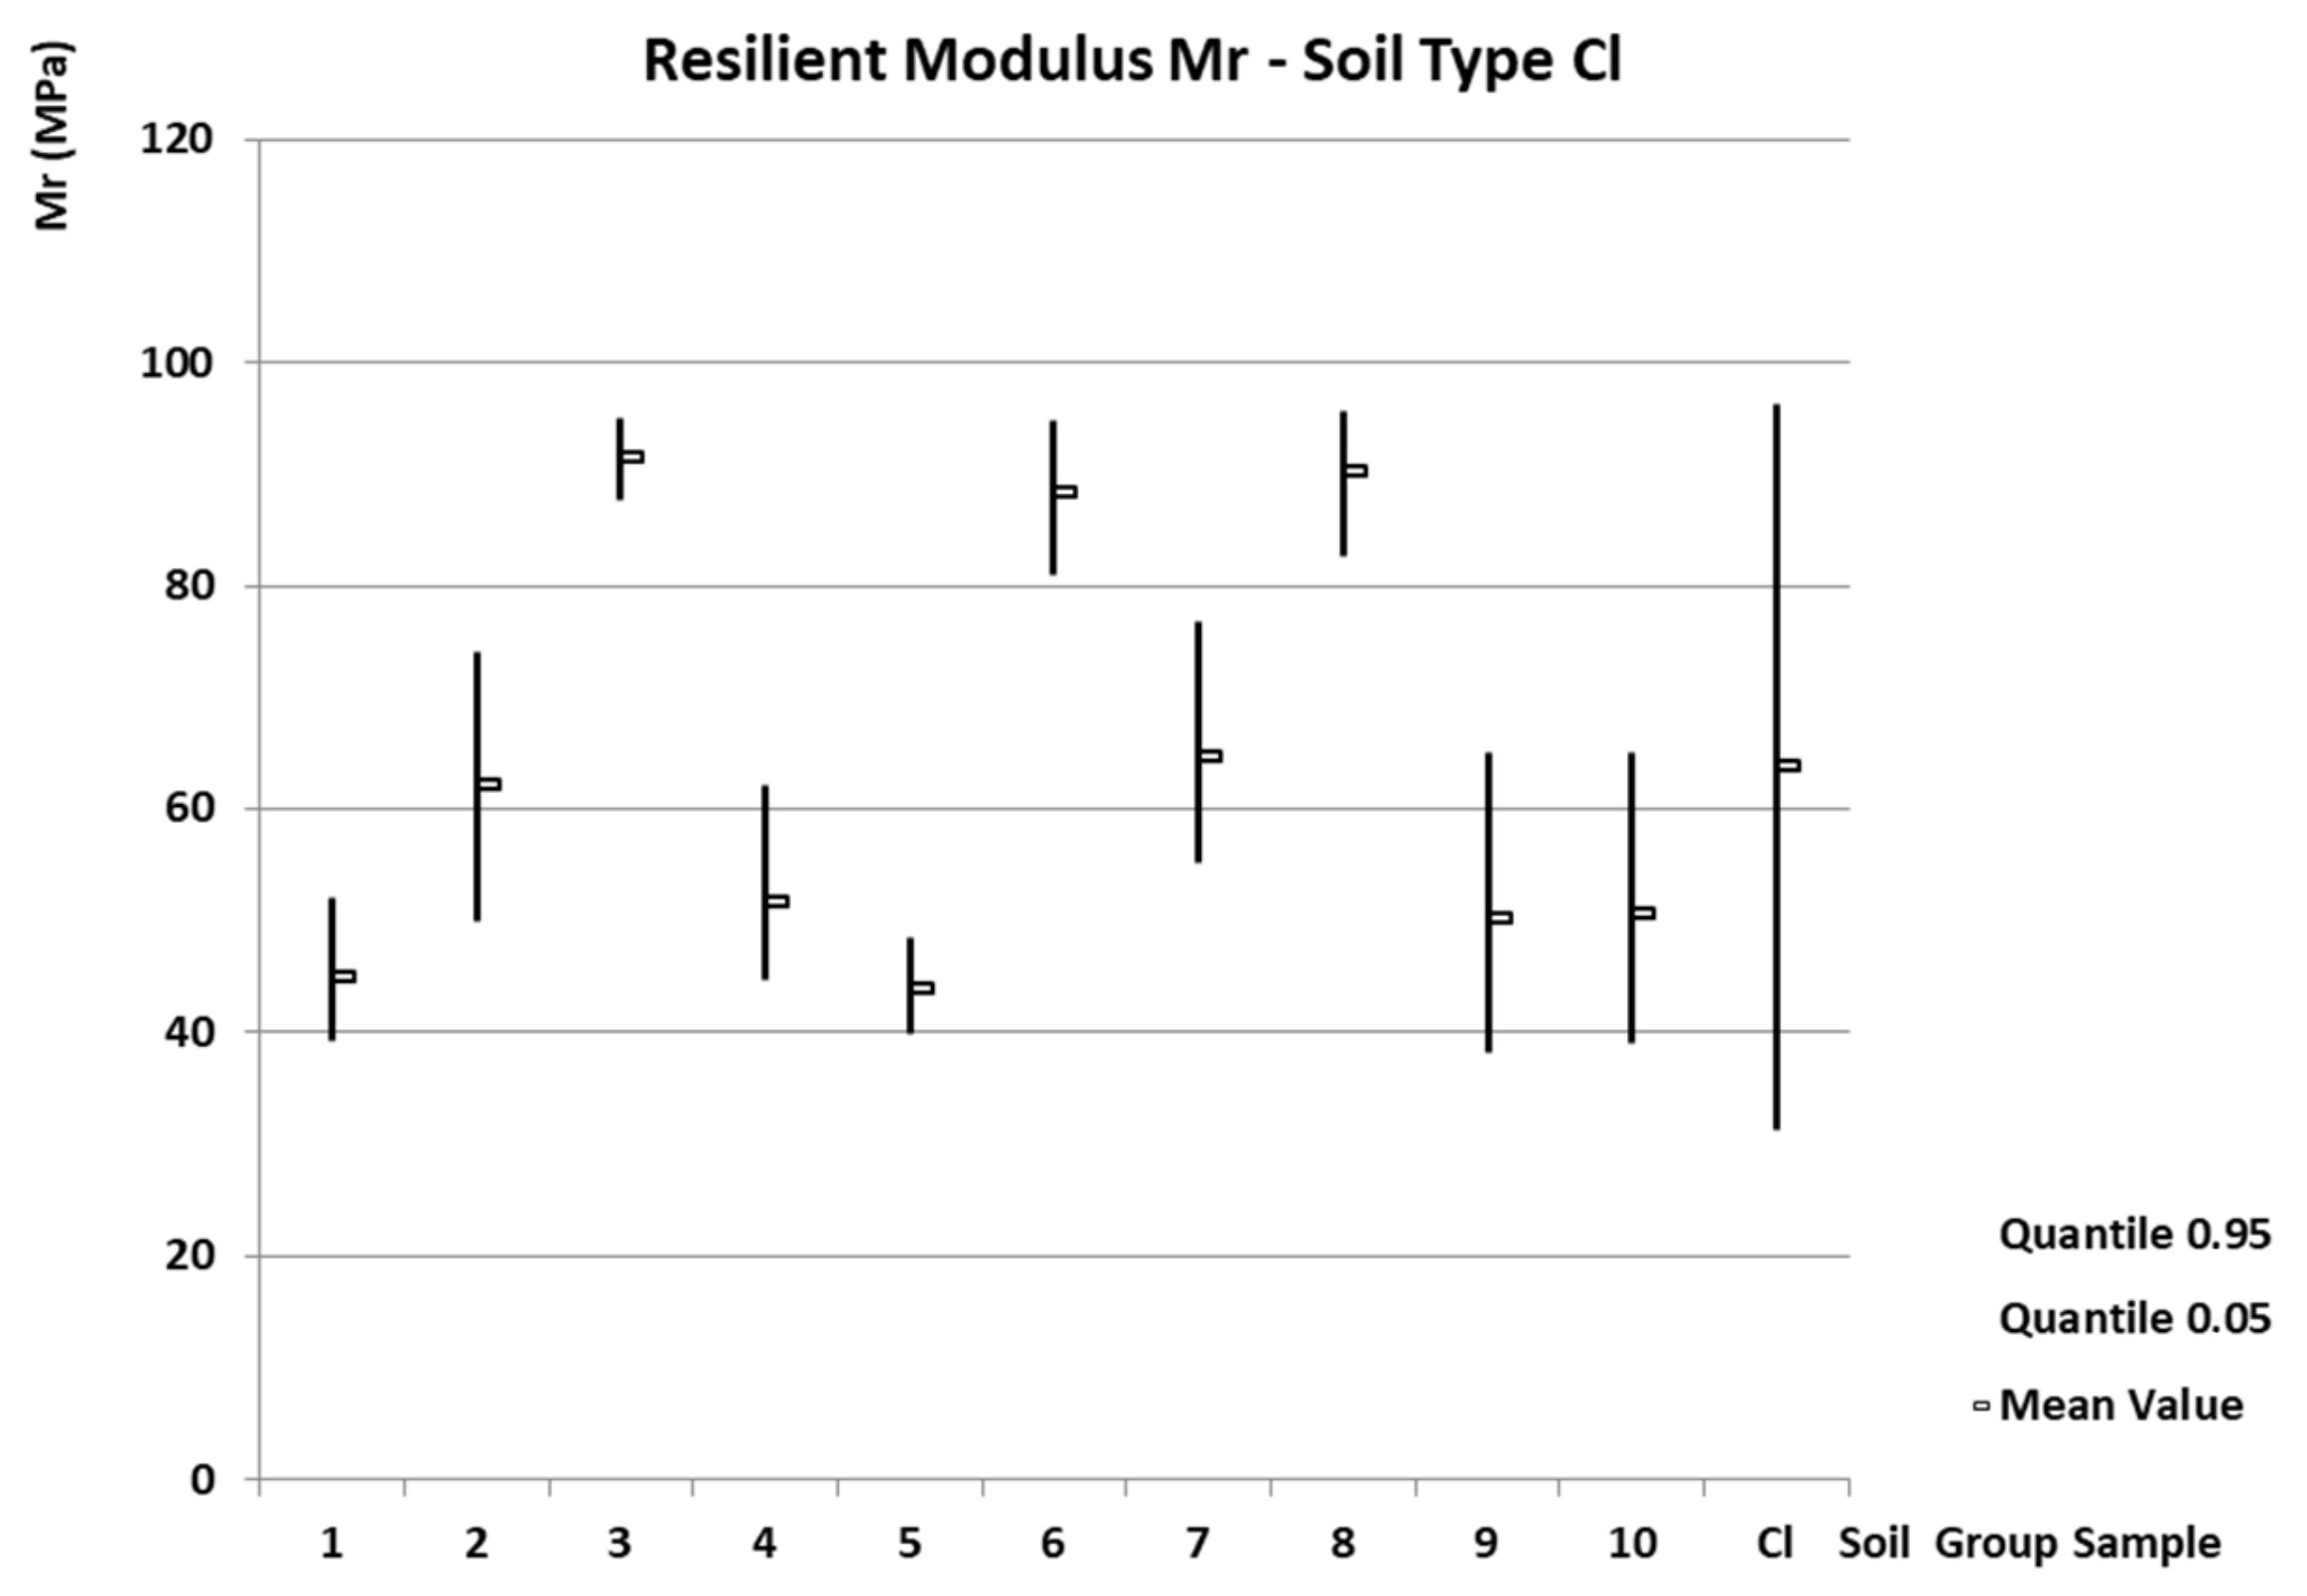
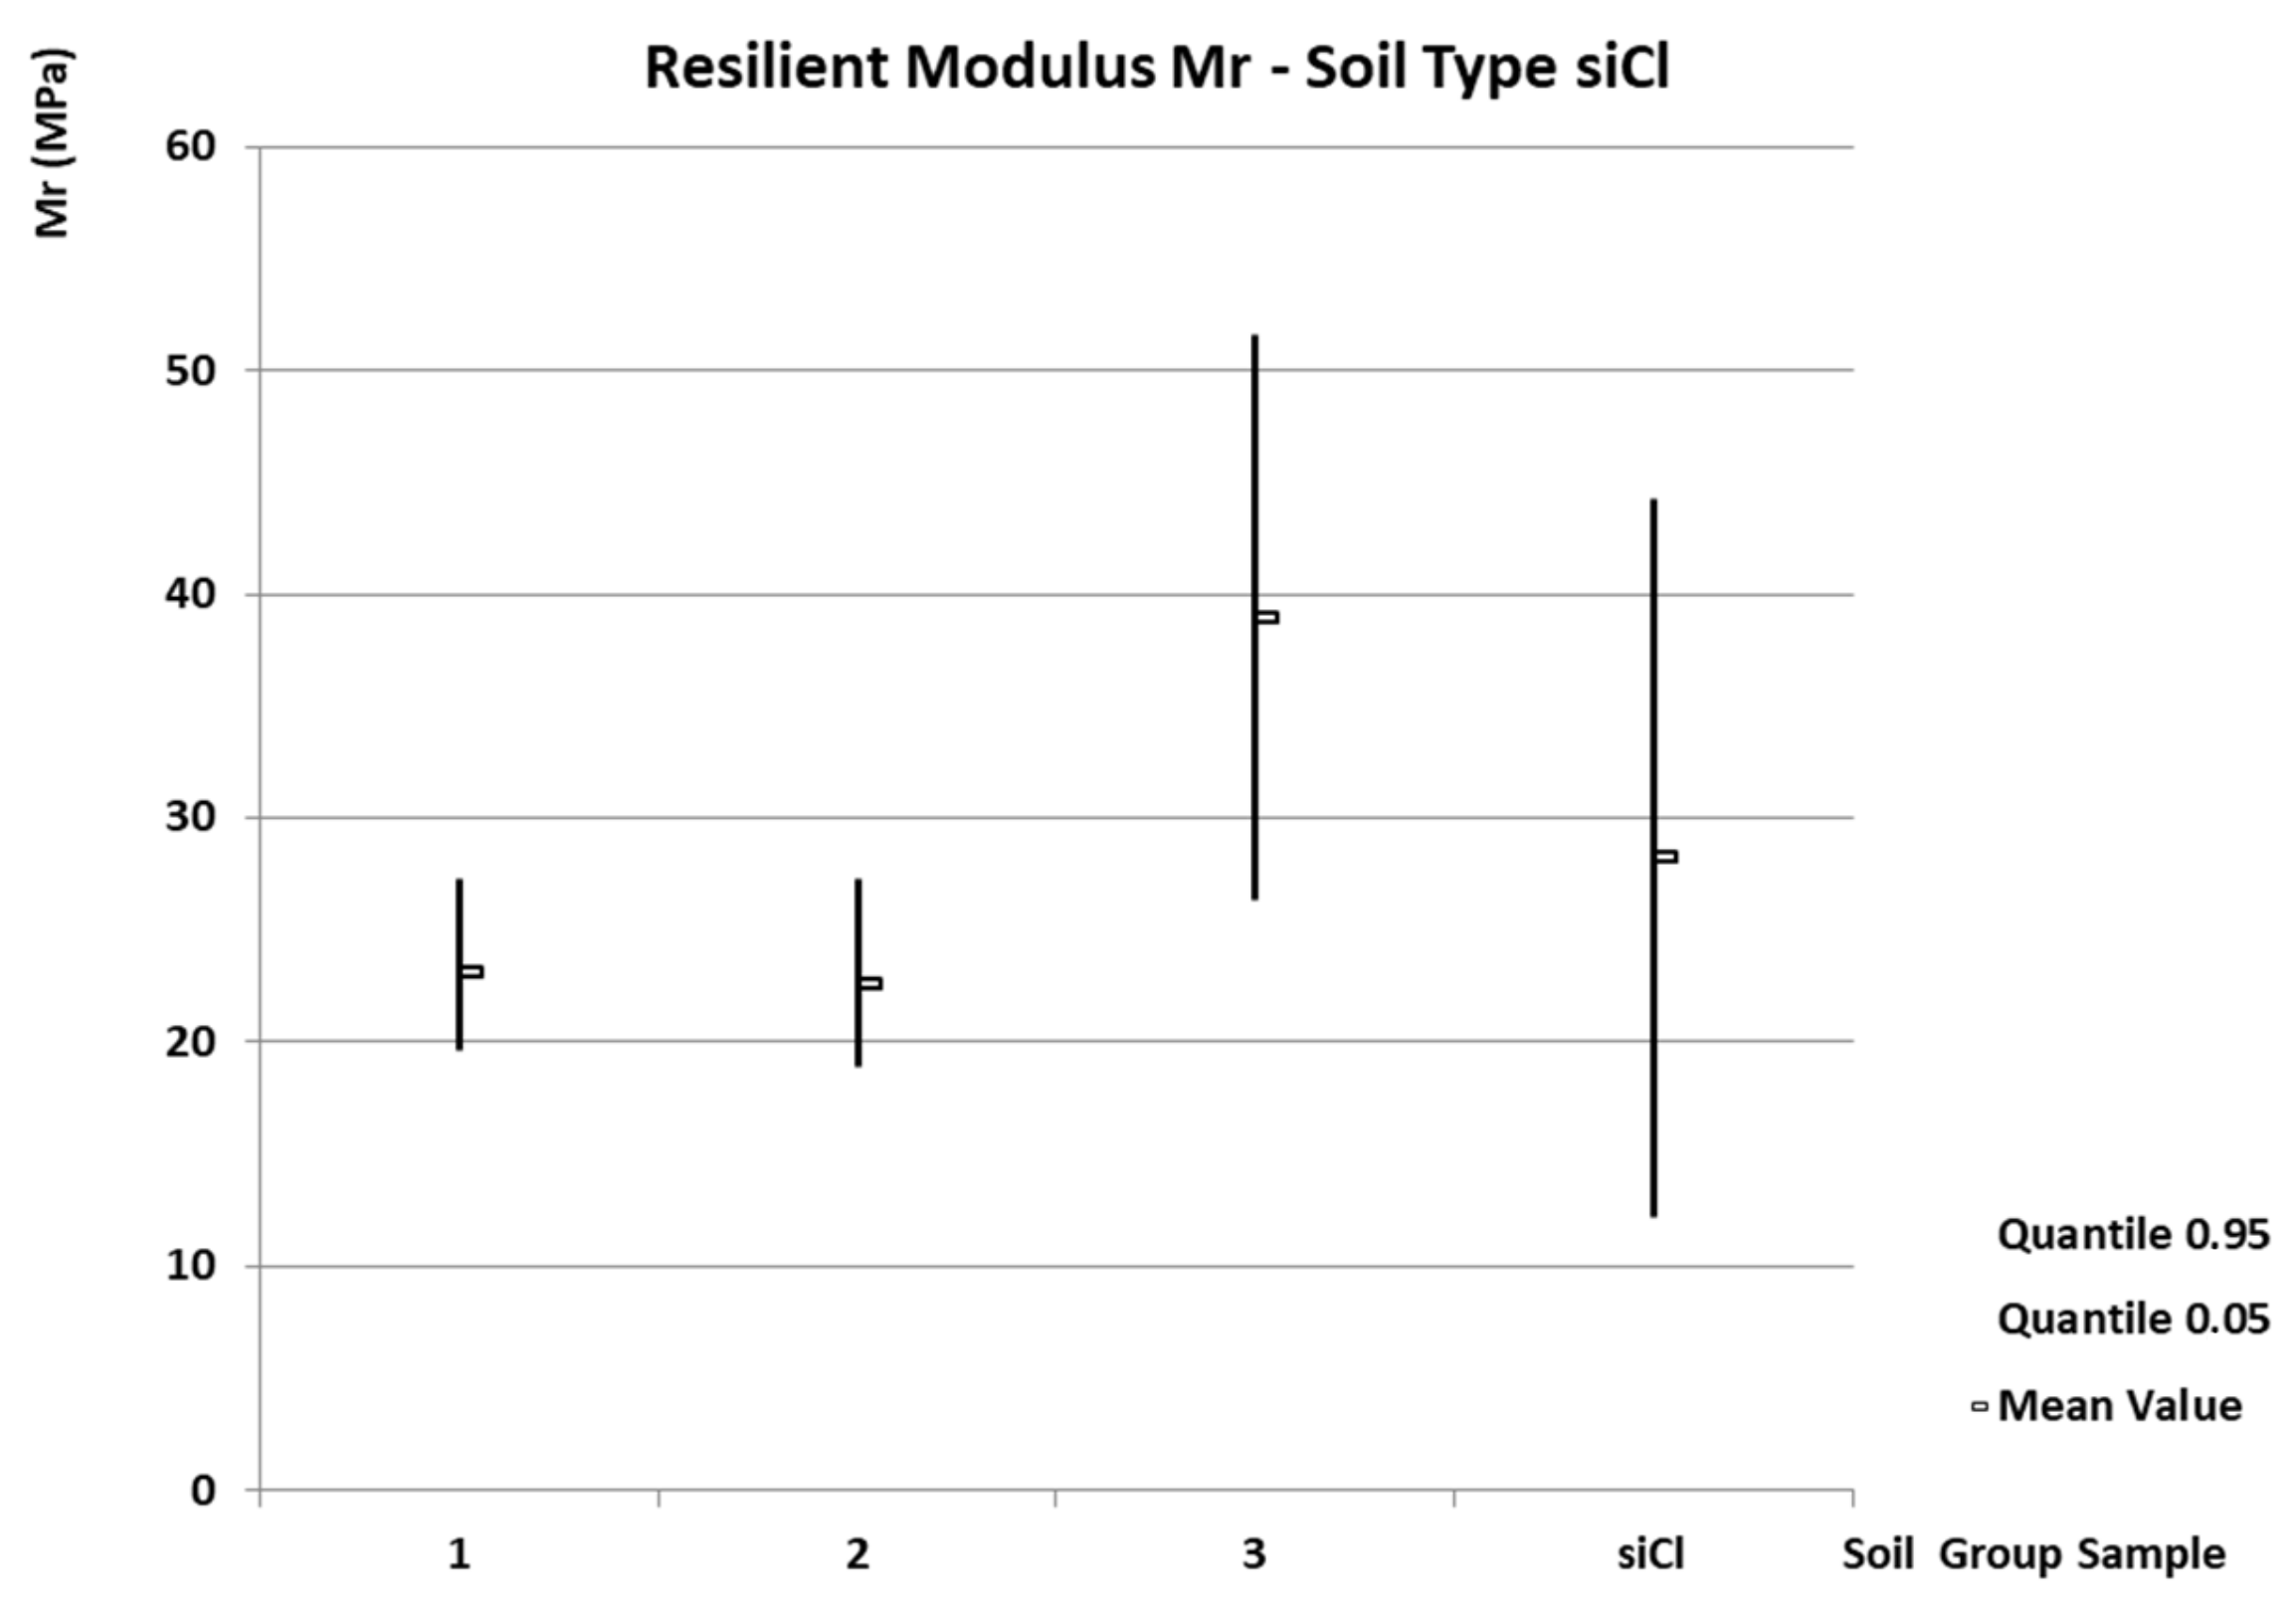
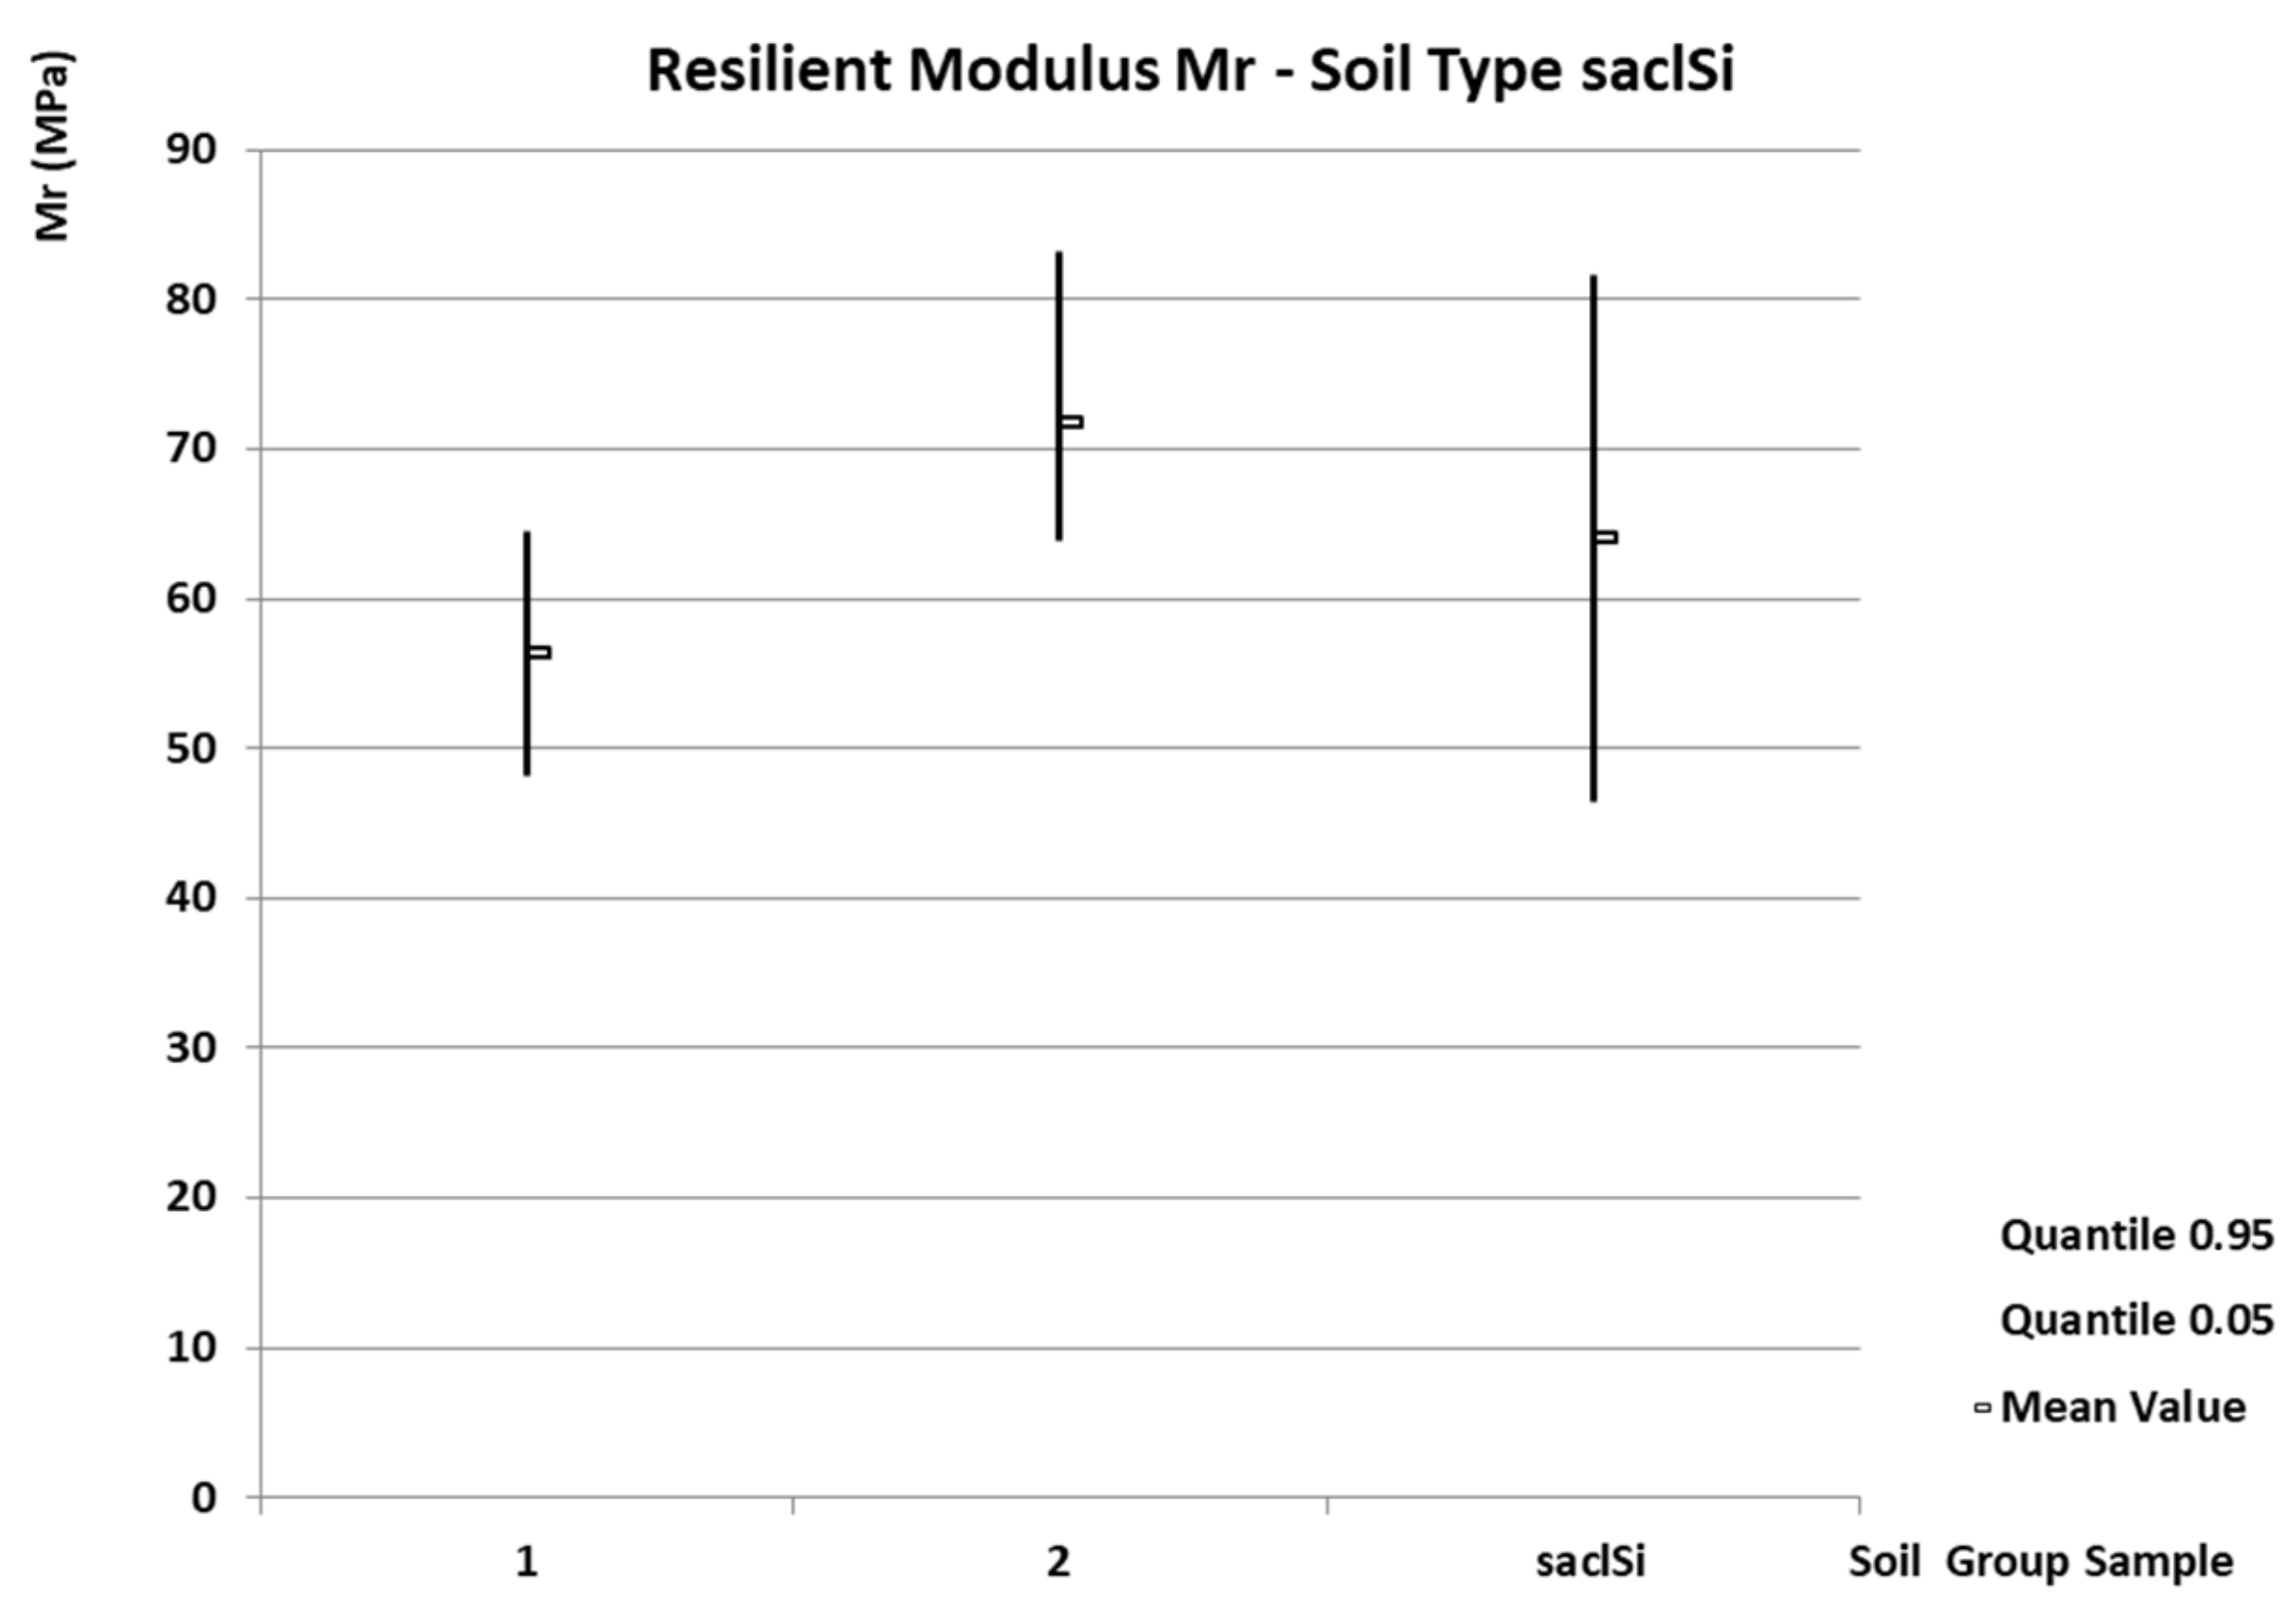
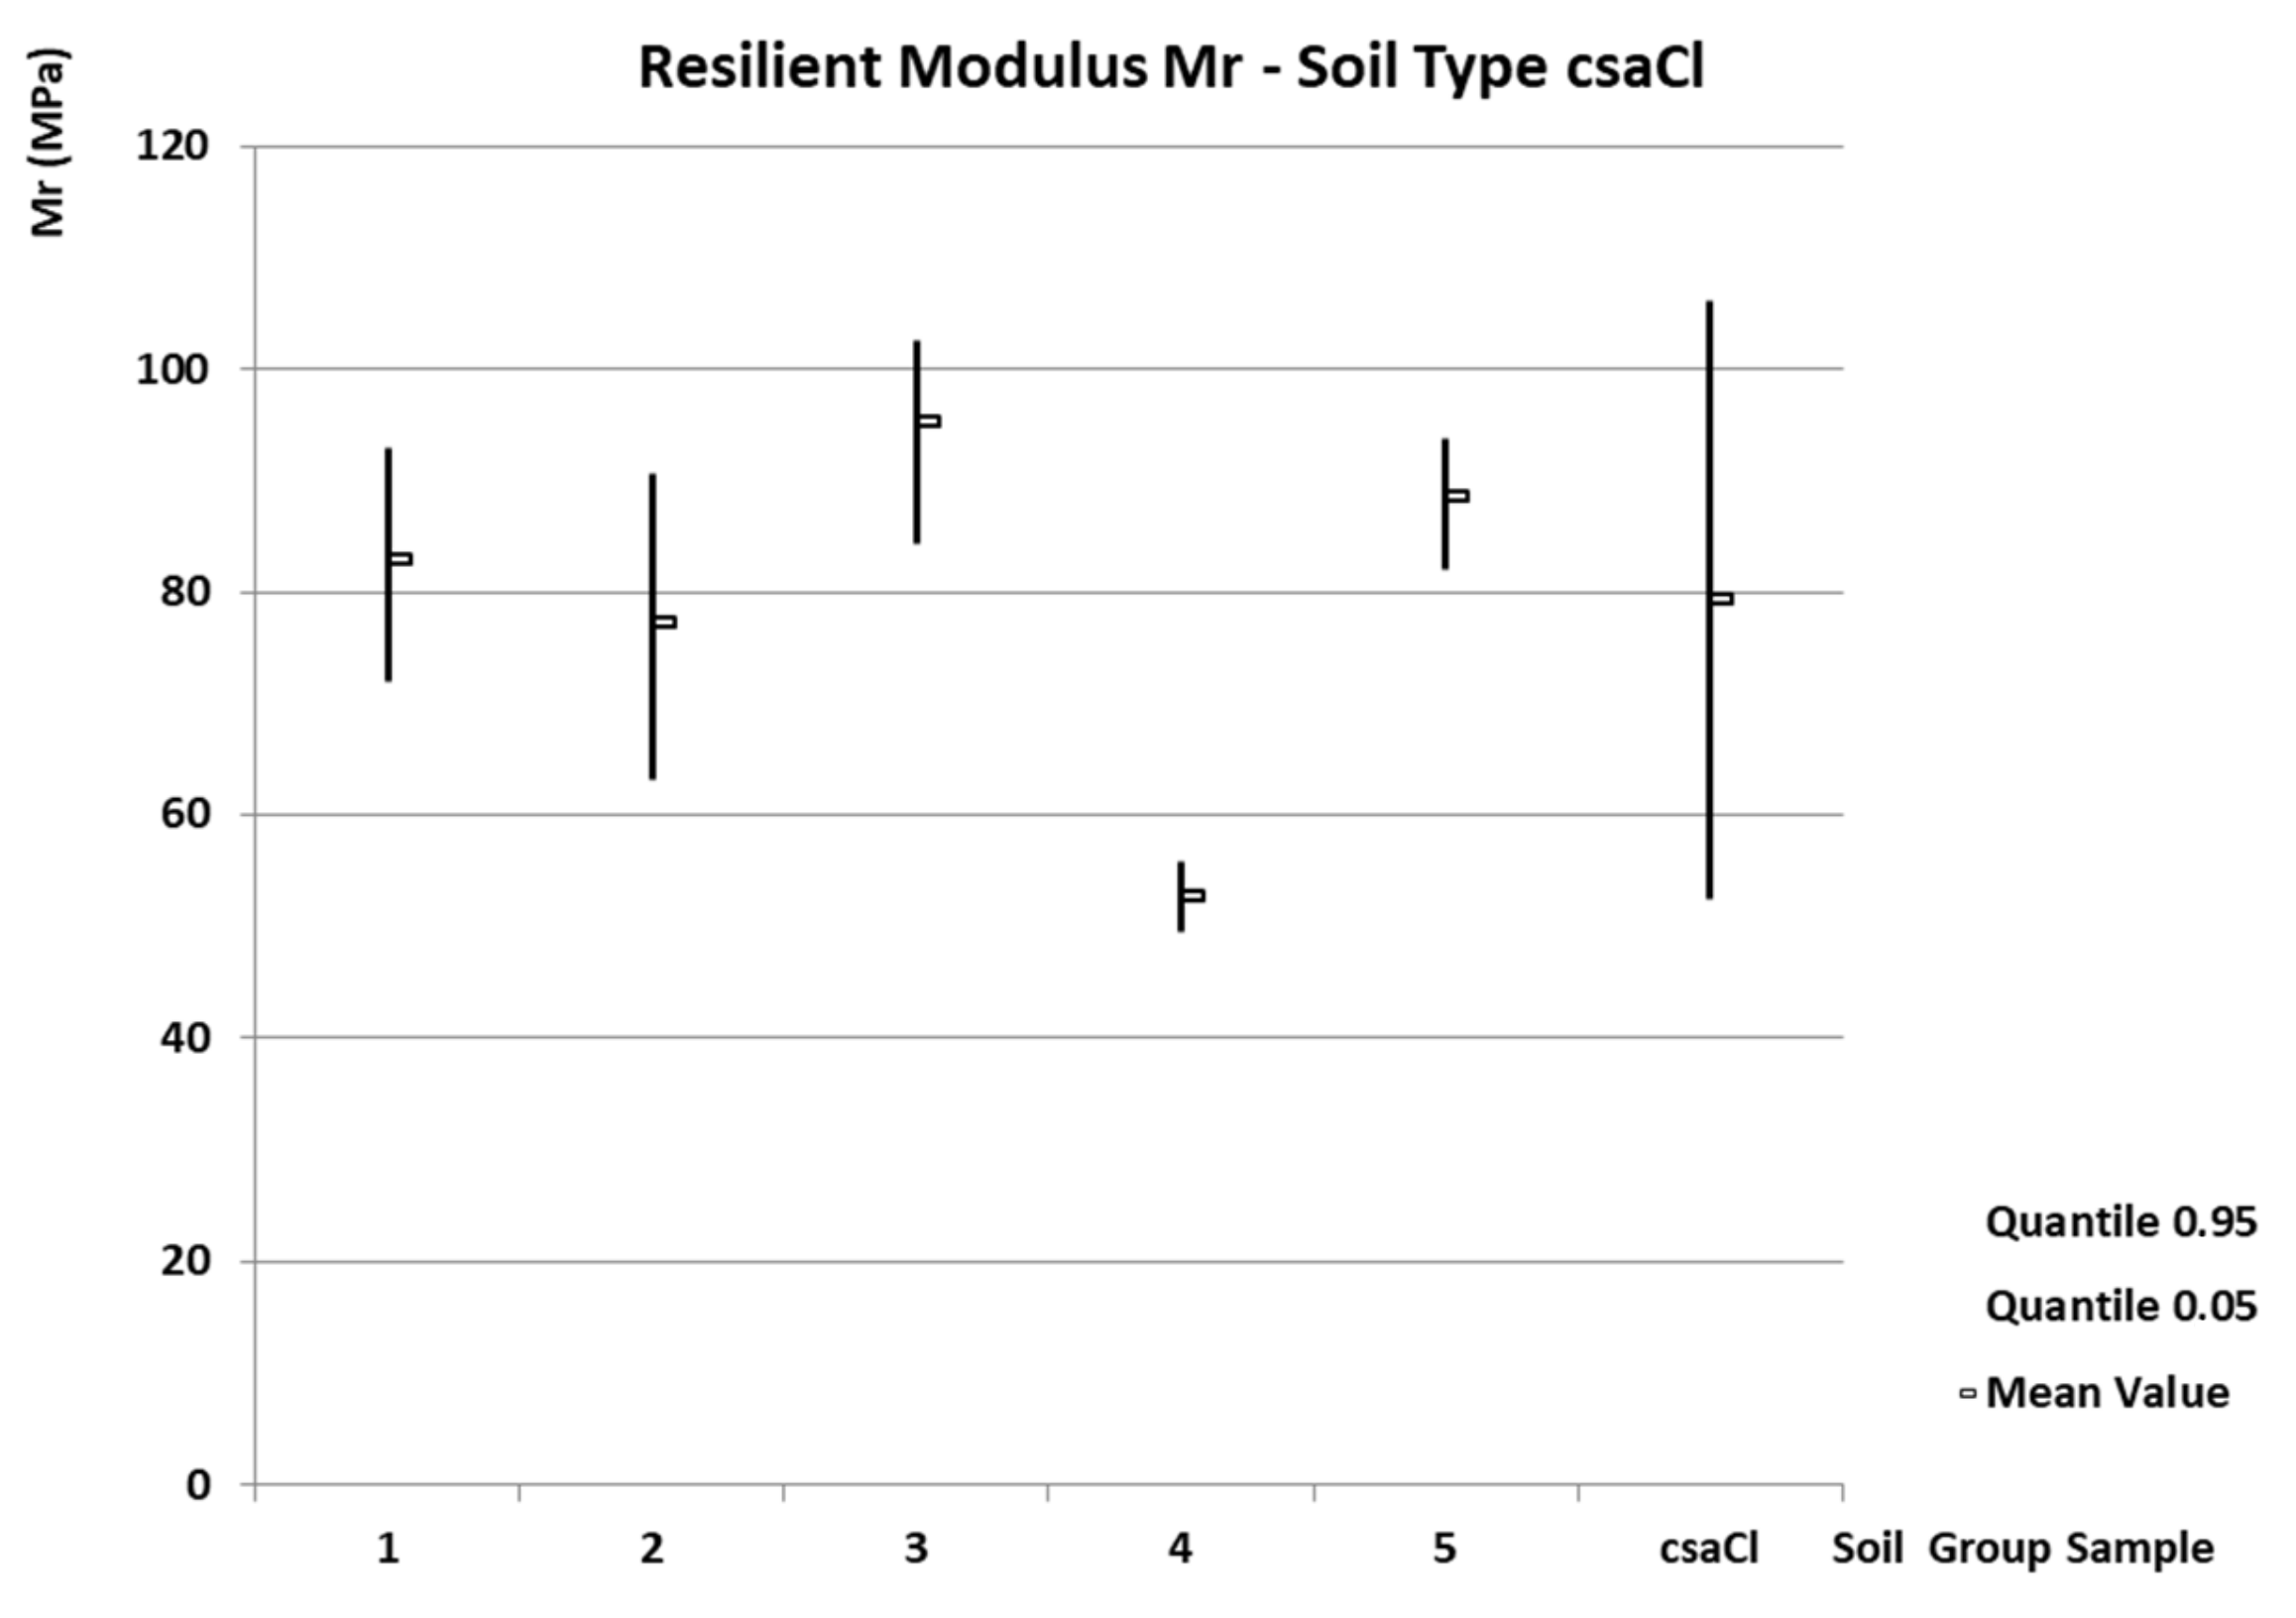
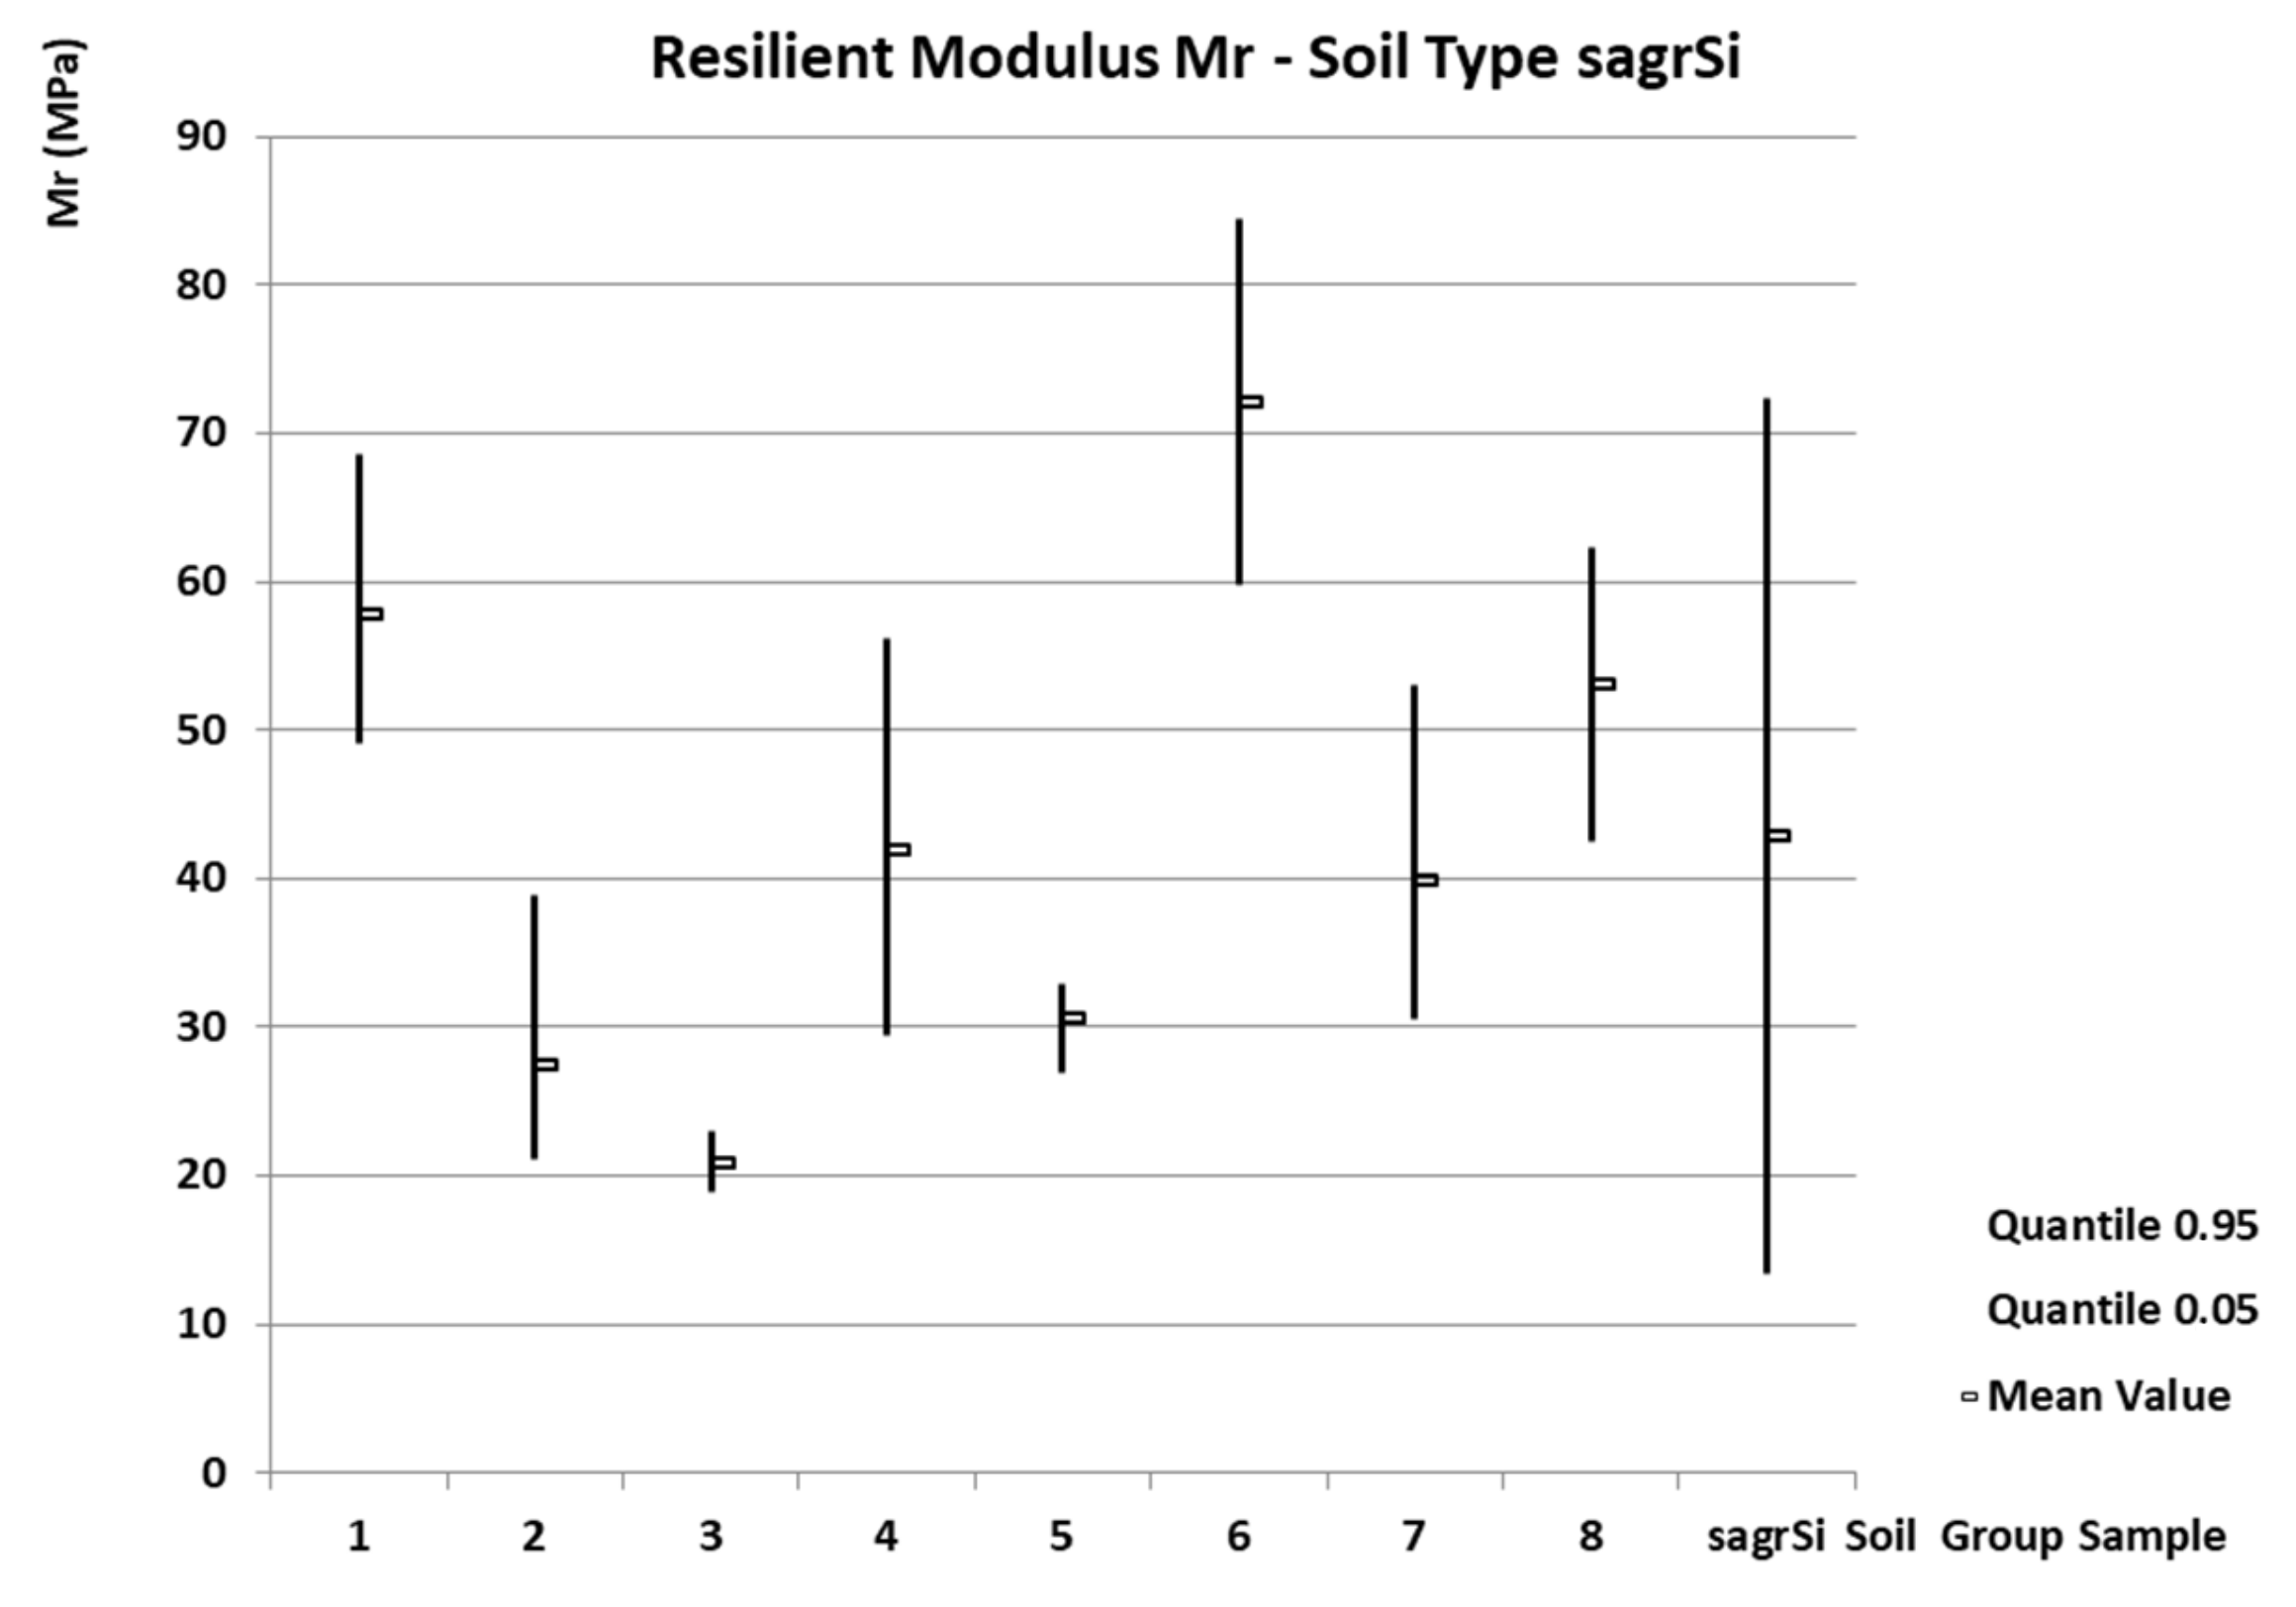
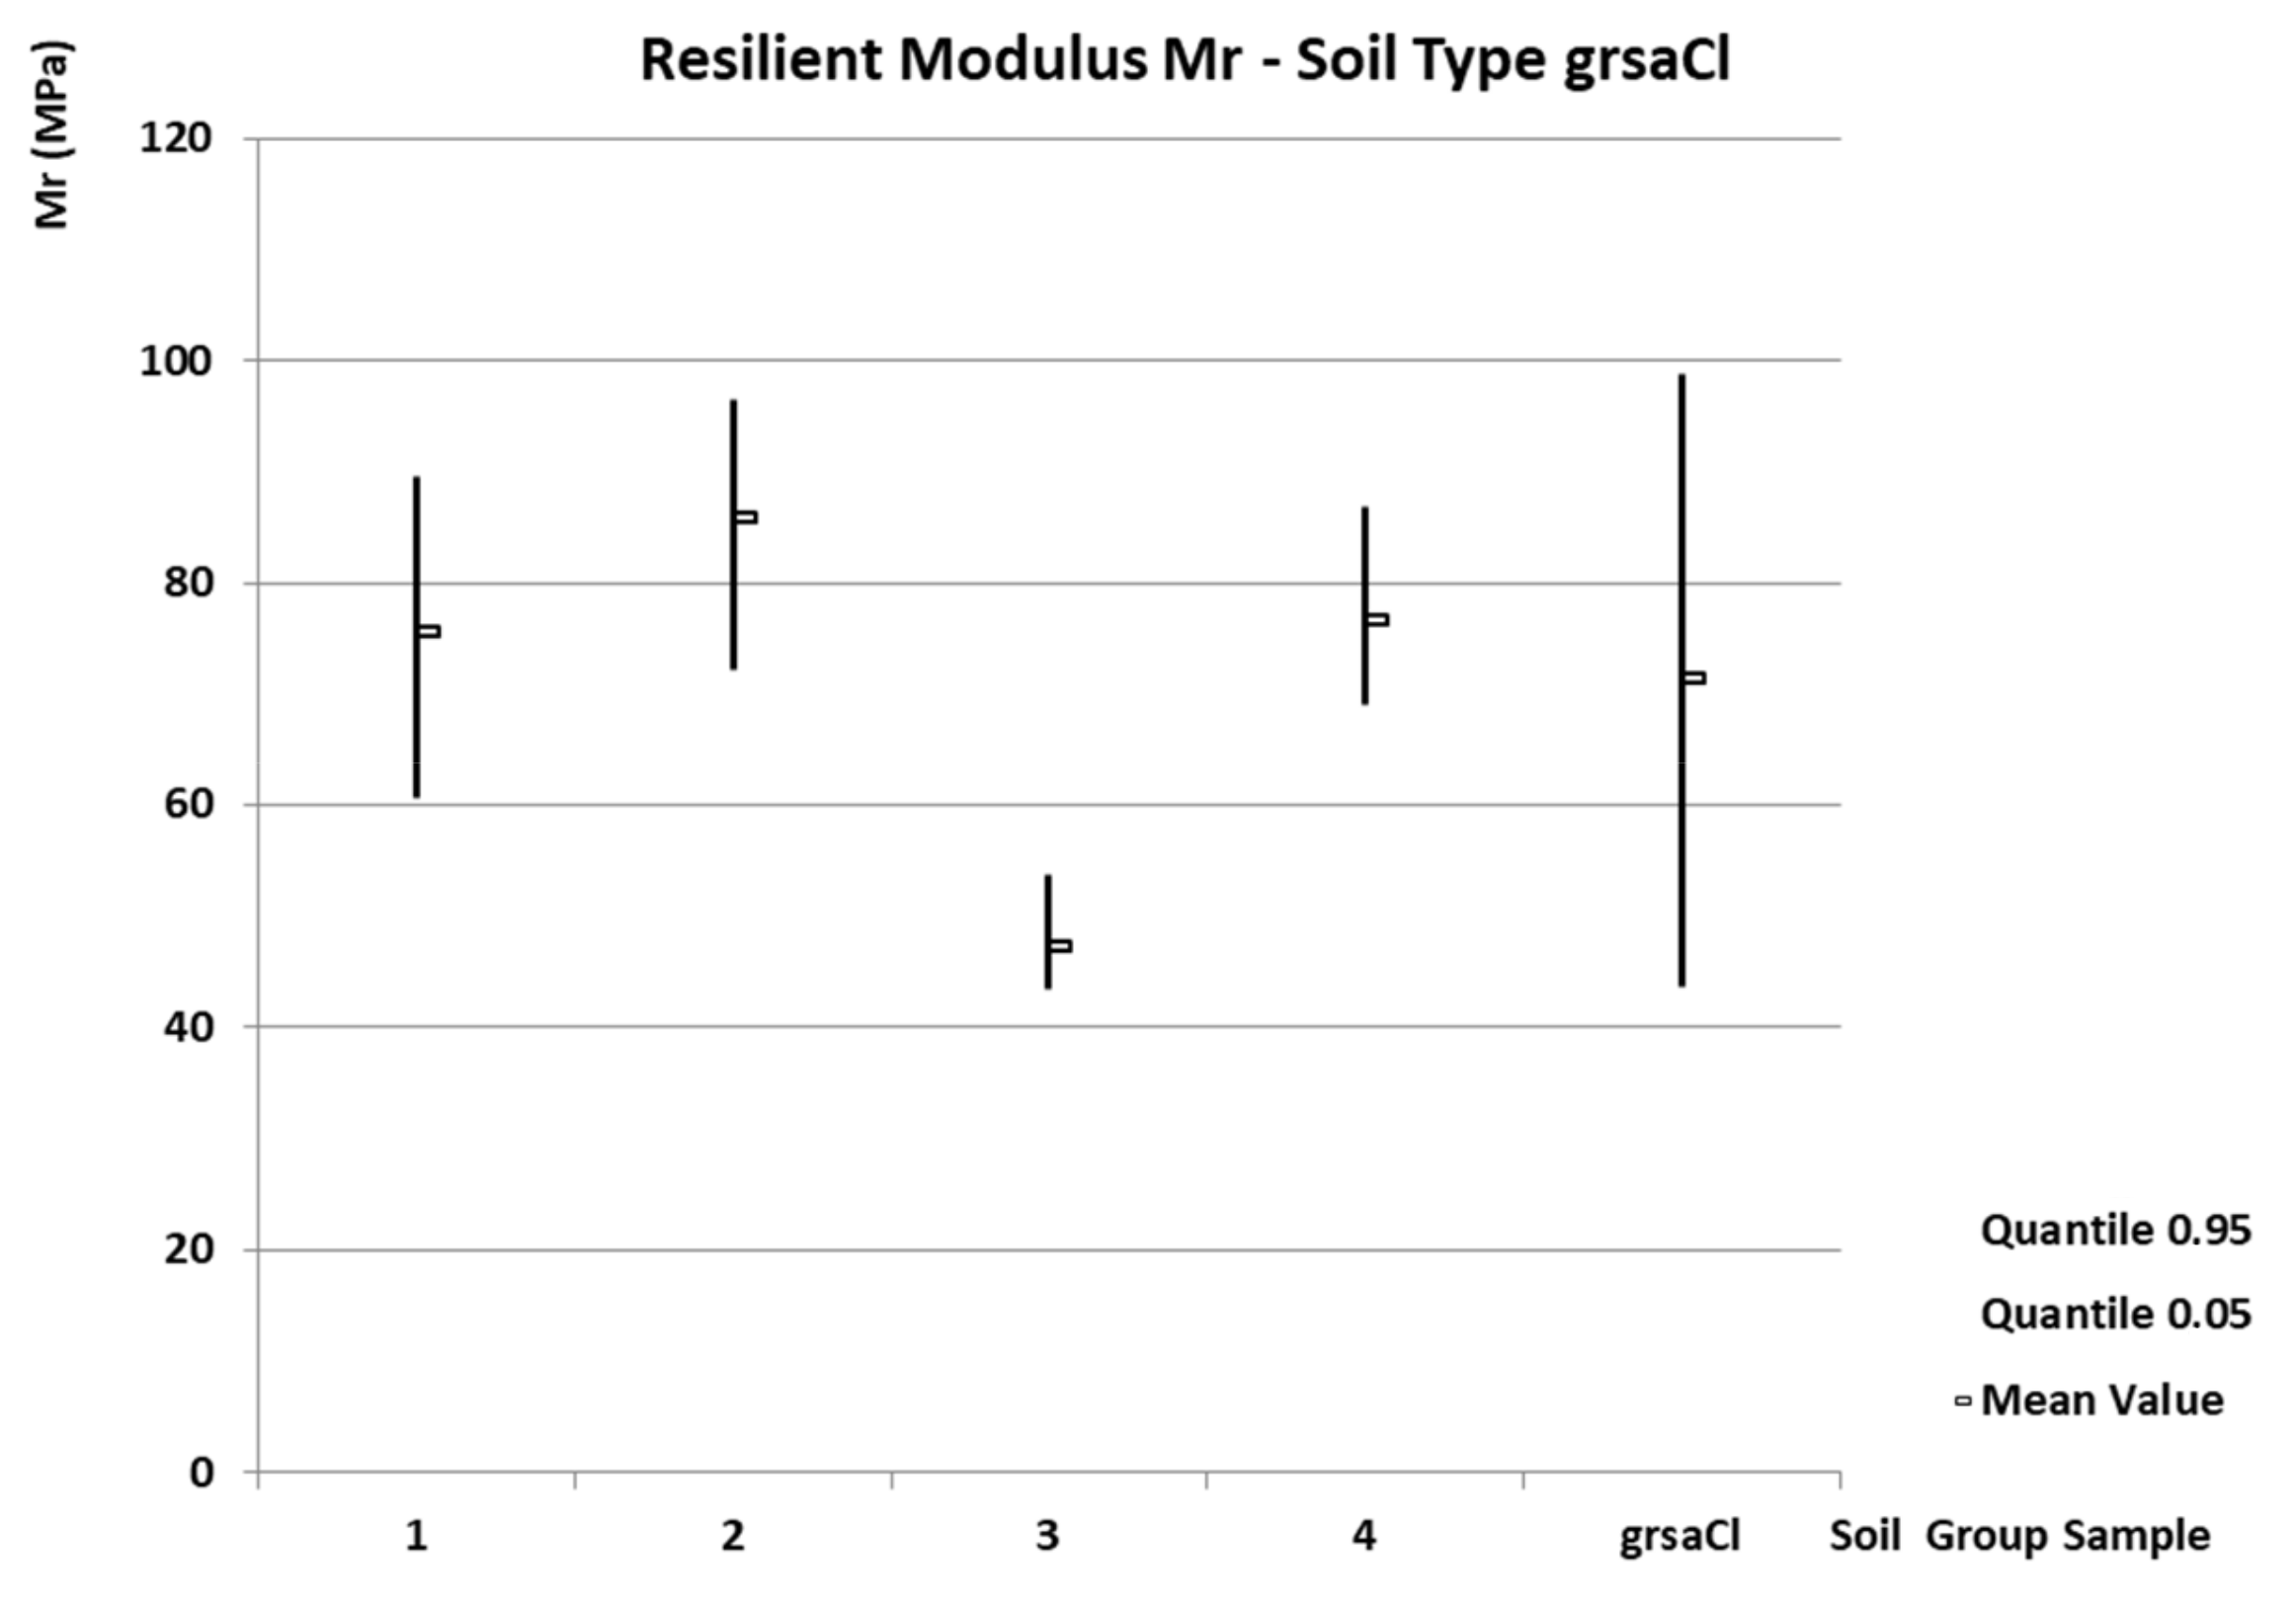
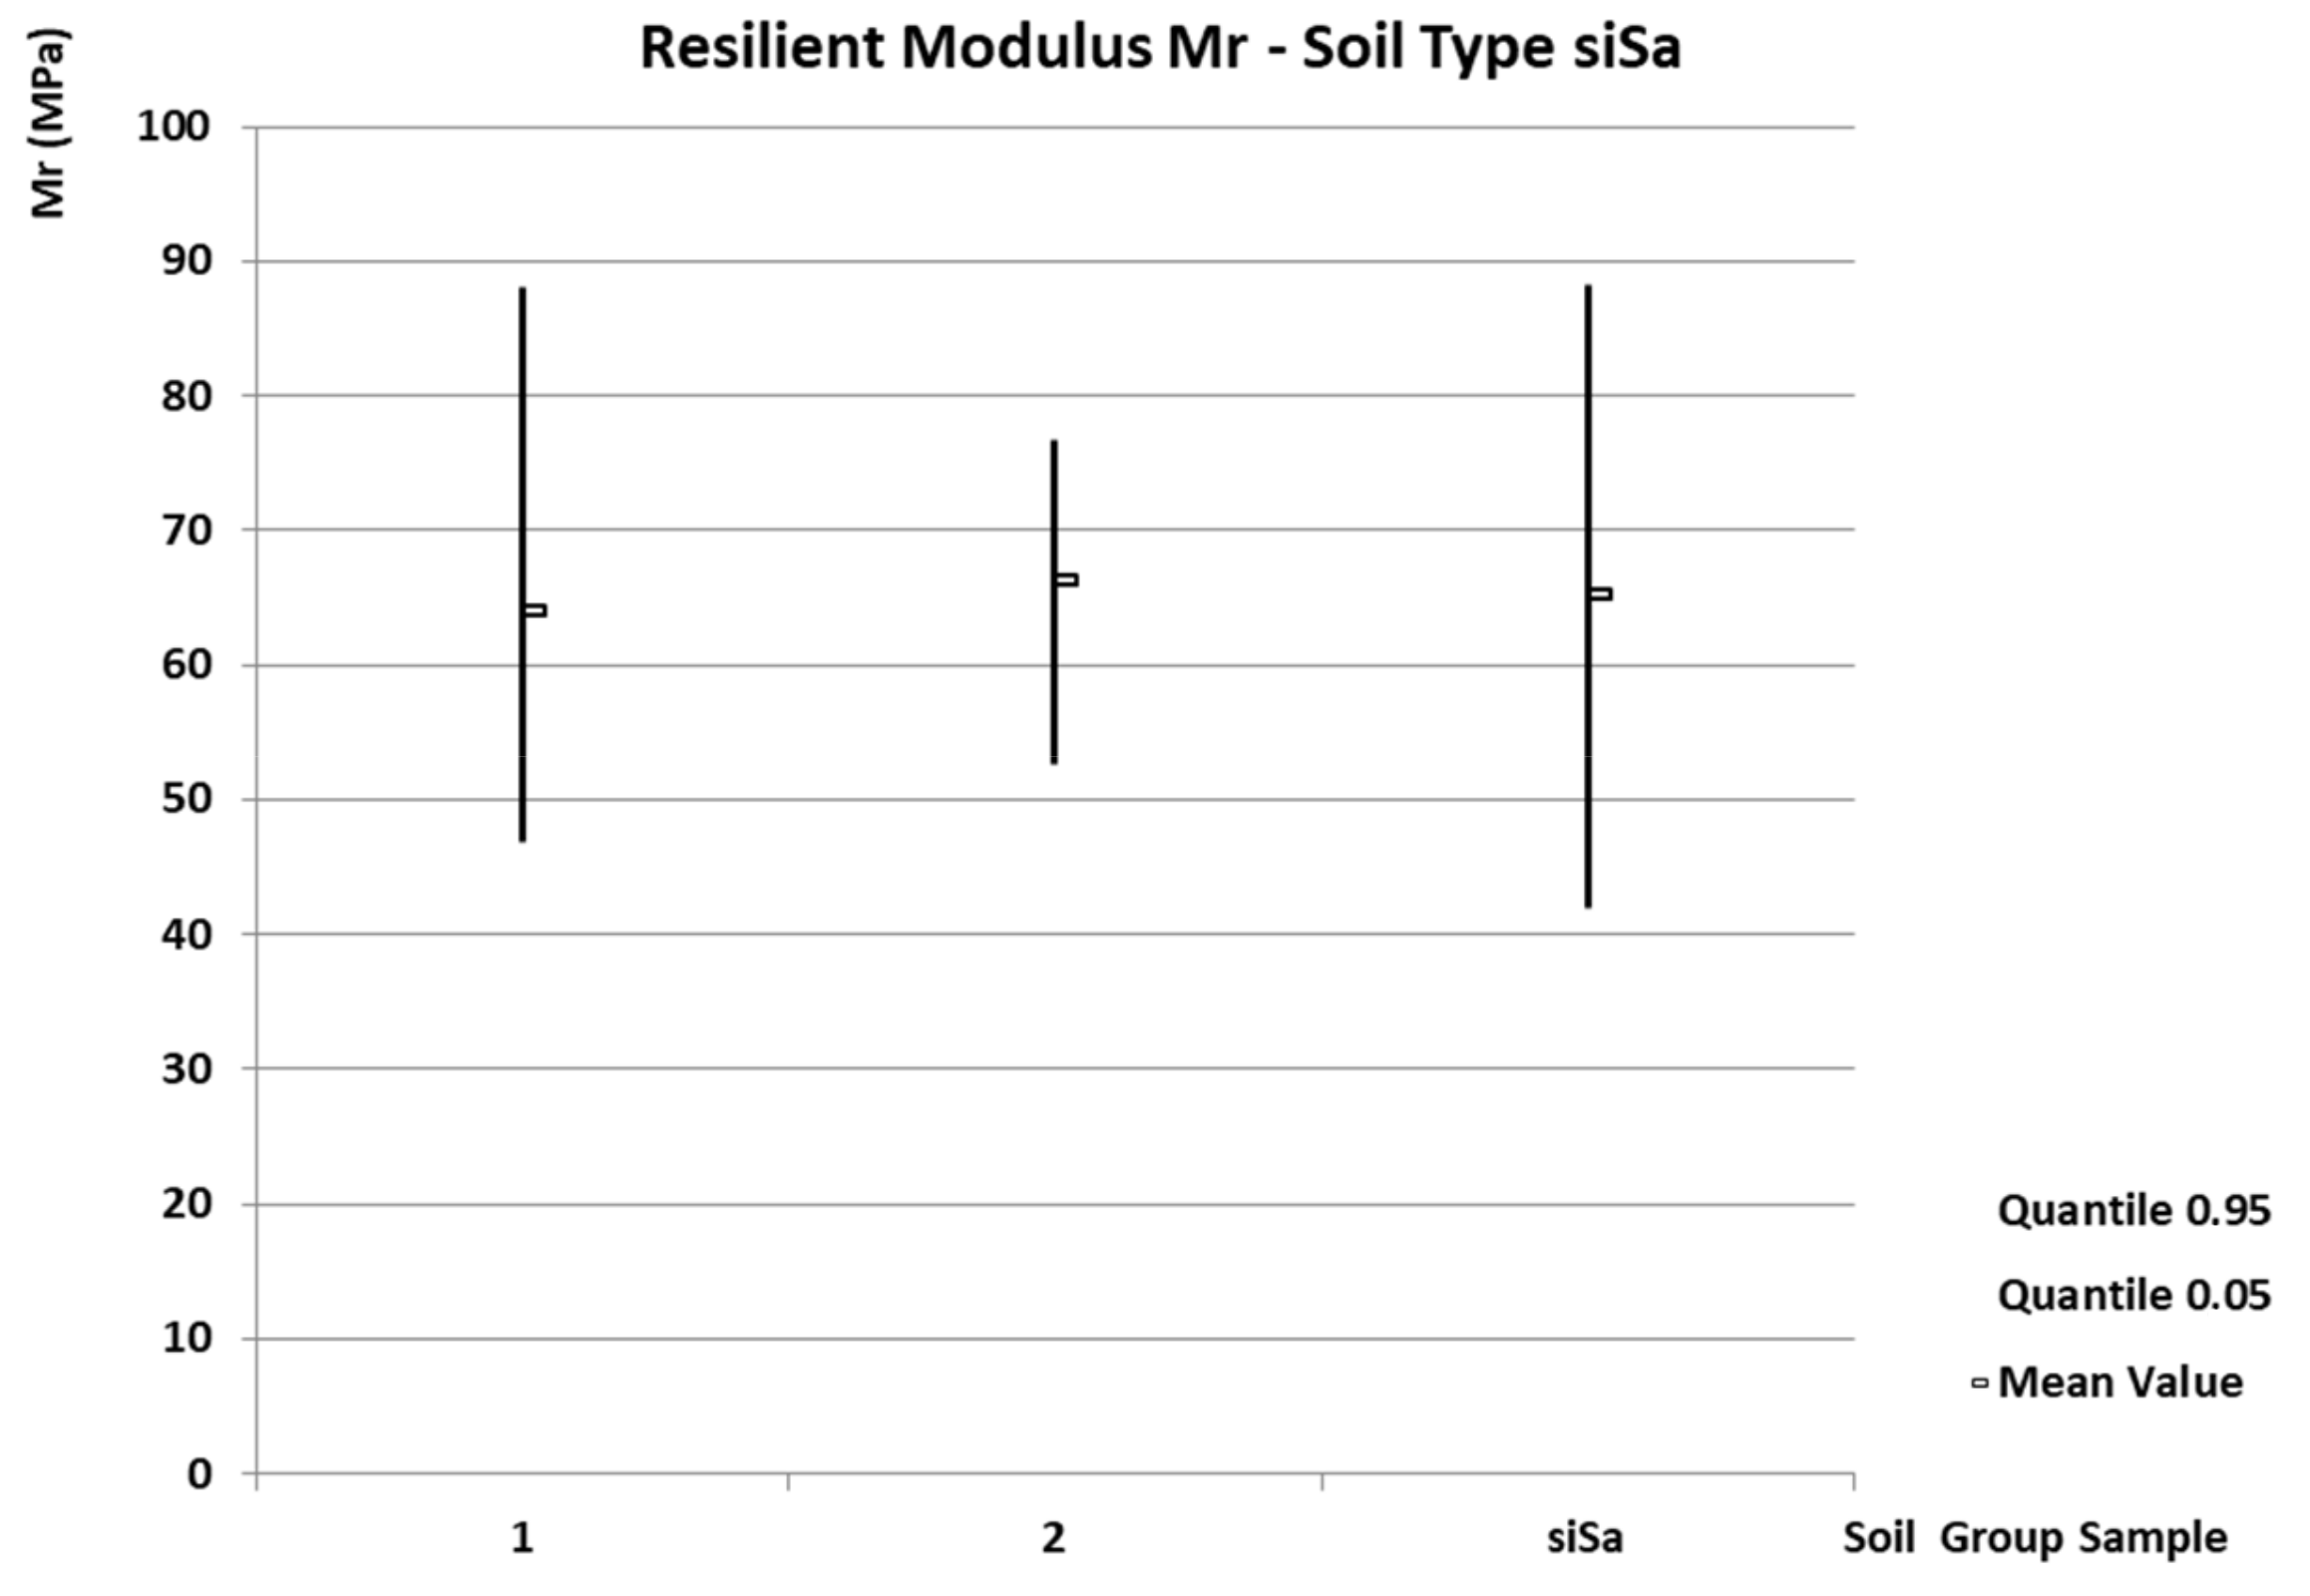
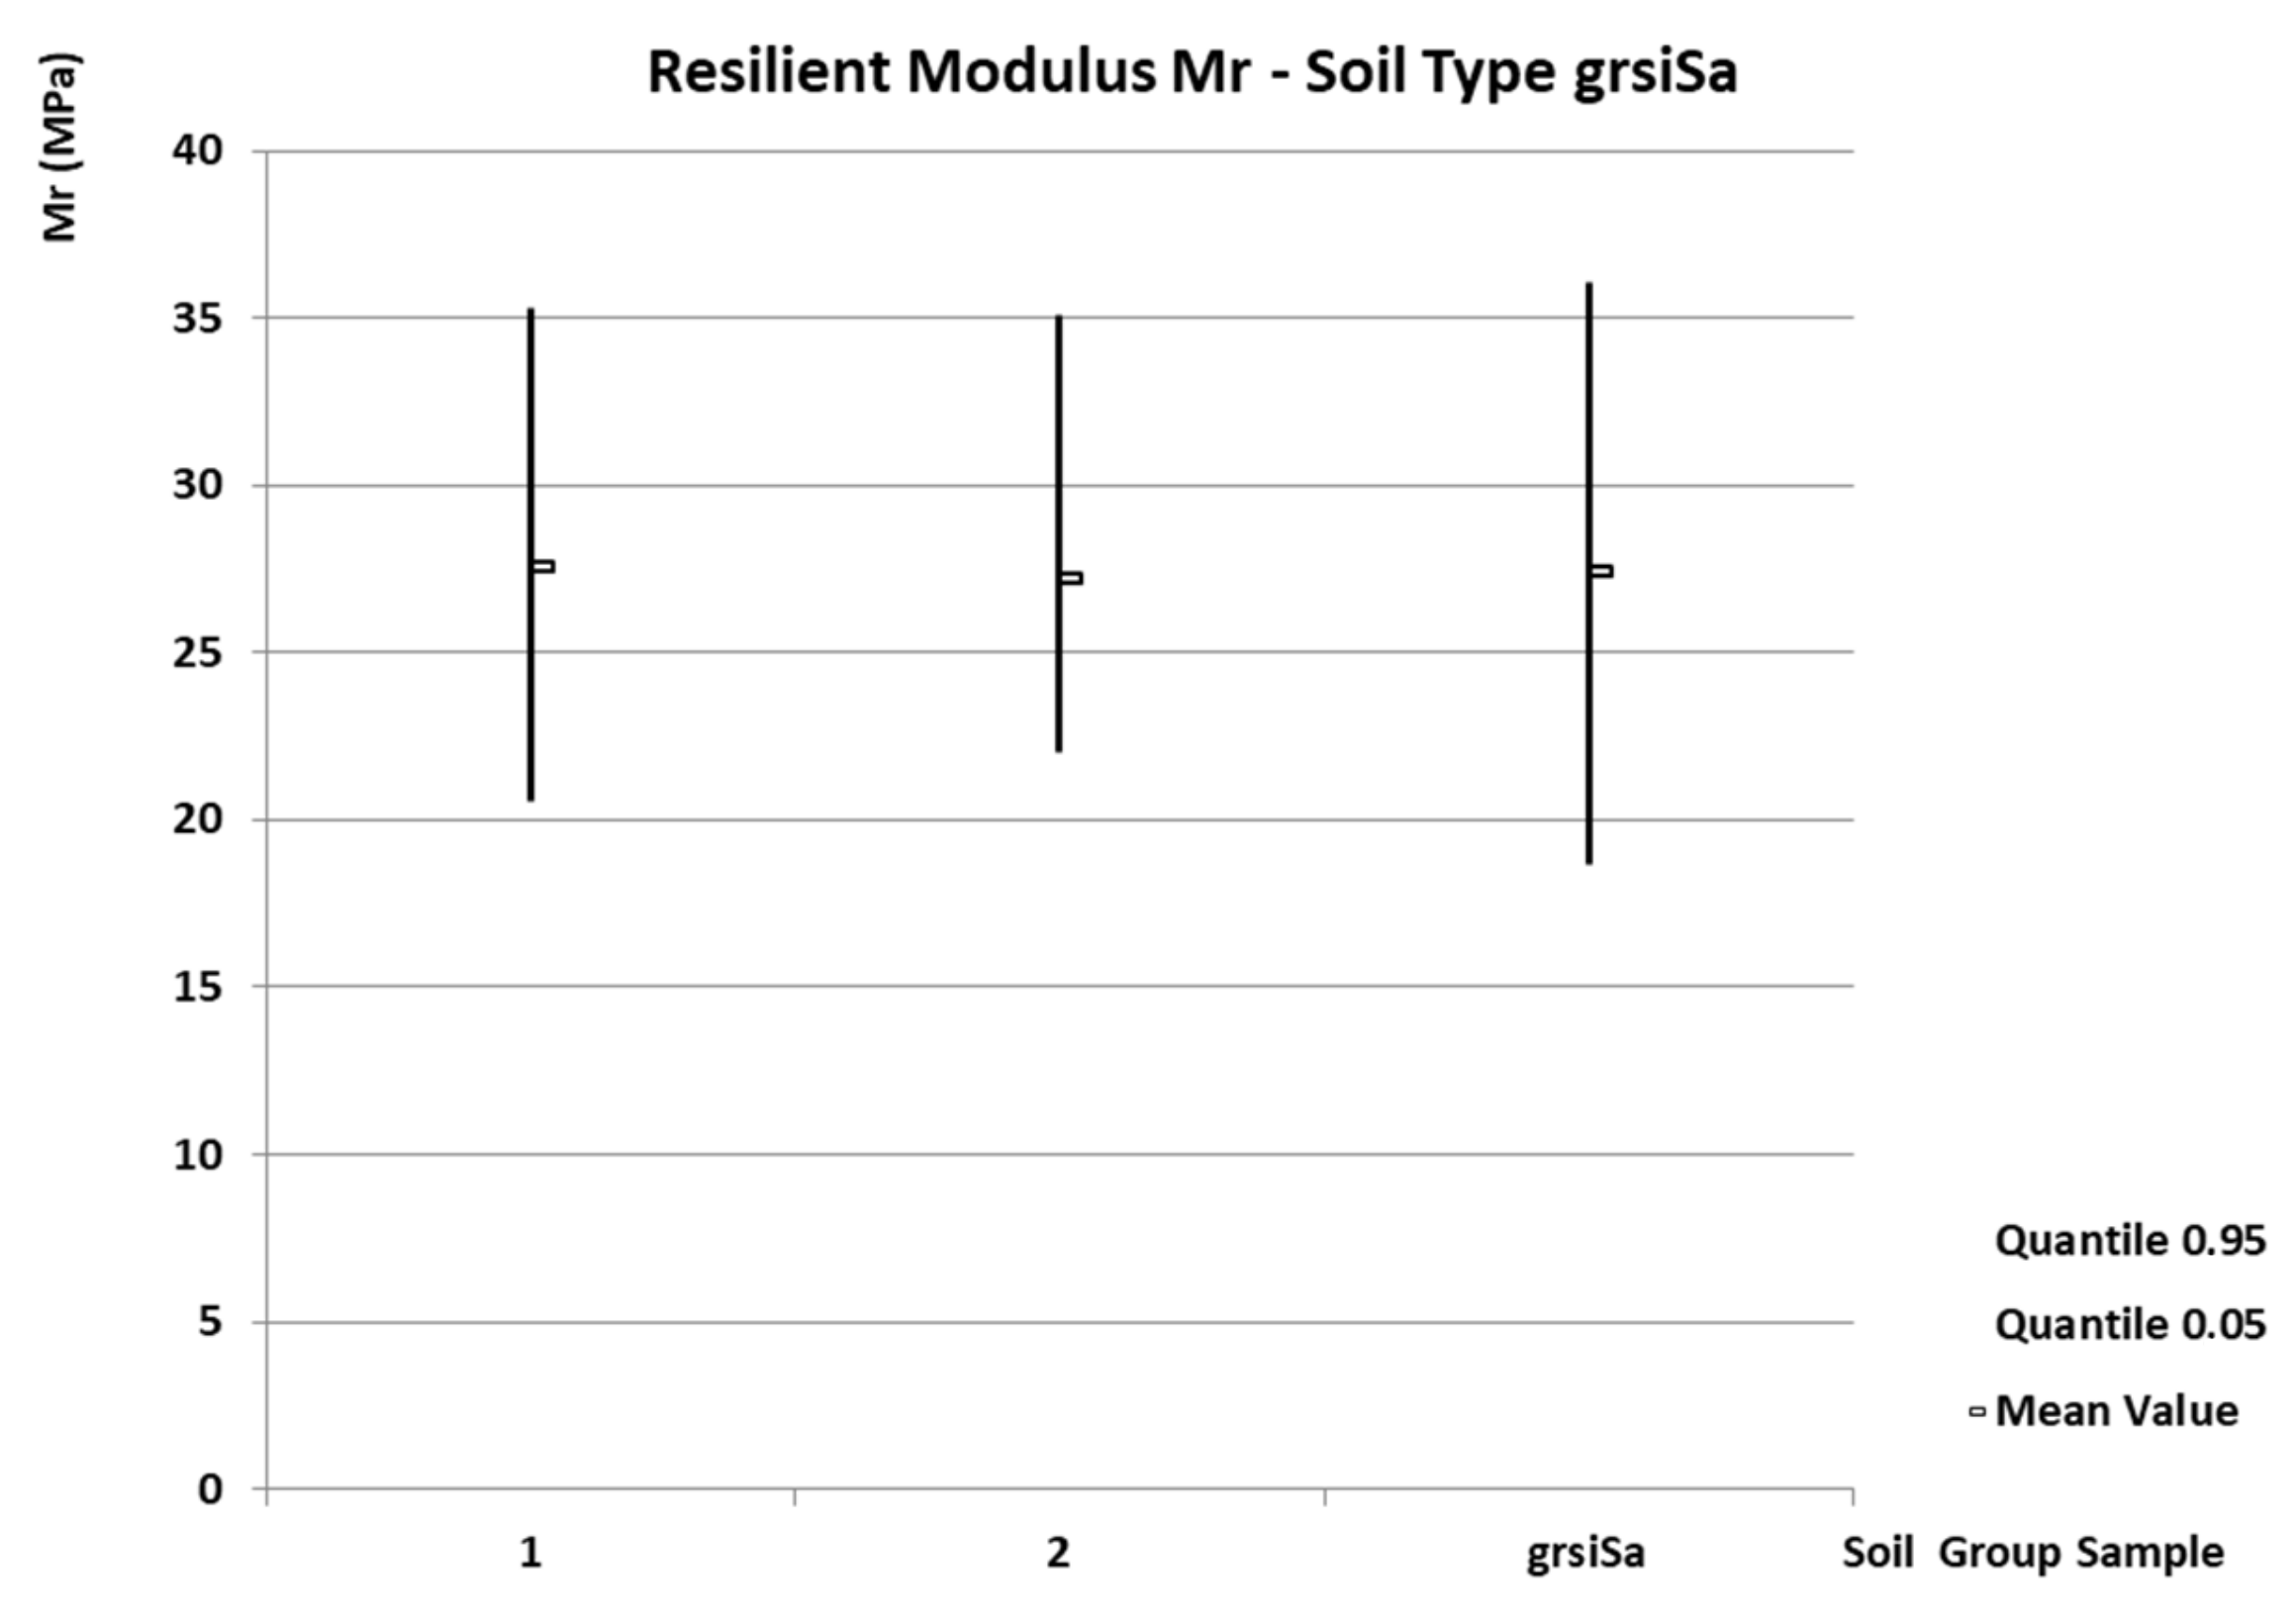
The results of the statistical analysis for each soil type are presented in Figure 2, Figure 3, Figure 4, Figure 5, Figure 6, Figure 7, Figure 8, Figure 9 and Figure 10. For each data set of six specimens (for each soil sample), the mean Mr value and the 0.05 and 0.95 quantiles are listed. These statistics are also given for the entire soil type.
-
Soil type Cl
The Cl soil type contains a total of 10 samples and 60 specimens (see Figure 2). The Mr mean value of the individual samples is in the interval 43.75–91.52 MPa, and the coefficient of variation is in the interval 0.03–0.23. The Mr mean value of the entire soil type (obtained from the statistical analysis of all 60 specimens) is 63.75 MPa. The coefficient of variation is 0.31, the minimum value is 37.5 MPa, and the maximum value is 95.8 MPa. The 0.05 quantile is 31.3 MPa, and the 0.95 quantile is 96.2 MPa.
Figure 2. Mean value, 0.05 quantile, and 0.95 quantile of Mr for the Cl soil type.
Forests 14 02425 g002
-
Soil type siCl
The siCl soil type contains a total of three samples and 18 specimens (see Figure 3). The Mr mean value of the individual samples is in the interval 22.52–38.94 MPa, and the coefficient of variation is in the interval 0.12–0.24. The Mr mean value of the entire soil type (obtained from the statistical analysis of all 18 specimens) is 28.19 MPa. The coefficient of variation is 0.34, the minimum value is 18.7 MPa, and the maximum value is 53.5 MPa. The 0.05 quantile is 12.2 MPa, and the 0.95 quantile is 44.2 MPa.
Figure 3. Mean value, 0.05 quantile, and 0.95 quantile of Mr for the siCl soil type.
Forests 14 02425 g003
-
Soil type saclSi
The saclSi soil type contains a total of two samples and 12 specimens (see Figure 4). The Mr mean value of the individual samples is in the interval 56.29–71.70 MPA, and the coefficient of variation is in the interval 0.11–0.12. The Mr mean value of the entire soil type (obtained from the statistical analysis of all 12 specimens) is 63.99 MPa. The coefficient of variation is 0.17, the minimum value is 47.5 MPa, and the maximum value is 84.1 MPa. The 0.05 quantile is 46.4 MPa, and the 0.95 quantile is 81.6 MPa.
Figure 4. Mean value, 0.05 quantile, and 0.95 quantile of Mr for the saclSi soil type.
Forests 14 02425 g004
-
Soil type csaCl
The csaCl soil type contains a total of five samples and 30 specimens (see Figure 5). The Mr mean value of the individual samples is in the interval 52.63–95.18 MPA, and the coefficient of variation is in the interval 0.04–0.14. The Mr mean value of the entire soil type (obtained from the statistical analysis of all 30 specimens) is 79.27 MPa. The coefficient of variation is 0.21, the minimum value is 49.0 MPa, and the maximum value is 103.8 MPa. The 0.05 quantile is 52.4 MPa, and the 0.95 quantile is 106.2 MPa.
Figure 5. Mean value, 0.05 quantile, and 0.95 quantile of Mr for the csaCl soil type.
Forests 14 02425 g005
-
Soil type sagrSi
The sagrSi soil type contains a total of eight samples and 48 specimens (see Figure 6). The Mr mean value of the individual samples is in the interval 20.71–72.00 MPA, and the coefficient of variation is in the interval 0.07–0.27. The Mr mean value of the entire soil type (obtained from the statistical analysis of all 48 specimens) is 42.86 MPa. The coefficient of variation is 0.42, the minimum value is 18.7 MPa, and the maximum value is 86.5 MPa. The 0.05 quantile is 13.4 MPa, and the 0.95 quantile is 72.4 MPa.
Figure 6. Mean value, 0.05 quantile, and 0.95 quantile of Mr for the sagrSi soil type.
Forests 14 02425 g006
-
Soil type grsaCl
The grsaCl soil type contains a total of four samples and 24 specimens (see Figure 7). The Mr mean value of the individual samples is in the interval 47.17–85.63 MPA, and the coefficient of variation is in the interval 0.09–0.15. The Mr mean value of the entire soil type (obtained from the statistical analysis of all 24 specimens) is 71.23 MPa. The coefficient of variation is 0.24, the minimum value is 43.3 MPa, and the maximum value is 97.0 MPa. The 0.05 quantile is 43.7 MPa, and the 0.95 quantile is 98.8 MPa.
Figure 7. Mean value, 0.05 quantile, and 0.95 quantile of Mr for the grsaCl soil type.
Forests 14 02425 g007
-
Soil type siSa
The siSa soil type contains a total of two samples and 12 specimens (see Figure 8). The Mr mean value of the individual samples is in the interval 64.04–66.30 MPA, and the coefficient of variation is in the interval 0.15–0.27. The Mr mean value of the entire soil type (obtained from the statistical analysis of all 12 specimens) is 65.17 MPa. The coefficient of variation is 0.22, the minimum value is 46.6 MPa, and the maximum value is 88.6 MPa. The 0.05 quantile is 42.0 MPa, and the 0.95 quantile is 88.3 MPa.
Figure 8. Mean value, 0.05 quantile, and 0.95 quantile of Mr for the siSa soil type.
Forests 14 02425 g008
-
Soil type grsiSa
The grsiSa soil type contains a total of two samples and 12 specimens (see Figure 9). The Mr mean value of the individual samples is in the interval 27.22–27.54 MPA, and the coefficient of variation is in the interval 0.19–0.20. The Mr mean value of the entire soil type (obtained from the statistical analysis of all 12 specimens) is 27.38 MPa. The coefficient of variation is 0.19, the minimum value is 19.0 MPa, and the maximum value is 36.8 MPa. The 0.05 quantile is 18.7 MPa, and the 0.95 quantile is 36.1 MPa.
Figure 9. Mean value, 0.05 quantile, and 0.95 quantile of Mr for the grsiSa soil type.
Forests 14 02425 g009
-
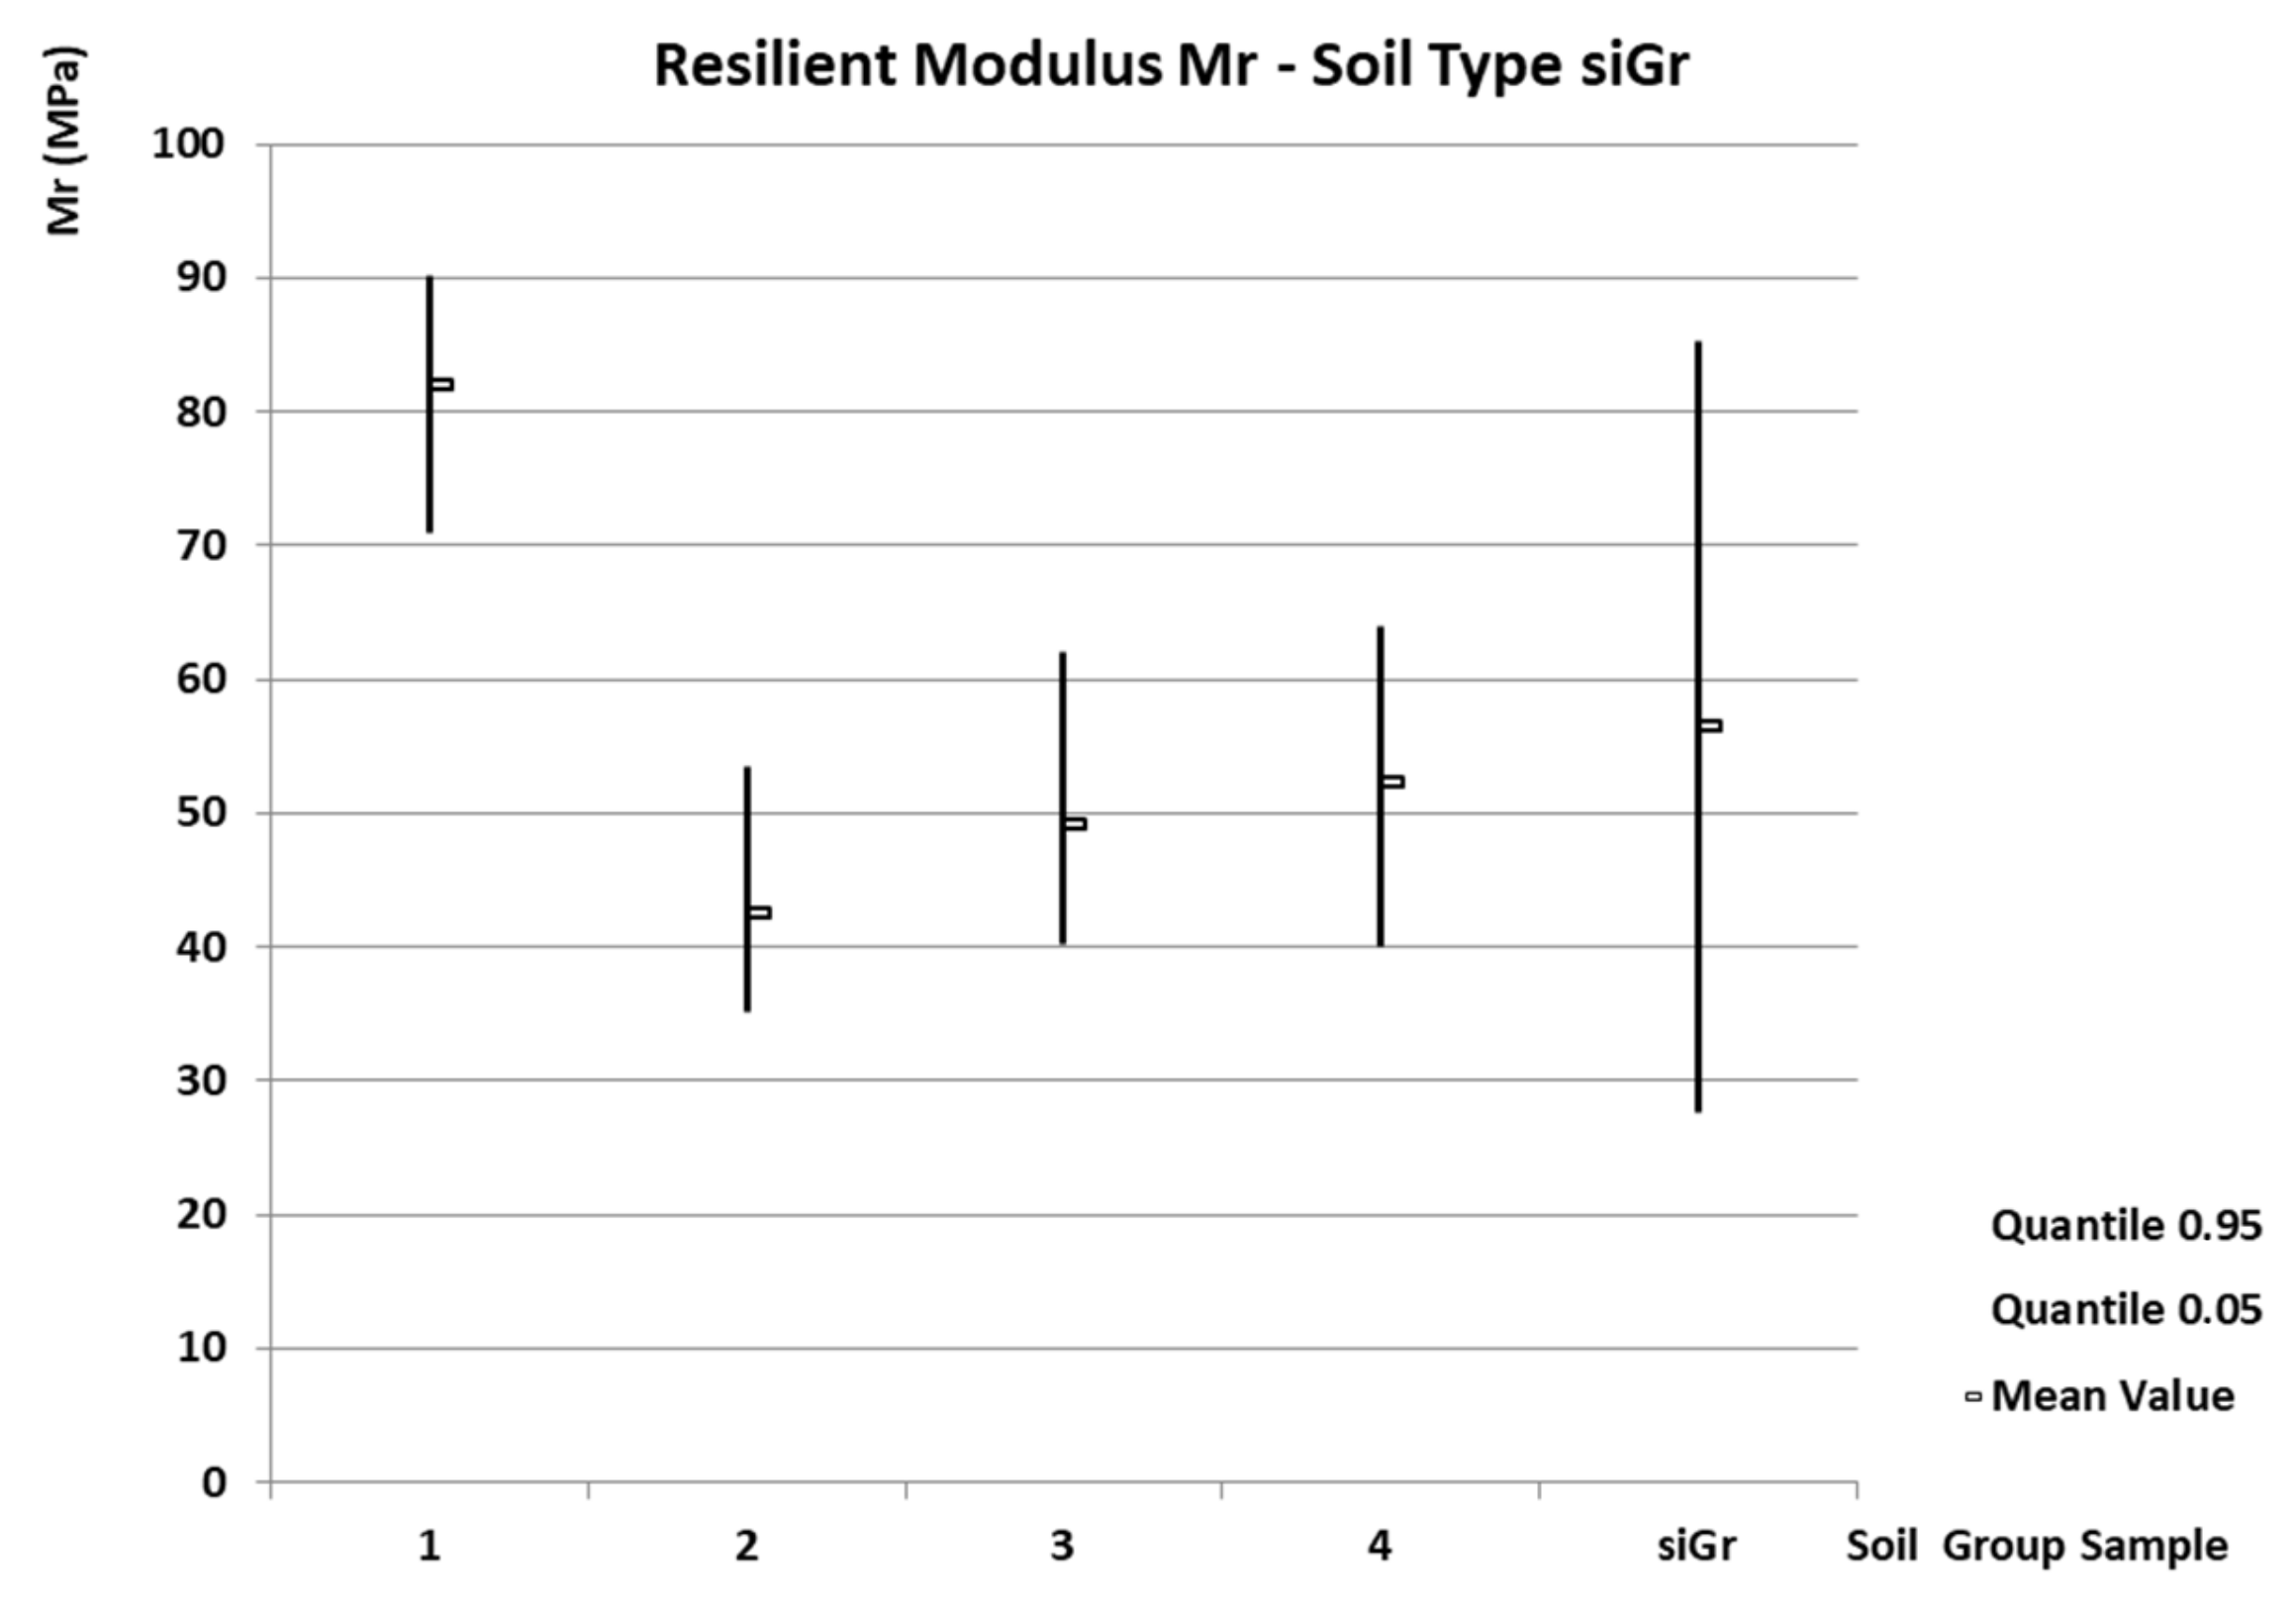
Soil type siGr
The siGr soil type contains a total of four samples and 24 specimens (see Figure 10). The Mr mean value of the individual samples is in the interval 42.55–82.03 MPA, and the coefficient of variation is in the interval 0.10–0.21. The Mr mean value of the entire soil type (obtained from the statistical analysis of all 24 specimens) is 56.47 MPa. The coefficient of variation is 0.31, the minimum value is 34.5 MPa, and the maximum value is 91.0 MPa. The 0.05 quantile is 27.6 MPa, and the 0.95 quantile is 85.3 MPa.
Figure 10. Mean value, 0.05 quantile, and 0.95 quantile of Mr for the siGr soil type.
Forests 14 02425 g010
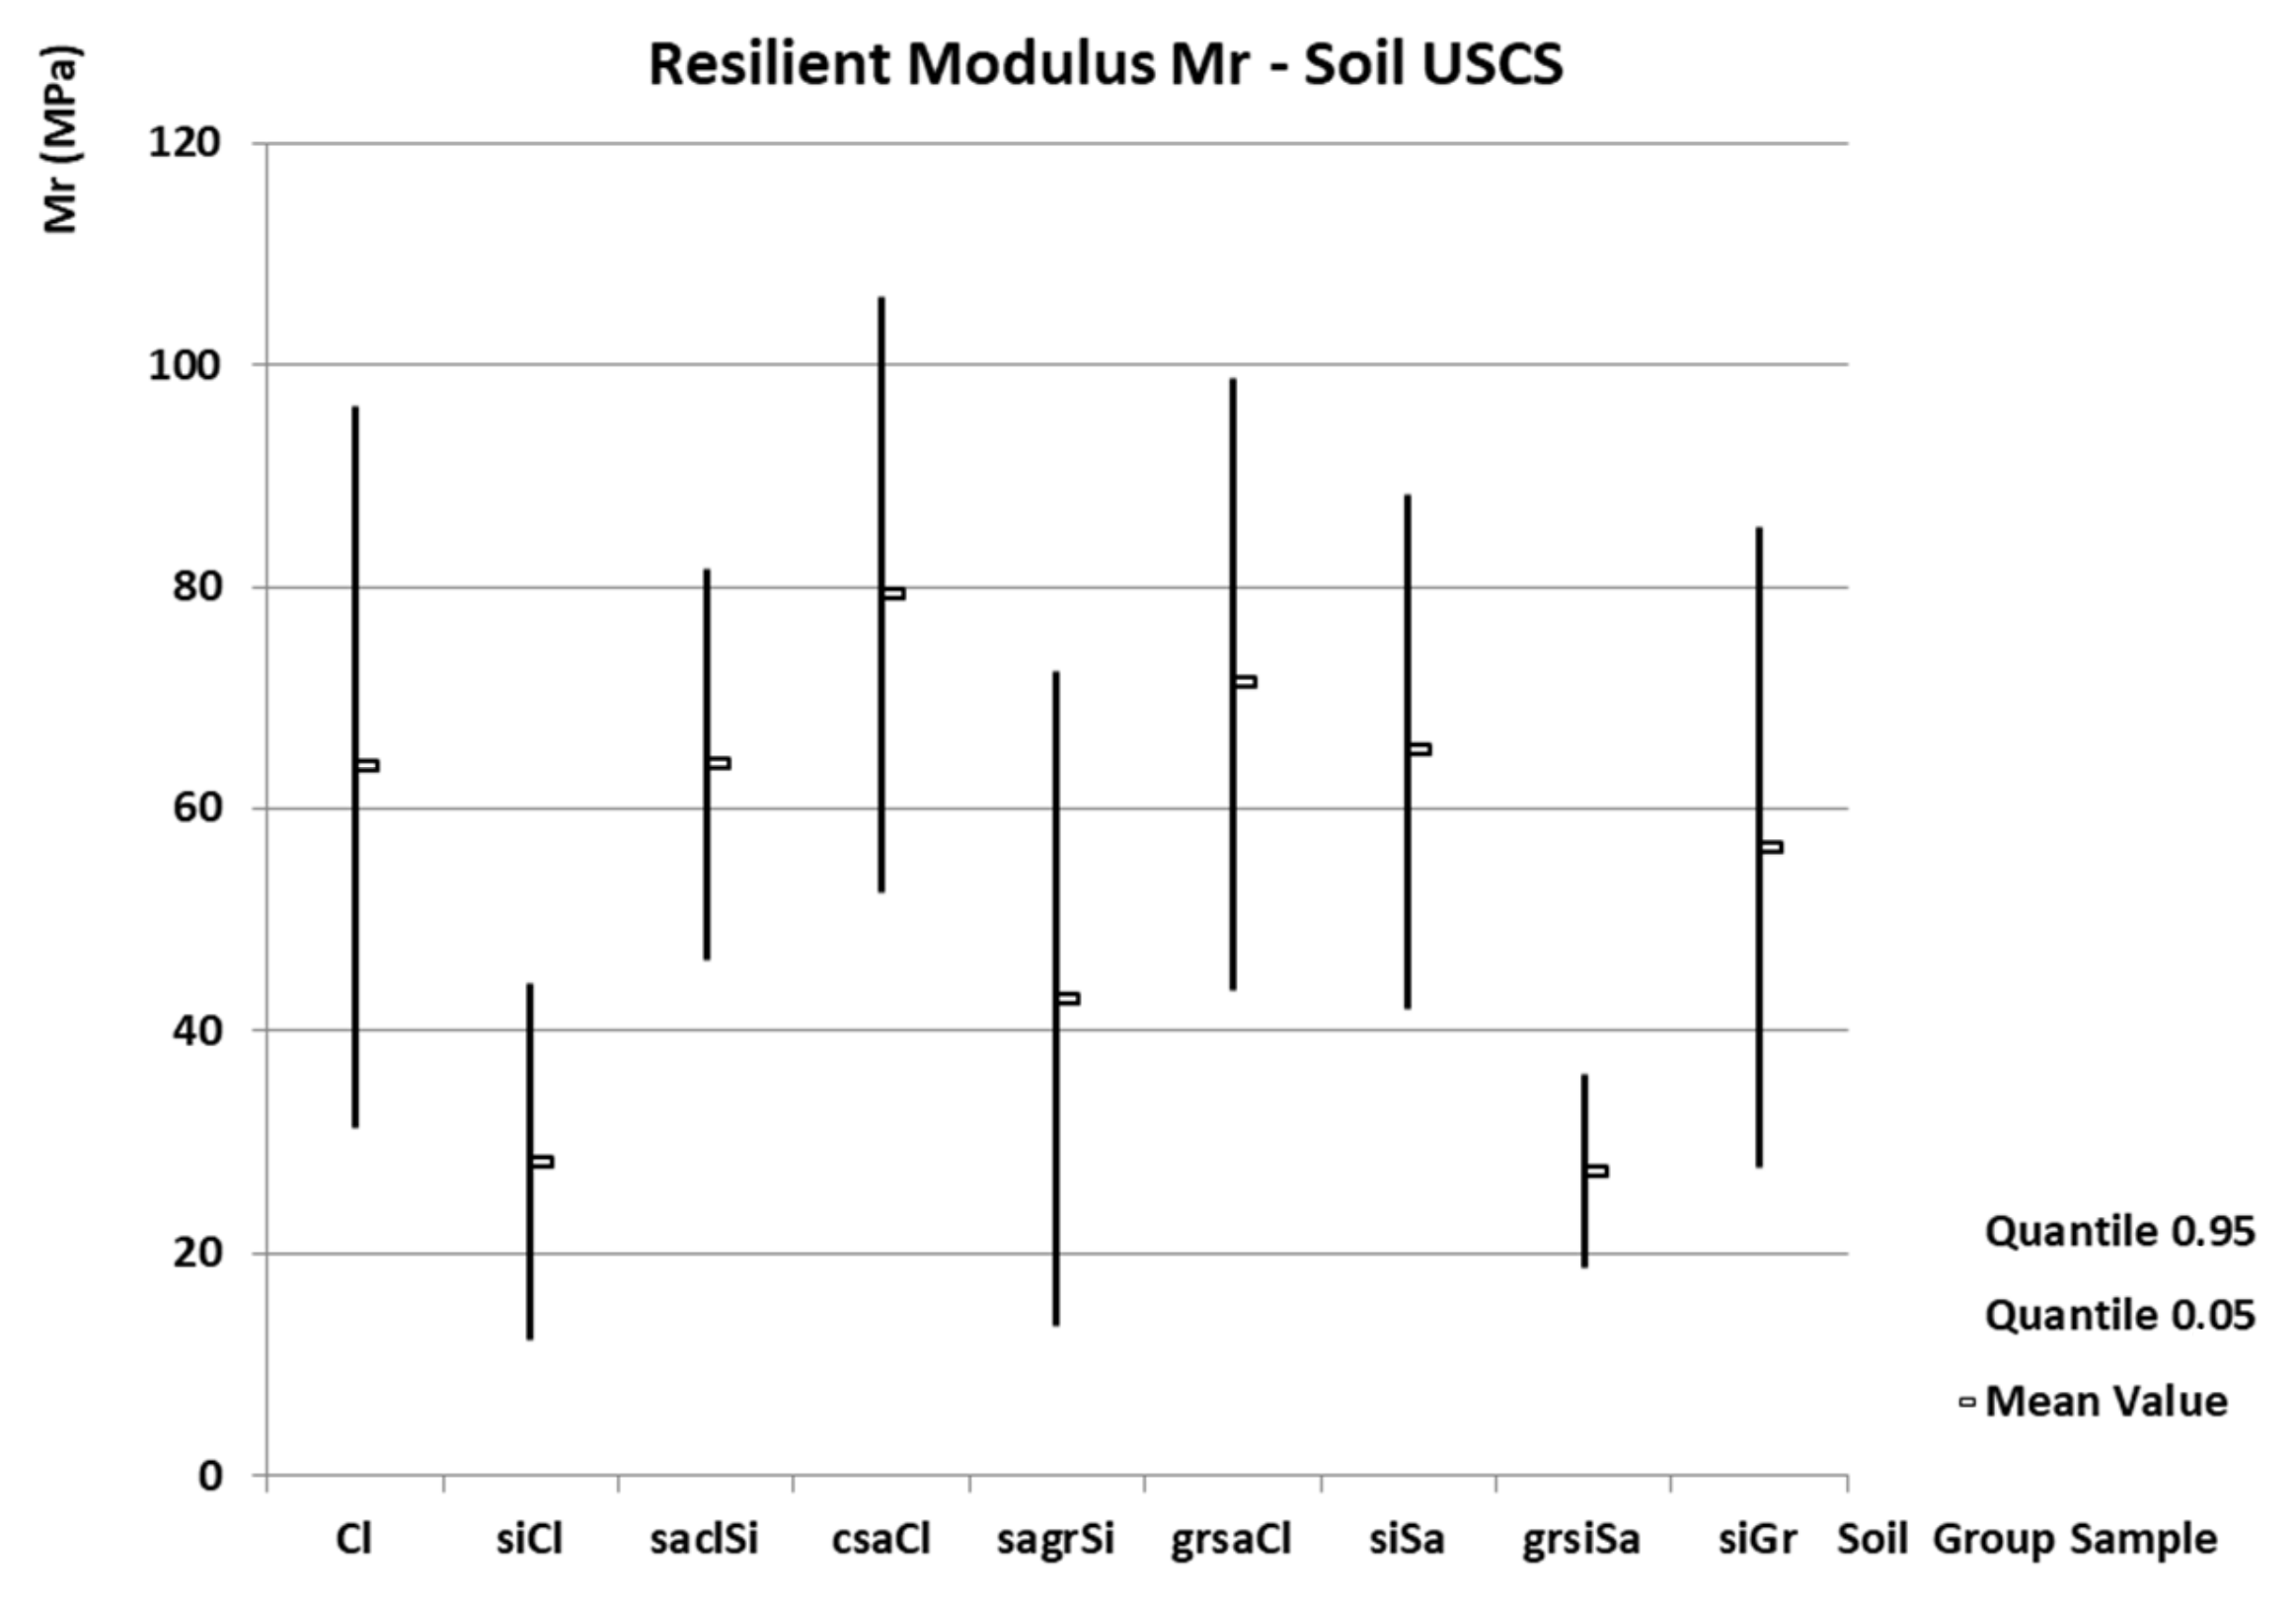
The intervals of the obtained resilient modulus Mr values for all individual soil types are shown in Figure 11. The mean value, coefficient of variation, and 0.05 and 0.95 quantiles of Mr are listed in Table 2.
Figure 11. Mean value, 0.05 quantile, and 0.95 quantile of Mr for all soil types.
Forests 14 02425 g011

4. Discussion

The resilient modulus results of testing 240 specimens using the updated cyclic CBR test can be compared to the results of testing 276 specimens using the standard cyclic CBR test, which have been published [15]. All results are fully compatible because the testing methodologies were identical. The same soil samples were used for specimen preparation, the same CBR molds were used, with the same dimensions and compacting procedure, and the same testing machine was used. The results of statistical analysis—the mean value, coefficient of variation, and 0.05 and 0.95 quantiles of Mr—obtained with both cyclic CBR tests for all individual soil types are listed in Table 2.
First, we can briefly summarize what can be expected of the basic resilient modulus statistics obtained with the updated cyclic CBR test in comparison to the standard cyclic CBR test. Because the updated cyclic CBR test was performed with the cyclic loading force determined by the 210 kPa plunger stress, it can be expected that the high—often unrealistic—resilient modulus values obtained at high plunger stress values will be significantly reduced. If these high values are limited, a reduction in the 0.95 quantile value, a reduction in the random variability, and a reduction in the mean value of the resilient modulus can be expected. The 0.05 quantile value may or may not be affected because it depends on low values of the resilient modulus, and these are obtained by the standard cyclic CBR test at low plunger stress values, which are minimally influenced when using the updated cyclic CBR test.
When comparing the 0.95 quantile values (see Table 2), a substantial reduction for all soil types, except the siGr soil type, is apparent. The 0.95 quantile values obtained by the standard cyclic CBR test are 2–6 times greater than those obtained by the updated cyclic CBR test. Random variability measured by the coefficient of variation is also significantly reduced from the interval 0.24–1.08 to the interval 0.17–0.42. For individual soil types, coefficients of variation obtained by the standard cyclic CBR test are 2–3 times greater compared to the updated cyclic CBR test. Similar results are valid for mean values—for all soil types, except the siGr soil type, mean values are significantly lower. They are reduced from the interval 32.2–153.4 MPa to the interval 27.4–79.3 MPa. For individual soil types, the mean values obtained by the standard cyclic CBR test are up to five times greater than those obtained by the updated cyclic CBR test. When comparing the 0.05 quantile values, no differences are apparent among seven soil types; however, for the grsiSa soil type, the 0.05 quantile values obtained by the updated cyclic CBR test are four times lower compared to the standard cyclic CBR test. In contrast, for the siGr soil type, the 0.05 quantile values obtained by the updated cyclic CBR test are three times greater compared to the standard cyclic CBR test.
The explanation for the slightly different behavior of the grsiSa soil type and especially the siGr soil type is relatively simple. If we compare the plunger stress values at which they were tested [15,31], grsiSa was tested at considerably lower stress values by the updated cyclic CBR test; therefore, the decrease in resilient modulus values is significant. It considerably affects both quantiles as well as the mean value. In contrast, the siGr soil type was tested at significantly higher stress values by the updated cyclic CBR test, resulting in higher resilient modulus values affecting both quantiles as well as the mean value.
In [31], the resilient modulus results obtained from the standard cyclic CBR test were omitted—that is, Mr values obtained under unrealistically high plunger stress values were excluded from the analysis, and only Mr values obtained under realistic plunger stress were taken into account. The results, which were in the interval 18–65 MPa, are fully comparable to the moduli obtained from the updated cyclic CBR test, which are in the interval 27–79 MPa.
The moduli obtained from the updated cyclic CBR test can also be compared with the moduli obtained from the cyclic triaxial test. It is known from previous studies that Mr values obtained from the cyclic triaxial test are in a lower interval than those obtained from the standard cyclic CBR test. In [16,21,23,33], the modulus values obtained from the cyclic triaxial test are in the intervals 20–90 MPa, 40–110 MPa, 55–80 MPa, and 56–159 MPa, respectively. All these results are fully comparable with the results in this paper. For comparison, where possible, these results are also shown in Table 2 as indicative cyclic triaxial test results. However, it should be noted that these indicative results have always been obtained by testing only one specimen under a variety of incompatible stress and moisture conditions and, in particular, on soil material from all over the world.
Mr results obtained by the standard cyclic CBR test are also worth mentioning. In [25], the modulus values were obtained by the standard cyclic CBR test under a plunger stress in the interval 1–3.5 MPa, and the moduli were in the interval 250–500 MPa. In [26], under a plunger stress of 4 MPa, they were in the interval 50–240 MPa; in [30], under a plunger stress of 5.5 MPa, they were in the interval 120–420 MPa; in [20], under a plunger stress of up to 9 MPa, they were in the interval 150–2600 MPa.
Although the above results obtained by the standard cyclic CBR test are fully comparable to each other, they are significantly higher than those obtained by the updated cyclic CBR test or the cyclic triaxial test. Thus, overall, the resilient modulus obtained by the standard cyclic CBR test is overestimated. It does not correspond to its value in an actual pavement structure because it is significantly higher compared to the reality. Because the resilient modulus characterizes the material stiffness, the stiffness is also significantly overestimated. This can be dangerous, because the subgrade soil stiffness has an important influence on the design of a pavement structure, especially on the composition and thickness of the pavement layers. This is particularly important for forest roads, where lower modulus values can be expected due to a frequently unfavorable water regime and a high moisture content. Inaccurate estimation of the resilient modulus may result in inappropriate composition of the pavement layers for forest roads, which will consequently result in unsatisfactory technical parameters of the pavement structure. Intensive pavement degradation and reduced durability and service life of the forest pavement structure can then be expected.

5. Conclusions

The forest subgrade soil materials as well as the pavement construction materials are subjected to dynamic and repeated loadings of varying intensity from traffic. In order to take into account the cyclic nature of the material loading as well as its non-linear behavior, the concept of the resilient modulus has been adopted. A realistic value is associated with the process of repeated loadings and depends on actual soil parameters—e.g., maximum dry density, moisture content, compaction method, and the number and magnitude of repeated loads—and on the state of stress in an actual pavement structure. Its value is not constant for a given soil type, but varies within an interval depending on test conditions [33], mainly on the moisture content and the actual state of stress.
Although the cyclic triaxial test meets all the requirements for resilient modulus calculations, due to its complexity and financial costs, other methods to determine resilient modulus are sought. The cyclic CBR test seems to be appropriate, as it is a simple and inexpensive tool for calculating the resilient modulus. However, it should be noted that the plunger stress requires realistic values, because only in this case are the obtained resilient modulus values comparable to those obtained from the cyclic triaxial test. This can only be ensured by an updated cyclic CBR test in which repeated loadings of the material specimen are observed under realistic plunger stress values.

Author Contributions

Conceptualization, L.Š. and J.Ž.; methodology, L.Š. and A.F.; software, K.Ž.; validation, L.Š. and A.F.; formal analysis, A.F.; investigation, K.Ž.; data curation, A.F.; writing—original draft preparation, A.F.; writing—review and editing, A.F.; visualization, L.Š. and K.Ž.; supervision, J.Ž.; project administration, L.Š.; funding acquisition, J.Ž. All authors have read and agreed to the published version of the manuscript.

Funding

This research received no external funding.

Data Availability Statement

The data presented in this study are available on request from the corresponding author.

Conflicts of Interest

The authors declare no conflict of interest.

References

  1. Heinimann, H.R. Pavement Engineering for Forest Roads: Development and Opportunities. Croat. J. For. Eng. 2020, 42, 91–106. [Google Scholar] [CrossRef]
  2. AASHTO. Guidelines for Geometric Design of Very Low-Volume Local Roads; American Association of State Highway and Transportation Officials: Washington, DC, USA, 2001. [Google Scholar]
  3. Anguas, P.G.; López, J.A.G.; Martínez, J.A.S. Mecánica de Materiales para Pavimentos; Publicación Técnica No. 197; Instituto Mexicano del Transporte: Sanfandila, Mexico, 2002. [Google Scholar]
  4. Florian, A.; Ševelová, L.; Žák, J. Influence of environmental humidity on mechanical properties of natural and recycled unbound materials. Acta Univ. Agric. Silvic. Mendel. Brun. 2015, 63, 405–409. [Google Scholar] [CrossRef]
  5. AASHTO. Mechanistic-Empirical Pavement Design Guide (MEPDG); American Association of State Highway and Transportation Officials: Washington, DC, USA, 2008. [Google Scholar]
  6. Díaz, M.M.; Peréz, I. Mechanistic-empirical pavement design guide: Features and distinctive elements. Rev. Construcción 2015, 14, 32–40. [Google Scholar] [CrossRef]
  7. Hauser, J.; Ševelová, L.; Matula, R.; Zedník, P. Optimization of low volume road pavement design and construction. J. For. Sci. 2018, 64, 74–85. [Google Scholar] [CrossRef]
  8. Nguyen, B.T.; Mohajerani, A. Resilient modulus of fine-grained soil and a simple testing and calculation method for determining an average resilient modulus value for pavement design. J. Transp. Geotech. 2016, 7, 59–70. [Google Scholar] [CrossRef]
  9. Yang, S.H.; Lin, H.D.; Kung, J.H.S.; Huang, W.H. Suction-Controlled Laboratory Test on Resilient Modulus of Unsaturated Compacted Subgrade Soils. J. Geotech. Geoenviron. Eng. 2008, 134, 1375–1384. [Google Scholar] [CrossRef]
  10. Brinch Hansen, J. A General Formula for Bearing Capacity; Bulletin No. 11; Geoteknisk Institut, Institute Akademict for de Tekniske Videuskaber: Copenhagen, Denmark, 1961. [Google Scholar]
  11. Hauser, J.; Kozumplíková, A.; Ševelová, L. CBR and IBI tests for practices the design of the earth body and based layers of the road construction. In Geotechnical Problems of Line Structures; Slovak University of Technology in Bratislava: Bratislava, Slovakia, 2011; pp. 101–108. [Google Scholar]
  12. CSN EN 13286-7; Unbound and Hydraulically Bound Mixtures—Part 7: Cyclic Load Triaxial Test for Unbound Mixtures. Institute for Technology Standardization. Metrology and State Testing: Prague, Czech Republic, 2004.
  13. CSN EN ISO 14688-2; Geotechnical Investigation and Testing-Identification and Classification of Soil—Part 2: Principles for a Classification. Institute for Technology Standardization. Metrology and State Testing: Prague, Czech Republic, 2005.
  14. CSN EN ISO 14689-1; Geotechnical Investigation and Testing-Identification and Classification of Rock—Part 1: Identification and Description. Institute for Technology Standardization. Metrology and State Testing: Prague, Czech Republic, 2004.
  15. Ševelová, L.; Florian, A.; Hrůza, P. Using Resilient Modulus to Determine the Subgrade Suitability for Forest Road Construction. Forests 2020, 11, 1208. [Google Scholar] [CrossRef]
  16. Molenaar, A.A.A. Repeated Load CBR Testing, a Simple but Effective Tool for the Characterization of Fine Soils and Unbound Materials; Delft University of Technology: Delft, The Netherlands, 2008. [Google Scholar]
  17. CSN EN ISO 13286-2; Unbound and Hydraulically Bound Mixtures—Part 2: Test Methods for the Determination of the Laboratory Reference Density and Water Content-Proctor Compaction. Institute for Technology Standardization. Metrology and State Testing: Prague, Czech Republic, 2015.
  18. CSN EN ISO 13286-47; Unbound and Hydraulically Bound Mixtures—Part 47: Test Method for the Determination of California Bearing Ratio, Immediate Bearing Index and Linear Swelling. Institute for Technology Standardization. Metrology and State Testing: Prague, Czech Republic, 2015.
  19. Sas, W.; Głuchowski, A.; Miturski, M. Studies on resilient modulus value from cyclic loading tests for cohesive soil. J. Ann. Wars. Univ. Life Sci.-SGGW Land Reclam. 2017, 49, 117–127. [Google Scholar] [CrossRef]
  20. Araya, A.A. Characterization of Unbound Granularmaterials for Pavements. Ph.D. Thesis, Delft University of Technology, Delft, The Netherlands, 2011. [Google Scholar]
  21. Leunga, G.L.M.; Wong, A.W.G.; Wanga, Y.H. Prediction of resilient modulus of compacted saprolitic soils by CBR approach for road pavement subgrade: A re-examination. Int. J. Pavement Eng. 2013, 14, 403–417. [Google Scholar] [CrossRef]
  22. Sas, W.; Głuchowski, A.; Gabryś, K.; Soból, E.; Szymański, A. Resilient modulus testing with application of cyclic CBR test for road subgrade materials. In Proceedings of the XVI Danube—European Conference on Geotechnical Engineering, Skopje, North Macedonia, 7–9 June 2018. [Google Scholar]
  23. Bojacá Torres, D.C.; Campagnoli Martínez, S.X. CBR cíclico como método alternativo para la determinación del módulo resiliente en suelos blandos de subrasante. Cienc. E Ing. Neogranadina 2022, 2, 85–98. [Google Scholar] [CrossRef]
  24. Hao, S.; Pabst, T. Estimation of resilient behavior of crushed waste rocks using repeated load CBR tests. Transp. Geotech. 2021, 28, 100525. [Google Scholar] [CrossRef]
  25. Rincón-Morantes, J.; Alvarez, A.; Reyes-Ortiz, O. Estimación de la rigidez de materiales granulares marginales no ligados mediante ensayo CBR dinámico. Ing. Desarro. 2022, 40, 92–113. [Google Scholar] [CrossRef]
  26. Primusz, P.; Kisfaludi, B.; Péterfalvi, J. Evaluating the bearing capacity of hydraulic road binder treated soils by the cyclic CBR method. Eng. Sci. J. Field Transp. Eng. 2019, 71, 14–23. [Google Scholar] [CrossRef]
  27. Salmi, A.; Bousshinea, L.; Lahlou, K. A New Model of Equivalent Modulus Derived from Repeated Load CBR Test. Int. J. Eng. 2020, 7, 1321–1330. [Google Scholar] [CrossRef]
  28. Haghighia, H.; Arulrajaha, A.; Mohammadiniab, A.; Horpibulsuka, S. A new approach for determining resilient moduli of marginal pavement base materials using the staged repeated load CBR test method. Road Mater. Pavement Des. 2018, 8, 1848–1867. [Google Scholar] [CrossRef]
  29. Mehrpazhouh, A.; Tafreshi, S.N.M.; Mirzababaei, M. Impact of repeated loading on mechanical response of a reinforced sand. J. Rock Mech. Geotech. Eng. 2019, 11, 804–814. [Google Scholar] [CrossRef]
  30. Abid, A.N.; Salih, A.O.; Nawaf, E.A. The Influence of Fines Content on the Mechanical Properties of Aggregate Subbase Course Material for Highway Construction using Repeated Load CBR Test. Al-Nahrain J. Eng. Sci. 2017, 3, 615–624. [Google Scholar]
  31. Ševelová, L.; Florian, A.; Žák, J. Influence of Plunger Stress on Resilient Modulus of Forest Subgrade Soils Obtained from Cyclic CBR Test. Forests 2021, 12, 1456. [Google Scholar] [CrossRef]
  32. Robinson, R.G.; Krishnan, J.M. Use of repeated load CBR test to characterize pavement granular materials. In Functional Pavement Design, Proceedings of the 4th Chinese-European Workshop on Functional Pavement Design, CEW 2016, Delft, The Netherlands, 29 June–1 July 2016; CRC Press: Boca Raton, FL, USA, 2016; pp. 965–976. [Google Scholar]
  33. Rahman, M.M.; Gassman, S.L.; Islam, K.M. Effect of Moisture Content on Subgrade Soils Resilient Modulus for Predicting Pavement Rutting. Geosciences 2023, 13, 103. [Google Scholar] [CrossRef]
  34. Hauser, J.; Kozumplíková, A.; Ševelová, L. The Influence of the Soil Treatment on the CBR Test Values. In Proceedings of the International Conference on Ground Improvement and Ground Control: Transport Infrastructure Development and Natural Hazards Mitigation-ICGI 2012, Singapore, 30 October–2 November 2012; pp. 1623–1628. [Google Scholar]
  35. De Zarate, G.O.; Ševelová, L. The statistical analysis of the resilient modulus. In Public Recreation and Landscape Protection—With Man Hand in Hand; Mendel University in Brno: Prague, Czech Republic, 2015; pp. 258–264. [Google Scholar]
  36. TP 170; Design of Pavement Structures. Ministry of Transportation: Prague, Czech Republic, 2023.
  37. Kärhä, K.; Seuri, M.; Mac Donagh, P.M. Overview of Global Long-Distance Road Transportation of Industrial Roundwood. Croat. J. For. Eng. 2023, 45, 25. [Google Scholar] [CrossRef]
  38. Florian, A.; Ševelová, L.; Žák, J. Reliability analysis of temperature influence on stresses in rigid pavement made from recycled materials. Acta Univ. Agric. Silvic. Mendel. Brun. 2016, 64, 423–432. [Google Scholar] [CrossRef]
  39. Ševelová, L.; Florian, A. Comparison of Material Constitutive Models Used in FEA of Low Volume Roads. Int. J. Civ. Environ. Eng. 2013, 10, 421–425. [Google Scholar]
  40. Florian, A.; Ševelová, L. Computer Simulation of Low Volume Roads Made from Recycled Materials. Int. J. Civ. Environ. Eng. 2013, 10, 744–748. [Google Scholar]
  41. CSN EN ISO 17892-1; Geotechnical Investigation and Testing—Laboratory Testing of Soil—Part 1: Determination of Water Content. Institute for Technology Standardization, Metrology and State Testing: Prague, Czech Republic, 2015.
  42. CSN EN ISO 17892-4; Geotechnical Investigation and Testing-Laboratory Testing of Soil—Part 4: Determination of Particle Size Distribution. Institute for Technology Standardization, Metrology and State Testing: Prague, Czech Republic, 2017.
  43. CSN EN ISO 17892-12; Geotechnical Investigation and Testing—Laboratory Testing of Soil—Part 12: Determination of the Liquid and Plastic Limits. Institute for Technology Standardization, Metrology and State Testing: Prague, Czech Republic, 2018.
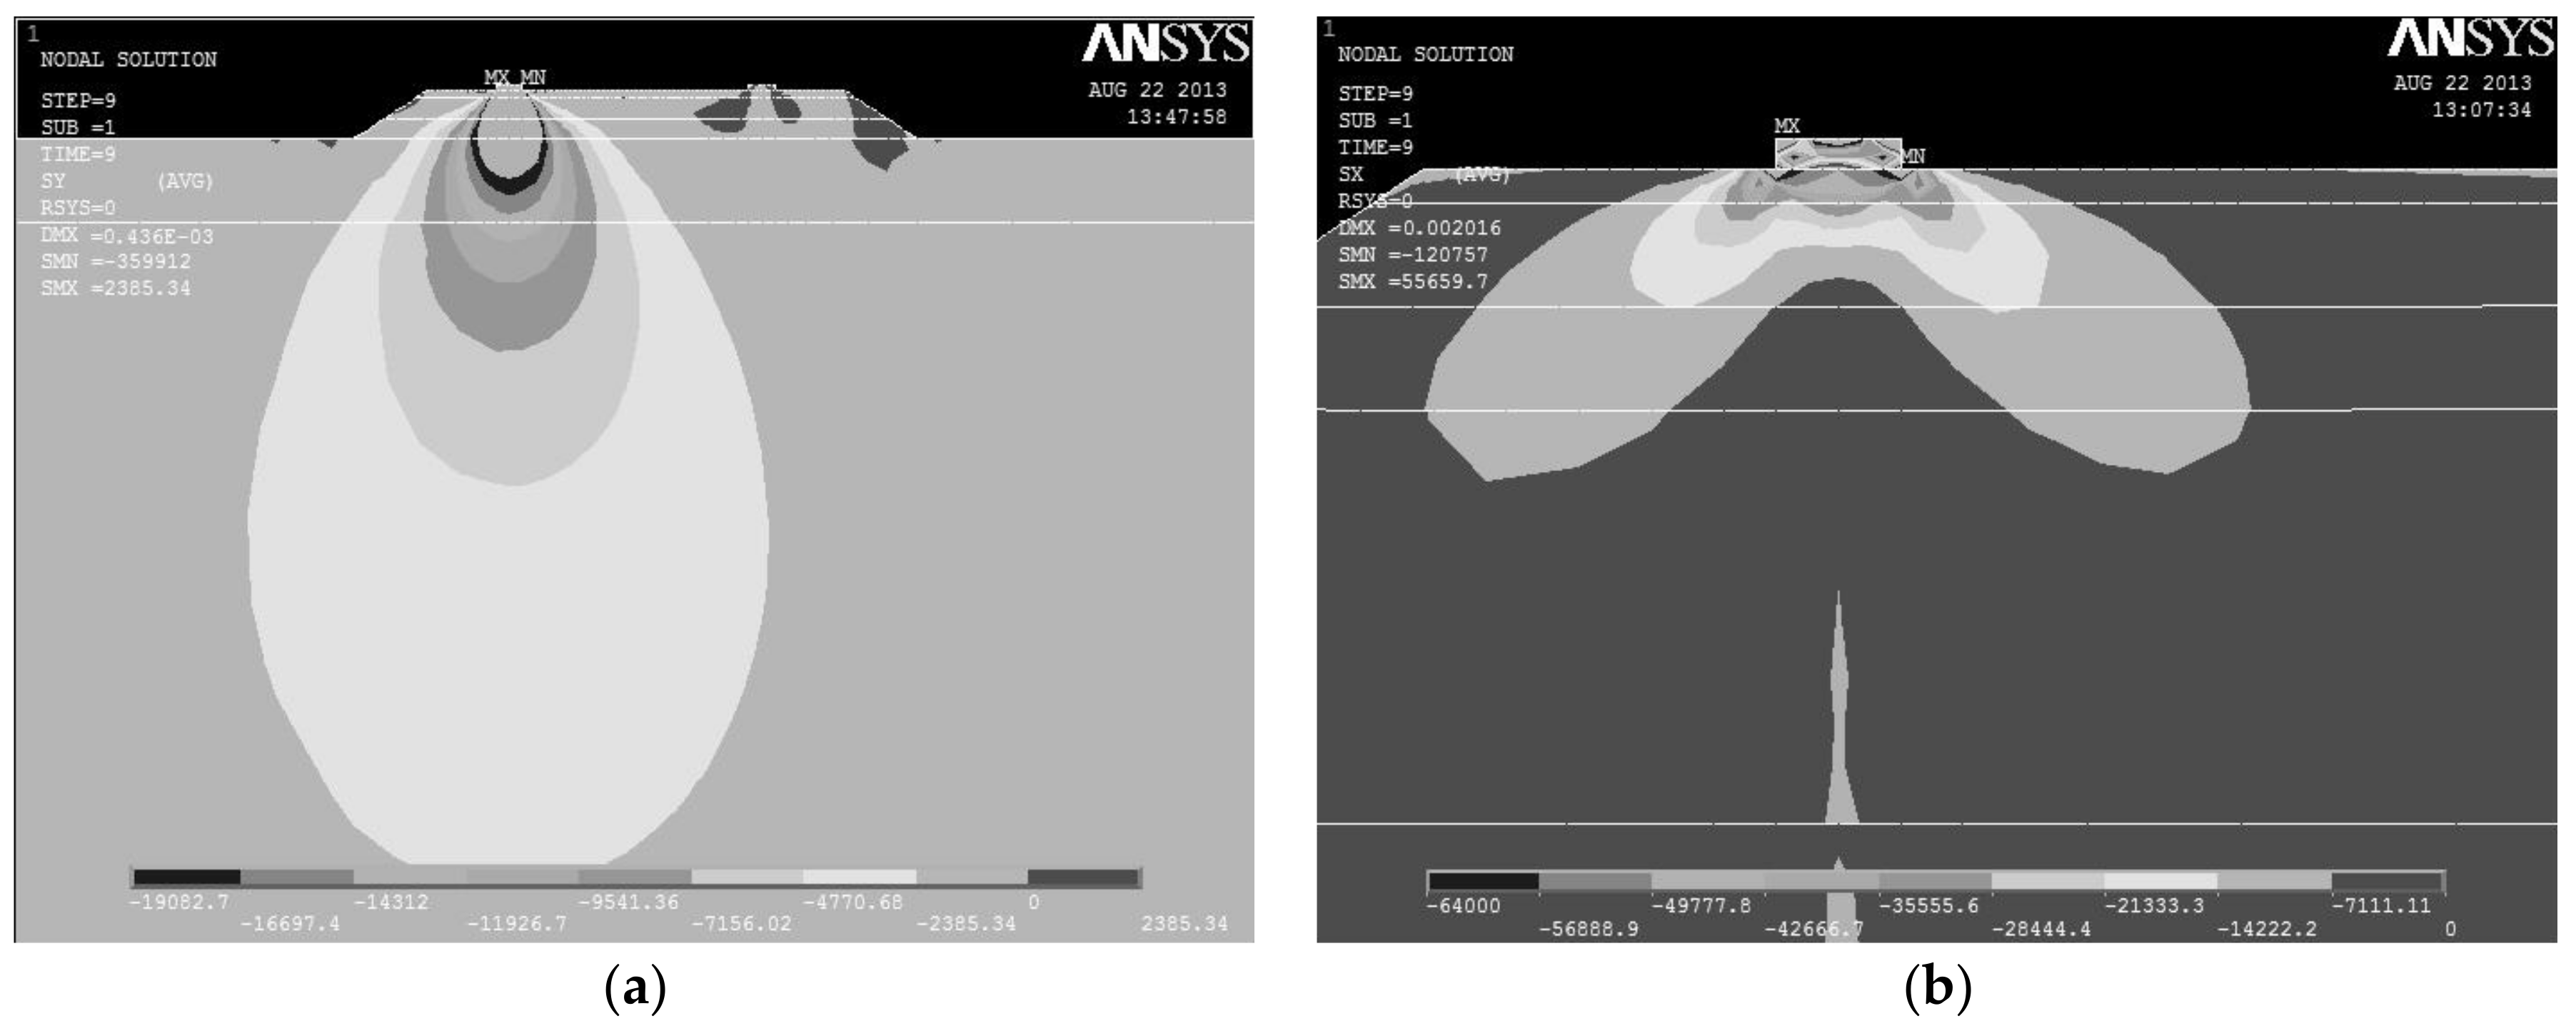
Figure 1. Numerical modeling of stress distribution in pavement structures under real conditions: (a) vertical; (b) horizontal.
Forests 14 02425 g001
Table 1. Soil classification.
Number N°Soil Type
USCS
Amount of SamplesAmount of Specimens Mean Density kg·m−3Mean Humidity
%
1Cl10601598.823.8
2siCl3181655.920.7
3saclSi2121748.318.6
4csaCl5301813.715.7
5sagrSi8481858.513.4
6grsaCl4241635.521.5
7siSa2121796.014.7
8grsiSa2121827.313.6
9siGr4241929.612.7
Table 2. Mr statistics for both cyclic CBR tests, with indicative cyclic triaxial test results.
SoilMean Value [MPa]COVQuantile 0.05 [MPa] Quantile 0.95 [MPa]Triaxial [MPa]
CBR TestUpdatedStandardUpdatedStandardUpdatedStandardUpdatedStandardIndicative
Cl63.8123.40.310.8331.339.096.2371.720–134
siCl28.2140.80.341.0812.218.744.2299.4-
saclSi64.0122.70.170.5946.448.881.6235.358–102
csaCl79.3106.90.210.4652.451.8106.2205.711–84
sagrSi42.9101.80.420.7813.424.172.4271.3-
grsaCl71.2107.90.240.8243.744.098.8310.7-
siSa65.2153.40.220.6742.029.988.3357.632–111
grsiSa27.4116.90.190.2418.767.436.1159.357–148
siGr56.532.20.310.6027.610.785.364.088–141
Disclaimer/Publisher’s Note: The statements, opinions and data contained in all publications are solely those of the individual author(s) and contributor(s) and not of MDPI and/or the editor(s). MDPI and/or the editor(s) disclaim responsibility for any injury to people or property resulting from any ideas, methods, instructions or products referred to in the content.