Article

Aboveground Biomass Prediction of Plots in the Natural Forests of Arid Mountains Based on Large Trees

1
State Key Laboratory of Desert and Oasis Ecology, Key Laboratory of Ecological Safety and Sustainable Development in Arid Lands, Xinjiang Institute of Ecology and Geography, Chinese Academy of Sciences, Urumqi 830011, China
2
University of Chinese Academy of Sciences, Beijing 100049, China
3
Key Laboratory of GIS and RS Application Xinjiang Uygur Autonomous Region, Urumqi 830011, China
4
Qinghai Forestry Carbon Sequestration Service Center, Xining 810001, China
*
Author to whom correspondence should be addressed.
Forests 2023, 14(12), 2426; https://doi.org/10.3390/f14122426
Submission received: 14 November 2023 / Revised: 6 December 2023 / Accepted: 11 December 2023 / Published: 12 December 2023
(This article belongs to the Section Forest Inventory, Modeling and Remote Sensing)

Abstract

:
While the use of large tropical trees to predict aboveground biomass (AGB) in forests has previously been studied, the applicability of this approach in arid regions remains unquantified. In the natural forests of arid mountains of Northwestern China, this study collected individual tree data from 105 plots across 11 sites through field measurements. The objective was to assess the feasibility of using large trees for predicting plot AGB in these natural forests of arid mountains. This entailed determining the contribution of large trees, based on which a plot AGB prediction model was constructed. This study also aimed to identify the optimal number of large trees needed for accurate AGB prediction. The findings indicate that within the natural forests of arid mountains, only seven large trees (approximately 12% of the trees in a plot) are necessary to account for over 50% of the plot AGB. By measuring 18 large trees within a plot, this study achieved a precise plot AGB estimation, resulting in a model rRMSE of 0.27. The regression fit R2 for the predicted AGB and the estimated AGB was 0.79, effectively aligning the predicted and measured AGB. In the Tianshan Mountains’ natural forests, the prediction model yielded further improvements with an rRMSE of 0.13 and a remarkable regression R2 of 0.92 between predicted and estimated AGB. However, due to variances in tree size distribution and tree species biomass, the Altai Mountains’ natural forest was found to be unsuitable for predicting plot AGB using large trees. This study establishes that large trees can effectively represent plot AGB in the natural forests of arid mountains. Employing forest surveys or remote sensing to collect data from a few large trees instead of the entire tree population enables accurate plot AGB prediction. This research serves as the initial quantification of large tree utilization for plot AGB prediction in the natural forests of arid mountains, carrying substantial implications for future arid forest inventories, carbon accounting, and the formulation of prudent conservation strategies.

1. Introduction

Natural forests constitute the primary contributors to the global forest carbon reservoir, playing a pivotal role in global warming mitigation and the attainment of carbon neutrality objectives [1,2]. According to forest inventory data, natural forests in Xinjiang encompass over 80% of the total forested area. Notably, the natural forests in the Altai and Tianshan Mountains account for over 90% of the mountainous natural forests in Xinjiang [3]. The Altai Mountains’ natural forests and Tianshan Mountains’ natural forests are located in the arid regions of Northwestern China, where forests are sparsely distributed. However, the high altitude results in a moist—as opposed to dry—habitat for the growth these two natural forests [4]. Therefore, these forests play an important role in maintaining the ecological barrier, in sequestering carbon, and in reducing emissions throughout the arid region; moreover, they are also a valuable carbon pool in Western China [5,6]. AGB serves as a crucial metric for evaluating forest carbon sequestration capacity [7]. Accurate AGB estimation in the natural forests of arid mountains is indispensable for carbon sink calculations [8,9].
Numerous studies have unequivocally demonstrated that the rate of carbon accumulation is notably higher in large trees than in their smaller counterparts [10,11]. Furthermore, it has been consistently observed that a limited number of large trees contribute significantly to overall biomass [12,13,14,15]. Recently, a comprehensive study spanning 48 forest plots across the globe revealed that the top 1% of large trees accounted for a remarkable 50% of AGB [16]. Based on the disproportionate contribution of large trees to biomass, an innovative approach for predicting AGB within plots was introduced [17,18]. In the tropical moist natural forests of Africa, the findings provided the first quantification of the fact that a mere 20 large trees are responsible for 50% of the total biomass, and a comprehensive model was developed as a result [17]. Moreover, a novel plot AGB prediction model incorporating tree diameter at breast height, tree height, and wood density was proposed based on data from 118 tropical forest plots across Africa, America, and Asia [18].
Estimating AGB at the plot level by focusing on large trees can substantially diminish the requirement to assess individual trees, thereby lessening the need for destructive sampling and field measurements [18,19]. Employing large trees for the estimation of plot AGB represents a novel approach that can be accurately assessed through the direct utilization of remote sensing data [20]. Advances in remote sensing technology, particularly the advent of lidar technology, enable the identification of key parameters such as individual tree locations, crown dimensions, and tree heights [21,22,23,24]. Consequently, in tropical regions, it is unnecessary to monitor every single tree in forest plot surveys and remote sensing procedures; a mere selection of sizable trees suffices for prediction [18].
Currently, most of the studies related to biomass prediction using large trees focus on forests in tropical and temperate regions. Mountainous natural forests located in the arid region of Northwest China have not been adequately studied. In the arid region of Northwestern China, a recent study utilized structural equation models to investigate the influence of the top 20% of large trees on AGB in both natural and artificial forests. The findings underscore the substantial contribution of large trees to forest biomass, underscoring their significance in arid region ecosystems [25]. Nevertheless, there is currently no established prediction model for AGB specific to large trees in arid regions.
In general, large trees can reach the upper canopy layer and are larger in diameter than most trees in the forest. There exists no universally accepted definition for “large trees” [16,26]. In the current relevant studies, the definition of large trees depends on the species and forest types [25]. In tropical forests, trees with a diameter at breast height (DBH) greater than 100 cm are often referred to as large trees; in temperate deciduous forests, large trees may have a DBH of 60 cm or more. However, in cold coniferous forests, a tree with a DBH of 20 cm may already be large. In this study, the natural forests of arid mountains are distributed in high-altitude mountains with cold climate, and the forests are dominated by coniferous forests. Large trees with a DBH greater than 70 cm are almost negligible, and trees with a DBH greater than 20 cm are already larger [27]. The minimum average diameter at breast height of each plot in this study is 15 cm, and some trees in almost all plots reach this value. Therefore, the value of 15 cm diameter at breast height is used as a criterion to classify large trees.
In this research, to explore the viability of employing large trees as predictors of AGB in the natural forests of arid mountains, we utilized data collected from 105 plots. Our specific objectives encompass the following: (1) To examine the relationship between tree size and AGB and analyze the contribution of large trees to plot AGB in the natural forests of arid mountains. (2) To formulate a predictive model for the plot AGB of large trees, tailored to the natural forests of arid mountains. (3) To propose an optimal quantity of large trees for the purpose of predicting plot AGB.

2. Materials and Methods

2.1. Study Area

Xinjiang is situated in the heart of the Asian continent, where the arid continental climate significantly constrains the distribution and growth of forests. Typically, forests are found in mountains regions with higher precipitation and river valleys with ample water sources [8]. Xinjiang’s mountains’ natural forests are positioned on shady slopes interspersed with sunlit grasslands, forming strip-like and patchy patterns and resulting in sparsely populated forests [28]. The distribution of mountains’ natural forests exhibits remarkable disparity. The Tianshan natural forests reign supreme, representing 62.5% and 63.8% of the total area and volume of living trees in Xinjiang’s mountains’ natural forests, respectively. The Altai Mountains come next, accounting for 35.7% of both the total area and volume of living trees in Xinjiang’s mountains natural forests [3].
The Tianshan natural forest is situated at elevations ranging from 1250 to 2800 m and experiences an annual precipitation level of 400 to 800 mm [29]. These forests, predominantly characterized by Picea schrenkiana (Picea schrenkiana Fisch. et Mey.), exhibit canopy densities within the range of 0.5 to 0.8 [30]. Typically, mature trees attain heights of approximately 30 m, with a maximum diameter at breast height of up to 1.5 m and an average diameter at breast height ranging from 15 to 40 cm. The Altai Mountains’ natural forests extend across altitudes of 1300 to 2600 m, with precipitation levels exceeding 400 mm within the forested region [28,30]. These forests primarily consist of Larix sibirica (Larix sibirica Ledeb.), while Abies sibirica (Abies sibirica Ledeb.), Picea obovata (Picea obovata Ledeb.), and Pinus sibirica (Pinus sibirica Rupr. Mey.) are interspersed in smaller proportions. Secondary forests of Betula pendula (Betula pendula Roth.) and Populus tremula (Populus tremula L.) are distributed in lower slopes and valleys [8]. The canopy density typically falls within the range of 0.3 to 0.6, with an average tree height of approximately 15 m, and individual trees can reach heights exceeding 30 m. The average diameter at breast height of the forest measures 18 to 20 cm, with the largest individual tree diameter at breast height reaching up to 90 cm.

2.2. Field Measurements

Field sampling was conducted from July to September 2011 within the natural forest distribution area of Xinjiang’s mountainous regions. The grid method [31] was employed for plot arrangement, with each grid covering an area of 10 km × 10 km. These plots were thoughtfully distributed to ensure a representative selection, encompassing various stand densities and favorable natural growth conditions, thereby providing a comprehensive portrayal of the study area’s characteristics [30,32]. A total of 105 plots were randomly chosen from the 210 grids with forest coverage, and an 800 m2 plot was designated within each grid. This sampling strategy resulted in 105 plots in total, with 70 located in the Tianshan Mountains’ natural forests and 35 in the Altai Mountains’ natural forests. The distribution of these plots and detailed data are depicted in Figure 1 and Table 1.
In this study, tree diameter at breast height (DBH, at a height of 130 cm above the ground) and tree height (H) for all trees with a minimum diameter at breast height of 5 cm within each plot were measured [33]. A total of 70 plots across eight sites in the Tianshan Mountains region were surveyed, comprising 3347 trees. In addition, 35 plots were surveyed across three sites in the Altai Mountains region, encompassing 2697 trees. In total, we measured 6044 trees within the natural forests of these two mountains areas.
The collected field data included information for both the plots and individual trees [34]. The plot data encompassed details such as plot numbers, names, coordinates, elevations, and more. On the other hand, individual tree data included information such as plot numbers, individual tree diameter at breast height, tree height, and other relevant parameters.

2.3. AGB Estimation from Field Plot Measurements

Based on the field plot measurements, data pertaining to the diameter at breast height and tree height for each tree were selected. Utilizing the allometric growth equations specific to leaves, branches, and stems of each tree species (Table 2), we calculated the biomass of each organ within individual trees [8,30]. The biomass contributions of leaves, branches, and stems for each individual tree were aggregated to determine the aboveground biomass of the individual tree (Equation (1)). Subsequently, the AGB for all individual trees within a given plot was summed to derive the total aboveground biomass of the plot (Equation (2)) [35]:
A G B t r e e = W S + W B + W L
A G B e s t = 1 i A G B t r e e
where A G B t r e e is the aboveground biomass of individual tree; W S is the biomass of stems; W B is the biomass of branches; W L is the biomass of leaves; i is total number of trees in each plot. A G B e s t is the estimated biomass of plots based on measured data.

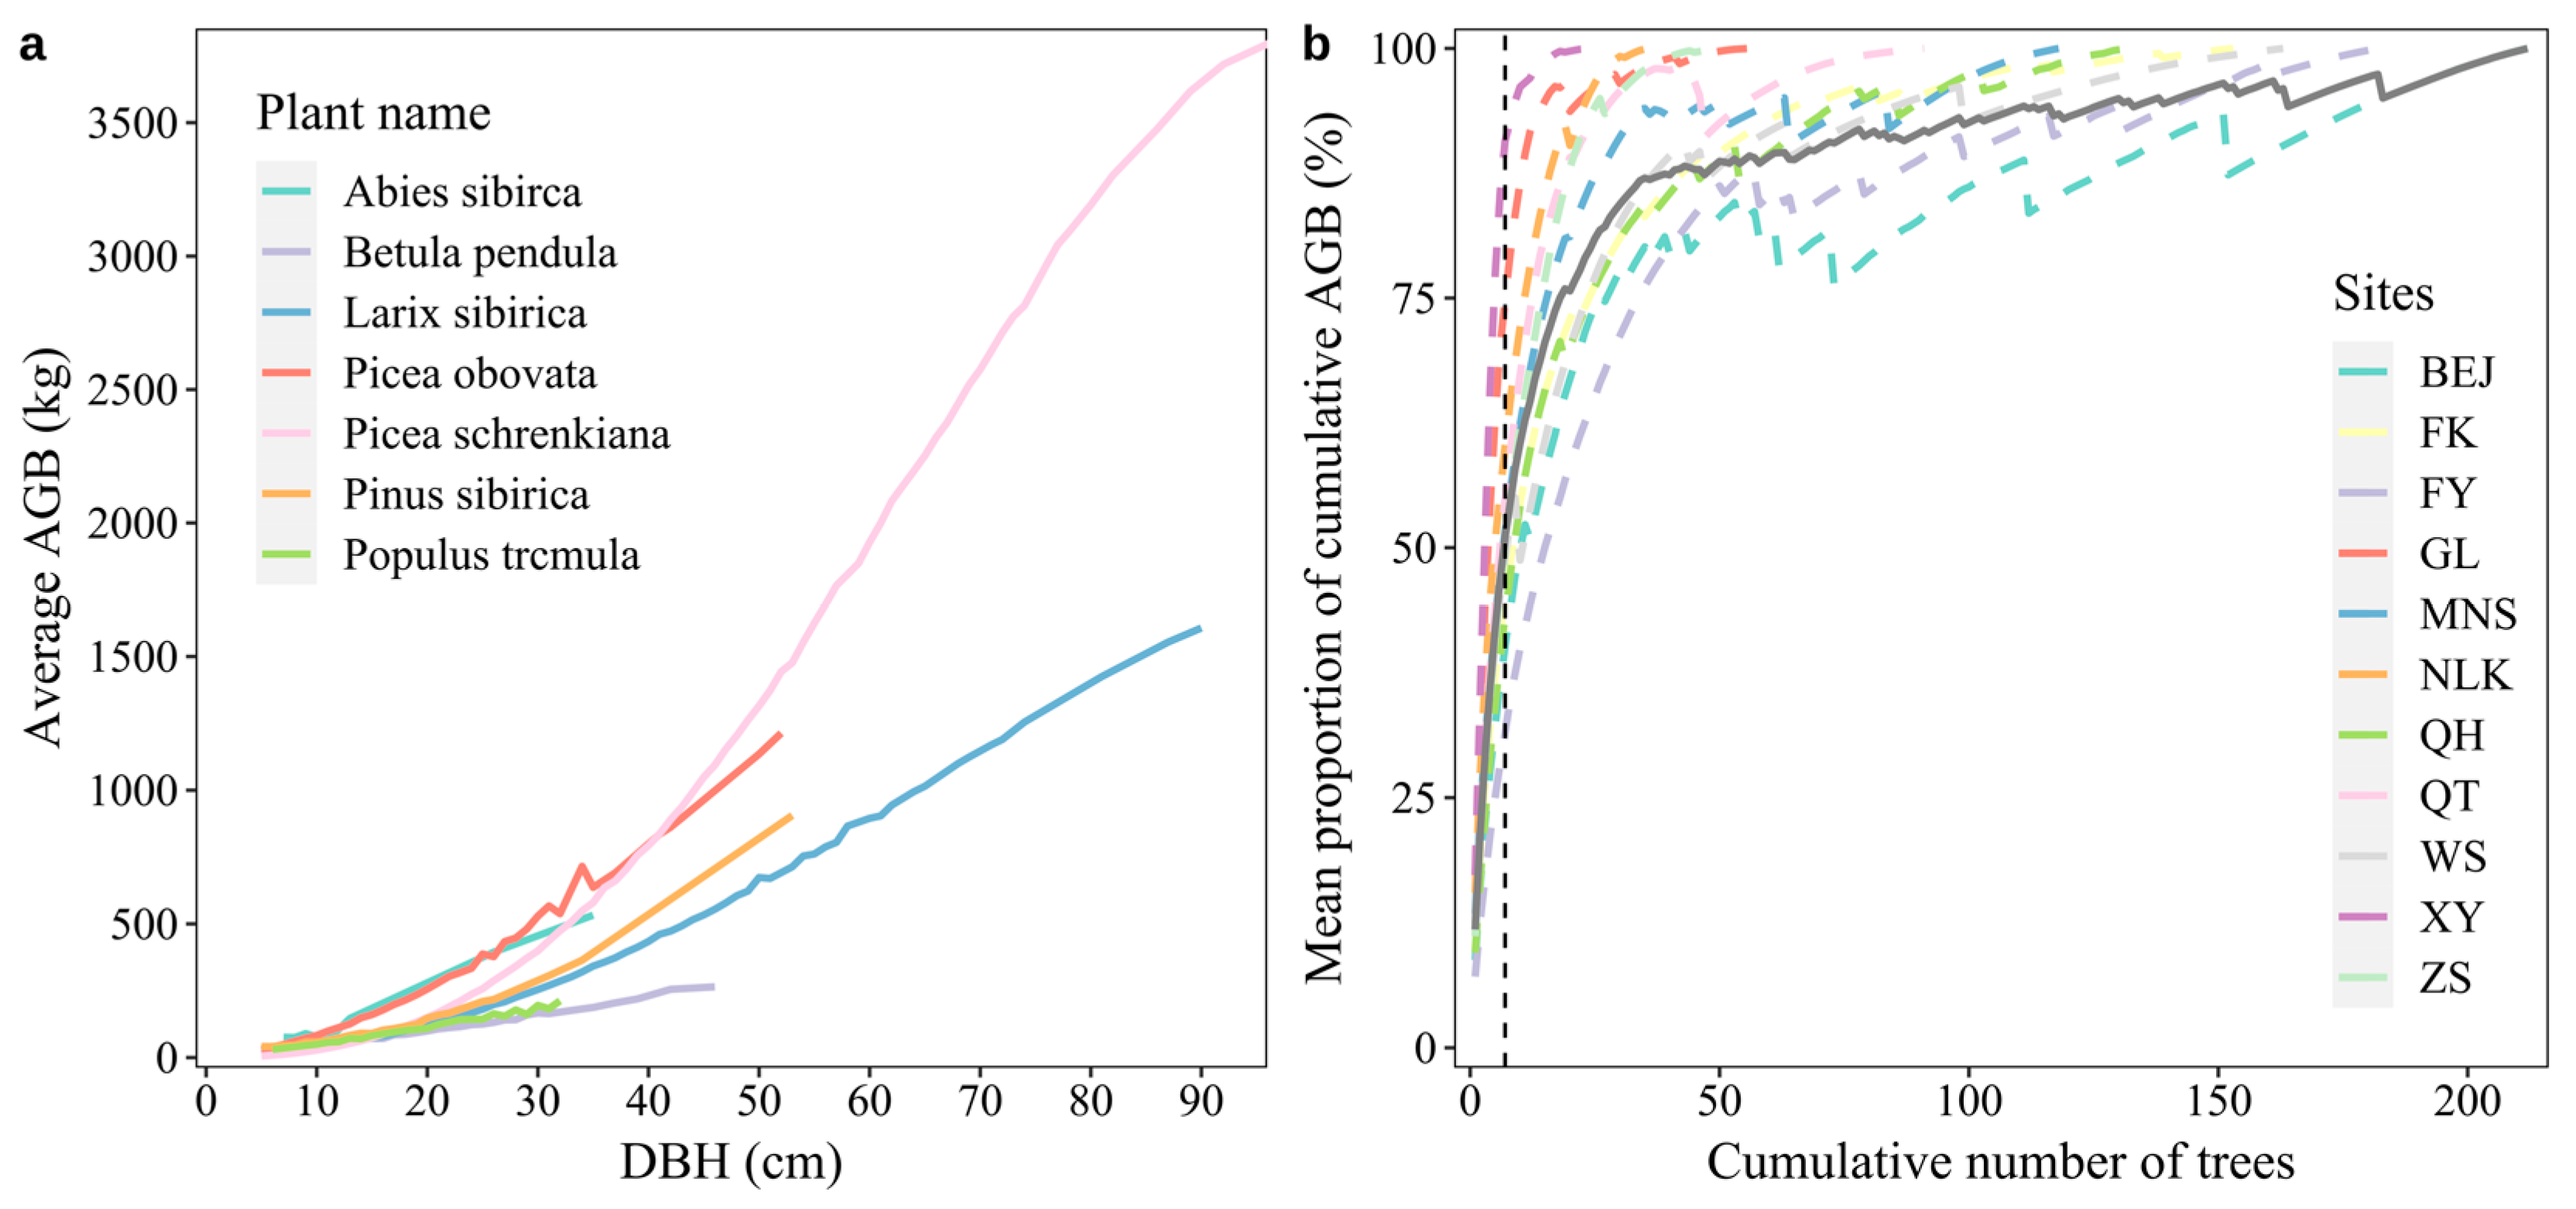
2.4. Analysis of the Relationship between AGB and Diameter at Breast Height

To investigate the role of large trees in biomass dynamics within the natural forests of arid mountains, we conducted a comprehensive analysis at both the individual tree and plot levels. All statistical analyses were executed using R software (v.4.2.3; R Foundation for Statistical Computing, Vienna, Austria).
At the individual tree level, we explored the association between diameter at breast height and AGB. Initially, we rounded the diameter at breast height values of all individual trees to the nearest integer. Subsequently, we categorized the trees by their respective species and computed the average AGB corresponding to each specific diameter at breast height value [14]. The results were visualized by plotting curves depicting the relationship between average AGB and diameter at breast height for each tree species, thereby facilitating a detailed examination of how the individual-tree AGB varied with diameter at breast height for different species.
At the plot level, we conducted an analysis to examine how cumulative AGB, when considered as a proportion of the total AGB for each sample plot, evolved with the gradual addition of individual trees. Our methodology involved the initial arrangement of individual tree diameter at breast height within each plot in descending order, effectively representing the accumulation of large trees. Subsequently, we incrementally introduced one tree at a time, facilitating the calculation of cumulative AGB for each plot (Equation (3)). The proportion of cumulative AGB (Equation (4)) in each plot was derived from the ratio of the cumulative AGB of the first n trees to the estimated total AGB of the plot [17]:
A G B n = 1 n A G B t r e e
P = A G B n A G B e s t × 100 %
where n is the first n trees in descending order of diameter at breast height. A G B n is the cumulative biomass of the first n trees in each plot. P is the proportion, i.e., the cumulative AGB of the first n trees to the total estimated AGB of each plot.
To enhance comprehensibility, the 105 plots were categorized by site. Then, the average proportion of cumulative AGB was calculated for all plots with the same number of cumulative trees at each site. These data were then graphically represented in the form of curves, illustrating the relationship between the mean proportion of cumulative AGB and the number of accumulated trees. These visual representations aided our analysis in determining whether large trees could accurately represent the total plot AGB.

2.5. Construction of the Plot AGB Prediction Model Based on Large Trees

To ensure both simplicity and precision in biomass prediction, it is imperative to opt for readily obtainable tree measurement parameters. Commonly, biomass prediction models employ variables such as diameter at breast height, tree height, and crown size. Given the current high accuracy in remote sensing and LiDAR technologies for diameter at breast height and tree height extraction, this study chose diameter at breast height and height as the key explanatory variables [36]. By amalgamating an allometric growth model derived from actual measured biomass, we formulated a plot AGB prediction model large trees (Equation (5)). The model is expressed as follows:
A G B p r e d = a D B H ¯ L T n 2 H ¯ L T n b
In the model, A G B p r e signifies the predicted AGB of each plot; a and b are model coefficients; L T n denotes the first n large trees in the plot; and DBH ¯ L T n and H ¯ L T n represent the average diameter at breast height and average height of the first n large trees, respectively. The calculation of D B H ¯ L T n and H ¯ L T n is as follows: the diameters at breast height of all trees within the plot are arranged in descending order, and with the addition of each tree, the average of cumulative indicators for the first n trees is computed.
To ensure model stability and to assess its generalization capacity, this study employs the leave-one-out cross-validation (LOOCV) method [18]. In this process, only one dataset is tested at a time for plots with the same cumulative number of trees, while the remainder serve as training data to estimate the parameters of the prediction model. This cycle is repeated until all datasets have been tested once. Subsequently, the model coefficients are derived by averaging across all models. The relative root-mean-squared error (rRMSE, Equation (6)) is used to evaluate the accuracy of the AGB prediction model based on large trees, which contrasts the estimated AGB (Equation (2)) against the predicted AGB (Equation (5)):
r R M S E = A G B e s t A G B p r e d 2 N A G B e s t ¯
where A G B e s t is the estimated biomass of plots based on measured data; A G B p r e d is the predicted from the model; A G B e s t ¯ is the is the mean value of the estimated AGB; N is the number of estimated value.

2.6. Optimal Number of Large Trees for Plot AGB Prediction

Utilizing the methods outlined above, we developed AGB prediction models tailored to plots featuring varying cumulative counts of large trees. Our objective centers on the identification of an optimal threshold for large trees when predicting plot AGB. To achieve this, experiments with various cumulative numbers of large trees were conducted. The selection of the optimal number of large trees was guided by the prediction models we have established, aiming for minimal error while upholding the requirement for the smallest possible number of large trees.

3. Results

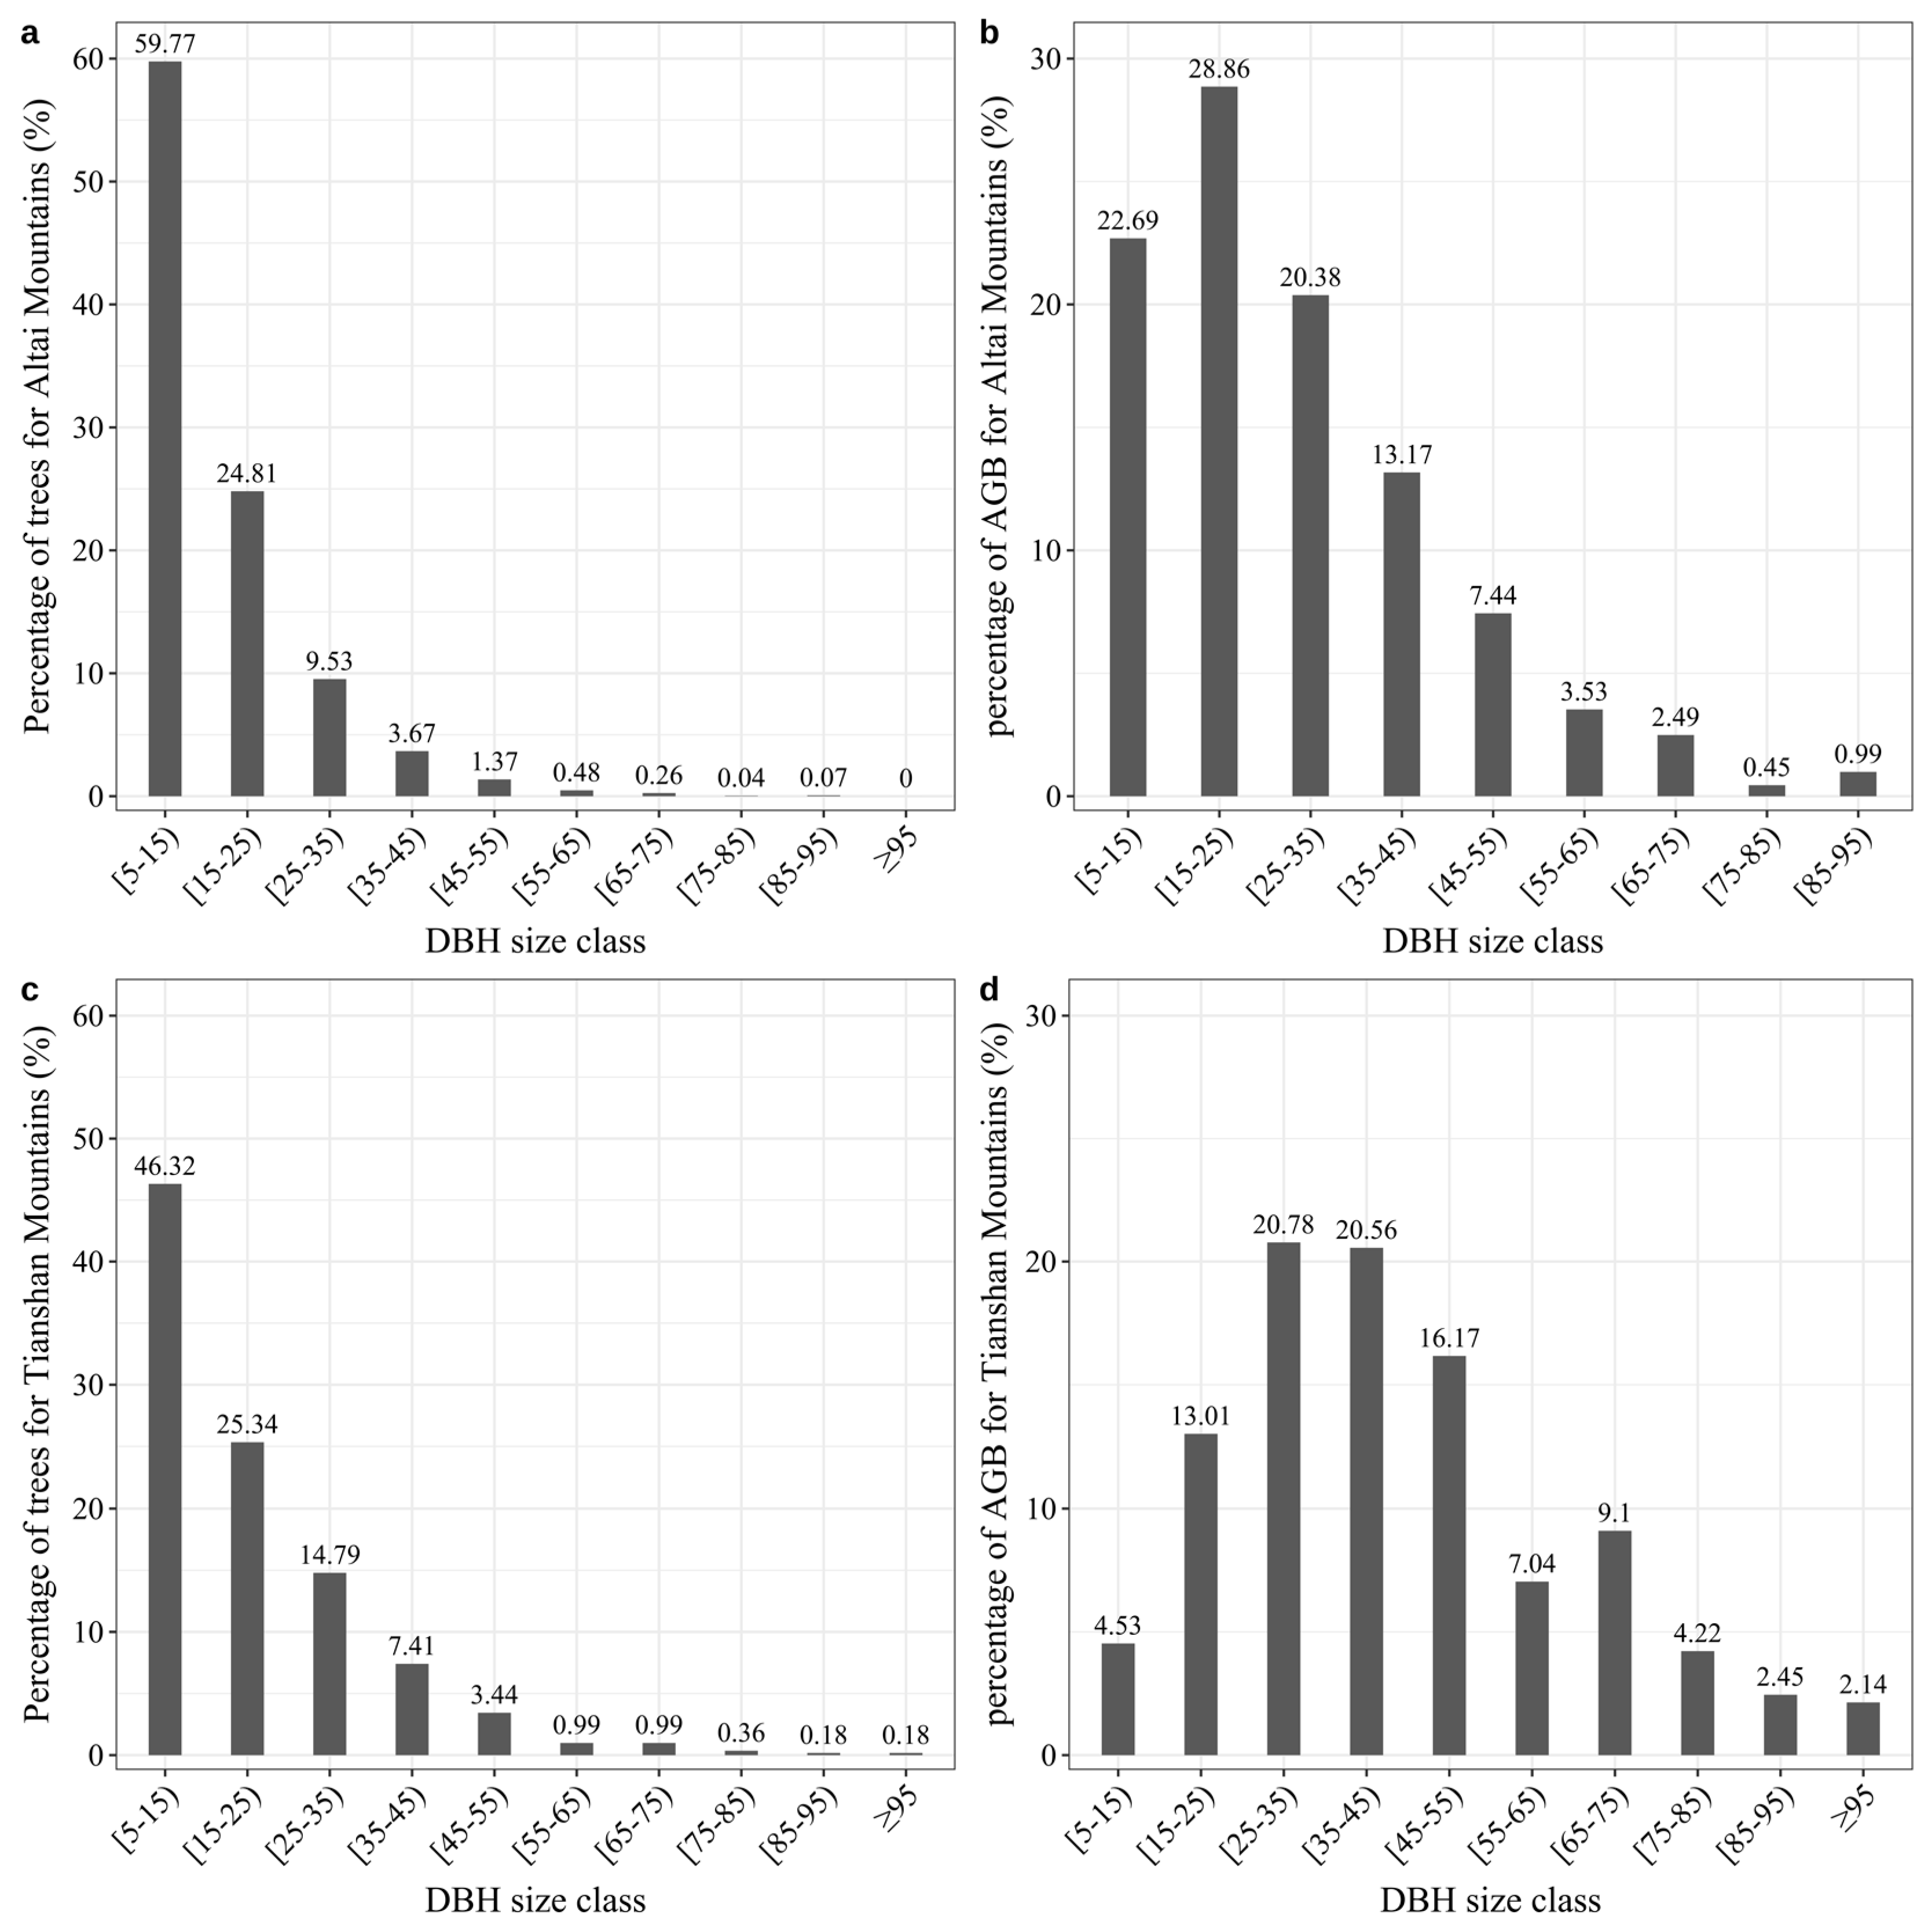
3.1. Contribution of Large Trees to AGB

In the natural forests of arid mountains, the average AGB of each tree species exhibits a rapid and escalating rise with increasing diameter at breast height, with the rate of increase amplifying (Figure 2a). Specifically, at 20 cm diameter at breast height, the average AGB for each tree species is 99–257 kg. With diameter at breast height doubling to 40 cm, the average AGB increases to 221–799 kg. In essence, a onefold increase in diameter at breast height results in an approximately 2.23- to 3.11-fold increase in average AGB. Notably, for the predominant tree species in the Tianshan Mountains’ natural forests, Picea schrenkiana, and the dominant species in the Altai Mountains’ natural forests, Larix sibirica, as diameter at breast height escalates from 30 cm to 60 cm, the average AGB increases from 254–399 kg to 895–1928 kg, marking an increase of approximately 3.52 to 4.83 times. When the diameter at breast height increased from 30 cm to 90 cm, the AGB increased by 6.32 to 9.14 times. This underscores that, for the same increment in diameter at breast height, large trees store significantly more AGB than their smaller counterparts.
Simultaneously, the average proportion of accumulated AGB in each plot at each site experiences a rapid upsurge as large trees accumulate (Figure 2b). Notably, with the inclusion of only seven large trees (approximately 12% of the trees within the plots), the cumulative AGB attributed to large trees already surpasses 50% of the plot’s total AGB. Furthermore, when the number of cumulative large trees reached 25 (approximately 42% of the trees within the plots), the cumulative AGB from large trees exceeded 80% of the total AGB of the plot (Figure 2b). Notably, at this point, both the slope and trajectory of the curve stabilize significantly. It is evident that large trees, even though they constitute a minority within the overall tree count in a plot, account for the majority of the plot’s AGB.
The results of the analysis showed that large trees stored more AGB in the natural forests of arid mountains. Large trees effectively reflected the AGB of the plot and contributed significantly to the total AGB of the plot.

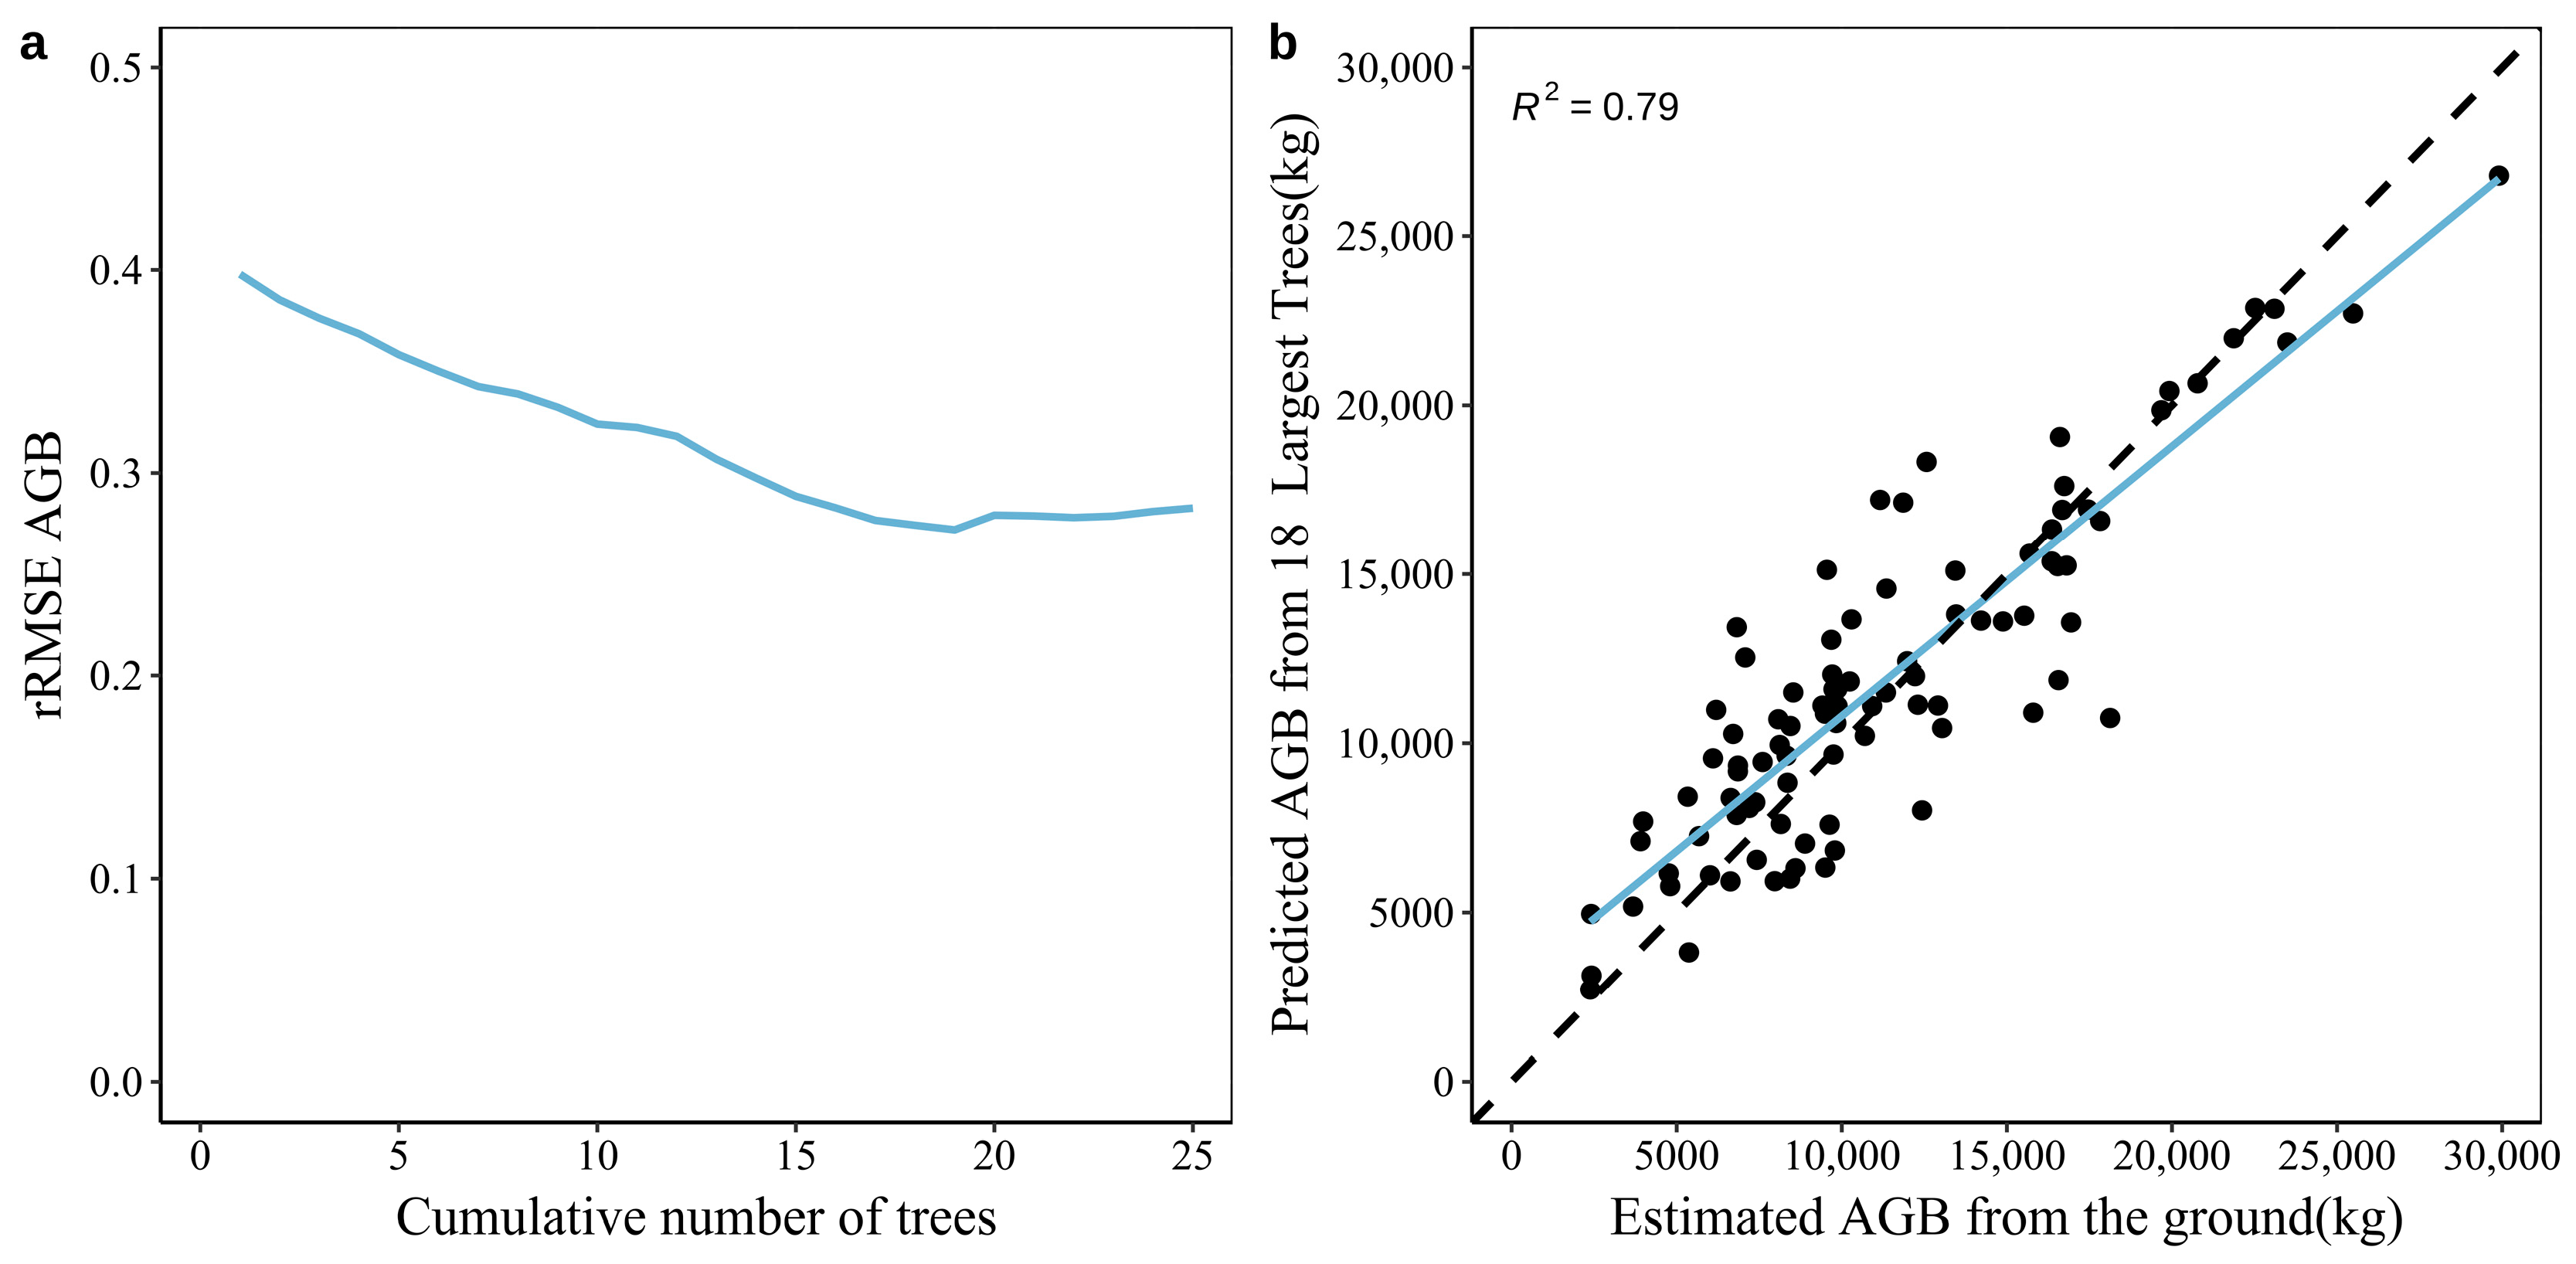
3.2. Construction of the AGB Prediction Model for The Plots of The Natural Forests of Arid Mountains Based on Large Trees

In the natural forests of arid mountains, the research findings regarding the contribution of large trees to plot AGB reveal that the cumulative AGB attributed to the top 25 large trees within a plot already surpasses 80% of the total plot AGB. Consequently, data from these leading 25 cumulative trees were extracted to formulate a prediction model. The results show that when 18 large trees are accumulated (approximately 30% of the trees within the plots), the lowest rRMSE of the prediction model was 0.27 (Figure 3a). This indicates that the model predictions were the most accurate at this point. Consequently, 18 large trees have been deemed the optimal number for predicting AGB within plots situated in the natural forests of arid mountains. The prediction model based on 18 large trees is as follows:
A G B p r e d = 6.12 D B H ¯ L T 18 2 H ¯ L T 18 0.77
The comparison of the model-predicted AGB with the estimated AGB can be visualized in a scatter plot (Figure 3b). Furthermore, the fitted regression R2 between the plot AGB predicted by the model and the AGB estimated from field measurements was 0.79 (Figure 3b). In summary, the accumulation of 18 large trees yields a robust prediction of AGB at the plot level within the natural forests of arid mountains.

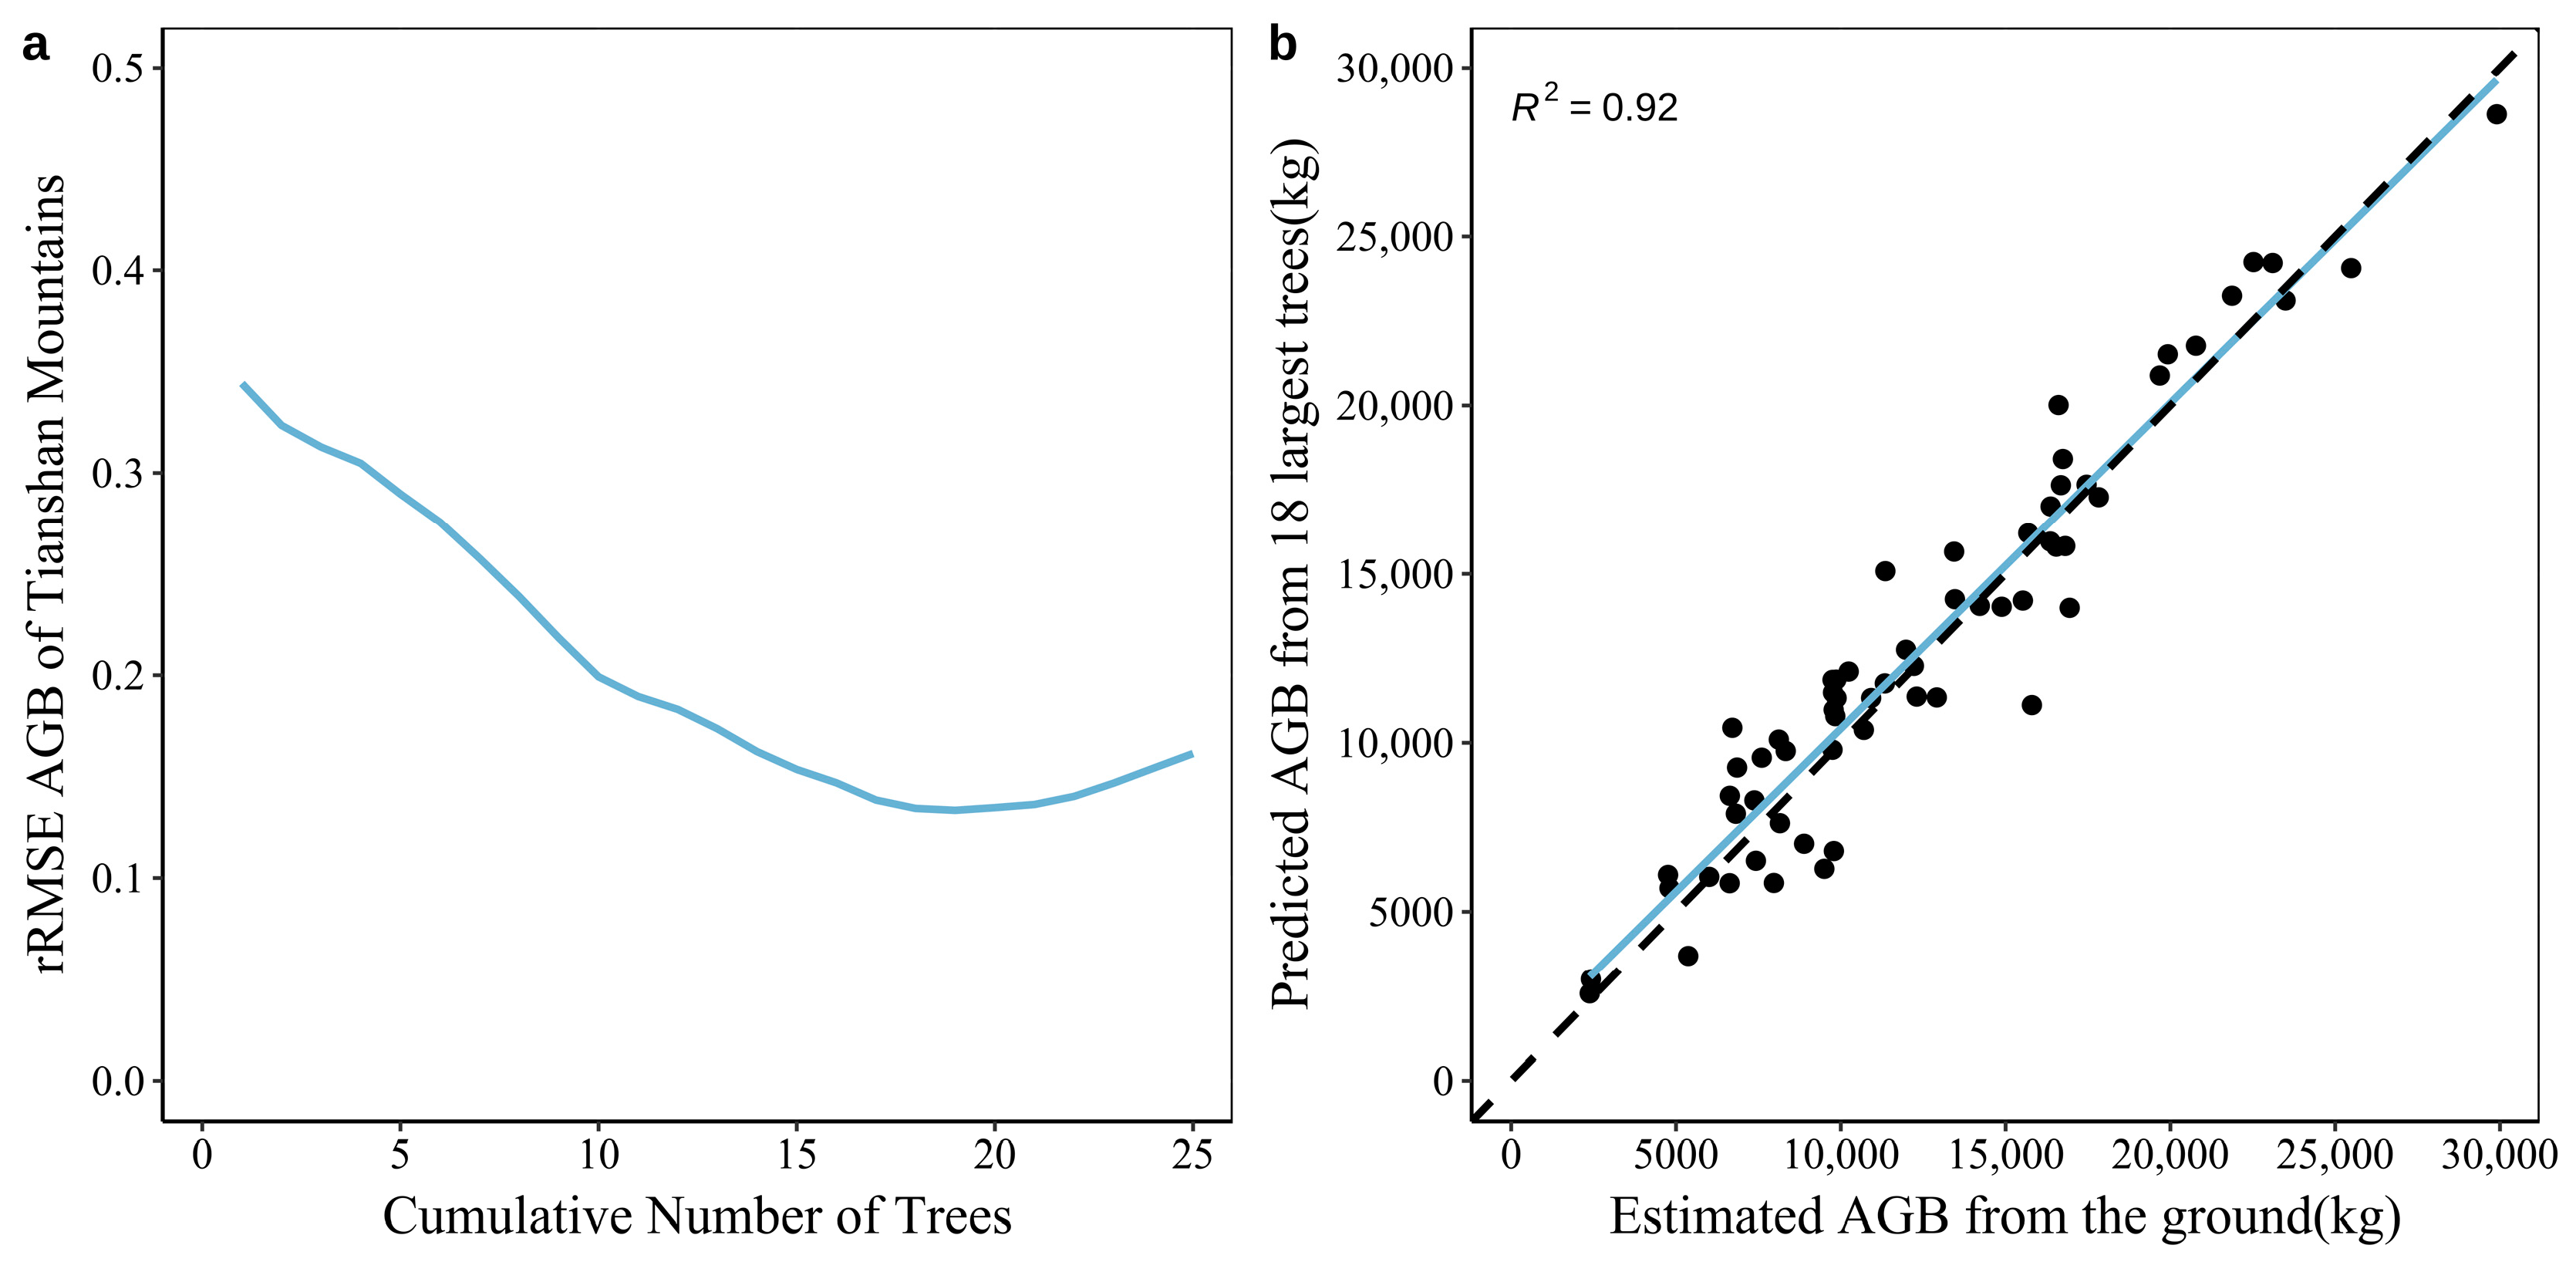
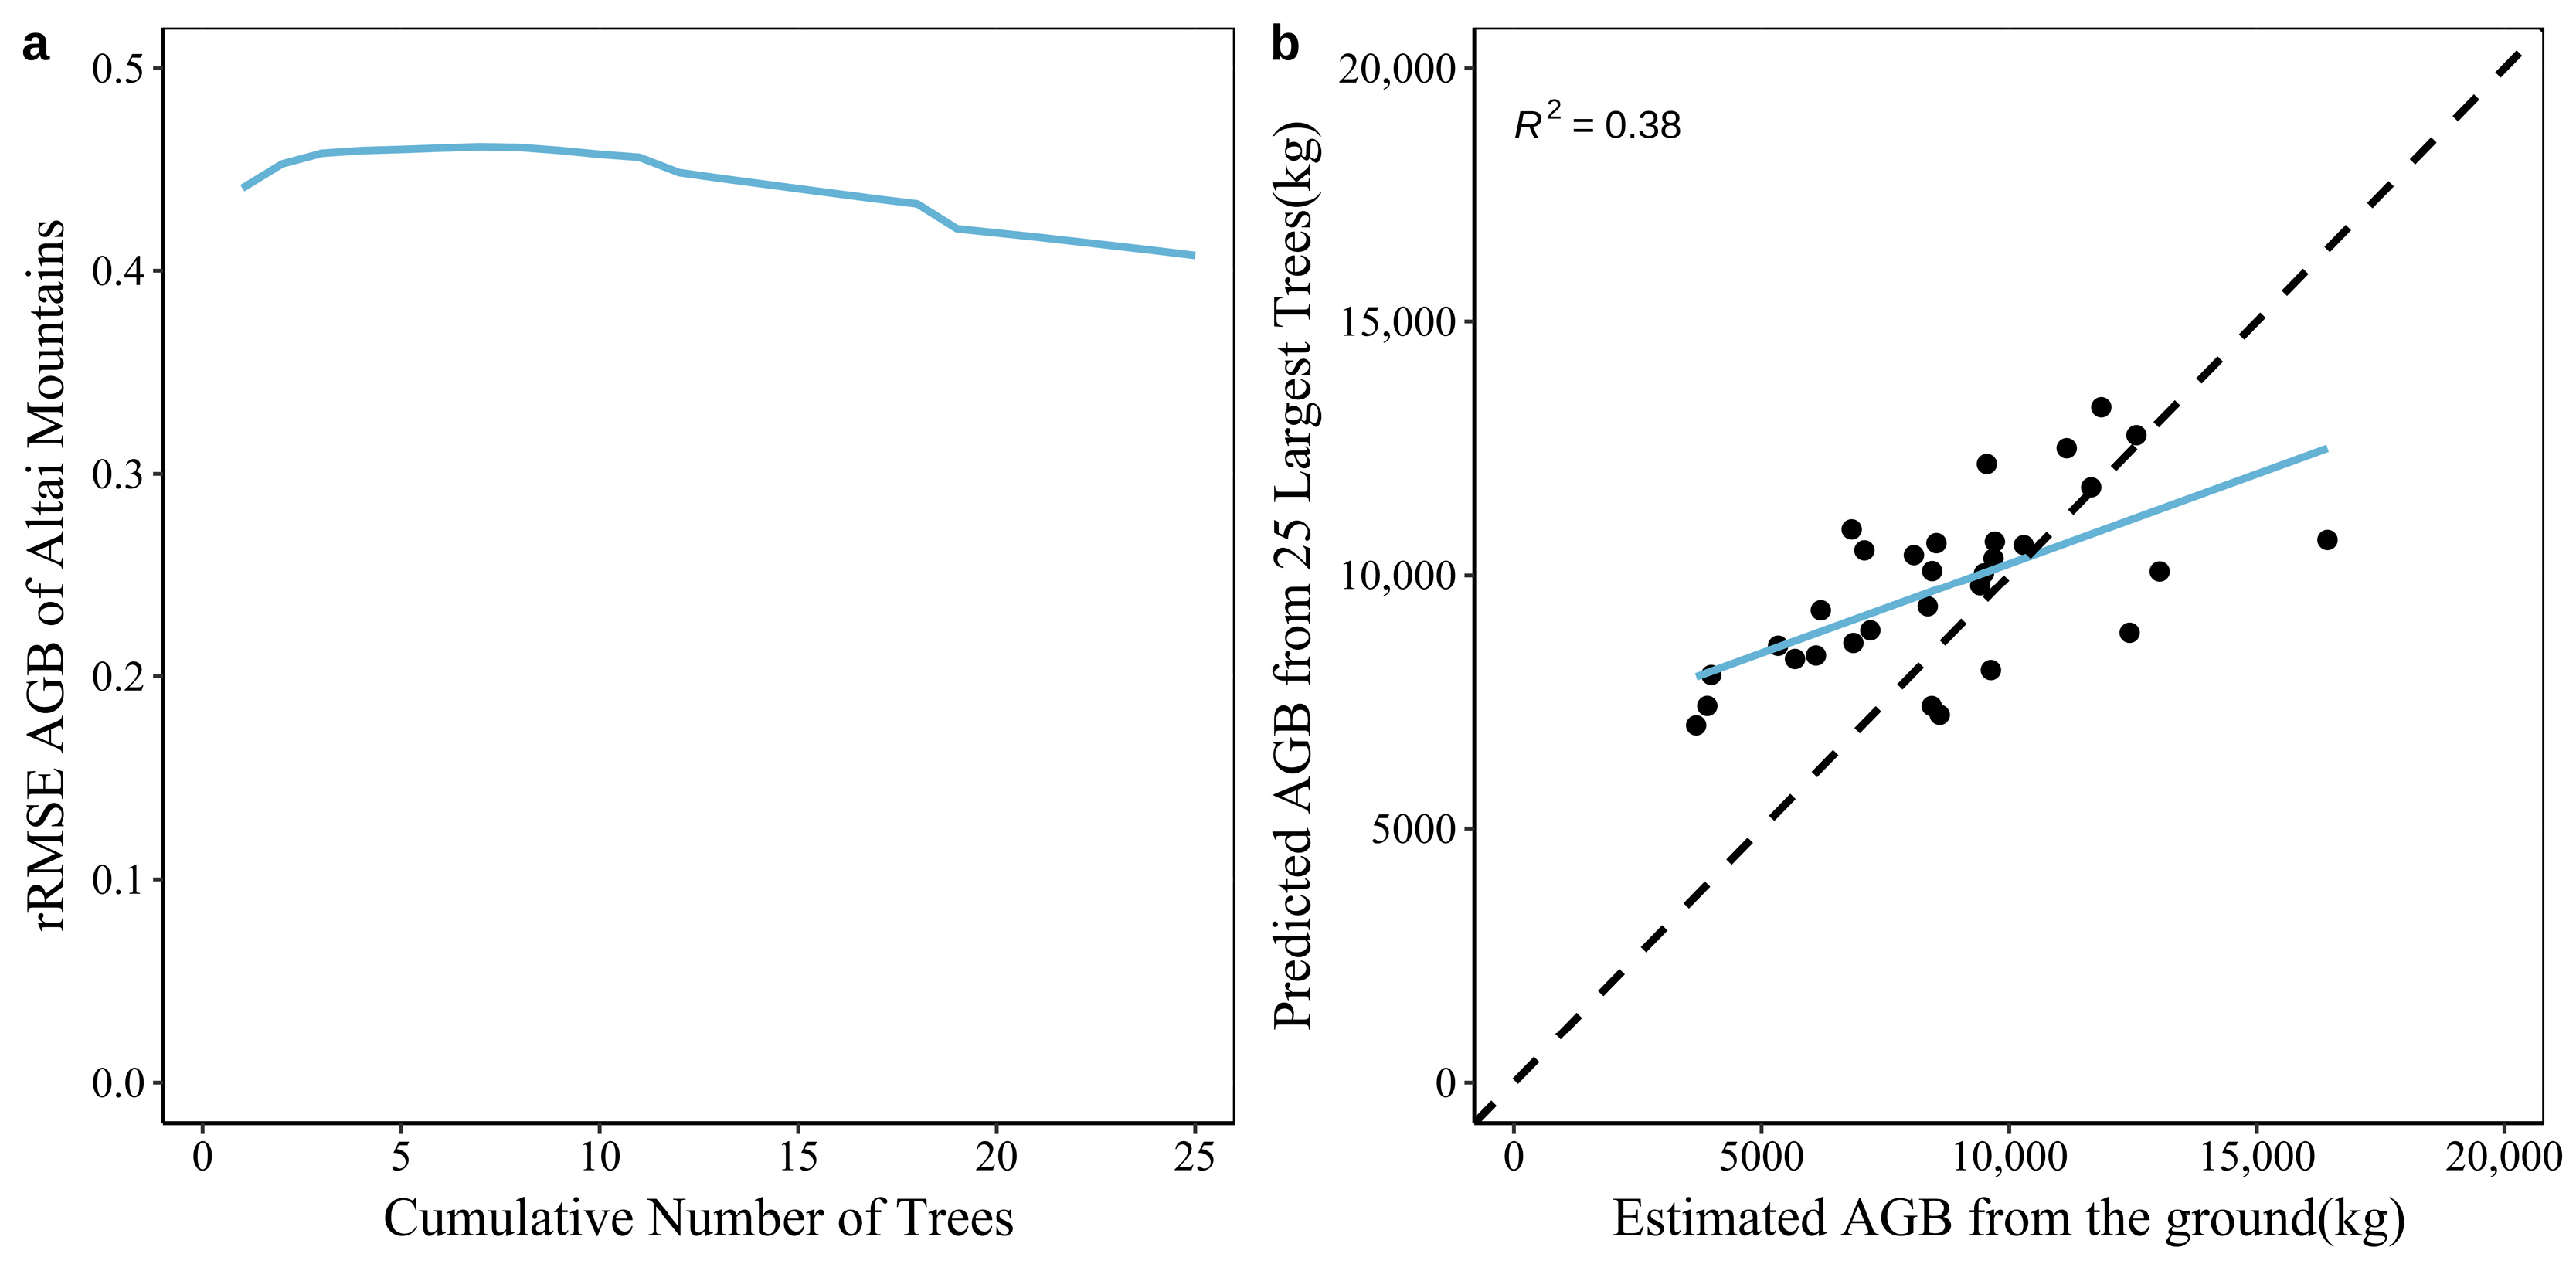
3.3. Construction of the AGB Prediction Model for Natural Forest Plots in the Tianshan and Altai Mountains Based on Large Trees

The highest accuracy of the prediction model was achieved by accumulating 18 large trees (approximately 35% of the trees within the plots) in the Tianshan Mountains’ natural forests. At this time, the model had the lowest rRMSE of 0.13 (Figure 4a). Furthermore, the fitted regression R2 between the plot AGB predicted by 18 large trees and the measured estimated plot AGB reached a substantial 0.92 (Figure 4b). In summary, employing 18 large trees provides a robust prediction of AGB at the plot level within the Tianshan natural forest. Consequently, we identified 18 large trees as the optimal number for predicting AGB within the Tianshan natural forest plots. The prediction model based on these 18 large trees can be represented as follows:
A G B p r e d = 4.23 D B H ¯ L T 18 2 H ¯ L T 18 0.81
In the natural forests of the Altai Mountains, the lowest rRMSE value of 0.41 was obtained for the prediction model when accumulating 25 large trees (approximately 32% of the trees within a plot) (Figure 5a). However, the rRMSE was relatively high. And the fitted regression R2 between the plot AGB predicted by these 25 large trees and the measured estimated plot AGB was notably low, reaching only 0.38 (Figure 5b). These findings suggest that large trees within the natural forest of the Altai Mountains are not effective predictors of AGB at the plot level.

4. Discussion

4.1. Comparing Tianshan and Altai Mountains’ Natural Forests

The research findings demonstrate that utilizing large trees within a plot for predicting the overall AGB of the plot results in a high prediction accuracy in the natural forests of the Tianshan Mountains, whereas the outcomes are less favorable in the natural forests of the Altai Mountains. To elucidate why constructing the plot AGB prediction model based on large trees is not suitable for the natural forests of the Altai Mountains, we conducted a comparative analysis of the number and AGB proportion of individual trees within various diameter at breast height ranges in both the Tianshan and Altai Mountains natural forests (Figure 6). Both mountainous natural forests are characterized by a prevalence of small trees, but the natural forests of the Tianshan Mountains harbor a greater number of large trees compared to the Altai Mountains [27]. This discrepancy arises from the fact that in the natural forests of the Altai Mountains, approximately 60% of individual trees fall within the diameter at a breast height range of 5–15 cm (Figure 6a,c). Concerning biomass distribution, AGB in the natural forests of the Altai Mountains tends to be concentrated in trees with smaller and medium diameters at breast height ranges (Figure 6b), whereas AGB in the Tianshan natural forests is more evenly distributed, with an emphasis on trees possessing medium and larger diameters at breast height ranges (Figure 6d). In the Tianshan Mountains’ natural forests, individual trees with a diameter at breast height ≥ 45 cm account for over 40% of the total AGB, and those with a diameter at breast height ≥ 35 cm contribute to over 60% of the total AGB. In Altai Mountains’ natural forests, individual trees with a diameter at breast height ≥ 45 cm represent only 14.9% of the total AGB, and those with a diameter at breast height ≥ 35 cm account for merely 28% of the total AGB [6,37].
In this study, we surveyed 35 plots in the Altai Mountains’ natural forests, comprising a total of 2697 trees and approximately 318 metric tons of AGB. In contrast, the Tianshan Mountains’ natural forests encompassed 70 plots, including a total of 3347 trees and approximately 895 metric tons of AGB. Notably, while the Tianshan Mountains’ natural forests have only 650 more trees than the Altai Mountains’ natural forests, their AGB is 2.8 times greater. The substantial difference in AGB distribution between the Tianshan Mountains’ natural forests and the Altai Mountains’ natural forests can be attributed to several factors. First, the Tianshan Mountains’ natural forests exhibit a higher prevalence of large trees compared to the Altai Mountains’ natural forests. Second, the two mountains’ natural forests differ in their distribution of tree species. The Tianshan Mountains’ natural forests are predominantly composed of Picea schrenkiana, whereas those of the Altai Mountains are dominated by Larix sibirica, interspersed with varying proportions of other tree species [8,27]. Moreover, within the diameter at a breast height range of 50 cm or less, all tree species are relatively well represented, and Picea schrenkiana inherently possesses a higher AGB than Picea obovata, Abies sibirica, and other tree species of the same diameter at breast height value (Figure 2a). Furthermore, as the diameter at breast height increased, the AGB growth rate of Picea schrenkiana significantly surpassed that of Larix sibirica. The characteristic of Picea schrenkiana is consistent with the disproportionate contribution of a few dominant species mentioned by Bastin et al. [17,18] in their study of the contribution of large trees in the African tropics. Consequently, the disparity in tree size distribution and AGB among different tree species contributes to the contrasting AGB distribution between the two mountain natural forests, elucidating why the Altai Mountains are not conducive to predicting plot AGB using large trees. Ni et al. [4] have also found that forest biomass is higher in the Tianshan Mountains than in the Altai Mountains for a number of reasons, including elevation, stand age, and stand composition, and our analysis is consistent with this study.

4.2. Contrasting Arid Mountains and Tropical Forests

The findings of this study reveal that within the natural forests of arid mountains, approximately 12% (approximately 27 large trees per 800 m2) of trees within a plot can contribute to over 50% of the plots’ total AGB. In contrast, within tropical forests, only approximately 5% (approximately 20 large trees per hectare) of the trees in a plot are capable of constituting more than 50% of the total plot AGB [17,18]. This discrepancy primarily arises from the more balanced AGB distribution across different diameters at breast height classes in the natural forests of arid mountains. Although most AGB in both tropical forests and the natural forests of arid mountains is stored in a minority of large trees, the natural forests of arid mountains require a greater number of large trees to predict plot AGB accurately [38,39]. Upon comparing tropical forests in the Americas, Africa, and Asia, Bastin et al. [18] found that there were more large tropical trees in Africa and a more balanced distribution of biomass among the different diameters at breast height classes in Asia, and we found similar results in arid-zone montane natural forests.
In tropical forests, the optimal number of large trees for predicting plot AGB encompasses merely the top 5% of large trees in a plot [16,17,18], while in the natural forests of arid mountains, the top 30% of large trees in a plot is necessary. The underlying reasons for the variation in AGB distribution between tropical forests, which favor large trees, and the natural forests of arid mountains, where AGB distribution is more balanced, may be intricately linked to factors such as geographical environment, tree species, forest structure, and more [16,40]. These factors warrant further investigation.

4.3. Significance of Large Trees in Arid Mountains’ Forests

Previously, studies based on 73 plots ranging from 25 to 400 m2 in the arid northwestern region have demonstrated that the upper 20% of large vegetation contributes to an impressive 59.25% of the total plot AGB [25]. This outcome is corroborated by the findings of this research. Additionally, this study introduces a predictive model that elucidates how sampling 18 large trees within the natural forests of arid mountains can effectively anticipate plot AGB. These research results serve as a quantifiable extension of the study and represent the pioneering quantification of employing large trees for plot AGB prediction in arid regions.
In the natural forests of arid mountains, it becomes evident that a mere 12% of trees within a plot can harbor more than 50% of the plot AGB. This discovery underscores the pivotal role of large trees in the natural forests of arid mountains, aligning with prior findings that underscore the disproportionate contribution of large trees to AGB [16,41]. The marked increase in diameter at breast height among large trees compared to smaller counterparts is directly responsible for this substantial surge in AGB [42]. Consequently, it is imperative to institute effective measures for safeguarding large trees within the natural forests of arid mountains to preserve significant carbon storage. Neglecting this precautionary approach could lead to a loss exceeding 50% of AGB, which would constitute a substantial setback [43,44,45].

5. Conclusions

In the natural forests of arid mountains, large trees play a significant role in shaping plot AGB, mirroring the importance observed in tropical forests. This study introduces an AGB prediction model tailored for the natural forests of arid mountains that is capable of accurately forecasting plot AGB by leveraging data from 18 large trees sourced through field surveys or remote sensing. However, variations in tree size distribution and biomass across tree species render the Altai Mountains’ natural forests unsuitable for this predictive model, while the Tianshan Mountains’ natural forest achieves a remarkable prediction accuracy, with an rRMSE of 0.13. Notably, when compared to tropical forests, the natural forests of arid mountains demand a larger representation of large trees for precise plot AGB prediction. The carbon sequestration potential in the natural forests of arid mountains is substantial, and our study holds implications for future forest inventories and precise carbon accounting in arid regions. Formulating judicious protective policies is imperative to avert substantial losses in carbon storage.

Author Contributions

Conceptualization, S.X., L.Y., A.B. and W.X.; methodology, S.X.; validation, A.B. and W.X.; formal analysis, S.X., Z.W. and Z.T.; investigation, S.X., Z.W. and Z.T.; data curation, W.X.; writing—original draft preparation, S.X.; writing—review and editing, S.X., L.Y., A.B., Z.W., Z.T. and W.X.; visualization, S.X.; supervision, L.Y. and W.X.; project administration, L.Y., A.B. and W.X.; funding acquisition, L.Y., A.B. and W.X. All authors have read and agreed to the published version of the manuscript.

Funding

This research was funded by the Second Tibetan Plateau Scientific Expedition and Research (STEP) program (2019QZKK0502020802), the Tianshan Talent Training Program of Xinjiang Uygur Autonomous region (Grant No. 2022TSYCLJ0011), and the 2020 Qinghai Kunlun talents—Leading scientists project (2020-LCJ-02).

Data Availability Statement

Data are contained within the article.

Conflicts of Interest

The authors declare no conflict of interest.

References

  1. Chen, S.; Lu, N.; Fu, B.; Wang, S.; Deng, L.; Wang, L. Current and Future Carbon Stocks of Natural Forests in China. For. Ecol. Manag. 2022, 511, 120137. [Google Scholar] [CrossRef]
  2. Tu, H.; Zhou, H.; Ma, G.; Zhang, R.; Yang, S. Characteristics of Forest Carbon Storage in Yunnan Based on the Ninth Forest Inventory Data. J. Northwest For. Univ. 2023, 38, 185–193. [Google Scholar]
  3. Guo, Z.; Huang, J.; Lu, X.; Wang, J.; Zang, R. Nature tree ecosystem services evaluation in Xinjiang based on the seventh national forest assessment data. Ecol. Sci. 2015, 34, 118–124. [Google Scholar] [CrossRef]
  4. Wang, X.; Wang, T.; Xu, J.; Shen, Z.; Yang, Y.; Chen, A.; Wang, S.; Liang, E.; Piao, S. Enhanced Habitat Loss of the Himalayan Endemic Flora Driven by Warming-Forced Upslope Tree Expansion. Nat. Ecol. Evol. 2022, 6, 890–899. [Google Scholar] [CrossRef] [PubMed]
  5. Jian, N. Forest Productivity of the Altay and Tianshan Mountains in the Dryland, Northwestern China. For. Ecol. Manag. 2004, 202, 13–22. [Google Scholar] [CrossRef]
  6. Chen, Z.; Zan, M.; Yang, X.; Dong, Y. Prediction of forest vegetation carbon storage in Xinjiang. Ecol. Environ. Sci. 2023, 32, 226–234. [Google Scholar] [CrossRef]
  7. Alaniz, A.J.; Carvajal, M.A.; Marquet, P.A.; Vergara, P.M.; Meneses, L.; Moreira-Arce, D. Analyzing the Spatiotemporal Patterns of Forests Carbon Sink and Sources between 2000 and 2019. Earth’s Future 2022, 10, e2021EF002560. [Google Scholar] [CrossRef]
  8. Dai, L.; Zhang, Y.; Wang, L.; Zheng, S.; Xu, W. Assessment of Carbon Density in Natural Mountain Forest Ecosystems at Northwest China. Int. J. Environ. Res. Public Health 2021, 18, 2098. [Google Scholar] [CrossRef]
  9. Peng, D.; Zhang, H.; Liu, L.; Huang, W.; Huete, A.R.; Zhang, X.; Wang, F.; Yu, L.; Xie, Q.; Wang, C.; et al. Estimating the Aboveground Biomass for Planted Forests Based on Stand Age and Environmental Variables. Remote Sens. 2019, 11, 2270. [Google Scholar] [CrossRef]
  10. Stephenson, N.L.; Das, A.J.; Condit, R.; Russo, S.E.; Baker, P.J.; Beckman, N.G.; Coomes, D.A.; Lines, E.R.; Morris, W.K.; Rueger, N.; et al. Rate of Tree Carbon Accumulation Increases Continuously with Tree Size. Nature 2014, 507, 90–93. [Google Scholar] [CrossRef]
  11. Zhao, M.; Sun, M.; Xiong, T.; Tian, S.; Liu, S. On the Link between Tree Size and Ecosystem Carbon Sequestration Capacity across Continental Forests. Ecosphere 2022, 13, e4079. [Google Scholar] [CrossRef]
  12. Slik, J.W.F.; Paoli, G.; McGuire, K.; Amaral, I.; Barroso, J.; Bastian, M.; Blanc, L.; Bongers, F.; Boundja, P.; Clark, C.; et al. Large Trees Drive Forest Aboveground Biomass Variation in Moist Lowland Forests across the Tropics. Glob. Ecol. Biogeogr. 2013, 22, 1261–1271. [Google Scholar] [CrossRef]
  13. Ali, A.; Lin, S.-L.; He, J.-K.; Kong, F.-M.; Yu, J.-H.; Jiang, H.-S. Big-Sized Trees Overrule Remaining Trees’ Attributes and Species Richness as Determinants of Aboveground Biomass in Tropical Forests. Glob. Change Biol. 2019, 25, 2810–2824. [Google Scholar] [CrossRef] [PubMed]
  14. Mildrexler, D.J.; Berner, L.T.; Law, B.E.; Birdsey, R.A.; Moomaw, W.R. Large Trees Dominate Carbon Storage in Forests East of the Cascade Crest in the United States Pacific Northwest. Front. For. Glob. Change 2020, 3, 594274. [Google Scholar] [CrossRef]
  15. Yuan, Z.; Ali, A.; Sanaei, A.; Ruiz-Benito, P.; Jucker, T.; Fang, L.; Bai, E.; Ye, J.; Lin, F.; Fang, S.; et al. Few Large Trees, Rather than Plant Diversity and Composition, Drive the above-Ground Biomass Stock and Dynamics of Temperate Forests in Northeast China. For. Ecol. Manag. 2021, 481, 118698. [Google Scholar] [CrossRef]
  16. Lutz, J.A.; Furniss, T.J.; Johnson, D.J.; Davies, S.J.; Allen, D.; Alonso, A.; Anderson-Teixeira, K.J.; Andrade, A.; Baltzer, J.; Becker, K.M.L.; et al. Global Importance of Large-Diameter Trees. Glob. Ecol. Biogeogr. 2018, 27, 849–864. [Google Scholar] [CrossRef]
  17. Bastin, J.-F.; Barbier, N.; Réjou-Méchain, M.; Fayolle, A.; Gourlet-Fleury, S.; Maniatis, D.; de Haulleville, T.; Baya, F.; Beeckman, H.; Beina, D.; et al. Seeing Central African Forests through Their Largest Trees. Sci. Rep. 2015, 5, 13156. [Google Scholar] [CrossRef]
  18. Bastin, J.-F.; Rutishauser, E.; Kellner, J.R.; Saatchi, S.; Pelissier, R.; Herault, B.; Slik, F.; Bogaert, J.; De Canniere, C.; Marshall, A.R.; et al. Pan-Tropical Prediction of Forest Structure from the Largest Trees. Glob. Ecol. Biogeogr. 2018, 27, 1366–1383. [Google Scholar] [CrossRef]
  19. Ali, A.; Wang, L.-Q. Big-Sized Trees and Forest Functioning: Current Knowledge and Future Perspectives. Ecol. Indic. 2021, 127, 107760. [Google Scholar] [CrossRef]
  20. Cheng, Y.; Lan, S.; Fan, X.; Tjahjadi, T.; Jin, S.; Cao, L. A Dual-Branch Weakly Supervised Learning Based Network for Accurate Mapping of Woody Vegetation from Remote Sensing Images. Int. J. Appl. Earth Obs. Geoinf. 2023, 124, 103499. [Google Scholar] [CrossRef]
  21. Lu, D.; Chen, Q.; Wang, G.; Liu, L.; Li, G.; Moran, E. A Survey of Remote Sensing-Based Aboveground Biomass Estimation Methods in Forest Ecosystems. Int. J. Digit. Earth 2016, 9, 63–105. [Google Scholar] [CrossRef]
  22. Gonzalez de Tanago, J.; Lau, A.; Bartholomeusm, H.; Herold, M.; Avitabile, V.; Raumonen, P.; Martius, C.; Goodman, R.; Disney, M.; Manuri, S.; et al. Estimation of Above-Ground Biomass of Large Tropical Trees with Terrestrial LiDAR. Methods Ecol. Evol. 2018, 9, 223–234. [Google Scholar] [CrossRef]
  23. Emin, M.; Anwar, E.; Liu, S.; Emin, B.; Mamut, M.; Abdukeram, A.; Liu, T. Target Detection-Based Tree Recognition in a Spruce Forest Area with a High Tree Density-Implications for Estimating Tree Numbers. Sustainability 2021, 13, 3279. [Google Scholar] [CrossRef]
  24. Jiang, J.; Zhu, W.; Qiao, K.; Jiang, Y. An Identification method for mountains coniferous in Tianshan with Sentinel-2 data. Remote Sens. Technol. Appl. 2021, 36, 847–856. [Google Scholar]
  25. Yang, B.-Y.; Ali, A.; Xu, M.-S.; Guan, M.-S.; Li, Y.; Zhang, X.-N.; He, X.-M.; Yang, X.-D. Large Plants Enhance Aboveground Biomass in Arid Natural Forest and Plantation along Differential Abiotic and Biotic Conditions. Front. Plant Sci. 2022, 13, 999793. [Google Scholar] [CrossRef] [PubMed]
  26. Bradford, M.; Murphy, H.T. The Importance of Large-Diameter Trees in the Wet Tropical Rainforests of Australia. PLoS ONE 2019, 14, e0208377. [Google Scholar] [CrossRef] [PubMed]
  27. Li, L.; Liu, Y.; Tang, Z.; Guo, Z.; Fang, J. Community structure and Its affecting factors of mountains coniferous forests in XinJinag China. Arid Zone Res. 2011, 28, 31–39. [Google Scholar] [CrossRef]
  28. Jiao, L.; Chen, K.; Liu, X.; Qi, C.; Xue, R. Comparison of the Response Stability of Siberian Larch to Climate Change in the Altai and Tianshan. Ecol. Indic. 2021, 128, 107823. [Google Scholar] [CrossRef]
  29. Wang, T.; Bao, A.; Xu, W.; Zheng, G.; Nzabarinda, V.; Yu, T.; Huang, X.; Long, G.; Naibi, S. Dynamics of Forest Net Primary Productivity Based on Tree Ring Reconstruction in the Tianshan Mountains. Ecol. Indic. 2023, 146, 109–713. [Google Scholar] [CrossRef]
  30. Xu, W.; Yang, L.; Chen, X.; Gao, Y.; Wang, L. Carbon storage, spatial distribution and the influence factors in Tianshan Mountains. Chin. J. Plant Ecol. 2016, 40, 364–373. [Google Scholar] [CrossRef]
  31. Zheng, S.; Xu, W.; Yang, L.; Gao, Y.; Li, J.; Wang, L. Carbon density and storage of forest ecosystem in Altay Mountains, Xinjiang. J. Nat. Resour. 2016, 31, 1553–1563. [Google Scholar]
  32. Bedane, G.A.; Feyisa, G.L.; Senbeta, F. Spatial Distribution of above Ground Carbon Density in Harana Forest, Ethiopia. Ecol. Process. 2022, 11, 4. [Google Scholar] [CrossRef]
  33. Li, W.; Wang, C.; Liu, H.; Wang, W.; Sun, R.; Li, M.; Shi, Y.; Zhu, D.; Du, W.; Ma, L.; et al. Fine Root Biomass and Morphology in a Temperate Forest Are Influenced More by Canopy Water Addition than by Canopy Nitrogen Addition. Front. Ecol. Evol. 2023, 11, 1132248. [Google Scholar] [CrossRef]
  34. Ali, F.; Khan, N.; Abd_Allah, E.F.; Ahmad, A. Species Diversity, Growing Stock Variables and Carbon Mitigation Potential in the Phytocoenosis of Monotheca Buxifolia Forests along Altitudinal Gradient across Pakistan. Appl. Sci. 2022, 12, 1292. [Google Scholar] [CrossRef]
  35. Dyola, N.; Sigdel, S.R.; Liang, E.; Babst, F.; Camarero, J.J.; Aryal, S.; Chettri, N.; Gao, S.; Lu, X.; Sun, J.; et al. Species Richness Is a Strong Driver of Forest Biomass along Broad Bioclimatic Gradients in the Himalayas. Ecosphere 2022, 13, e4107. [Google Scholar] [CrossRef]
  36. Tian, H.; Pei, J.; Huang, J.; Li, X.; Wang, J.; Zhou, B.; Qin, Y.; Wang, L. Garlic and Winter Wheat Identification Based on Active and Passive Satellite Imagery and the Google Earth Engine in Northern China. Remote Sens. 2020, 12, 3539. [Google Scholar] [CrossRef]
  37. Luo, Q.; Xu, Z.; Xu, Z.; Li, L.; Chang, Y.; Xu, X.; Song, X. Individual Biomass Allocation and Its Variation of Picea Schrenkiana Forests. Arid. Land Geogr. 2019, 42, 1378–1386. [Google Scholar]
  38. Hauck, M.; Csapek, G.; Dulamsuren, C. The Significance of Large Old Trees and Tree Cavities for Forest Carbon Estimates. For. Ecol. Manag. 2023, 546, 121319. [Google Scholar] [CrossRef]
  39. Piponiot, C.; Anderson-Teixeira, K.J.; Davies, S.J.; Allen, D.; Bourg, N.A.; Burslem, D.F.R.P.; Cárdenas, D.; Chang-Yang, C.; Chuyong, G.; Cordell, S.; et al. Distribution of Biomass Dynamics in Relation to Tree Size in Forests across the World. New Phytol. 2022, 234, 1664–1677. [Google Scholar] [CrossRef]
  40. Mensah, S.; Noulekoun, F.; Ago, E.E. Aboveground Tree Carbon Stocks in West African Semi-Arid Ecosystems: Dominance Patterns, Size Class Allocation and Structural Drivers. Glob. Ecol. Conserv. 2020, 24, e01331. [Google Scholar] [CrossRef]
  41. Kaushal, S.; Baishya, R. Stand Structure and Species Diversity Regulate Biomass Carbon Stock under Major Central Himalayan Forest Types of India. Ecol. Process 2021, 10, 14. [Google Scholar] [CrossRef]
  42. Birdsey, R.A.; DellaSala, D.A.; Walker, W.S.; Gorelik, S.R.; Rose, G.; Ramírez, C.E. Assessing Carbon Stocks and Accumulation Potential of Mature Forests and Larger Trees in U.S. Federal Lands. Front. For. Glob. Change 2023, 5, 1074508. [Google Scholar] [CrossRef]
  43. Teich, M.; Becker, K.M.L.; Raleigh, M.S.; Lutz, J.A. Large-Diameter Trees Affect Snow Duration in Post-Fire Old-Growth Forests. Ecohydrology 2022, 15, e2414. [Google Scholar] [CrossRef]
  44. Zuleta, D.; Arellano, G.; McMahon, S.M.; Aguilar, S.; Bunyavejchewin, S.; Castaño, N.; Chang-Yang, C.; Duque, A.; Mitre, D.; Nasardin, M.; et al. Damage to Living Trees Contributes to Almost Half of the Biomass Losses in Tropical Forests. Glob. Change Biol. 2023, 29, 3409–3420. [Google Scholar] [CrossRef]
  45. Bennett, A.C.; McDowell, N.G.; Allen, C.D.; Anderson-Teixeira, K.J. Larger Trees Suffer Most during Drought in Forests Worldwide. Nat. Plants 2015, 1, 15139. [Google Scholar] [CrossRef]
Figure 1. The location of the study area: (a) geographic location of mountains natural forests of Northwestern China (The red box indicates the study area) and (b) the distribution of 105 plots at 11 sites.
Forests 14 02426 g001
Figure 2. (a) Changes in the average AGB for each tree species with increasing diameter at breast height in the natural forests of arid mountains. (b) The average percentage of accumulated AGB in relation to the plot AGB at each site.
Forests 14 02426 g002
Figure 3. (a) The change in rRMSE and the cumulative number of large trees in the AGB prediction model for the natural forests of arid mountains. (b) The AGB of the natural forests of arid mountains predicted by 18 large trees.
Forests 14 02426 g003
Figure 4. (a) The change in rRMSE and the cumulative number of large trees in the AGB prediction model for the Tianshan Mountains’ natural forests. (b) The AGB of the Tianshan Mountains’ natural forests predicted by 18 large trees.
Forests 14 02426 g004
Figure 5. (a) The change in rRMSE and the cumulative number of large trees in the AGB prediction model for Altai Mountains’ natural forests. (b) The AGB of Altai Mountains’ natural forests predicted by 25 large trees.
Forests 14 02426 g005
Figure 6. (a,b)The number and AGB proportion of individual trees in different diameters at breast height classes in the natural forests of the Altai Mountains and (c,d) the Tianshan Mountains.
Forests 14 02426 g006
Table 1. Plot and individual tree information with field measurements.
SiteNumber of PlotsNumber of TreesDBH (cm)H (m)
RangeMeanRangeMean
Altai MountainsBEJ139025.00–81.9016.203.84–29.9213.42
FY1211115.10–62.6015.005.72–24.7311.68
QH106845.00–90.1016.405.60–25.1212.15
Tianshan MountainsFK1210155.00–65.5015.305.60–29.9210.91
GL82135.00–114.9030.305.60–23.6915.19
MNS167795.00–78.3020.205.60–23.6712.90
NLK61686.00–78.8030.706.20–23.6816.61
QT135435.00–66.8020.905.60–24.4813.67
WS64225.00–57.8015.105.60–23.4210.76
XY6865.20–123.5045.004.20–23.6917.19
ZS31216.90–66.4026.406.73–23.6815.72
Total1110560445.00–123.5022.863.84–29.9213.65
DBH is diameter at breast height; H is the tree height.
Table 2. Allometric growth equations of biomass for different tree species in the natural forests of arid mountains.
Forest TypeSpecies of TreesAllometric Growth EquationR2Reference
Coniferous forestPicea schrenkianaWS = 0.0375(DBH2H)0.9280.998[30]
WB = 0.0014(DBH2H)1.09720.998
WL = 0.0117(DBH2H)0.83040.998
Larix sibiricaWS = 0.099496(DBH2H)0.7865300.990[8]
WB = 0.098620(DBH2H)0.5983670.990
WL = 0.294136(DBH2H)0.3575060.990
Pinus sibiricaWS = 0.01278(DBH2H)0.995990.991[8]
WB = 7.86722(DBH2H)0.188620.604
WL = 3.32370(DBH2H)0.245690.658
Picea obovata
Abies sibirca
WS = 0.1283(DBH2H)0.75340.913[8]
WB = 0.093(DBH2H)0.67320.913
WL = 0.7753(DBH2H)0.59030.913
Broad-leaved forestBetula pendula
Populus trcmula
WS = 0.6039(DBH2H)0.53250.959[8]
WB = 1.016(DBH2H)0.39220.957
WL = 0.6989(DBH2H)0.24750.960
W S is the biomass of stems; W B is the biomass of branches; W L is the biomass of leaves; DBH is diameter at breast height; H is the tree height.
Disclaimer/Publisher’s Note: The statements, opinions and data contained in all publications are solely those of the individual author(s) and contributor(s) and not of MDPI and/or the editor(s). MDPI and/or the editor(s) disclaim responsibility for any injury to people or property resulting from any ideas, methods, instructions or products referred to in the content.

