Article

A Chemical Explanation for Variations in Antioxidant Capacity across Camellia sinensis L. Cultivars

1
Key Laboratory of Tea Quality and Safety Control, Ministry of Agriculture and Rural Affairs, Tea Research Institute, Chinese Academy of Agricultural Sciences, Hangzhou 310008, China
2
College of Horticulture, Hebei Agricultural University, Baoding 071000, China
3
Department of Agricultural Chemistry, Sylhet Agricultural University, Sylhet 3100, Bangladesh
*
Author to whom correspondence should be addressed.
Forests 2023, 14(2), 249; https://doi.org/10.3390/f14020249
Submission received: 19 November 2022 / Revised: 15 January 2023 / Accepted: 25 January 2023 / Published: 29 January 2023
(This article belongs to the Special Issue Cultivation and Management in Tea Trees)

Abstract

:
Flavanols are known as the most important antioxidants in tea (Camellia sinensis), but their contribution to the antioxidant capacity across tea cultivars has not been quantified. This study explored whether the variations of antioxidant capacity across tea cultivars could be linked to variations in main flavanol concentrations using 20 widely planted Chinese tea cultivars. The results showed that concentrations of flavanols, both monomeric (total catechins; 3.77%–8.85% d.w.) and polymeric forms (condensed tannins; 9.48%–17.67% d.w.), varied largely across tea cultivars. The contribution of total catechins to the antioxidant capacity in tea (R2 = 0.54–0.55) was greater than that of condensed tannins (R2 = 0.35–0.36) and total phenolic concentrations (R2 = 0.33–0.36). Individual catechin components collectively explained 54.94%–56.03% of the variations in antioxidant capacity across tea cultivars. Epigallocatechin gallate (EGCG) was the leading catechin component that determined the antioxidant capacity in tea (p < 0.001), accounting for up to 57% of the differences in catechin composition between tea cultivars with high and low antioxidant capacities. These results suggested that flavanols were stronger predictors of the antioxidant capacity across tea cultivars compared to total phenolic concentrations, providing guidance for breeding tea cultivars with strong antioxidant capacities.

1. Introduction

Tea (Camellia sinensis) is the most widely consumed beverage in the world that is famous for its various health functions, including anticancer, antidiabetic, and cardiovascular protective effects [1,2]. To obtain these health functions, tea plant extracts have been widely used as an additive in food, beverage, cosmetics, pharmaceuticals, etc [3]. The health functions of tea have been linked to its antioxidant capacity [4]. Tea is a highly heterogeneous species with more than 15,000 copies of preserved germplasm resources worldwide [5,6]. Different tea cultivars can show distinct phytochemical profiles [7,8] and varied antioxidant capacities [9]. However, current interest in the antioxidant capacity of tea is mainly restricted to commercial tea products [10,11,12], and phytochemical contribution to the variations in antioxidant capacity across tea cultivars has not been well illustrated. Since the conversions of phytochemicals during tea processing may affect the antioxidant capacities of tea products, antioxidant compounds in fresh leaves would be more effective as phytochemical markers to evaluate tea germplasms.
Flavanols are believed to be the main antioxidant attribute of tea due to their high efficacy of radical scavenging capacity [13,14]. Flavanols are abundant in young leaves and shoots of tea plants, normally existing in the monomeric form (catechins) and the oligo/polymeric form (condensed tannins). Monomeric flavanols (catechin, C; epicatechin, EC; their analogs and esters) are the main substances of tea, consisting of up to 23.2% of the dry weight of tea leaves [7]. Condensed tannins, or proanthocyanidins, are commonly oligomers or polymers of catechin and epicatechin [15], and the second major component in tea [16]. Flavanol concentrations have been reported to be positively associated with the antioxidant capacity of commercial tea products [17]. It has been suggested that the main radical scavengers in commercial tea products are epigallocatechin gallate (EGCG), epicatechin gallate (ECG), and epigallocatechin (EGC) [11], with slight variations depending on fermentation degrees and processing methods [17]. Meanwhile, condensed tannins and flavanol dimer present stronger radical scavenging activity than other phenolic compounds in green tea made from a wild tea tree species (Camellia taliensis) [18,19]. Studies on poplar also showed that condensed tannins are the key explanatory variable for the antioxidant capacity in foliage [20].
Although the contribution of flavanols to the antioxidant activities of commercial tea products has been well documented [5,11,12], few studies have investigated the relationships between flavanols and the antioxidant capacities among different tea cultivars. A study on 25 Kenyan tea cultivars observed no differences among antioxidant capacities of green tea made from different cultivars [21], probably because of their low genetic diversity. Meanwhile, another study on purple-colored tea cultivars found that purple tea shoots exhibited higher antioxidant capacity than that of green-colored tea cultivars due to the enrichment of anthocyanins [22]. As the center of origin of tea, China has bred a large amount of tea cultivars with broad genetic variation and, consequently, wide phytochemical diversity [16,23]. Previous phytochemical studies on tea plants showed that the total catechin content can vary up to 4-fold [7] and the total phenolic contents can vary up to 3.5-fold across Chinese tea germplasms [8]. Therefore, diverse Chinese tea cultivars can provide suitable materials for illustrating the phytochemical foundation of the variations in antioxidant capacity across tea cultivars.
The subject of this study was to explore if the variations of antioxidant capacity across tea cultivars can be explained by variations in flavanol concentrations. Since phenolic concentrations in tea leaves are highly environmental dependent [24,25], Chinese tea cultivars planted in the same germplasm garden were determined in this study to eliminate the possible impacts of environment. The radical scavenging capacity, concentrations of total phenolic compounds, and main flavanol components were determined in 20 representative tea cultivars. The partial least squares regression was used to clarify the relationship between antioxidant capacity and concentrations of flavanol compounds. The contribution of individual catechin compounds to the dissimilarity of catechin composition between tea cultivars with high and low antioxidant capacities has also been illustrated.

2. Materials and Methods

2.1. Plant Materials

A total of 20 tea cultivars planted in Shengzhou integrated experimental base (29°44′ N, 120°48′ E, 23 m above sea level), China, were sampled for analysis. These cultivars were originally collected from 4 provinces in China and have been planted in a garden for comparison since 2015. These cultivars were grown under similar microenvironments and maintained through unified horticultural practices. Total phenolic concentrations across selected tea cultivars ranged from 20.17 to 31.1% d.w. (Table 1).

2.2. Sample Collection

For each cultivar, three plots (~4 m2 each) were randomly selected for tea sampling. Sixty samples were collected in total during mid-September 2021. Shoot tips (one bud and two leaves under the bud) of elongating shoots were selected haphazardly in each plot and compiled as one sample (100 g), placed on ice, and transported to the laboratory. Subsequently, these samples were flash-frozen in liquid nitrogen, vacuum-dried, pulverized by ball milling, and then stored at −20 °C before the antioxidant activity tests and chemical assays.

2.3. Antioxidant Activity

Antioxidant activities of tea samples were determined using 2,2-diphenyl-1-picrylhydrazyl (DPPH) radical and 2,2′-azinobis-(3-ethylbenzothiazoline-6-sulfonic acid (ABTS) radical cation assays following the steps described in Li et al. [20] with slight modifications. In brief, methanolic foliage extracts were diluted into proper concentrations, mixed with free radical solutions, and then the radical scavenging capacity of extracts was quantified spectrophotometrically using a SpectraMax M2 plate reader (Molecular Devices, USA) with standardization against Trolox (reported as Trolox equivalent antioxidant capacity, TEAC). In the DPPH assay, 50 μL of foliage extract was mixed with 1 mL of 200 μM methanolic DPPH and estimated at 517 nm after 30 min of incubation in the dark. In the ABTS assay, 100 μL of foliage extract was mixed with 1 mL diluted ABTS radical solution (~0.7 absorbance at 734 nm) and estimated at 734 nm after 45 min of incubation in the dark. ABTS radical cations were generated by mixing 7 mM aqueous ABTS with 2.45 mM potassium persulfate. Radical scavenging capacities of major catechins, condensed tannins, and their combinations were quantified using authentic standards (Tables S1 and S2).

2.4. Chemical Analyses

Total phenolic concentrations were determined using the Folin–Ciocalteu assay following the steps described in Li et al. [20], with a standard against gallic acid. Condensed tannins were determined using the acid–butanol spectrophotometric method [26], with a standard against purified proanthocyanidin. Chemical concentrations were reported as a percentage of dry foliage weight. Catechins were extracted from tea samples into pure methanol with sonication at <15 °C for 30 min, separated by high-performance liquid chromatography (HPLC; Alliance e2695, Waters, Milford, MA, USA), and quantified with a photodiode array detector (ACQUITY 2998, Waters, Milford, MA, USA). The liquid extracts were passed through a 0.22 μm filter in preparation for subsequent HPLC analysis. Samples (10 μL) were injected into a Phenomenex C18 column (250 mm × 4.6 mm i.d., 35 °C), separated on a gradient of water (acidified with 0.1% formic acid) and acetonitrile at a flow rate of 1 mL/min, and detected at 278 nm. The concentrations of main catechin components (catechin, C; epicatechin, EC; epicatechin gallate, ECG; epigallocatechin, EGC; epigallocatechin gallate, EGCG) were calculated based on their peak areas against that of authentic standards purchased from Yuanye Bio-Technology, Shanghai, China. Concentrations of the total catechins were determined by summing the concentrations of the five major catechin components.

2.5. Data Analysis

Statistical analyses were performed using R 3.6.0 (http://www. r-project.org/; last accessed date: 1 November 2021). Before statistical analyses, the normality and homogeneity of variance of all the variables were checked using the Shapiro–Wilk test. Differences in radical scavenging capacities and polyphenol concentrations within 20 tea cultivars were identified using one-way analysis of variance (ANOVA) followed by the Tukey HSD post hoc test. Relationships between antioxidant capacity and phenolic concentrations (total catechins, condensed tannins, total phenolic concentrations) were quantified using Pearson correlations with the Hmisc package. The influence of major catechin components on the antioxidant capacity in tea leaves were examined using partial least squares regression (PLSR) with the pls package. Using a subset of tea cultivars, the differences in catechin compositions among tea cultivars with distinct antioxidant capacity levels (i.e., tea cultivars with relatively high and low antioxidant capacities) were evaluated using principal component analysis (PCA). The differences in catechin composition between the two groups of tea cultivars were determined by multivariate analysis of variance (MANOVA). Principal factors of PCA and MANOVA were calculated using the stats package. Further, the contribution of individual catechin components to the overall difference was examined using similarity percentage analysis (SIMPER) with the vegan package. Differences were considered significant if p < 0.05.

3. Results

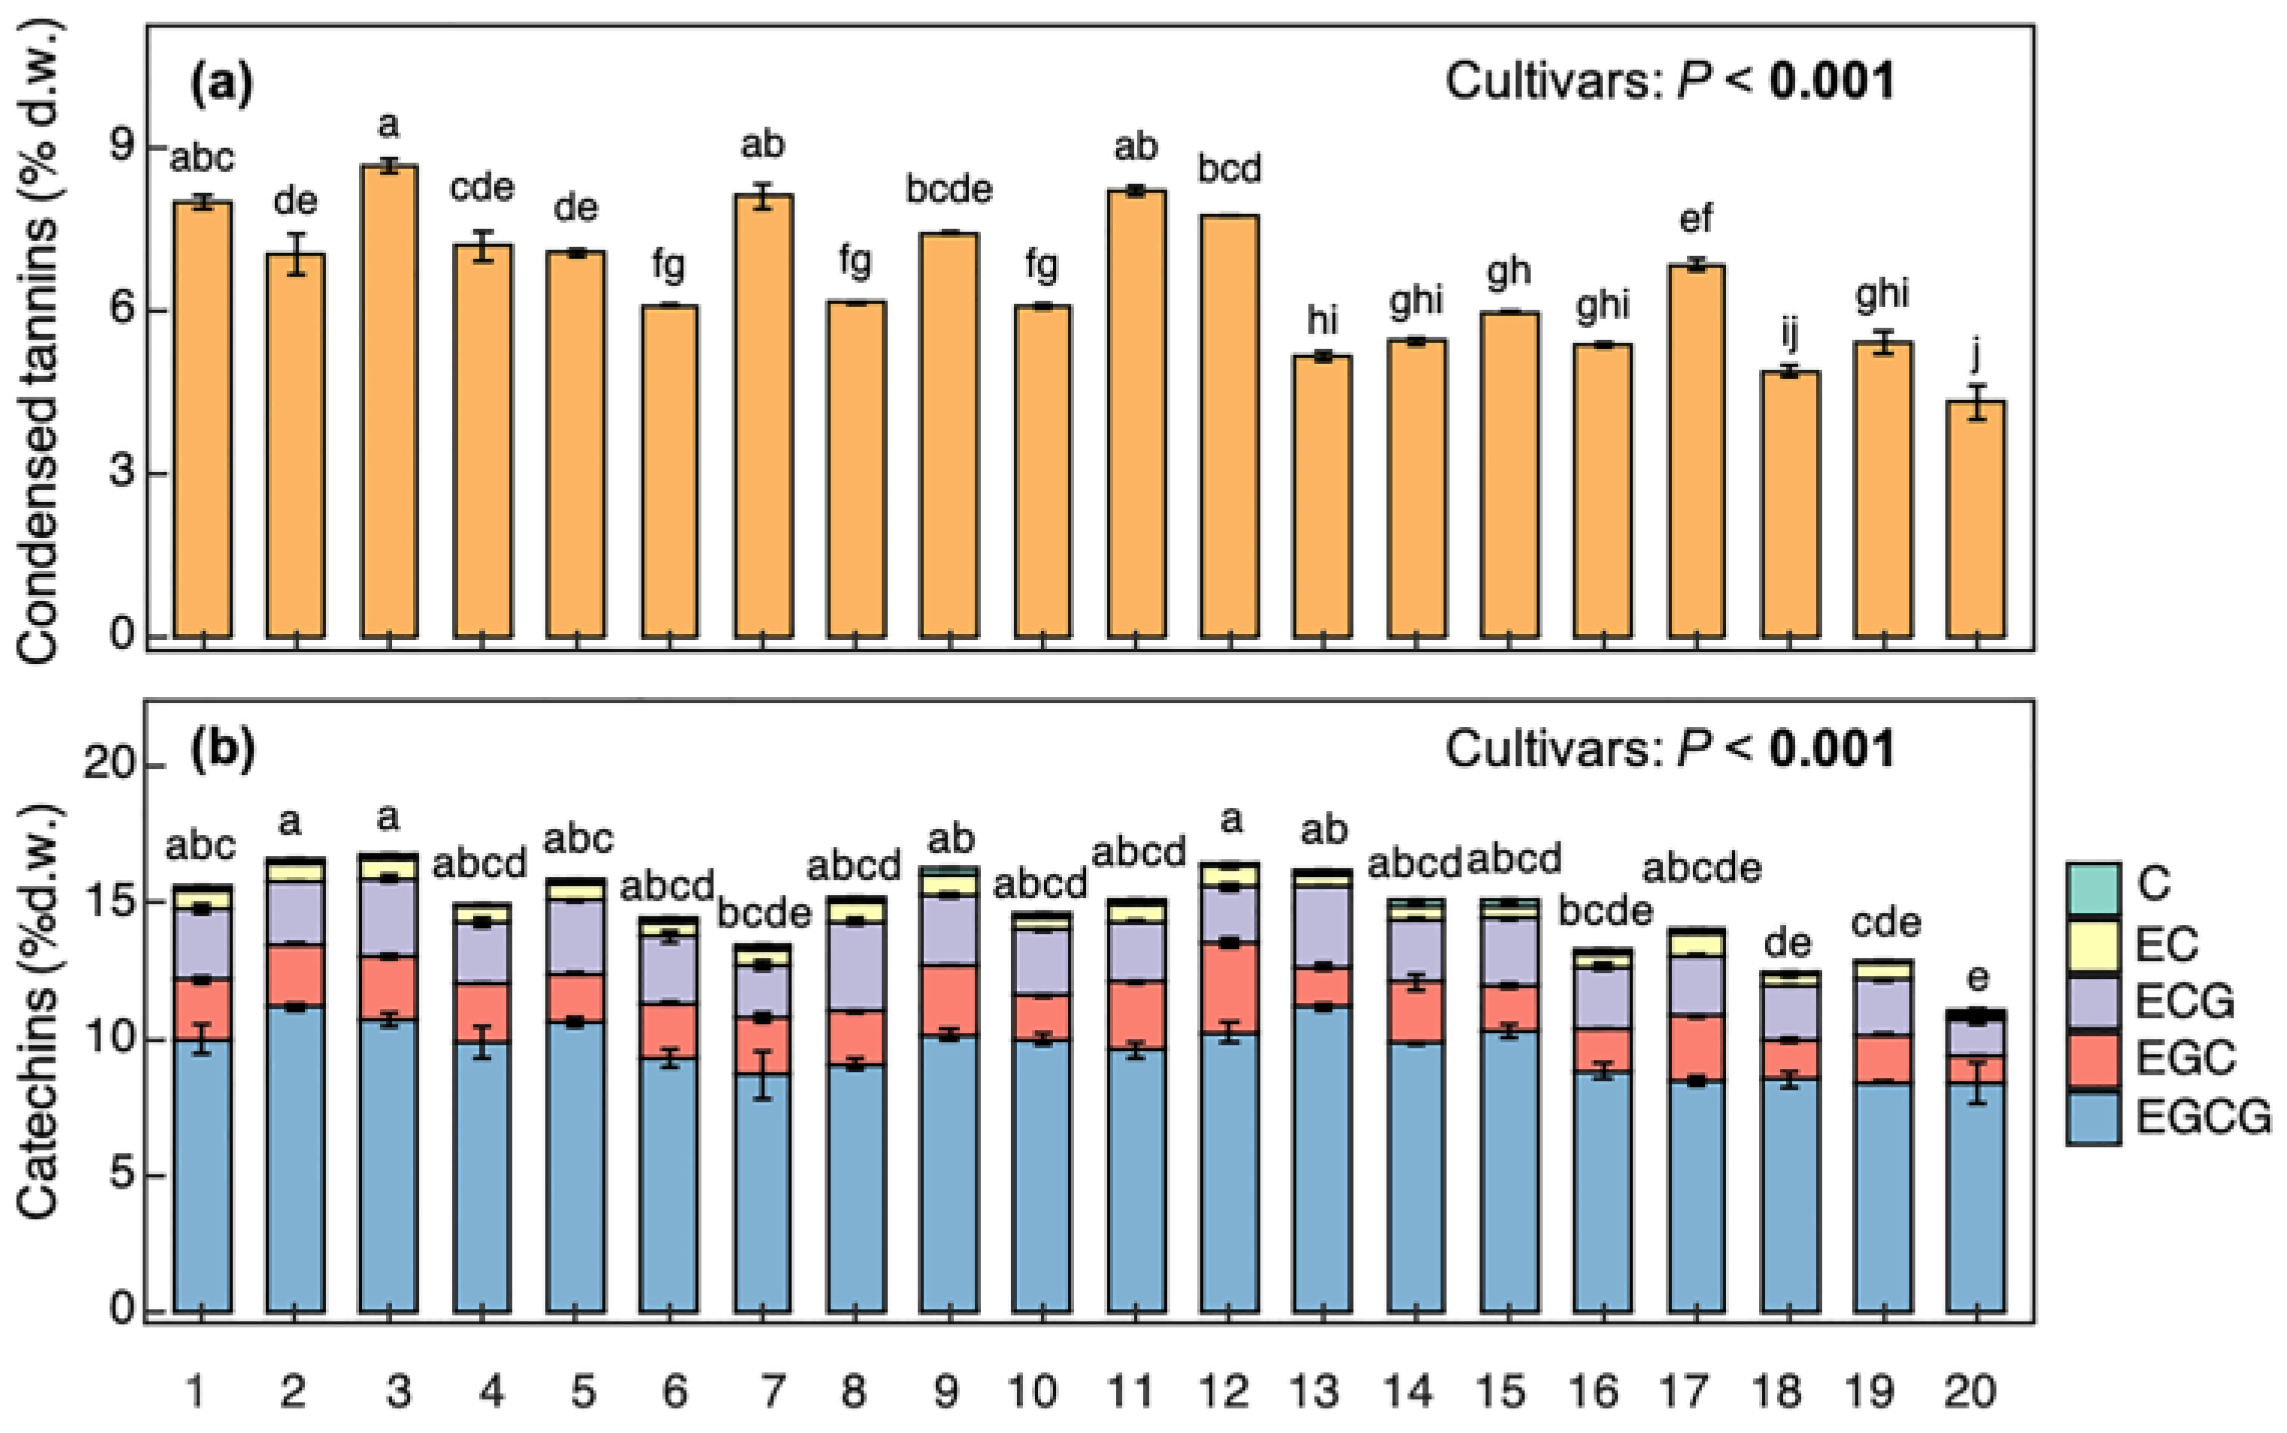
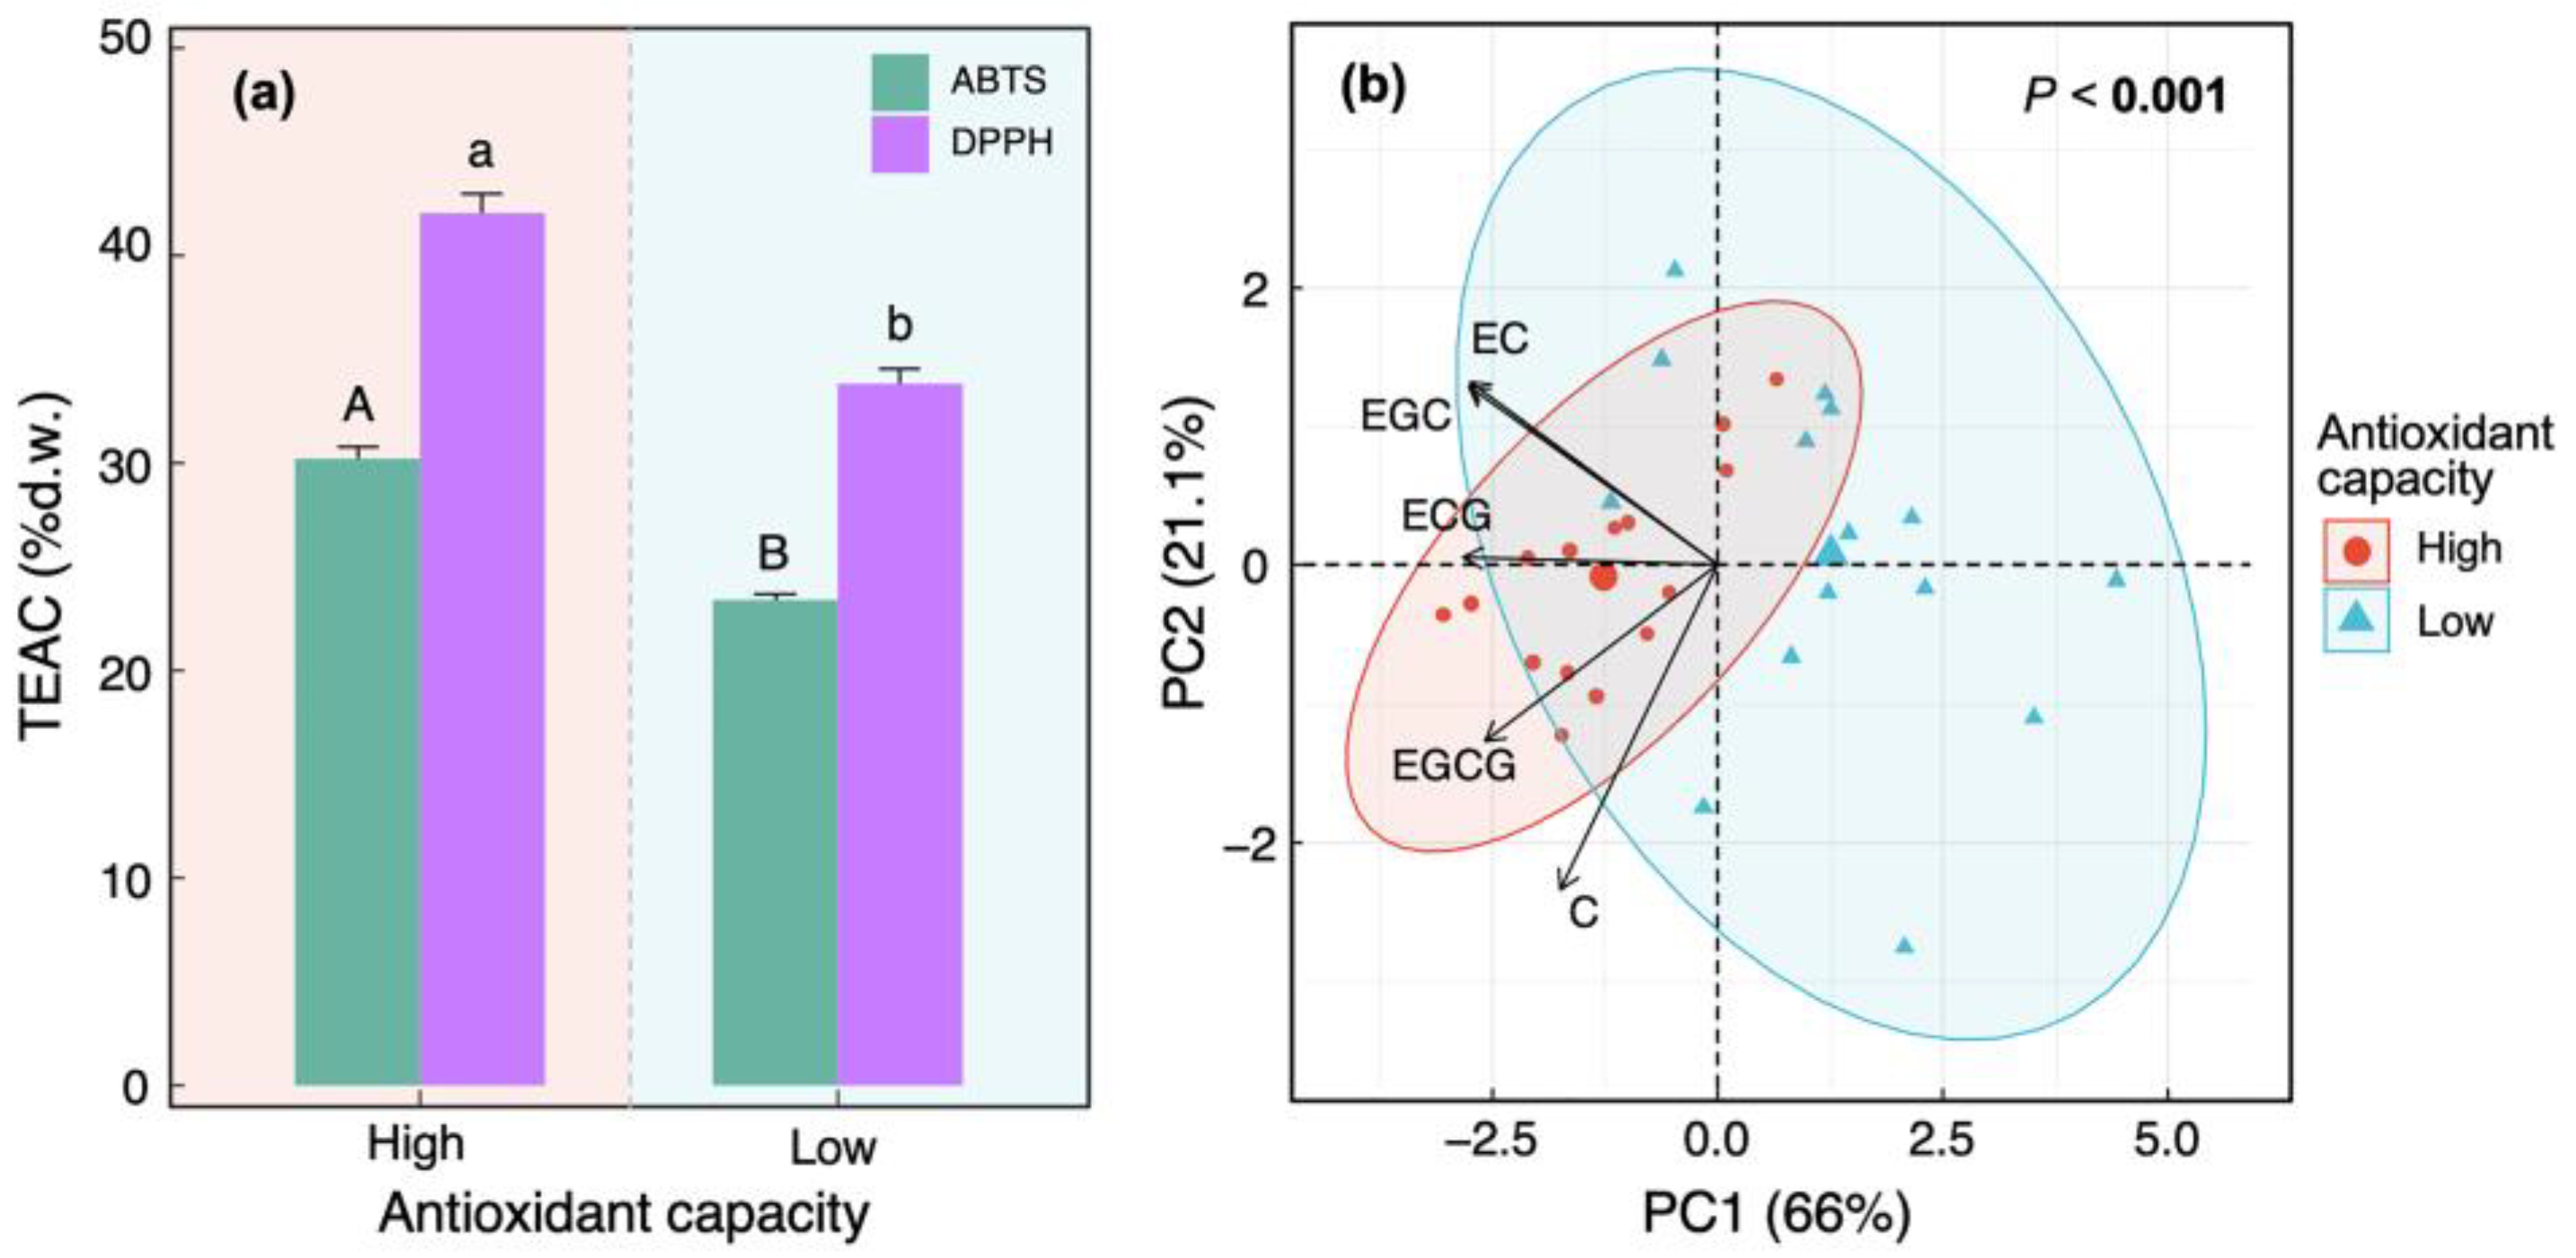
3.1. Variable Aspects of Antioxidant Capacity and Main Flavanol Compounds in Tea Leaves

Antioxidant capacity varied significantly across tea cultivars (p < 0.001, Figure 1). The DPPH scavenging capacity varied 1.83-fold, from 27.24 to 49.98% d.w. TEAC. The ABTS scavenging capacity varied 1.67-fold, from 20.46 to 34.26% d.w. TEAC. In the present study, the DPPH and ABTS scavenging capacities are highly correlated (R2 = 0.636, Figure 1c).
Concentrations of condensed tannins and catechins also varied significantly across tea cultivars (p < 0.001, Figure 2). The concentrations of condensed tannins varied 2.35-fold across tea cultivars, from 3.77 to 8.85 % d.w., comprising 20.02%–33.77% of the total phenolic concentrations. The concentrations of total catechins varied 1.86-fold, from 9.48 to 17.67% d.w., comprising 50.11%–68.60% of the total phenolic concentrations. On average, the concentration of catechins was 126 % higher than the concentration of condensed tannins. Among the catechin components determined, EGCG was dominant across the 20 tea cultivars that consisted of about 59.67%–75.70% of total catechins, while EGC, ECG, and EC consisted of about 8.96%–20.12%, 11.89%–21.57%, and 2.02%–5.75% of total catechins, respectively.

3.2. Relationships between Antioxidant Capacity and Main Flavanol Compounds

In general, both total catechins and condensed tannins were positively correlated with DPPH and ABTS radical scavenging capacities. Total catechins and condensed tannins collectively explained 58.40%–60.39% of the variations in antioxidant capacity across the 20 tea cultivars (Table S3). The concentrations of total catechins alone explained 53.5%–54.6% of the variations in antioxidant capacity (Figure 3a,c). Although the concentrations of condensed tannins alone explained 33.5%–36.1% of the variations in antioxidant capacity (Figure S1), they only explained 4.4%–6.0% of the residual error from the regression between total catechins and antioxidant capacity (Figure 3b,d).
Statistical models including individual catechin components in tea explained 54.94%–56.03% of the variations in antioxidant capacity (Table 2). For both DPPH and ABTS radical scavenging capacities, EGCG was the key explanatory variable for antioxidant capacity, followed by ECG and EGC. Separate laboratory tests also demonstrated higher radical scavenging capacities (from 194 to 328% d.w. TEAC) for these three components compared with that of EC and C (Table S1).

3.3. Contributions of Main Catechin Components to Antioxidant Capacity

To illustrate the main contributor of the antioxidant capacity in tea leaves, a subset of 10 tea cultivars (see Figure 1 for details) that exhibited distinct antioxidant capacity levels from the 20 tea cultivars estimated in the present study were selected for further analysis. The PCA plot suggested that the tea cultivars with high and low antioxidant capacities exhibited significant differences in the catechin composition (Figure 4). Among the major catechin components, EGCG contributed the largest proportion (57%) to the dissimilarity in catechin composition between tea cultivars with high and low antioxidant capacities (Table 3). In total, the top three catechin components (EGCG, ECG, EGC) explained up to 92.5% of the differences in catechin composition between the two groups.

4. Discussion

Previous studies have investigated the variations of phenolic contents across Chinese tea germplasms [7,16]. Our work expands on those findings by illustrating the relationship between flavanol contents and antioxidant capacity, the most studied biochemical characteristic of tea that has been linked to several health functions. It shows that variations in concentrations of main catechins account for more than half of the variations in antioxidant capacity across tea cultivars. Among all the main catechins in tea leaves, EGCG contributes most to the variations of antioxidant capacity and the dissimilarity of catechin composition between high- and low-antioxidative tea cultivars. The quantitative relationship between main catechin compounds and the antioxidant capacity of fresh tea leaves can provide integrated information about the chemical and bioactivity of tea cultivars simultaneously.
The DPPH and ABTS assays have been widely used to evaluate the potential antioxidant capacities of food and agricultural products. As decolorization assays have relatively long incubation times, results of DPPH and ABTS assays can be unstable. Consequently, many reaction factors of DPPH and ABTS assays must be carefully controlled during the assay period to obtain reproducible reactions. In the present study, the results of the DPPH and ABTS assays are robust and highly correlated, indicating the reliability of these methods in detecting the variations of antioxidant capacity across tea cultivars. Overall, the DPPH and ABTS radical scavenging capacities across 20 tea cultivars varied 1.83-fold and 1.67-fold, respectively. Similarly, the variations of condensed tannins and total catechins concentrations varied 2.35-fold and 1.86-fold, respectively, across the 20 tea cultivars. Concentrations of total catechins reported in the present study ranged from 9.48 to 17.67% d.w., which was located within the range reported in previous studies on Chinese tea germplasms (5.56%–23.19% d.w.) [7].
The degree of explanation of flavanol concentrations to the variations of antioxidant capacity in tea leaves (58.40%–60.39% d.w., Table S3) is much higher than that of the total phenolic concentration (35.4%–35.9% d.w., Figure S1), which has long been used to represent the quality and the antioxidant capacity of tea products [27,28]. The high correlation between flavanol concentrations and antioxidant capacity has also been reported in other plant species. For instance, a previous study on poplar reported that condensed tannins and catechins collectively explained up to 88% of the variations in antioxidant capacity [20]. Meanwhile, the correlation coefficients between total catechins and antioxidant capacities in fresh leaves across the 20 tea cultivars were slightly smaller than that in commercial tea products (R2 = 0.79) [29] and green tea infusions (R2 = 0.69) [30]. This may be attributed to the breakdown of other antioxidant metabolites (such as ascorbate and glutathione) and/or deactivation of enzymatic antioxidants (such as superoxide dismutase, catalase, and peroxidases) during tea processing [31].
Between the two forms of flavanols tested in this study, the concentration of total catechins is a more reliable predictor of the antioxidant capacity of different tea cultivars than concentrations of condensed tannins. In our study, only a small portion (4.4%–6%) of the residual error from the regression between total catechins and antioxidative capacity was explained by condensed tannins. Given that the method used to detect condensed tannins (acid–butanol assay) is unable to distinguish catechin and epicatechin from their polymers, our results suggest that polymers of catechin and epicatechin (i.e., main consti-tute of condensed tannins) may not be the main contributor to the antioxidant capacity of tea shoots. Considering that interaction between antioxidants may significantly change their antioxidant activity [32,33], the impacts of the interactions between catechins and condensed tannins were also tested using authentic standards in the present study. However, only weak reciprocal interactions between EGCG, EGC, ECG, and condensed tannins (represented as proanthocyanidin) were observed (Table S2). These results suggested that condensed tannins only had a limited contribution to the variations of antioxidant capacity across tea cultivars.
Results of the partial least squares analysis indicated that the EGCG, ECG, and EGC were the main antioxidants that contributed to the variations in antioxidant capacity across the 20 tea cultivars. Among all the main catechins, EGCG was the dominant catechin in tea, as reported in other studies [34], which consisted of 59.7%–75.7% of total catechins across the 20 tea cultivars. EGCG also showed the highest Trolox equivalent antioxidant capacity in the DPPH assay (Table S1). This is in good agreement with the results of studies on structure–activity analysis [35,36] and previous studies on the antioxidant capacity of catechins [37,38]. A subset of tea cultivars with high and low antioxidant capacities showed distinct flavanol composition, in which EGCG accounts for up to more than half of the dissimilarity. As the most interested monomeric catechin that is predominantly found in tea, EGCG has long been regarded as the main radical scavenger in commercial tea products [11]. Our results suggested that concentrations of EGCG can also be used as an indicator of the antioxidant capacities of tea cultivars.

5. Conclusions

In this study, a quantitative chemical explanation for the variations of antioxidant capacity across tea cultivars was proposed. By quantifying the contributions of major flavanol components to antioxidant capacities of tea leaves from 20 tea cultivars, this study found that monomeric catechin compounds account for >50% of the variations in antioxidant capacity across tea cultivars, among which EGCG is the dominant radical scavenger. Since the concentrations of catechins in fresh tea leaves are highly environmental dependent, these equations for the radical scavenging capacities contributed by main catechin components can also be used to estimate the antioxidant capacities in fresh leaves of tea plants grown under different environmental conditions. Our results can not only provide guidance for breeding tea cultivars with strong antioxidant capacities but also help in developing the model for a comprehensive assessment of tea quality and bioactivity.

Supplementary Materials

The following supporting information can be downloaded at: https://www.mdpi.com/article/10.3390/f14020249/s1, Figure S1: Regression analyses of total phenolic compounds and condensed tannins as a contributor to TEAC in DPPH (2,2-diphenyl-1-picrylhydrazyl) and ABTS (2,2′-azinobis-(3-ethylbenzothiazoline-6-sulfonic acid) radical scavenging assays. Each point represents the value for a single plot replication within each of the 20 tea cultivars; Table S1: Antioxidant capacity of major catechin components in tea leaves represented as TEAC (Trolox equivalent antioxidant capacity) in DPPH (2,2-diphenyl-1-picrylhydrazyl) and ABTS (2,2′-azinobis-(3-ethylbenzothiazoline-6-sulfonic acid) radical scavenging assays. % d.w.: % dry weight of the authentic standard of catechin components; Table S2: Impacts of the interactions between catechins and condensed tannins (represented as proanthocyanidin) on the antioxidant capacity. DPPH TEAC: Trolox equivalent antioxidant capacity in 2,2-diphenyl-1-picrylhydrazyl radical scavenging assays; ABTS TEAC: Trolox equivalent antioxidant capacity in 2,2′-azinobis-(3-ethylbenzothiazoline-6-sulfonic acid) radical scavenging assays; EGCG: Epigallocatechin gallate; EGC: Epigallocatechin; ECG: Epicatechin gallate; PA: Proanthocyanidin; % d.w.: % dry weight of the authentic standard of catechin components; Table S3: Partial least squares regression analyses examining the influence of condensed tannins and total catechins on the antioxidant capacity within tea leaves across 20 tea cultivars. Model fitting parameters indicate the strength of relationships between explanatory and response variables. Antioxidant capacity is represented as TEAC (Trolox equivalent antioxidant capacity) in DPPH (2,2-diphenyl-1-picrylhydrazyl) and ABTS (The 2,2′-azinobis-(3-ethylbenzothiazoline-6-sulfonic acid)) radical scavenging assays.

Author Contributions

Conceptualization, Z.L. and X.L.; methodology, Y.W., L.Z. (Lan Zhang), L.Z. (Liping Zhang) and Z.L.; formal analysis, Z.L. and P.Y.; investigation, Z.L. and Y.W.; data curation, L.Z. (Liping Zhang); writing—original draft preparation, Z.L.; writing—review and editing, Z.L., W.H., J.F., M.K.H. and X.L.; supervision, Z.L. and X.L.; funding acquisition, Z.L. and X.L. All authors have read and agreed to the published version of the manuscript.

Funding

This work was financially supported by the National Natural Science Foundation of China (No. 32271581), the Central Public-interest Scientific Institution Basal Research Fund (1610212022003), the Key Research and Development Program of Zhejiang Province (2021C02036), and the Innovation Project of the Chinese Academy of Agricultural Sciences (CAAS-ASTIP-2019-TRICAAS).

Data Availability Statement

Research data are available on request from the corresponding author.

Acknowledgments

We thank Xiangri Huang for assistance with the chemical assays of this study. We thank Yongquan Xu for advice regarding interactions between polyphenols.

Conflicts of Interest

The authors declare no conflict of interest.

References

  1. Khan, N.; Mukhtar, H. Tea and health: Studies in humans. Curr. Pharm. Des. 2013, 19, 6141–6147. [Google Scholar] [CrossRef] [PubMed] [Green Version]
  2. Tang, G.Y.; Meng, X.; Gan, R.Y.; Zhao, C.N.; Liu, Q.; Feng, Y.B.; Li, S.; Wei, X.L.; Atanasov, A.G.; Corke, H.; et al. Health functions and related molecular mechanisms of tea components: An update review. Int. J. Mol. Sci. 2019, 20, 6196. [Google Scholar] [CrossRef] [PubMed] [Green Version]
  3. Verified Market Research. Global Tea Extract Market Size by Type, by Form, by Application, by Geographic Scope and Forecast. 2021, p. 80758. Available online: https://www.verifiedmarketresearch.com/product/tea-extract-market/ (accessed on 11 October 2022).
  4. Forester, S.C.; Lamber, J.D. The role of antioxidant versus pro-oxidant effects of green tea polyphenols in cancer prevention. Mol. Nutr. Food Res. 2011, 55, 844–854. [Google Scholar] [CrossRef] [PubMed] [Green Version]
  5. Kottawa-Arachchi, J.D.; Gunasekare, M.T.K.; Ranatunga, M.A.B. Biochemical diversity of global tea Camellia sinensis (L.) O. Kuntze germplasm and its exploitation: A review. Genet. Resour. Crop Evol. 2019, 66, 259–273. [Google Scholar] [CrossRef]
  6. Ma, J.; Yao, M.; Liang, C. Research progress on germplasms of tea plant (Camellia sinensis). J. Tea Sci. 2015, 35, 11–16. [Google Scholar]
  7. Jin, J.Q.; Ma, J.Q.; Ma, C.L.; Yao, M.Z.; Chen, L. Determination of catechin content in representative Chinese tea germplasms. J. Agric. Food Chem. 2014, 62, 9436–9441. [Google Scholar] [CrossRef]
  8. Chen, L.; Zhou, Z.X. Variations of main quality components of tea genetic resources Camellia sinensis (L.) O. Kuntze preserved in the China national germplasm tea repository. Plant Food Hum. Nutr. 2005, 60, 31–35. [Google Scholar] [CrossRef]
  9. Almajano, M.P.; Carbo, R.; Jimenez, J.A.L.; Gordon, M.H. Antioxidant and antimicrobial activities of tea infusions. Food Chem. 2008, 108, 55–63. [Google Scholar] [CrossRef]
  10. Nibir, Y.M.; Sumit, A.F.; Akhand, A.A.; Ahsan, N.; Hossain, M.S. Comparative assessment of total polyphenols, antioxidant and antimicrobial activity of different tea varieties of Bangladesh. Asian Pac. J. Trop. Biomed. 2017, 7, 352–357. [Google Scholar] [CrossRef]
  11. Guo, Y.J.; Sun, L.Q.; Yu, B.Y.; Qi, J. An integrated antioxidant activity fingerprint for commercial teas based on their capacities to scavenge reactive oxygen species. Food Chem. 2017, 237, 645–653. [Google Scholar] [CrossRef]
  12. Tang, G.Y.; Zhao, C.N.; Xu, X.Y.; Gan, R.Y.; Cao, S.Y.; Liu, Q.; Shang, A.; Mao, Q.Q.; Li, H.B. Phytochemical composition and antioxidant capacity of 30 Chinese teas. Antioxidants 2019, 8, 180. [Google Scholar] [CrossRef] [PubMed]
  13. Higdon, J.V.; Frei, B. Tea catechins and polyphenols: Health effects, metabolism, and antioxidant functions. Crit. Rev. Food Sci. Nutr. 2003, 43, 89–143. [Google Scholar] [CrossRef] [PubMed]
  14. Brunetti, C.; Di Ferdinando, M.; Fini, A.; Pollastri, S.; Tattini, M. Flavonoids as antioxidants and developmental regulators: Relative significance in plants and humans. Int. J. Mol. Sci. 2013, 14, 3540–3555. [Google Scholar] [CrossRef] [PubMed] [Green Version]
  15. Quideau, S.; Deffieux, D.; Douat-Casassus, C.; Pouysegu, L. Plant polyphenols: Chemical properties, biological activities, and synthesis. Angew. Chem. Int. Edit. 2011, 50, 586–621. [Google Scholar] [CrossRef] [PubMed]
  16. Meng, X.H.; Li, N.; Zhu, H.T.; Wang, D.; Yang, C.R.; Zhang, Y.J. Plant resources, chemical constituents, and bioactivities of tea plants from the genus Camellia section Thea. J. Agric. Food Chem. 2019, 67, 5318–5349. [Google Scholar] [CrossRef] [PubMed]
  17. Teixeria, A.M.; Sousa, C. A review on the biological activity of Camellia species. Molecules 2021, 26, 2178. [Google Scholar] [CrossRef] [PubMed]
  18. Gao, D.F.; Zhang, Y.J.; Yang, C.R.; Chen, K.K.; Jiang, H.J. Phenolic antioxidants from green tea produced from Camellia taliensis. J. Agric. Food Chem. 2008, 56, 7517–7521. [Google Scholar] [CrossRef]
  19. Zhu, L.F.; Xu, M.; Zhu, H.T.; Wang, D.; Yang, S.X.; Yang, C.R.; Zhang, Y.J. New flavan-3-ol dimer from green tea produced from Camellia taliensis in the Ai-Lao mountains of Southwest China. J. Agric. Food Chem. 2012, 60, 12170–12176. [Google Scholar] [CrossRef]
  20. Li, Z.; Yang, J.; Shang, B.; Agathokleous, E.; Rubert-Nason, K.F.; Xu, Y.; Feng, Z. Nonlinear responses of foliar phenylpropanoids to increasing O3 exposure: Ecological implications in a Populus model system. Sci. Total Environ. 2021, 767, 144358. [Google Scholar] [CrossRef]
  21. Karori, S.M.; Wachira, F.N.; Ngure, R.M.; Mireji, P.O. Polyphenolic composition and antioxidant activity of Kenyan tea cultivars. J. Pharmacogn. Phytochem. 2014, 3, 105–116. [Google Scholar]
  22. Joshi, R.; Rana, A.; Gulati, A. Studies on quality of orthodox teas made from anthocyanin-rich tea clones growing in Kangra valley, India. Food Chem. 2015, 176, 357–366. [Google Scholar] [CrossRef]
  23. Chen, L.; Yao, M.Z.; Wang, X.C.; Yang, Y.J. Tea genetic resources in China. Int. J. Tea Sci. 2012, 8, 55–64. [Google Scholar]
  24. Han, W.Y.; Huang, J.G.; Li, X.; Li, Z.X.; Ahammed, G.J.; Yan, P.; Stepp, J.R. Altitudinal effects on the quality of green tea in east China: A climate change perspective. Eur. Food Res. Technol. 2017, 243, 323–330. [Google Scholar] [CrossRef]
  25. Deka, H.; Barman, T.; Dutta, J.; Devi, A.; Tamuly, P.; Pau, R.K.; Karak, T. Catechin and caffeine content of tea (Camellia sinensis L.) leaf significantly differ with seasonal variation: A study on popular cultivars in North East India. J. Food Compost. Anal. 2021, 96, 103684. [Google Scholar] [CrossRef]
  26. Porter, L.J.; Hrstich, L.N.; Chan, B.G. The conversion of procyanidins and prodelphinidins to cyanidin and delphinidin. Phytochemistry 1986, 25, 223–230. [Google Scholar] [CrossRef] [Green Version]
  27. Erol, N.T.; Sari, F.; Polat, G.; Velioglu, Y.S. Antioxidant and antibacterial activities of various extracts and fractions of fresh tea leaves and green tea. Tarim. Bilim. Derg. 2009, 15, 371–378. [Google Scholar]
  28. Zhao, C.; Tang, G.; Cao, S.; Xu, X.; Gan, R.; Liu, Q.; Mao, Q.; Shang, A.; Li, H. Phenolic profiles and antioxidant activities of 30 tea infusions from green, black, oolong, white, yellow and dark teas. Antioxidants 2019, 8, 215. [Google Scholar] [CrossRef] [Green Version]
  29. Henning, S.M.; Fajardo-Lira, C.; Lee, H.W.; Youssefian, A.A.; Go, V.L.W.; Heber, D. Catechin content of 18 teas and a green tea extract supplement correlates with the antioxidant capacity. Nutr. Cancer 2003, 45, 226–235. [Google Scholar] [CrossRef]
  30. Roy, M.K.; Koide, M.; Rao, T.P.; Okubo, T.; Ogasawara, Y.; Juneja, L.R. ORAC and DPPH assay comparison to assess antioxidant capacity of tea infusions: Relationship between total polyphenol and individual catechin content. Int. J. Food Sci. Nutr. 2010, 61, 109–124. [Google Scholar] [CrossRef]
  31. Ding, J.; Mei, S.; Gao, L.; Wang, Q.; Ma, H.; Chen, X. Tea processing steps affect chemical compositions, enzyme activities, and antioxidant and anti-inflammatory activities of coffee leaves. Food Front. 2022, 3, 505–516. [Google Scholar] [CrossRef]
  32. Enko, J.; Gliszczyńska-Świgło, A. Influence of the interactions between tea (Camellia sinensis) extracts and ascorbic acid on their antioxidant activity: Analysis with interaction indexes and isobolograms. Food Addi. Contam. 2015, 32, 1234–1242. [Google Scholar] [CrossRef]
  33. Cianciosi, D.; Forbes-Hernandez, T.Y.; Regolo, L.; Alvarez-Suarez, J.M.; Navarro-Hortal, M.D.; Xiao, J.; Quiles, J.L.; Battino, M.; Giampieri, E. The reciprocal interaction between polyphenols and other dietary compounds: Impact on bioavailability, antioxidant capacity and other physico-chemical and nutritional parameters. Food Chem. 2022, 375, 131904. [Google Scholar] [CrossRef]
  34. Chen, Q.S.; Guo, Z.M.; Zhao, J.W. Identification of green tea’s (Camellia sinensis (L.)) quality level according to measurement of main catechins and caffeine contents by HPLC and support vector classification pattern recognition. J. Pharmaceut. Biomed. 2008, 48, 1321–1325. [Google Scholar] [CrossRef]
  35. van Acker, S.A.; van den Berg, D.J.; Tromp, M.N.; Griffioen, D.H.; van Bennekom, W.P.; van der Vijgh, W.J.; Bast, A. Structural aspects of antioxidant activity of flavonoids. Free Radic. Biol. Med. 1996, 20, 331–342. [Google Scholar] [CrossRef]
  36. Cao, G.; Sofic, E.; Prior, R.L. Antioxidant and prooxidant behavior of flavonoids: Structure-activity relationships. Free Radic. Biol. Med. 1997, 22, 749–760. [Google Scholar] [CrossRef]
  37. Xu, J.Z.; Yeung, S.Y.; Chang, Q.; Huang, Y.; Chen, Z.Y. Comparison of antioxidant activity and bioavailability of tea epicatechins with their epimers. Br. J. Nutr. 2004, 91, 873–881. [Google Scholar]
  38. Cai, Y.Z.; Mei, S.; Jie, X.; Luo, Q.; Corke, H. Structure-radical scavenging activity relationships of phenolic compounds from traditional Chinese medicinal plants. Life Sci. 2006, 78, 2872–2888. [Google Scholar] [CrossRef]
Figure 1. Variations in radical scavenging capacity within tea leaves across 20 tea cultivars. Radical scavenging capacity is presented as Trolox equivalent antioxidant capacity (TEAC). (a) TEAC in DPPH (2,2-diphenyl-1-picrylhydrazyl) radical scavenging assay; (b) TEAC in ABTS (2,2′-azinobis-(3-ethylbenzothiazoline-6-sulfonic acid) radical scavenging assay; (c) correlations between DPPH TEAC and ABTS TEAC. Dots in (a,b) represent mean value ± SE (n = 3 plot replicates). Each point in (c) represents results from each sample plot. Different lowercase letters indicate significant differences among cultivars (p < 0.05). Cultivars highlighted in pink and blue are selected as a subset of cultivars with high (cultivars 16–20) and low antioxidant capacities (cultivars 1–5) for further analysis. % d.w. = % foliar dry weight. Tea cultivars: 1 Jin Mudan; 2 Hanlv; 3 Ju Hua Xiang; 4 Tie Guanyin; 5 Tai Xiang Zi; 6 Jin Guanyin; 7 Da Hong Pao; 8 Longjing 43; 9 Cui Yun; 10 Zhongcha 111; 11 Biyun; 12 Zhonghuang No. 2; 13 Longjing Changye; 14 Zhongcha 302; 15 Zhonghuang No. 1; 16 Zhongcha 108; 17 Fuan Da Bai; 18 Zhongcha 102; 19 Fuding Da Bai; 20 Jin Xuan.
Forests 14 00249 g001
Figure 2. Variations in concentrations of main phenolic compounds within tea leaves across 20 tea cultivars. (a) Condensed tannins; (b) Catechins (Σ C, EC, ECG, EGC, EGCG). Each bar represents the mean value ± SE (n = 3 plot replicates). % d.w. = % foliar dry weight. C, catechin; EC, epicatechin; ECG, epicatechin gallate; EGC, epigallocatechin; EGCG, epigallocatechin gallate. Different lowercase letters indicate significant differences among cultivars (p < 0.05).
Forests 14 00249 g002
Figure 3. Regression analyses of catechins as a contributor to TEAC in (a) DPPH (2,2-diphenyl-1-picrylhydrazyl) and (c) ABTS (2,2′-azinobis-(3-ethylbenzothiazoline-6-sulfonic acid) radical scavenging assays, (b) residuals from (a) vs. condensed tannins, (d) residuals from (c) vs. condensed tannins. Each point represents the value for a single plot replication within each of the 20 tea cultivars. % d.w. = % foliar dry weight.
Forests 14 00249 g003
Figure 4. Performance of a subset of tea cultivars with high and low antioxidant capacities. (a) Antioxidant capacities of selected tea cultivars. (b) Principal component analysis (PCA) depicting the differences between composite catechin profiles of tea cultivars exhibited high and low antioxidant capacities. Each bar represents the mean value ± SE (n = 5 cultivars for each group). Principal components (PC) 1 and 2 explained 66% and 21.1% of the variations, respectively. Each point represents the value for a single plot replication within each tea cultivar. The directions of black arrows indicate increasing catechin components. Statistical differences between high and low antioxidative tea cultivars were determined using MANOVA. Different case letters indicate significant differences in antioxidant capacity, represented as DPPH (lowercase) and ABTS (uppercase) scavenging capacities, between two groups of tea cultivars (p < 0.05). Results of cultivars with high (cultivars 16–20 in Figure 1) and low antioxidant capacities (cultivars 1–5 in Figure 1) are highlighted in pink and blue, respectively. % d.w. = % foliar dry weight.
Forests 14 00249 g004
Table 1. Summary of the total phenolic concentrations and the origin of the selected tea cultivars. % d.w. = % foliar dry weight.
CultivarsTotal Phenolic Concentrations (% d.w.)Origin
Biyun25.33 ± 0.76Zhejiang
Cui Yun25.20 ± 0.52Anhui
Da Hong Pao23.96 ± 0.56Fujian
Fuan Da Bai22.47 ± 0.96Fujian
Fuding Da Bai20.17 ± 1.00Fujian
Hanlv30.59 ± 1.70Zhejiang
Jin Guanyin23.00 ± 0.66Fujian
Jin Mudan31.10 ± 0.36Fujian
Jin Xuan21.06 ± 0.89Taiwan
Ju Hua Xiang25.64 ± 1.05Zhejiang
Longjing 4326.38 ± 1.78Zhejiang
Longjing Changye23.64 ± 0.53Zhejiang
Tai Xiang Zi26.53 ± 0.62Zhejiang
Tie Guanyin29.86 ± 2.05Fujian
Zhongcha 10224.38 ± 0.68Zhejiang
Zhongcha 10822.87 ± 0.83Zhejiang
Zhongcha 11125.81 ± 0.10Zhejiang
Zhongcha 30225.44 ± 1.00Zhejiang
Zhonghuang No. 126.29 ± 2.15Zhejiang
Zhonghuang No. 225.93 ± 0.77Zhejiang
Table 2. Partial least squares regression analyses examining the influence of main catechin components on the antioxidant capacity within tea leaves across 20 tea cultivars (n = 60). Model fitting parameters indicate the strength of relationships between explanatory and response variables. Antioxidant capacity is represented as TEAC (Trolox equivalent antioxidant capacity) in DPPH (2,2-diphenyl-1-picrylhydrazyl) and ABTS (The 2,2′-azinobis-(3-ethylbenzothiazoline-6-sulfonic acid)) radical scavenging assays. C, catechin; EC, epicatechin; ECG, epicatechin gallate; EGC, epigallocatechin; EGCG, epigallocatechin gallate.
Dependent VariableCompoundsEstimateSEdfp-Value% Variance Explained
DPPH TEACC−0.100.34590.77856.03
EC0.260.72590.714
ECG1.150.51590.028
EGC0.770.62590.216
EGCG1.890.4659<0.001
ABTS TEACC−0.180.20590.37054.94
EC0.200.46590.663
ECG0.560.32590.084
EGC0.650.38590.087
EGCG1.230.3059<0.001
Boldface values represent p < 0.05, italic values represent p < 0.1.
Table 3. Mass fraction of individual catechin components in leaves of high- and low-antioxidative tea cultivars. Concentration means are shown in the order of contribution (%) of the catechin components to the overall dissimilarity between the high- and low-antioxidative tea cultivars as determined by SIMPER analyses. % d.w. = % foliar dry weight.
Catechin
Components
High-Antioxidative
Cultivar (% d.w.)
Low-Antioxidative Cultivar (% d.w.)Contribution (%)
EGCG10.488.5357.0
ECG2.141.6218.0
EGC2.541.9717.5
EC0.650.496.5
C0.160.141.0
Disclaimer/Publisher’s Note: The statements, opinions and data contained in all publications are solely those of the individual author(s) and contributor(s) and not of MDPI and/or the editor(s). MDPI and/or the editor(s) disclaim responsibility for any injury to people or property resulting from any ideas, methods, instructions or products referred to in the content.

