Article

Genetic Diversity and Differentiation of Chinese Fir around Karst Landform in Guangxi

1
State Key Laboratory for Conservation and Utilization of Subtropical Agro-Bioresources, College of Forestry, Guangxi University, Nanning 530004, China
2
Key Laboratory of National Forestry and Grassland Administration on Cultivation of Fast-Growing Timber in Central South China, Nanning 530004, China
3
Guangxi Key Laboratory of Forest Ecology and Conservation, College of Forestry, Guangxi University, Nanning 530004, China
4
Guangxi Key Laboratory of Superior Timber Trees Resource Cultivation, Guangxi Forestry Research Institute, Nanning 530002, China
*
Author to whom correspondence should be addressed.
Forests 2023, 14(2), 340; https://doi.org/10.3390/f14020340
Submission received: 23 December 2022 / Revised: 31 January 2023 / Accepted: 3 February 2023 / Published: 9 February 2023
(This article belongs to the Special Issue Long-Term Genetic Improvement and Molecular Breeding of Chinese Fir)

Abstract

:
The karst geo-ecosystems are fragile environments. The largest karst region in the world is located in southwestern China, within which the Guangxi province is one of the main areas. Chinese fir (Cunninghamia lanceolata (Lamb.) Hook.), an evergreen species, is an important fast-growing timber tree in southern China. In the present study, we examined the genetic diversity and spatial genetic differentiation of Chinese fir in sampling localities around the karst landform region of Guangxi by genotyping 330 individuals from 11 sampling localities with 22 novel polymorphic microsatellite loci. High levels of gene flow have homogenized Chinese fir in Rongshui, Nandan, and Tiane sites, which are speculated to be the primary center of gene exchange and diversity for Chinese fir around the karst landform in Guangxi. Significant isolation by distance pattern was found among nine sampling localities. A moderate level of genetic differentiation (FST = 0.089, Dest = 0.139) between sampling localities was detected. Structure analysis divided Chinese fir into three subgroups (K = 3). With higher differentiation and less genetic variation than in the central population, marginal populations of Cangwu and Pubei were identified in the south of the karst landform. An effective conservation strategy focusing on the maintenance of genetic variation for marginal populations of the species was proposed.

1. Introduction

Chinese fir (Cunninghamia lanceolata (Lamb.) Hook.), a diploid species (2n = 2x = 22), is an important fast-growing timber tree in southern China [1]. The species occupies approximately 25% of plantations in subtropical areas of southern China [2], and the wood of the Chinese fir is widely used in building, decoration, and furniture production [3]. Chinese fir forests provide considerable ecological benefits, including carbon sequestration, soil conservation, and increasing groundwater storage [4,5].
Karst landscapes represent an important facet of the Earth’s geodiversity, and the karst geo-ecosystems are fragile environments. Guangxi province, with an area of 2.38 × 10⁵ km2, is home to one of the largest karst areas in China, and the distribution area of carbonate rock accounts for 41.57% of the total area [6]. The areas are rocky desertification, which is characterized by soil erosion and progressive degradation and is associated with very low land productivity [7]. Chinese fir cannot grow in karst areas which would fragment the distribution habitat of the species.
The effects of habitat fragmentation can cause severe consequences on trees, such as reduced effective population size, increased inbreeding, loss of genetic diversity, and a discontinuous pattern of genetic variation, mainly due to the limited gene flow [8,9]. The central–marginal hypothesis states that marginal populations show higher differentiation and less genetic variation than central populations [10]. Marginal populations are often small, spatially isolated, and occur in different or extreme habitats. Marginal populations have long caught the attention of conservation biologists because they provide insights into marked genetic differentiation from populations and the roles of adaptation [11]. Current marginal populations may become future evolutionary units, especially faced with the problem of ongoing global climatic changes [12]. Guangxi is the southernmost province in China where Chinese fir grows. Marginal populations of Chinese fir identified in the area may be of great significance for the evolutionary process and special conservation interest for the species.
Successful conservation, management, and utilization strategies for a species require an accurate assessment of the genetic variation of the population. Here, we present the first survey of genetic variation of Chinese fir in sites around the karst landform in Guangxi, China, with novel and highly polymorphic SSR markers. We hypothesize that there is an increasing genetic differentiation of Chinese fir from the north to the south of the karst landform. A second hypothesis is that a marginal population of Chinese fir exists in the south of the karst landform in Guangxi. The main goals are to (a) develop neutral EST-SSR markers with low scoring error rates for Chinese fir, (b) assess the levels of genetic diversity and differentiation among sampling localities around the karst landform, and (c) identify marginal populations of Chinese fir around the landform in the southernmost province of China.

2. Methods

2.1. Plant Sample Collection

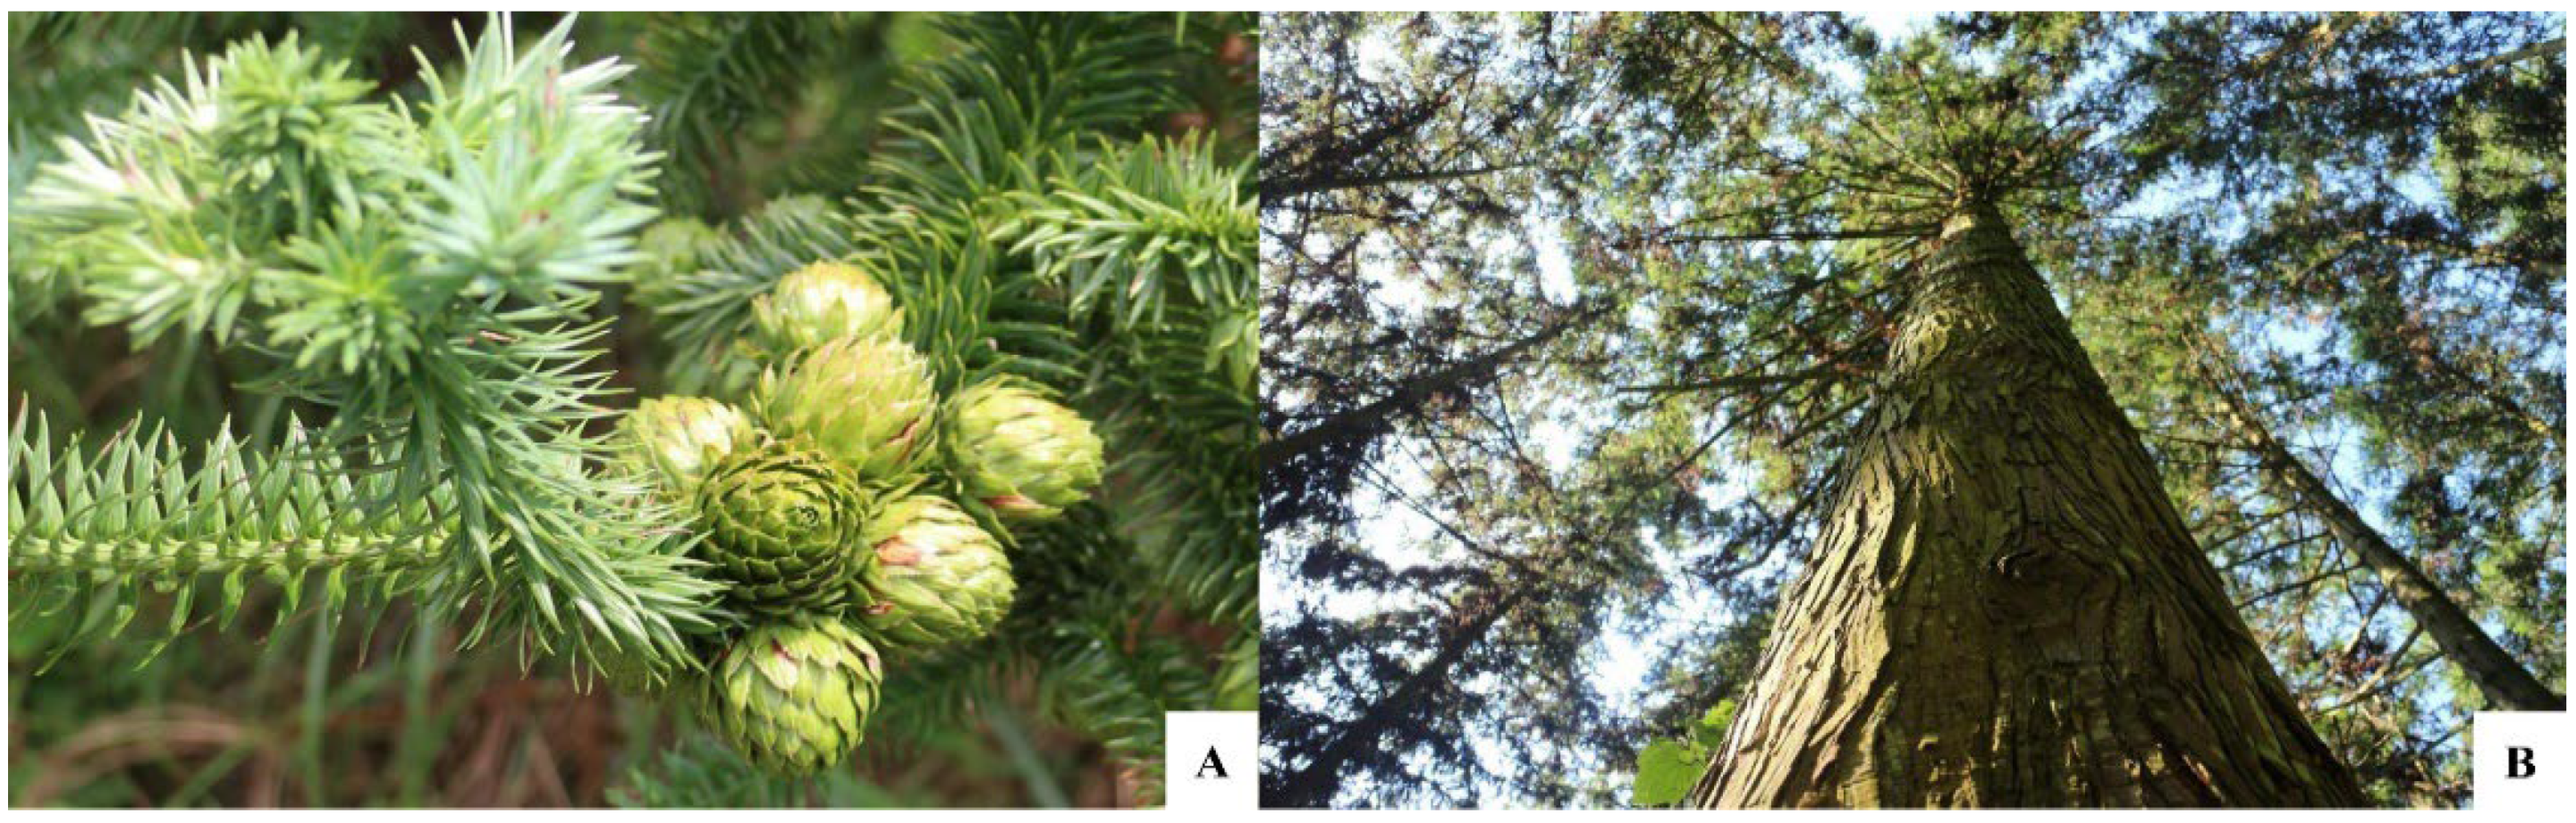
Chinese fir is a coniferous and indigenous tree species in subtropical southern China (Figure 1). The species is monoecious and predominantly outcrossing. From October to December 2019, 330 individuals of Chinese fir were collected from 11 counties (Table 1) around the karst area in Guangxi, with 30 trees being collected from each county. The age of each individual was greater than 30 years, and the distances between trees were at least 50 m. Tree age was estimated by counting growth rings of increment core sampled from breast height of Chinese firs. For each county, every group of 10 plants was considered a repeat, and the interval between three repeats was greater than 10 km. The geographical distribution of the 11 sampling localities is shown in Figure 2. Fresh leaves without diseases and insect pests were picked and immediately transported back to the laboratory in liquid nitrogen and stored at −80 °C until use.

2.2. DNA Extraction and SSR Genotyping

Total DNA of Chinese fir leaves was extracted using a Rapid Plant Genomic DNA Isolation Kit (Sangon Biotech, Shanghai, China) according to the manufacturer’s protocol. The purity and integrity of the DNA were detected using 1% agarose gel. A Nanodrop-2000 ultramicro spectrophotometer (Thermo Fisher Scientific, Wilmington, NC, USA) was used to detect the concentration of DNA. The DNA concentration was adjusted to 20 ng μL−1 with deionized water and stored at −20 °C.
The forward primers of 22 microsatellite markers were synthesized and labeled, respectively, with FAM, HEX, TAMRA, and ROX (RuiBiotech, Beijing, China). Single PCR reactions were performed over all the genotypes with 22 microsatellites. Polymerase chain reaction was performed on an Analytik Jena Biometra Tone 96G (Jena, Germany). The amplification system consisted of 5 μL 2× taqplus mix (5 U/μL, Takara, Dalian, China), 0.3 μL each of the forward (0.5 μM) and reverse primers (0.5 μM), 2 μL DNA template, and 2.4 μL deionized water. The annealing temperature was 55 °C for 40 cycles, and the amplified products were stored at 4 °C.
The amplified products were divided into five sets according to microsatellite markers. Set A includes SSR1(FAM), SSR2(HEX), SSR3(TAMRA), and SSR4(ROX). Set B includes SSR5(FAM), SSR6(HEX), SSR7(TAMRA), and SSR8(ROX). Set C includes SSR9(FAM), SSR10(HEX), SSR11(TAMRA), and SSR12(ROX). Set D includes SSR13(FAM), SSR14(HEX), SSR15(TAMRA), and SSR16(ROX). Set E includes SSR17(FAM), SSR18(HEX), and SSR19(TAMRA). Set F includes SSR20(FAM), SSR21(HEX), and SSR22(TAMRA). The amplified products of each set from the same genotype were mixed for capillary electrophoresis. Capillary electrophoresis was performed in ABI 3730xl (Applied Biosystems, Foster City, CA, USA), and the fragment size of each sampling locality was read using genemarker 2.2.0 software (SoftGenetics, State College, PA, USA).

2.3. SSR Loci Development

RNA was extracted from the roots, stems, and leaves of the Chinese fir and sequenced using Illumina Hiseq TM2000. The transcriptome sequence splicing software Trinity was used to splice transcriptome sequences [13]. SSR loci were identified using MISA software [14], and SSR primers were designed using Primer3 [15]. Primer3 options were default. Twenty-two novel SSR loci with the highest polymorphism and low null allele frequencies were selected from 1000 SSR loci. Identification method of the loci was described [16]. Twenty-two pairs of primers are shown in Table 2.
MICRO-CHECKER 2.2.3 was used to check for allelic dropout and scoring errors [1+]. The Ewens–Watterson test for neutrality and Hardy–Weinberg equilibrium (HWE) of SSR markers were conducted by POPGENE 1.32 [17] to test whether the loci were under selection pressures and the level for deviations from HWE. Linkage disequilibrium (LD) tests between pairs of microsatellite loci were performed in each sampling locality using the Arlequin 3.1 [18]. Then, the Bonferroni correction for multiple tests [19] was applied.

2.4. Genetic Diversity

Based on SSRs profiles, the polymorphism information content (PIC) was calculated using Cervus 3.0.7 [20]. The number of alleles (Na), number of effective alleles (Ne), observed heterozygosity (Ho), expected heterozygosity (He), number of private alleles (Np), Shannon’s diversity index (I), frequency of null alleles (FNA), and inbreeding coefficient (FIS) were calculated using GenAlEx6.5 [21,22]. The 95% confidence interval of the FIS was calculated from 5000 bootstrap re-samplings using the package bootES of the software R to test whether FIS was significantly different from zero [23].

2.5. Isolation-by-Distance

To analyze which sampling localities have a greater impact on IBD, the correlation between the matrix of genetic distances [FST/(1 − FST)] and the matrix of geographic distances (Km) in Chinese fir among the different sampling localities were analyzed with Mantel tests (999 permutations) run in GenAIEx6.5.

2.6. Genetic Structure

The population genetic structure of Chinese fir in the study area was investigated with STRUCTURE version 2.3.1 software [24]. The parameters were set as follows: group number K, 1–10; length of burn-in period and MCMC value, 100,000 and 200,000 times; admixture and correlated allele frequencies models, respectively; and each K value was repeated 20 times. The results were uploaded to STRUCTURE Harvester [25], and the optimum K value was obtained. STRUCTURE graphical bar plot was generated with DISTRUCT program to show membership coefficients [26].
Isolation by distance pattern can cause the algorithm of STRUCTURE to overestimate the number of genetic clusters for increased genetic differentiation among individuals with geographical distance [27]. Pairwise population differentiation coefficient FST and RST between pairs of sampling localities were computed using SPAGeDi 1.3 to explore the relationship of genetic differentiation among sampling localities [28]. If RST is > FST, then there is phylogeographic signal. Jost’s D values (Dest), Nei’s genetic distance (D), and gene flow (Nm) were calculated using GenAlEx6.5. To estimate the genetic differences between and within sampling localities, an analysis of molecular variance (AMOVA) was performed using Arlequin 3.1 software. In addition, NTSYS pc 2.10e [29] software was used to draw the dendrogram with Nei’s genetic distance based on the unweighted group average method (UPGMA). To further confirm genetic discontinuities, structure, and cluster analysis, principal coordinate analysis (PCoA) was performed using GenAlEx6.5.

3. Results

3.1. Diversity Analysis of SSR

Among the 22 loci, 195 alleles were obtained. The highest Na in the loci was 15, and the highest Ne was 5.457 (Table 3). On average, 8.864 alleles and 2.824 effective alleles were amplified per locus. The values of Ho and He ranged from 0.290 to 0.785 and 0.255 to 0.816, and the mean values were 0.603 and 0.596, respectively. The PIC of SSR loci ranged from 0.265 to 0.831, with an average value of 0.589, indicating that the loci were rich in polymorphism. The variation range of I was 0.530–1.901, with an average of 1.146. Fifteen loci had a positive FNA value, and the mean value of 22 loci was 0.03. Eleven loci had a positive FIS value, with an average value of −0.019. No large allelic dropout or scoring errors due to stuttering were detected in all the loci. All the observed fixation indexes were within the 95% confidence interval between the lower and upper limits for the test, suggesting that each SSR loci were not under positive selection. No significant LD was detected between the analyzed pairs of loci after Bonferroni correction for multiple tests.

3.2. Genetic Diversity of Chinese Fir in Sampling Localities around the Karst Landform

Chinese fir in 11 sampling localities showed a higher level of Ho (overall mean 0.603) than of He (overall mean 0.596), and FIS (overall mean −0.001) indicated an excess of heterozygotes in the 330 individuals (Table 4). The He values ranged from 0.521 to 0.635, with an average value of 0.571. The mean value of I was 1.146. Heterozygote deficiency was observed in five sampling localities (RS, ND, TE, JX, and LL; Ho < He). The FIS value of the 11 sampling localities ranged from −0.013 to 0.041, with an average value of −0.064. JX showed a higher FIS value (0.058) than other sampling localities, and the value was statistically different from zero (p < 0.05). However, Chinese fir in JX contained the highest number of private alleles. Except for the PB and NP, Chinese fir of the remaining nine sampling localities harbored private alleles. Chinese fir in RS had the highest I value (1.234), and Chinese fir in CW had the lowest value (0.976). With the highest I, Ho, and He values, Chinese fir in RS were in possession of the highest genetic diversity among 11 sampling localities.

3.3. Genetic Differentiation of Chinese Fir in Sampling Localities around the Karst Landform

Owing to the high heterozygosity of Chinese fir, the primary genetic variability exists within individuals (Table 5). AMOVA revealed that a variation within populations was 4.44%, and only 3.12% of the total molecular variance was attributable to among-population variation. Among the 11 sampling localities, the FST value ranged from −0.002 to 0.089 (Table 6), and the Dest values ranged from −0.003 to 0.139 (Table 7). FST and Dest values in these sampling localities indicated similar results of pairwise sampling localities differentiation. Both FST and Dest values between ND and TE were the lowest (FST = −0.002, Dest = −0.003), followed by that between the RS and ND groups (FST = 0.001, Dest = 0.002). Both values between RS and CW were the highest (FST = 0.089, Dest = 0.139), followed by that between CW and ZY (FST = 0.086, Dest = 0.120). No evidence of a significant phylogeographic signal was found in pairwise comparisons between 11 sampling localities (Table 7). The Nm value ranged from 4.100 to 33.041, with an average number of 12.671. The largest gene flow was observed between ND and other sampling localities. The maximum Nm value was 33.041 for ND and TE. Among them, the minimum value was 4.100 between RS and CW.
STRUCTURE was used to analyze the genetic structure of the Chinese fir. The maximum ΔK value (43.694) was observed for K = 3 (Figure 3A), which indicated that the 330 individuals of Chinese fir could be divided into three different subgroups. With the help of the structure bar plot (Figure 3C), the genotypes were clearly grouped. There is a certain degree of genetic introgression among populations, but there is still differentiation. Cluster one included RS, ND, TE, JX, LS, LL, ZY, NP, and PG, which are mainly located in the north and west of Guangxi. Cluster two was PB, and cluster three was CW, which were located in the southern coastal areas and eastern areas of Guangxi, respectively. When PB and CW were excluding, an investigation of the substructure was conducted among the remaining nine sampling localities. ΔK value peaked at K = 4, and the maximum value was only 3.458 (Figure 3B). However, Chinese fir in all sampling localities had different genetic backgrounds (Figure 3D). Most sampling localities are composed of admixed individuals, and only PB and CW are clearly differentiated.
To further explore the genetic relationship among Chinese firs in different sampling localities, the Nei’s genetic distance of the 11 sampling localities was used for PCoA (Figure 4A) and UPGMA cluster analysis (Figure 4B). The clustering result of PCoA was generally consistent with that of the STRUCTURE partition. Chinese firs in PB and CW were separated into a single cluster, and Chinese firs in another nine sampling localities were clustered together. According to the FST and Nm values and Dest values in different sampling localities, the same genetic group had smaller genetic differentiation and more frequent gene exchange, whereas Chinese fir from different groups had larger inheritance differentiation and less gene exchange.

3.4. IBD Pattern of Chinese Fir in Sampling Localities around the Karst Landform

The results of the Mantel test showed that there was a positive correlation between genetic distance and geographical distance for Chinese firs in 11 sampling localities, but this correlation was not significant (r = 0.15, p = 0.22) (Figure 5A). PB and CW were the most differentiated sampling localities. In order to analyze which localities have a greater impact on IBD, Mantel tests were applied in nine sampling localities, excluding PB and CW. The correlation was positive, and the Mantel tests were significant (r = 0.33, p = 0.04) (Figure 5B). It indicated significant IBD was found in the nine sampling localities. PG, JX, PB, and CW are located in the south of the karst landform. When Mantel tests were applied in seven sampling localities, excluding PG, JX, CW, and PB, the correlation coefficient reached 0.68, and the Mantel tests were significant (p = 0.01) (Figure 5C).

4. Discussion

Highly variable microsatellite loci are a useful tool for studying genetic diversity and genetic structure [30,31]. However, stuttering, large-allele dropout, and null alleles are three typical sources of scoring errors capable of biasing biological conclusions with microsatellite data [32]. In addition, a small percentage of EST-SSR loci could be under selective pressure [33]. Because population genetics applications are based on neutral assumptions, SSR loci under selective pressure should be excluded from analyses [34]. Neutral markers could reflect population processes, including patterns of recent gene flow and historical connectivity, as well as changes in population size [35]. A locus with a polymorphism information content (PIC) value over 0.5 could be regarded as highly polymorphic [36]. The frequency of null alleles below 8% was found to have little effect on population differentiation [37]. In this study, we developed 22 novel SSR markers, and all the loci were suitable for population analyses.
Karst areas occupy approximately 15% of continental terrains [38]. Southwestern China, where karst areas cover nearly 4.26 × 10⁵ km2, contains the largest and most well-developed karst region in the world [6,39]. Guangxi province is home to one of the largest karst areas in China. The effects of habitat fragmentation may lead to a discontinuous pattern of genetic variation and reduce the genetic diversity of the populations, mainly due to the limited gene flow [9]. The genetic diversity of Chinese firs in RS was higher than that of the other sampling localities. RS population is one of the superior provenances of the species with a fast-growing phenotype in China [40]. ND had the highest rates of gene flow with other sampling localities. No significant FST differentiation was detected in pairwise comparisons among RS, ND, and TE sampling localities, which could be the consequence of high levels of gene flow homogenizing RS, ND, and TE sampling localities. The three sampling localities are speculated to be the central source of gene flow and genetic diversity for Chinese firs around the karst landform.
Marginal populations occur near the outer boundary of the geographic range and in atypical habitats of the species [41]. By reason of genetic drift and natural selection, marginal populations will diverge from central populations [41]. Compared to central populations, marginal populations show reduced neutral genetic diversity and increased genetic differentiation [10]. CW and PB counties are located near the southern tip of China. Pairwise differentiation based on FST and Dest values confirmed the results analyzed by PCoA and NJ tree that CW had the most genetic differentiation in all sampling localities, and PB came second. With higher differentiation and less genetic variation than in the central population, populations of CW and PB were identified to be the marginal populations in the south of the karst landform.
Tree species dynamics at range edges are frequently driven by climatic factors [42]. Many low-latitude populations of cold-adapted plant species will be negatively affected by global warming [43]. Cold-adapted populations at low-latitude range edges are important because they may harbor the combination of alleles that foster persistence in a warmer climate [44]. PB county is located in the south of the Tropic of Cancer, near the southern tip of China, with the maximum temperature for Chinese fir growth. The climate of CW and PB is similar to that of the nearby area, where the annual highest temperature is about 40 °C [45]. Chinese firs are not resistant to overly high summer temperatures [46]. Under a warmer climate, genetic diversity would be subjected to selective pressure [47]. Evolutionary adaptation is an important way for natural populations to cope with threats, including extreme climate [48]. Because neutral molecular variation rarely predicts adaptive and quantitative genetic variation, it is common to fail distinguishing between differentiation due to drift and differentiation due to adaptation to different environmental conditions [49,50]. The association between environmental gradients and genotypes could be analyzed by landscape genomic approach in the future to identify potential loci from Chinese fir underlying extreme climate adaptation.
The ability of a species to adapt to peripheral habitats in marginal populations plays a major role in the evolution of species ranges and adaptation in the face of environmental change [10,41]. Marginal populations are worthy of special conservation interest [12,51,52]. Large-scale afforestation and reforestation of other tree species have occurred in Guangxi [53]. Habitat loss has been most extensive for CW and PB populations. Translocations are among the most powerful tools for biodiversity conservation [54]. Augmentation (movement of individuals into a population of conspecifics) is recognized as one of the three different types of translocations by the International Union for Conservation of Nature [55]. Augmentation can be beneficial to increasing population size [56]. By promoting the adaptive potential for evolutionary change, individuals mixing from several source populations will enhance the establishment and persistence of the translocated populations [57,58]. To preserve the genetic diversity of CW and PB populations of Chinese fir, we propose the following measures. First, core germplasm individuals from CW and PB could be collected, as previous research demonstrated [59]. In the second place, considering that locally adapted populations are most likely to establish and persist under similar ecological conditions, it is proposed that the core germplasm individuals could be freely released into nature reserves in nearby counties such as JX. In the end, a mixture of individuals from several gene pools in the north of the karst landform could be freely released into nature reserves of CW and PB.

Author Contributions

Conceptualization, K.L.; formal analysis, K.L.; methodology, K.L.; resources, K.L.; writing—original draft, K.L.; writing—review and editing, K.L.; funding acquisition, K.L. and K.H.; software K.L. and S.C.; investigation, K.L., X.C. and S.C.; supervision, K.L. and S.C.; validation, K.L. and S.C.; visualization, K.L. and S.C.; data curation, X.C. and K.H.; Project administration, X.L. All authors have read and agreed to the published version of the manuscript.

Funding

This work was financially supported by the National Key Research and Development Program Sub-project, China (2022YFD2200201-5), National Natural Science Foundation of China (32060352), Department of Human Resources and Social Security of Guangxi Zhuang Autonomous Region, China (GuiCaiSheHan[2018]112) and Guangxi Science and Technology Program (GK AB22035083).

Data Availability Statement

Sampling locations and microsatellite genotypes: https://doi.org/10.5061/dryad.bk3j9kdb5 (accessed on 18 February 2021).

Acknowledgments

We thank the reviewers and editor for all the suggestions and improvements on the manuscript. The authors would like to thank Siming Gan from the Research Institute of Tropical Forestry of the Chinese Academy of Forestry for technical assistance.

Conflicts of Interest

The authors declare that they have no known competing financial interests or personal relationships that could have appeared to influence the work reported in this paper.

References

  1. Zhang, X.; Duan, A.; Zhang, J. Tree biomass estimation of Chinese fir (Cunninghamia lanceolata) based on Bayesian method. PLoS ONE 2013, 8, e79868. [Google Scholar] [CrossRef] [PubMed]
  2. Duan, H.; Cao, S.; Zheng, H.; Hu, D.; Lin, J.; Lin, H.; Hu, R.; Sun, Y.; Li, Y. Variation in the Growth Traits and Wood Properties of Chinese Fir from Six Provinces of Southern China. Forests 2016, 7, 192. [Google Scholar] [CrossRef]
  3. Cheng, S.; Huang, A.; Wang, S.; Zhang, Q. Effect of different heat treatment temperatures on the chemical composition and structure of Chinese fir wood. BioResources 2016, 11, 4006–4016. [Google Scholar] [CrossRef]
  4. Wang, B.; Ma, X.; Guo, H.; Wang, Y.; Leng, L. Evaluation of the Chinese Fir forest ecosystem services value. Sci. Silvae Sin. 2009, 45, 124–130. [Google Scholar]
  5. Tian, D.; Xiang, W.; Chen, X.; Yan, W.; Fang, X.; Kang, W.; Peng, Y. A long-term evaluation of biomass production in first and second rotations of Chinese fir plantations at the same site. Forestry 2011, 84, 411–418. [Google Scholar] [CrossRef]
  6. Jia, Z.; Wang, J.; Zhou, X.; Zhou, Y.; Li, Y.; Li, B.; Zhou, S. Identification of the sources and influencing factors of potentially toxic elements accumulation in the soil from a typical karst region in Guangxi, Southwest China. Environ. Pollut. 2020, 256, 113505. [Google Scholar] [CrossRef]
  7. Parise, M.; Waele, J.; Gutierrez, F. Current perspectives on the environmental impacts and hazards in karst. Environ. Geol. 2009, 58, 235–237. [Google Scholar] [CrossRef]
  8. Ledig, F.T. Human impacts on genetic diversity in forest ecosystems. Oikos 1992, 63, 87–108. [Google Scholar] [CrossRef]
  9. Neophytou, C.; Konnert, M.; Fussi, B. Western and eastern post-glacial migration pathways shape the genetic structure of sycamore maple (Acer pseudoplatanus L.) in Germany. For. Ecol. Manag. 2009, 432, 83–93. [Google Scholar] [CrossRef]
  10. Eckert, C.G.; Samis, K.E.; Lougheed, S.C. Genetic variation across species geographical ranges: The central-marginal hypothesis hypothesis and beyond. Mol. Ecol. 2008, 17, 1170–1188. [Google Scholar] [CrossRef]
  11. Thompson, J.D.; Gaudeul, M.; Debussche, M.A.X. Conservation value of sites of hybridization in peripheral populations of rare plant species. Conserv. Biol. 2010, 24, 236–245. [Google Scholar] [CrossRef]
  12. Fady, B.; Aravanopoulos, F.A.; Alizoti, P.; Matyas, C.; von Wuhlischd, G.; Westergren, M.; Zlatanov, T. Evolution-based approach needed for the conservation and silviculture of peripheral forest tree populations. For. Ecol. Manag. 2016, 375, 66–75. [Google Scholar] [CrossRef]
  13. Haas, B.J.; Papanicolaou, A.; Yassour, M.; Grabherr, M.; Blood, P.D.; Bowden, J.; Couger, M.B.; Eccles, D.; Li, B.; Lieber, M.; et al. De novo transcript reconstruction from RNA-Seq: Reference generation and analysis with Trinity. Nat. Protoc. 2013, 8, 1494–1512. [Google Scholar] [CrossRef]
  14. Beier, S.; Thiel, T.; Münch, T.; Scholz, U.; Mascher, M. MISA-web: A web server for microsatellite prediction. Bioinformatics 2017, 33, 2583–2585. [Google Scholar] [CrossRef]
  15. Rozen, S.; Skaletsky, H. Primer3 on the WWW for General Users and for Biologist Programmers. In Bioinformatics Methods and Protocols; Misener, S., Krawetz, S.A., Eds.; Methods in Molecular Biology™; Humana Press: Totowa, NJ, USA, 2000; Volume 132, pp. 365–386. [Google Scholar]
  16. Van-Oosterhout, C.; Hutchinson, W.F.; Wills, D.P.M.; Shipley, P. MICRO-CHECKER: Software for identifying and correcting genotyping errors in microsatellite data. Mol. Ecol. Notes 2004, 4, 535–538. [Google Scholar] [CrossRef]
  17. Yeh, F.C.; Yang, R.; Boyle, T.B.J.; Ye, Z.; Mao, J.X. POPGENE, The User-Friendly Shareware for Population Genetic Analysis; University of Alberta: Edmonton, AB, Canada, 1997. [Google Scholar]
  18. Excoffier, L.; Laval, G.; Schneider, S. Arlequin (version 3.0): An integrated software package for population genetics data analysis. Evol. Bioinform. 2005, 1, 47–50. [Google Scholar] [CrossRef]
  19. Bonferroni, C. Teoria statistica delle classi e calcolo delle probabilita. Pubblicazioni del R Istituto Superiore di Scienze Economiche e Commericiali di Firenze 1936, 8, 3–62. [Google Scholar]
  20. Kalinowski, S.T.; Taper, M.L.; Marshall, T.C. Revising how the computer program cervus accommodates genotyping error increases success in paternity assignment. Mol. Ecol. 2007, 16, 1099–1106. [Google Scholar] [CrossRef]
  21. Peakall, R.; Smouse, P.E. GENALEX 6: Genetic analysis in Excel. Population genetic software for teaching and research. Mol. Ecol. Notes 2006, 6, 288–295. [Google Scholar] [CrossRef]
  22. Peakall, R.; Smouse, P.E. GenAlEx 6.5: Genetic analysis in Excel. Population genetic software for teaching and research an update. Bioinformatics 2012, 28, 2537–2539. [Google Scholar] [CrossRef]
  23. Kirby, K.N.; Gerlanc, D. BootES: An R package for bootstrap confidence intervals on effect sizes. Behav. Res. Ther. 2013, 45, 905–927. [Google Scholar] [CrossRef]
  24. Pritchard, J.K.; Stephens, M.; Donnelly, P. Inference of population structure using multilocus genotype data. Genetics 2000, 155, 945–959. [Google Scholar] [CrossRef] [PubMed]
  25. Evanno, G.; Regnaut, S.; Goudet, J. Detecting the number of clusters of individuals using the software STRUCTURE: A simulation study. Mol. Ecol. 2005, 14, 2611–2620. [Google Scholar] [CrossRef] [PubMed]
  26. Rosenberg, N.A. DISTRUCT: A program for the graphical display of population structure. Mol. Ecol. Notes 2004, 4, 137–138. [Google Scholar] [CrossRef]
  27. Frantz, A.C.; Cellina, S.; Krier, A.; Schley, L.; Burke, T. Using spatial Bayesian methods to determine the genetic structure of a continuously distributed population: Clusters or isolation by distance? J. Appl. Ecol. 2009, 46, 493–505. [Google Scholar] [CrossRef]
  28. Hardy, O.J.; Vekemans, X. SPAGeDi: A versatile computer program to analyse spatial genetic structure at the individual or population levels. Mol. Ecol. Notes 2002, 2, 618–620. [Google Scholar] [CrossRef]
  29. Rohlf, F.J. NTSYS-pc. Numerical Taxonomy and Multivariate Analysis System, version 2.0; Department of Ecology and Evolution, State University of New York at Stony Brook: Stony Brook, NY, USA, 1998. [Google Scholar]
  30. Kpatènon, M.J.; Valère, S.K.; Sylvain, S.; Leila, Z.; Muriel, L.; Christine, T.C.; Cédric, M.; Estelle, J.; Thierry, B.; Kifouli, A. Transferability, development of simple sequence repeat (SSR) markers and application to the analysis of genetic diversity and population structure of the African fan palm (Borassus aethiopum Mart.) in Benin. BMC Genet. 2000, 21, 145. [Google Scholar] [CrossRef]
  31. Kumar, R.; Parkash, K.S.; Vikas, S.; Ashutosh, S.; Gagandeep, S.; Kumar, S.R.; Kumar, C.R.; Raj, S.T. Development of transcriptome-wide SSR markers for genetic diversity and structure analysis in Macrotyloma uniflorum (Lam.) Verdc. Physiol. Mol. Biol. Plants Int. J. Funct. Plant Biol. 2020, 26, 2255–2266. [Google Scholar] [CrossRef]
  32. DeWoody, J.; Nason, J.D.; Hipkins, V.D. Mitigating scoring errors in microsatellite data from wild populations. Mol. Ecol. Notes 2006, 6, 951–957. [Google Scholar] [CrossRef]
  33. Ellis, J.R.; Burke, J.M. EST-SSRs as a resource for population genetic analyses. Heredity 2007, 99, 125–132. [Google Scholar] [CrossRef]
  34. Selkoe, K.A.; Toonen, R.J. Microsatellites for ecologists: A practical guide to using and evaluating microsatellite markers. Ecol. Lett. 2006, 9, 615–629. [Google Scholar] [CrossRef] [PubMed]
  35. Mitrovski, P.; Heinze, D.A.; Broome, L.; Hoffmann, A.A.; Weeks, A.R. High levels of variation despite genetic fragmentation in populations of the endangered mountain pygmy-possum, Burramys parvus, in alpine Australia. Mol. Ecol. 2007, 16, 75–87. [Google Scholar] [CrossRef] [PubMed]
  36. Botstein, D.; White, R.L.; Skolnick, M.; Davis, R.W. Construction of genetic linkage map in man using restriction fragment length polymorphisms. Am. J. Hum. Genet. 1980, 32, 314–331. [Google Scholar] [PubMed]
  37. Chapuis, M.P.; Estoup, A. Microsatellite Null Alleles and Estimation of Population Differentiation. Mol. Biol. Evol. 2007, 24, 621–631. [Google Scholar] [CrossRef]
  38. Jiang, Z.C.; Lian, Y.Q.; Qin, X.Q. Rocky desertification in Southwest China: Impacts, causes, and restoration. Earth Sci. Rev. 2014, 132, 1–12. [Google Scholar] [CrossRef]
  39. Feng, T.; Chen, H.S.; Polyakov, V.O.; Wang, K.L.; Zhang, X.B.; Zhang, W. Soil erosion rates in two karst peak-cluster depression basins of northwest Guangxi, China: Comparison of the RUSLE model with 137 Cs measurements. Geomorphology 2016, 253, 217–224. [Google Scholar] [CrossRef]
  40. National Collaborative Research Group on Provenance Trial of Chinese Fir. Provenanve Selection of Cunninghamia lanceolata (Lamb.) Hook for Planting Area in China. For. Res. 1988, 1, 1–13. [Google Scholar]
  41. Lesica, P.; Allendorf, F.W. When are peripheral populations valuable for conservation? Conserv. Biol. 1995, 9, 753–760. [Google Scholar] [CrossRef]
  42. Boucher-Lalonde, V.; Morin, A.; Currie, D.J. How are tree species distributed in climatic space? A simple and general pattern. Glob. Ecol. Biogeogr. 2012, 21, 1157–1166. [Google Scholar] [CrossRef]
  43. Pauli, H.; Gottfried, M.; Dullinger, S.; Abdaladze, O.; Akhalkatsi, M.; Benito Alonso, J.L.; Grabherr, G. Recent plant diversity changes on Europe’s mountain summits. Science 2012, 336, 353–355. [Google Scholar] [CrossRef]
  44. Abeli, T.; Vamosi, J.C.; Orsenigo, S. The importance of marginal population hotspots of cold-adapted species for research on climate change and conservation. J. Biogeogr. 2018, 45, 977–985. [Google Scholar] [CrossRef]
  45. Jin, C.Z.; Pan, W.S.; Zhang, Y.Q.; Cai, Y.J.; Xu, Q.Q. The Homo sapiens Cave hominin site of Mulan Mountain, Jiangzhou District, Chongzuo, Guangxi with emphasis on its age Chin. Sci. Bull. 2009, 54, 3848–3856. [Google Scholar] [CrossRef]
  46. Zhang, X.; Wang, H.; Chhin, S.; Zhang, J. Effects of competition, age and climate on tree slenderness of Chinese fir plantations in southern China. For. Ecol. Manag. 2020, 458, 117815. [Google Scholar] [CrossRef]
  47. Alberto, F.J.; Aitken, S.N.; Alía, R.; González-Martínez, S.C.; Hänninen, H.; Kremer, A.; Lefèvre, F.; Lenormand, T.; Yeaman, S.; Whetten, R.; et al. Potential for evolutionary responses to climate change evidence from tree populations. Glob. Change Biol. 2013, 19, 1645–1661. [Google Scholar] [CrossRef]
  48. Gienapp, P.; Teplitsky, C.; Alho, J.S.; Mills, J.A.; Merilä, J. Climate change and evolution: Disentangling environmental and genetic responses. Mol. Ecol. 2008, 17, 167–178. [Google Scholar] [CrossRef]
  49. Kohn, M.H.; Murphy, W.J.; Ostrander, E.A.; Wayne, R.K. Genomics and conservation genetics. Trends Ecol. Evol. 2006, 21, 629–637. [Google Scholar] [CrossRef]
  50. Ralls, K.; Ballou, J.D.; Dudash, M.R.; Eldridge, M.D.; Fenster, C.B.; Lacy, R.C.; Frankham, R. Call for a paradigm shift in the genetic management of fragmented populations. Conserv. Lett. 2018, 11, e12412. [Google Scholar] [CrossRef]
  51. Leppig, G.; White, J. Conservation of peripheral plant populations in California. Madrono 2016, 53, 264–274. [Google Scholar] [CrossRef]
  52. Birkeland, S.; Skjetne, I.E.B.; Brysting, A.K.; Elven, R.; Alsos, I.G. Living on the edge: Conservation genetics of seven thermophilous plant species in a high Arctic Archipelago. Ann. Bot. Plants 2017, 9, plx001. [Google Scholar] [CrossRef]
  53. Yang, G.R.; Shi, X.H.; Cai, D.S.; Huang, C.B.; Lei, S.M.; Zhang, H. Water quality of throughfall and stemflow in planted forest in Guangxi, China. J. Food Agric. Env. 2011, 9, 947–953. [Google Scholar]
  54. Hunter, M.L. Climate change and moving species: Furthering the debate on assisted colonization. Conserv. Biol. 2007, 21, 1356–1358. [Google Scholar] [CrossRef]
  55. IUCN. IUCN Position Statement on Translocation of Living Organisms: Introductions, Re-Introductions and Re-Stocking; International Union for Conservation of Nature and Natural Resources Council: Gland, Switzerland, 1987. [Google Scholar]
  56. Pickup, M.; Young, A.G. Population size, self-incompatibility and genetic rescue in diploid and tetraploid races of Rutidosis leptorrhynchoides. Heredity 2008, 100, 268–274. [Google Scholar] [CrossRef]
  57. Broadhurst, L.M.; Lowe, A.; Coates, D.J.; Cunningham, S.A.; McDonald, M.; Vesk, P.A.; Yates, C. Seed supply for broadscale restoration: Maximizing evolutionary potential. Evol. Appl. 2008, 1, 587–597. [Google Scholar] [CrossRef]
  58. Sgrò, C.M.; Lowe, A.J.; Hoffmann, A.A. Building evolutionary resilience for conserving biodiversity under climate change. Evol. Appl. 2011, 4, 326–337. [Google Scholar] [CrossRef]
  59. Li, K.P.; Chen, S.C.; Cheng, L.; He, J.F.; Tang, H.L.; Tan, W.J.; Yu, D.Y.; Wang, B.; Mo, Z.H.; Huang, K.Y. Construction of Core Germplasm of Chinese Fir in Guangxi Based on SSR Molecular Markers. Guangxi Sci. 2021, 28, 511–519. [Google Scholar]
Figure 1. (A) Twigs and cones of Chinese fir. (B) Trunks and tree canopies of Chinese fir.
Forests 14 00340 g001
Figure 2. Map showing the geographical locations where samples were collected. Locations of the 11 sampled sites are shown by colorful markings (see Table 1 for the details of these sampled locations).
Forests 14 00340 g002
Figure 3. Population structure analysis for 11 and 9 sampling localities. (A) The best K value estimated by ln likelihood for 11 sampling localities. (B) The best K value estimated by ln likelihood for 9 sampling localities. (C) Bar plot of individual ancestral composition for the genetic clusters, using K = 3 and the dataset of 330 individuals from 11 sampling localities. (D) Bar plot of individual ancestral composition for the genetic clusters, using K = 4 and the dataset of 270 individuals from 9 sampling localities.
Forests 14 00340 g003
Figure 4. (A) Principal coordinate analysis for Chinese firs in 11 sampling localities. The first and second axis explained 57.05% and 23.33% of the genetic variation. For sampling localities abbreviations, see Table 1. (B) Unweighted group average method (UPGMA) cluster analysis of 11 sampling localities based on genetic distance.
Forests 14 00340 g004
Figure 5. Correlation of genetic distance [FST/(1 − FST)] with geographical distance (Km) of Chinese firs in different sampling localities. (A) The correlation of all 11 sampling localities. (B) The correlation of 9 sampling localities, excluding sampling localities of CW and PB. (C) The correlation of 7 sampling localities, excluding sampling localities of PG, JX, CW, and PB.
Forests 14 00340 g005
Table 1. Information on samples and sampling locations.
Sampling LocationsSample SizeLatitude/° (E)Longitude/° (N)Altitude/m
RS30108.2525.07500–1500
ND30107.5224.97500–1000
TE30107.1725.85800–1300
JX30109.6723.97115–500
LS30109.3325.801200–1600
LL30105.3224.77800–1400
ZY30110.6226.02800–1200
PB30110.1722.62144–300
NP30105.8223.42260–794
PG30111.5324.42800–1000
CW30111.2223.42144–196
RS represents Rongshui, Liuzhou; ND, Nandan, Hechi; TE, Tiane, Hechi; JX, Jinxiu, Laibin; LS, Longsheng, Guilin; LL, Longlin, Baise; ZY, Ziyuan, Guilin; PB, Pubei, Yulin; NP, Napo, Baise; PG, Pinggui, Hezhou; and CW, Cangwu, Wuzhou.
Table 2. Characterization of novel 22 EST-SSR primers pairs in Chinese fir.
Primer IDMotifForward Primer (5′-3′)Reverse Primer (5′-3′)Allele Range (bp)Annealing Temperature (°C)Genebank ID
SSR1(GGA)6GCCTTGTGCAAAGCGGTAAAAGGAAACTGCACTGTACGCA198–22258MZ027666
SSR2(AT)8CCCGGCCCAAGCTTTTAGAAACAGGACAACATCAGGACCC169–18556MZ027660
SSR3(TCTGCC)7TGTTGTCTTGTGTTGGCCCTACTCCAACACAGGTGACAGC215–24558MZ027649
SSR4(TC)9ACCGTAATTGGCTGCACTGTTCGAGACAGCCATGGTCATG247–27358MZ027654
SSR5(ATG)10CTCTGTGCAAAAGTCACCGCCGAGGACAAGAGAGGGTTTGA159–18660MZ027653
SSR6(TTGGAG)5GCGGTAGTCCCTGCTTTTCTTGGATGGGGAGTGTCTCGAT199–22956MZ027650
SSR7(GGC)7GTGAGCGATCGAGAGACTGGACCACTTCGGCGACTTTCAT228–26156MZ027658
SSR8(TGC)6ATTGTGCCACTGGTTGCATTGCTCAACAACAACAGCTGCA222–26458MZ027662
SSR9(GGA)7CATCAACAGCCCACAAAGCCACATGGTAGCGAGTCCAAGC178–19358MZ027663
SSR10(TAG)7TCACTGCCGATCAACCAACATCCACTCTTACCCTGCCTGA209–23660MZ027661
SSR11(TAT)6AACATTTGGCCGAGAGATCGTGCCGCTTGACTTGTGCTTA239–27560MZ027668
SSR12(TGGGCA)7TGTTGCAGCATTTGGGCTTCACCCATGCTCAACTTACGGG259–33156MZ027656
SSR13(CA)6GCGCGCGCACATATACATACTTCACCTTGGCCAAGATTGT90–10658MZ027669
SSR14(GAT)8TGGCCTTTCCATGACTGCTTCTAGGCGGCAGAGTGAACAA197–16158MZ027664
SSR15(TGCC)5GTCTCTGGTGTGGGGTTGTGCGGCAGCTGTACGTACTCAT215–23557MZ027651
SSR16(CAGG)5GCACATGAAAAGCTCCGTCGGACAGACGGGCAAAGGAAGA246–27856MZ027652
SSR17(GTG)5TACAAGTGCTCCATGGCCAGTGCATCCACGCAAGATACGT114–15360MZ027655
SSR18(AGGC)6CGGCAGCTGTACGTACTCATCTGTCTCTGGTGTGGGGTTG208–23260MZ027665
SSR19(CTCCAT)5GTCCCTGTTTCTGCCAGTGAACTCCATCTCCTAGAGCACCA244–28658MZ027659
SSR20(AATG)5GGCAATCTAGCGAGCTTCCTCTTGCTCTCCCTGTATGCGT109–17358MZ027670
SSR21(CAG)7GCAAGAGCATCAGCATCAGCCAAAGTCAGGCATGCCCCTA189–21056MZ027667
SSR22(CACCAA)8AGGAAACCCCACCGCATATGCACTGCTCGTTGGCATTGTC219–26156MZ027657
Table 3. Genetic parameters of 22 simple sequence repeat markers in all tested Chinese fir.
LociNaNeIHoHePICFNAFISObs.FL95U95
SSR182.5811.0800.6000.6090.5650.0150.0150.3710.2190.806
SSR272.8661.1570.6400.648 *0.6800.1050.0120.3230.2590.909
SSR3103.2801.3640.6630.6900.7330.0970.0400.2620.2080.774
SSR451.9650.8080.4760.4800.4210.0200.0100.5090.2880.950
SSR5113.3571.3940.7810.695 *0.673−0.051−0.1230.2880.1880.741
SSR652.6071.0630.7850.610 *0.544−0.130−0.2870.3800.3040.947
SSR7113.3071.3430.7350.693 *0.7210.042−0.0620.2720.1900.732
SSR8155.4571.8710.7840.8140.8160.0350.0380.1660.1470.554
SSR962.6221.1200.5330.569 *0.5830.0820.0630.3820.2650.912
SSR1093.2701.3560.6800.6890.6790.0360.0130.2870.2240.818
SSR1162.4911.0170.5810.594 *0.5760.0570.0210.3790.3050.945
SSR12145.5941.9010.7390.816 *0.8310.0820.0940.1600.1540.624
SSR1372.4480.9700.3990.567 *0.6070.2670.2960.3910.2550.918
SSR1492.9291.2070.6990.6570.637−0.001−0.0640.3180.2170.826
SSR1572.3971.0040.6310.580 *0.523−0.037−0.0880.4080.2670.909
SSR1681.9350.8410.5110.4730.434−0.013−0.0810.5050.2200.811
SSR17121.8100.8180.4270.3930.401−0.013−0.0860.5740.1670.632
SSR1882.3080.9680.5900.5570.5310.014−0.0590.4020.2470.877
SSR1992.4891.1620.5830.5820.5770.032−0.0020.4060.2140.819
SSR20113.0121.2890.6200.647 *0.6510.0580.0410.3140.1920.734
SSR2181.3710.5300.2900.2550.265−0.046−0.1380.7350.2380.866
SSR2292.0240.9380.5270.4910.5020.014−0.0740.4920.2220.833
Mean8.8642.8241.1460.6030.5960.5890.030−0.019
Na, number of alleles; Ne, number of effective alleles; I, Shannon’s diversity index; Ho, observed heterozygosity; He, expected heterozygosity; PIC, the polymorphism information content; FNA, frequency of null alleles; FIS, inbreeding coefficient; Obs.F, observed frequency of marker; L95, lower 95% confidence limit; U95, upper 95% confidence limit. *, the significant level for deviations from HWE (p ≤ 0.01).
Table 4. Genetic diversity of Chinese fir in 11 sampling localities.
Sampling LocationsNpNaNeIHoHeFISCI95%
RS45.3183.0041.2340.6280.6350.023−0.028~0.076
ND35.4552.9581.1960.6020.6140.032−0.021~0.075
TE25.2272.9231.1930.6080.6150.018−0.038~0.122
JX65.5913.0091.2310.6000.6280.0580.008~0.118
LS35.1822.8931.1810.6170.6120.010−0.046~0.069
ZY45.0912.7321.1200.6030.585−0.019−0.079~0.054
LL25.0912.8651.1460.5890.5960.022−0.041~0.073
PG35.0002.6301.0900.5970.574−0.022−0.105~0.043
NP04.9092.7911.1250.6320.589−0.060−0.188~0.005
PB04.8182.7071.1090.5870.5860.013−0.037~0.094
CW14.3642.5480.9760.5740.521−0.088−0.240~0.048
Mean35.0952.8241.1460.6030.596−0.001−0.029~0.019
Np, number of private alleles; Na, number of alleles; Ne, number of effective alleles; I, Shannon’s diversity index; Ho, observed heterozygosity; He, expected heterozygosity; FIS, inbreeding coefficient; CI95%, the 95% confidence interval of the FIS.
Table 5. AMOVA partitioning of molecular variance of Chinese fir in 11 sampling localities.
Source of Variationd.f.Sum of SquaresVariance ComponentsPercentage of Variance (%)p
Among populations10202.340.223.12<0.001
Among individuals within populations3192266.330.314.44<0.001
Within individuals3302139.006.4892.44<0.001
Total6594607.677.01
d.f., degrees of freedom. p, the significance of the covariance tested using non-parametric permutation procedures.
Table 6. Pairwise population differentiation based on FST values and gene flow among Chinese fir in 11 sampling localities. Abbreviations for sampling localities are given in Table 1. Pairwise FST below diagonal; Pairwise Nm above diagonal. Statistically significant results of allele size permutation tests to assess differences in FST (p < 0.05) are shown in bold type.
RSNDTEJXLSZYLLPGNPPBCW
RS 27.29821.75516.12715.11411.5389.9908.5258.4946.1704.100
ND0.001 33.04120.44519.87516.35915.38214.30611.5178.6975.391
TE0.005−0.002 19.62220.52615.55112.10812.52110.1309.4805.143
JX0.0130.0070.007 20.20612.07916.20816.21812.62213.2895.917
LS0.0150.0080.0060.006 15.71011.24711.0009.80310.1694.648
ZY0.0240.0130.0150.0230.015 9.4239.6497.5818.7564.184
LL0.0280.0110.0180.0100.0220.029 19.69217.89310.4336.637
PG0.0400.0170.0200.0130.0260.0330.008 16.44713.64912.176
NP0.0370.0230.0280.0220.0300.0430.0090.015 7.6238.900
PB0.0620.0400.0360.0200.0320.0410.0290.0210.049 5.547
CW0.0890.0630.0660.0580.0760.0860.0510.0210.0400.067
Table 7. Pairwise population differentiation based on Jost’s D and RST values among 11 sampling localities on Chinese firs. Abbreviations for gene pools are given in Table 1. Pairwise Jost’s D values below diagonal; Pairwise RST above diagonal.
RSNDTEJXLSZYLLPGNPPBCW
RS 0.015−0.005−0.0030.0160.0210.0430.0390.0210.0690.098
ND0.002 0.0030.0000.002−0.001−0.001−0.008−0.0050.0090.048
TE0.009−0.003 −0.0140.0100.0130.0280.011−0.0010.0370.058
JX0.0240.0120.012 0.0130.0150.0230.007−0.0040.0310.052
LS0.0260.0120.0110.011 0.0000.0030.0180.0240.0390.096
ZY0.0410.0200.0240.0390.016 0.0090.0180.0200.0290.086
LL0.0480.0170.0290.0170.0300.045 0.0080.0190.0210.067
PG0.0660.0260.0310.0210.0410.0490.012 −0.009−0.0020.018
NP0.0640.0370.0450.0360.0400.0670.0130.022 0.0160.029
PB0.1070.0660.0580.0330.0470.0620.0450.0310.077 0.037
CW0.1390.0920.0960.0860.1020.1200.0700.0270.0530.092
Disclaimer/Publisher’s Note: The statements, opinions and data contained in all publications are solely those of the individual author(s) and contributor(s) and not of MDPI and/or the editor(s). MDPI and/or the editor(s) disclaim responsibility for any injury to people or property resulting from any ideas, methods, instructions or products referred to in the content.

