Article

Hydrological Properties of Soil and Litter Layers of Four Forest Types Restored in the Gully Erosion Area of Latosol in South China

1
Key Laboratory of Genetics and Germplasm Innovation of Tropical Special Forest Trees and Ornamental Plants, Ministry of Education, School of Forestry, Hainan University, Haikou 570228, China
2
Engineering Research Center of Rare and Precious Tree Species in Hainan Province, Haikou 570228, China
3
Sanya Nanfan Research Institute, Hainan University, Sanya 572025, China
*
Author to whom correspondence should be addressed.
These authors contributed equally to this work.
Forests 2023, 14(2), 360; https://doi.org/10.3390/f14020360
Submission received: 21 November 2022 / Revised: 5 February 2023 / Accepted: 9 February 2023 / Published: 11 February 2023
(This article belongs to the Special Issue Forest Ecohydrology: From Theory to Practice)

Abstract

:
Litter and soil play an important role in influencing hydrological processes and the global water cycle. Artificial afforestation, as a part of vegetation restoration, was constructed in the gully erosion areas of latosol with the objective to prevent erosion. Variations in the hydrological properties in soils that have undergone vegetation restoration from gully erosion are not well understood. In this study, we examine the variations in the litter thickness and mass, soil structure and porosity, and hydrological properties of four forest types (eucalyptus–grass forest, bamboo–grass forest, acacia–grass forest, and shrub–grass forest). The results show that the total litter thickness varied from 1.71 to 3.74 cm and was highest in the acacia–grass forest. The total litter mass for the acacia–grass forest, 3.49 ± 0.06 t·ha−1, was significantly higher than that for the other forest types. The mass of the undecomposed litter (UL) layer was significantly lower than that of the semi-decomposed litter (SL). (2) The maximum water-retention capacity (Wmax) and effective water-retention capacity (Weff) of the SL layer were greater than those of the UL layer. The Wmax and Weff for the acacia–grass forest were markedly larger than those of the eucalyptus–grass, bamboo–grass, and shrub–grass forests. The water absorption rates of the SL and UL layers were highest during the onset of the immersion experiment, declined exponentially with time, and declined rapidly in the first 2 h. (4) The soil bulk density ranged from 1.46 g·cm−3 to 1.54 g·cm−3, and the total porosity ranged from 32.06% to 37.13%. The soil bulk density increased with the increasing soil depth, while the total porosity decreased gradually. The soil water-holding capacity of the soil layer of 0–60 cm in the acacia–grass forest (301.76 t·ha−1) was greater than that of the other forest types. A comprehensive evaluation of the water conservation capacity by the entropy weight method showed that the water conservation capacity was greatest in the acacia–grass forest. The higher water-holding capacity of the acacia–grass forest may be more effective in enhancing rainfall interception, minimizing splash erosion, and decreasing surface runoff. Here, the results indicate that acacia–grass forest restoration can mitigate soil erosion by favoring soil and water conservation, improving the environment in the gully erosion area of latosol.

1. Introduction

Soil erosion can have significant influences on ecosystem function and services, and it is thus a serious threat to sustainable global development [1,2]. Consequences from soil erosion can lead to soil fertility degradation, water eutrophication, riverbed aggradation, vegetation degradation, and the acceleration of ecosystem dysfunction [3,4,5]. The red soils in southern China are ranked second, after the Loess Plateau, in soil erosion severity. These severely degraded soils [6,7] are mainly distributed in the Jiangxi, Fujian, Hunan, Guangdong, and Hainan provinces [2,3,8] and have been encountering soil and water loss since the 1950s [8]. The red soil region accounts for 22% of China’s total land area but makes up more than 50% of the nation’s total soil loss [9]. This area is regarded as a dominant factor of ecosystem degradation in southern China and has received increasing attention from the government [2]. Vegetation restoration plays a key role in water and soil conservation [10,11,12,13,14], and increases in vegetation cover have been shown as an effective measure to reduce soil erosion [15]. Over the past few decades, vegetation restoration through the State Key Forestry Ecological Projects has been carried out in the red soil region of southern China. These efforts are recognized as the main measure for controlling soil and water loss, greatly improving the regional environment [16,17,18,19].
Gully erosion in the red soil region is generally formed through a combination of water and gravity effects [2,20]. The rainfall in this region is particularly heavy and concentrated, generating high-intensity rainfall events [2,15]. More and more studies are showing that gully erosion has a strong influence on soil quality [21,22,23]. Reports have demonstrated that gully erosion affected 1220 km2 in the red soil region from 1950 to 2005, leading to the loss of more than 60 Mt of soil [15], which is now effectively controlled by vegetation restoration [15,23]. The success of vegetation restoration to control gully erosion is reliant on the location and climate of the red soil region. This area is located in the subtropical and tropical monsoon region, which has abundant rainfall, high temperatures, and high productivity potential and could be more favorable to vegetation growth [15]. Vegetation restoration plays a key role in mitigating soil erosion through a supply of improved hydrological regulation services.
The vegetation in soil-eroded areas influences the hydrologic processes and is critical for the terrestrial ecosystem water cycle [24,25]. The forest canopy, litter layer, and mineral soil layer of the root zone are regarded as the first, second, and third functioning layers regulating the hydrological behaviors in forest ecosystems [26,27,28,29,30]. These layers are often used to scientifically assess the water conservation function of forest ecosystems [31,32]. Several studies have reported a significant benefit of water conservation from the litter and soil layers when a thicker litter layer and more porous soil exist in forest ecosystems [10,30,33,34,35,36]. However, the hydrological properties and water conservation function of the litter and soil layer of plantations in the gully erosion area of latosol in tropical zones have not been well studied. The service of the water conservation of forest ecosystems that have undergone optimal vegetation restoration for controlling gully erosion should be further investigated.
Forest litter and soil layers are important ecosystem components for regulating hydrological processes [30,33,37,38,39,40]. The litter layer acts as a sponge to intercept rainfall, relieving rainfall splash, and delaying or reducing surface runoff by infiltrating it into soils [35,41,42,43]. The forest ecosystem water budget is intensely affected by this process [4,34,35]. Consequently, the litter layer thickness and mass, soil structure and porosity, and water-holding capacity depend on forest vegetation [10,33,37,44,45]. Previous studies have investigated the effects of soil erosion on broad-leaved forests, which form a broad canopy and enhance the interception capacity of rainfall [28,37,46,47]. The broad-leaved forest ecosystem is highly conducive to water conservation [27,42,48]. An Acacia mangium plantation in the eroded area of latosol was found to generally favor the water-holding capacity in the litter layer [41]. However, the differences in the hydrological properties of broad-leaved forests in the gully erosion areas of latosol’s tropical zones are not well understood.
Eroded latosol areas in Danzhou County, Hainan Province are a consequence of extensive deforestation in the 1960s to 1980s, which made vegetation scarce, thus loosening the soil and intensifying erosion during the rainy season [41,49]. Starting in 2000, vegetation restoration was conducted by planting soil- and water-conservation tree species, such as Acacia mangium and Eucalyptus robusta. Water and soil loss have been effectively controlled. However, barren soil in the gully erosion region that underwent restoration was more challenging than expected. In 2012, vegetation restoration was initiated in the gully erosion areas. Four vegetative restoration types were used: eucalyptus–grass forest, bamboo–grass forest, acacia–grass forest, and shrub–grass forest. As a result, gully erosion was effectively controlled and the regional environment was improved. However, the hydrological properties of the litter and soil layers in these forests are not well understood. In this study, the four forest types in the gully erosion area of latosol in the Mahuangling Watershed were investigated. We quantified the litter thickness and mass, the soil structure and porosity, and the hydrological properties. The aim of this study was to illuminate the effects of vegetation restoration on water conservation from the litter and soil layers to provide a theoretical and practical basis for vegetation restoration in the areas of latosol gully erosion.

2. Materials and Methods

2.1. Study Sites

This study was conducted in the Mahuangling Watershed at the Mahuangling Soil and Water Conservation Monitoring Station (19°41′~19°47′ N, 109°24′~109°30′ E) (Figure 1), located in Danzhou City, Hainan Province, China. The region has a tropical monsoon climate, with a mean annual temperature of 23.5 °C. The mean annual precipitation is approximately 1815 mm, with about 80%~85% occurring from May to October. The soils are typical latosol soils that originated from granitic parent materials. Due to vegetation over-harvesting and deforestation from the 1960s to 1980s, soil erosion intensified in the already eroded area of latosol. In the 2000s, as a part of the State Key Forestry Ecological Projects, vegetation restoration was conducted within the gully erosion area, specifically consisting of eucalyptus–grass forest (E. robusta and P. distichum), bamboo–grass forest (Bambusa oldhamii and P. distichum), acacia–grass forest (A. mangium and P. distichum), and shrub–grass forest (Melastoma candidum, U. lobata, and P. distichum). These restoration efforts have proven to be successful in controlling soil and water loss, greatly improving the local environment. Moreover, this study site is now primarily covered by plantation forests. The understory consists of species of Urena lobata, Melastoma malabathricum, Chromolaena odorata, Lantana camara, Digitaria sanguinalis, and Paspalum distichum, and the forest coverage is more than 75% [41].

2.2. Litter and Soil Samples Collection

In mid-January 2021, field sampling from the four forest types was conducted. Three 10 m × 40 m plots were established within each forest type, located in areas away from the road and relatively free from human disturbance. Each plot was selected following the methodology for field long-term observation of forest ecosystem, the National Standards of the People’s Republic of China (GB/T 33027-2016). At each plot, we measured the tree height, the trunk diameter at breast height (1.3 m), and the canopy density. The basic information of the sampling plots is summarized in Table 1.
Within each forest type, we randomly selected five 0.5 m × 0.5 m quadrats for litter sampling. Intact litter layers were collected, and the semi-decomposed litter (SL layer) and undecomposed litter (UL layer) were graded and bagged separately following the method described in the National Standards. A total of 120 litter bags (2 litter layers × 5 random quadrats × 3 plots × 4 species) were collected. Around each quadrat, we randomly selected four points to measure the average thickness of the SL and UL layers representing that quadrat. The thickness of the total litter layer, as well as its SL and UL layer components, was recorded. The soil samples were collected at depths of 0 to 10 cm, 10 to 20 cm, 20 to 40 cm, and 40 to 60 cm soil layers from soil profiles using the cutting ring (100 cm3) method. Three soil profiles were randomly selected for each standard sample plot and soil was extracted from each layer with two cutting rings. A total of 288 soil samples (4 forest types × 3 plots × 3 soil profiles × 4 soil layers × 2 cutting rings) were collected.

2.3. Laboratory Analyses

The mass of fresh litter was determined after the litter samples were brought back to the laboratory, and the litter was left to air-dry in the lab. The amount of litter mass (m0) was determined by oven-drying samples at 75 °C [5]. The water-holding capacity of the litter was evaluated via the indoor water soaking method [28,37], where the litter was soaked in water for a predetermined time (0.25, 0.5, 1, 2, 4, 6, 8, 12, or 24 h). The percentage of water held in the litter samples after soaking was calculated as the water absorption rate. The amount and the percentage of water-holding during a 24 h soaking period were considered the maximum water-holding capacity of the litter (Rm) and calculated as follows [28,37]:
Ri = (mim0)/m0 × 100
where Ri is the water-holding capacity of the litter at the immersion time i (i = 0.25, 0.5, 1, 2, 4, 6, 8, 12, or 24 h), m0 is the dry litter mass, and mi is the litter mass at the immersion time i after free drainage.
R0 = (mfm0)/m0 × 100
Here, R0 is the water-holding capacity of the litter under ambient conditions (%), m0 is the dry litter mass, and mf is the fresh litter mass.
Rm = (m24m0)/m0 × 100
Here, Rm is the maximum water-holding capacity of the litter (%), m0 is the dry litter mass, and m24 is the litter mass soaked for 24 h after free drainage. The Rm was defined as the maximum levels of the respective parameters relative to the amount and the percentage of water-holding during a 24 h soaking period [28,37].
The litter effective water-retention capacity and maximum water-retention capacity were calculated as follows [28,37,47]:
Weff = (0.85RmR0)M
Wmax = (RmR0)M
where Weff and Wmax are the effective water-retention capacity (t·ha−1) and maximum water-retention capacity (t·ha−1), respectively; M is the unit litter mass (t·ha−1).
Soil samples were brought back to the laboratory to determine physical properties of the soil. The oven-drying method was used to determine the soil water content. The cutting ring method was used to determine the soil bulk density, capillary porosity, and total porosity [30,50,51]. The oil water-holding capacity in different vegetation restoration types was calculated using the following equation:
S = 10,000 × hp
where S is the water-holding capacity (t·ha−1), h is the depth of soil layer (m), and p is the non-capillary porosity (%).

2.4. Comprehensive Evaluation of Water Conservation Capacity

To compare the hydrological properties of the different forest types more intuitively, we quantified the factors of the hydrological properties of the soil layer and litter layer using the entropy weight method (EWM). This was calculated under a standard system, and then we comprehensively evaluated the water conservation capacity. Based on the EWM, the calculation procedures were conducted via the following steps [30,33,52]:
Step 1. Construct decision matrix.
The set of evaluation indicators and objects are defined as I = (I1, I2, I3,···, In), and O = (O1, O2, O3,···, Om), respectively. The evaluation state value of each object set Oi against the indicator set Ii is expressed as xij (i = 1,2, ···, m; j = 1,2, ···, n). Thus, the decision matrix X of original data can be expressed as
X = ( x 11 x 1 n x m 1 x m n )
Step 2. Raw data standardization.
The original data matrix was normalized. For the indicator, the larger the value, the better:
r i j = x i j min ( x i j ) max ( x i j ) min ( x i j )
By contrast, the smaller the value, the better:
r i j = max ( x i j ) x i j max ( x i j ) min ( x i j )
where rij is the normalized value of xij. xij is the value of the j-th indicator on the i-th object. Max(xij) and min(xij) are the maximum and minimum values of the j-th indicator, respectively.
Step 3. Calculate the feature weight.
The feature weight of the j-th indicator of the i-th object is pij, defined as
p i j = r i j i = 1 m r i j
where pij is the feature weight of the j-th indicator of the i-th object.
Step 4. Calculate the entropy:
e j = 1 ln   m   i = 1 m p i j ln p i j
where pij = 0, pij ln pij is defined as 0. ej is the entropy of the j-th indicator of the i-th object.
Step 5. Calculate the weight parameters.
As a result, the weight parameters are calculated as follows:
W i = 1 e j n j = 1 n e j
where Wi is the weight parameters of the j-th indicator of the i-th object.
Step 6. Calculate the water conservation capacity.
The water conservation capacity was calculated as follows [30,33]:
W C C I = I = 1 m W i   r i j
where WCCI is the water conservation capacity index.

2.5. Statistical Analysis

The differences in the hydrological properties of the litter layer and soil layer were analyzed using a one-way analysis of variance (ANOVA). The least significant differences (LSD) were determined for multiple comparisons. The significance level was set at p < 0.05. The above analyses were completed with SPSS v. 18.0 (SPSS Inc., Chicago, IL, USA). Origin 2021 software (Origin, Origin Lab, Farmington, ME, USA) was used to plot the figures.

3. Results

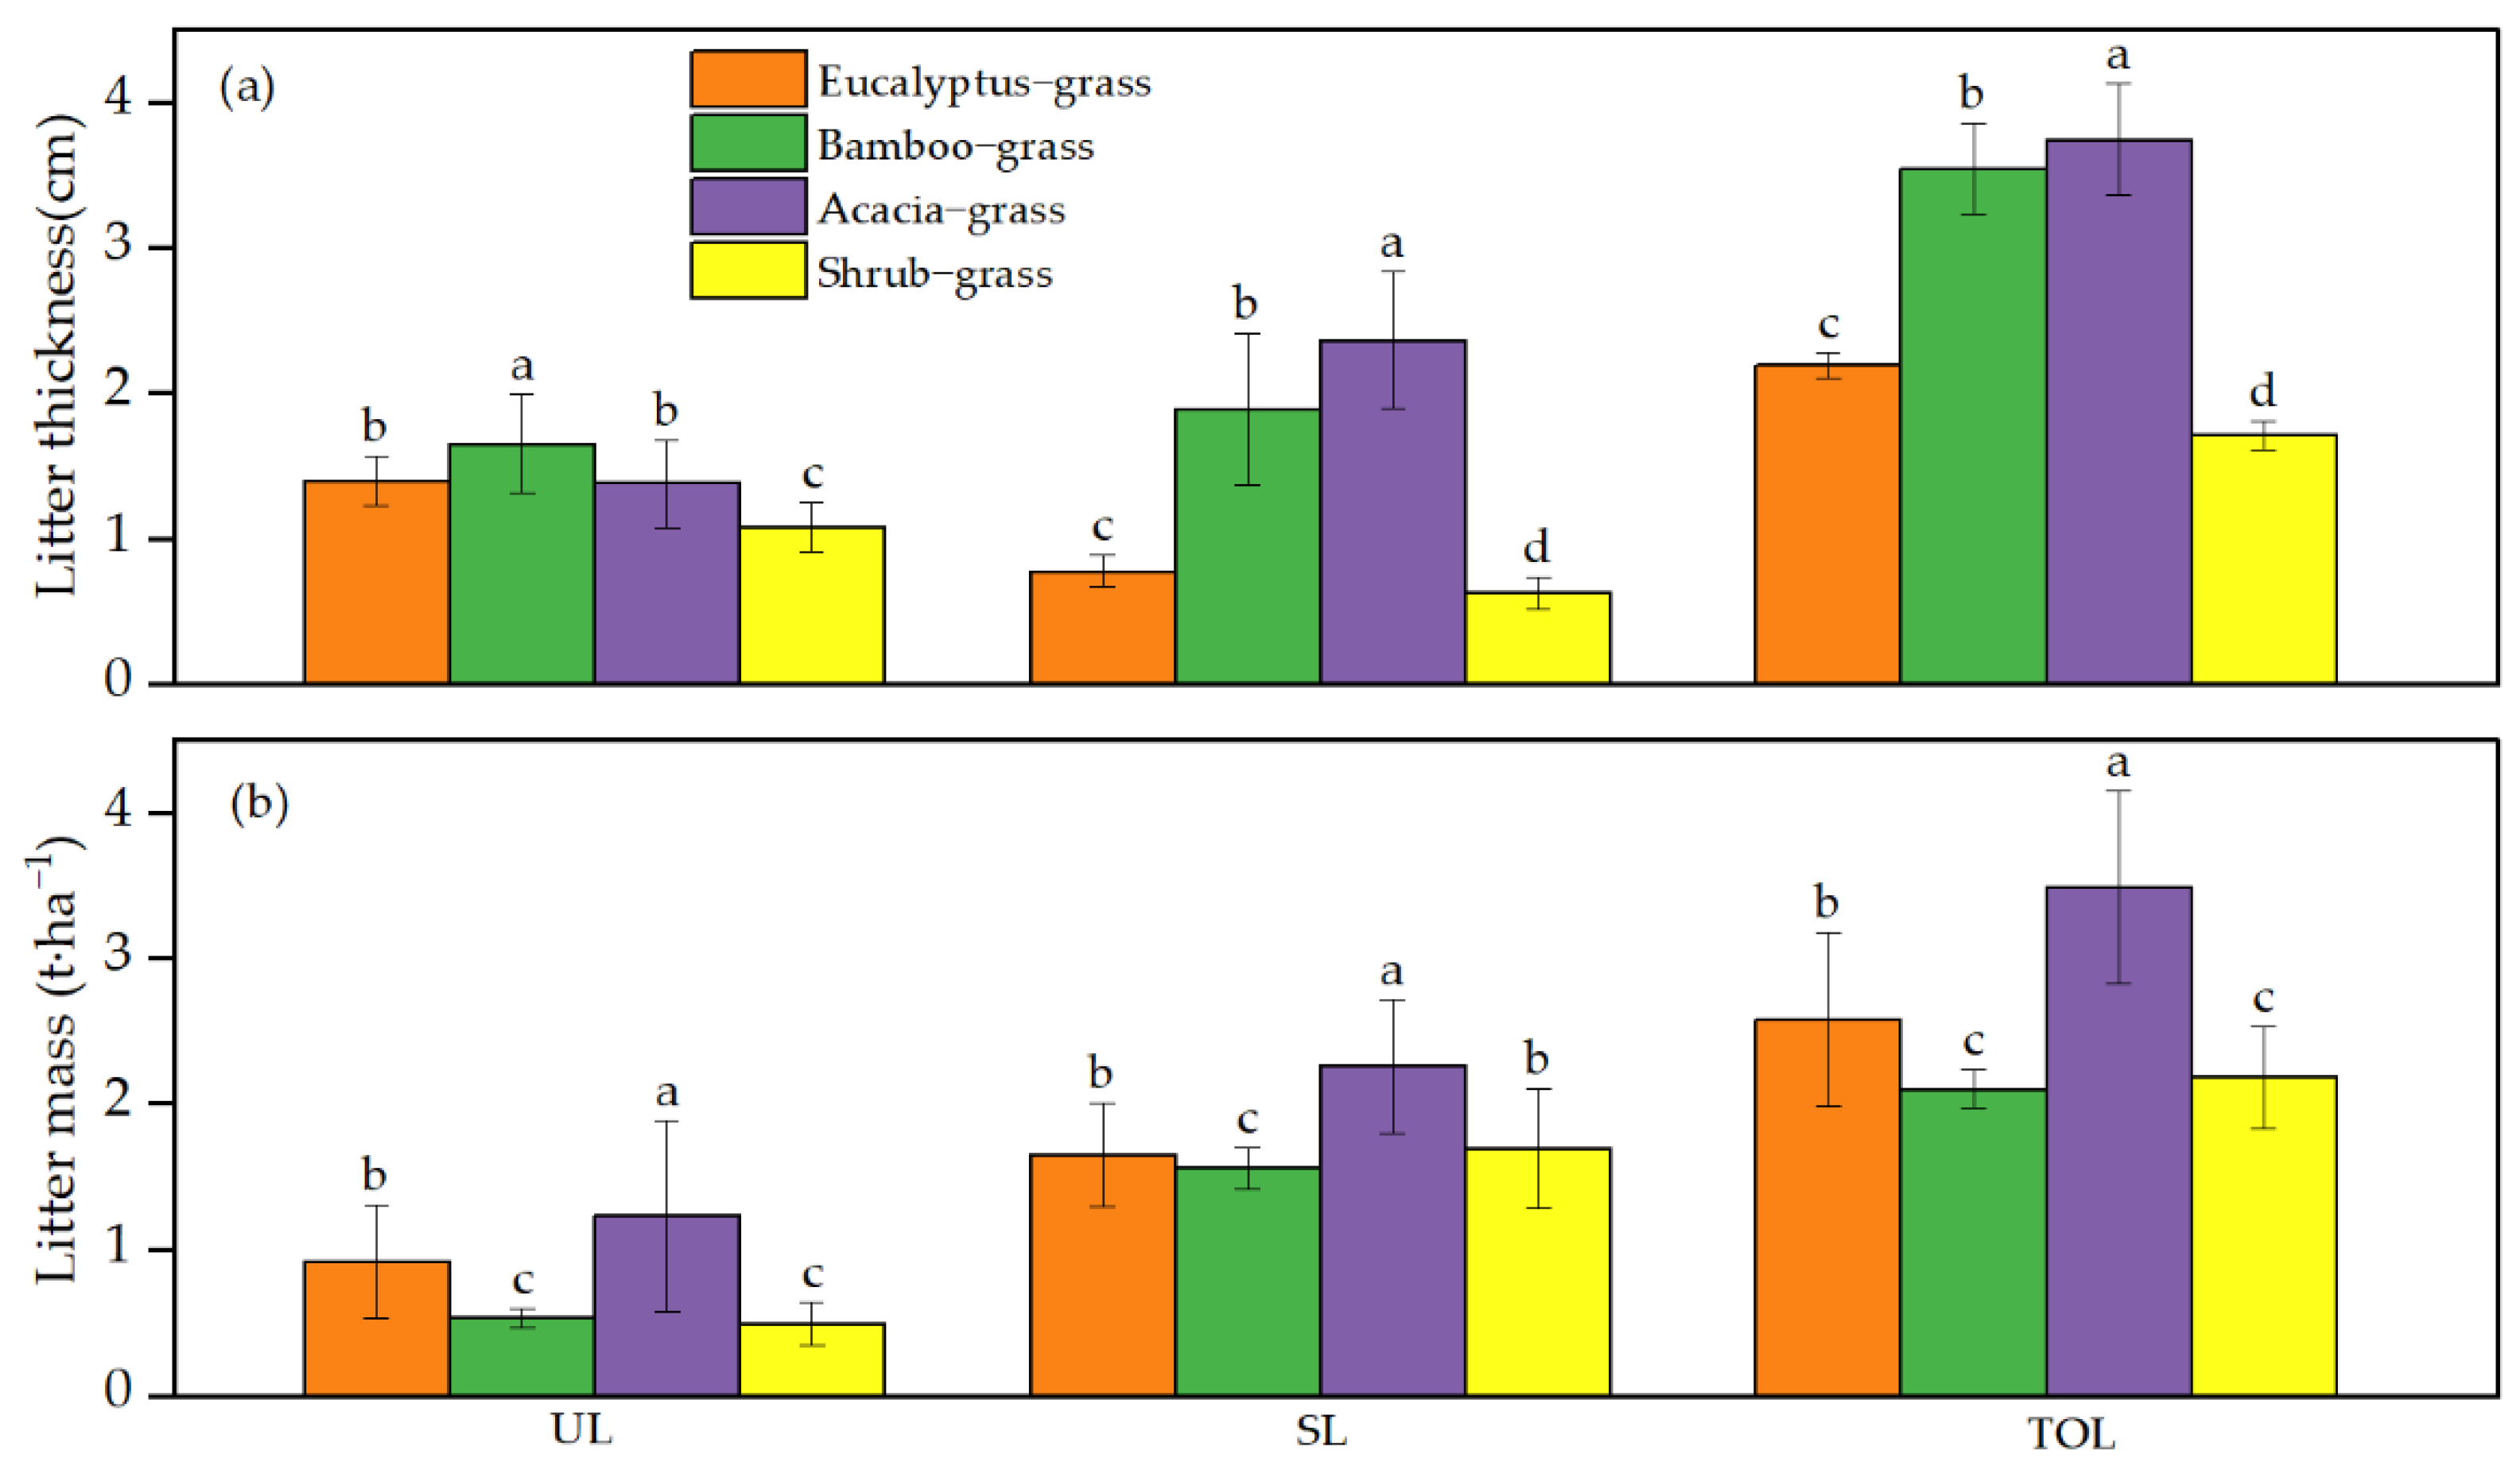
3.1. Litter Thickness and Mass

Significant differences in the total litter thickness among the different forest types (p < 0.001) were found and are shown in Table 2. The litter thickness of the UL layer and SL layer differed significantly among the four forest types (p < 0.05), and these differences were dependent on the forest types (p < 0.001). The total litter thickness was the greatest in the acacia–grass forest (3.74 ± 0.38 cm), followed by the bamboo–grass forest (3.54 ± 0.31 cm), eucalyptus–grass forest (2.19 ± 0.09 cm), and shrub–grass forest (1.71 ± 0.10 cm). The same pattern was found for the SL layer thickness (Figure 2a). The bamboo–grass forest had the greatest SL thickness, followed by the eucalyptus–grass forest, acacia–grass forest, and shrub–grass forest. The thickness of the SL layers in the bamboo–grass forest and acacia–grass forest was larger than the thickness of their UL layers, but the SL layers of the eucalyptus–grass forest and shrub–grass forest were lower than the thickness of their UL layers (p < 0.05).
Significant differences were observed in the litter mass among the different forest types and litter layers (p < 0.001) (Table 2). The acacia–grass forest had the highest total litter mass (3.49 ± 0.66 t·ha−1), which was significantly higher than the eucalyptus–grass forest (2.58 ± 0.60 t·ha−1), shrub–grass forest (2.18 ± 0.35 t·ha−1), and bamboo–grass forest (2.10 ± 0.13 t·ha−1) (p < 0.001) (Figure 2b). The litter mass of the SL layer was larger than the UL layer in all four forest types (p < 0.05) (Figure 2b). The litter mass of the SL layer was 2.26 ± 0.46 t·ha−1 for the acacia–grass forest, which was higher than the masses of the shrub–grass forest (1.69 ± 0.41 t·ha−1), eucalyptus–grass forest (1.65 ± 0.36 t·ha−1), and bamboo–grass (1.56 ± 0.14 t·ha−1) (p < 0.001). There were significant differences in the mass of the UL layer, which decreased in the order of acacia–grass > eucalyptus–grass > bamboo–grass > shrub–grass (p < 0.001). The SL litter mass accounted for 64.97% ± 9.53% of the total litter mass in the eucalyptus–grass forest, 74.42% ± 3.61% in the bamboo–grass forest, 66.38% ± 14.18% in the acacia–grass forest, and 76.77% ± 8.07% in the shrub–grass forest.

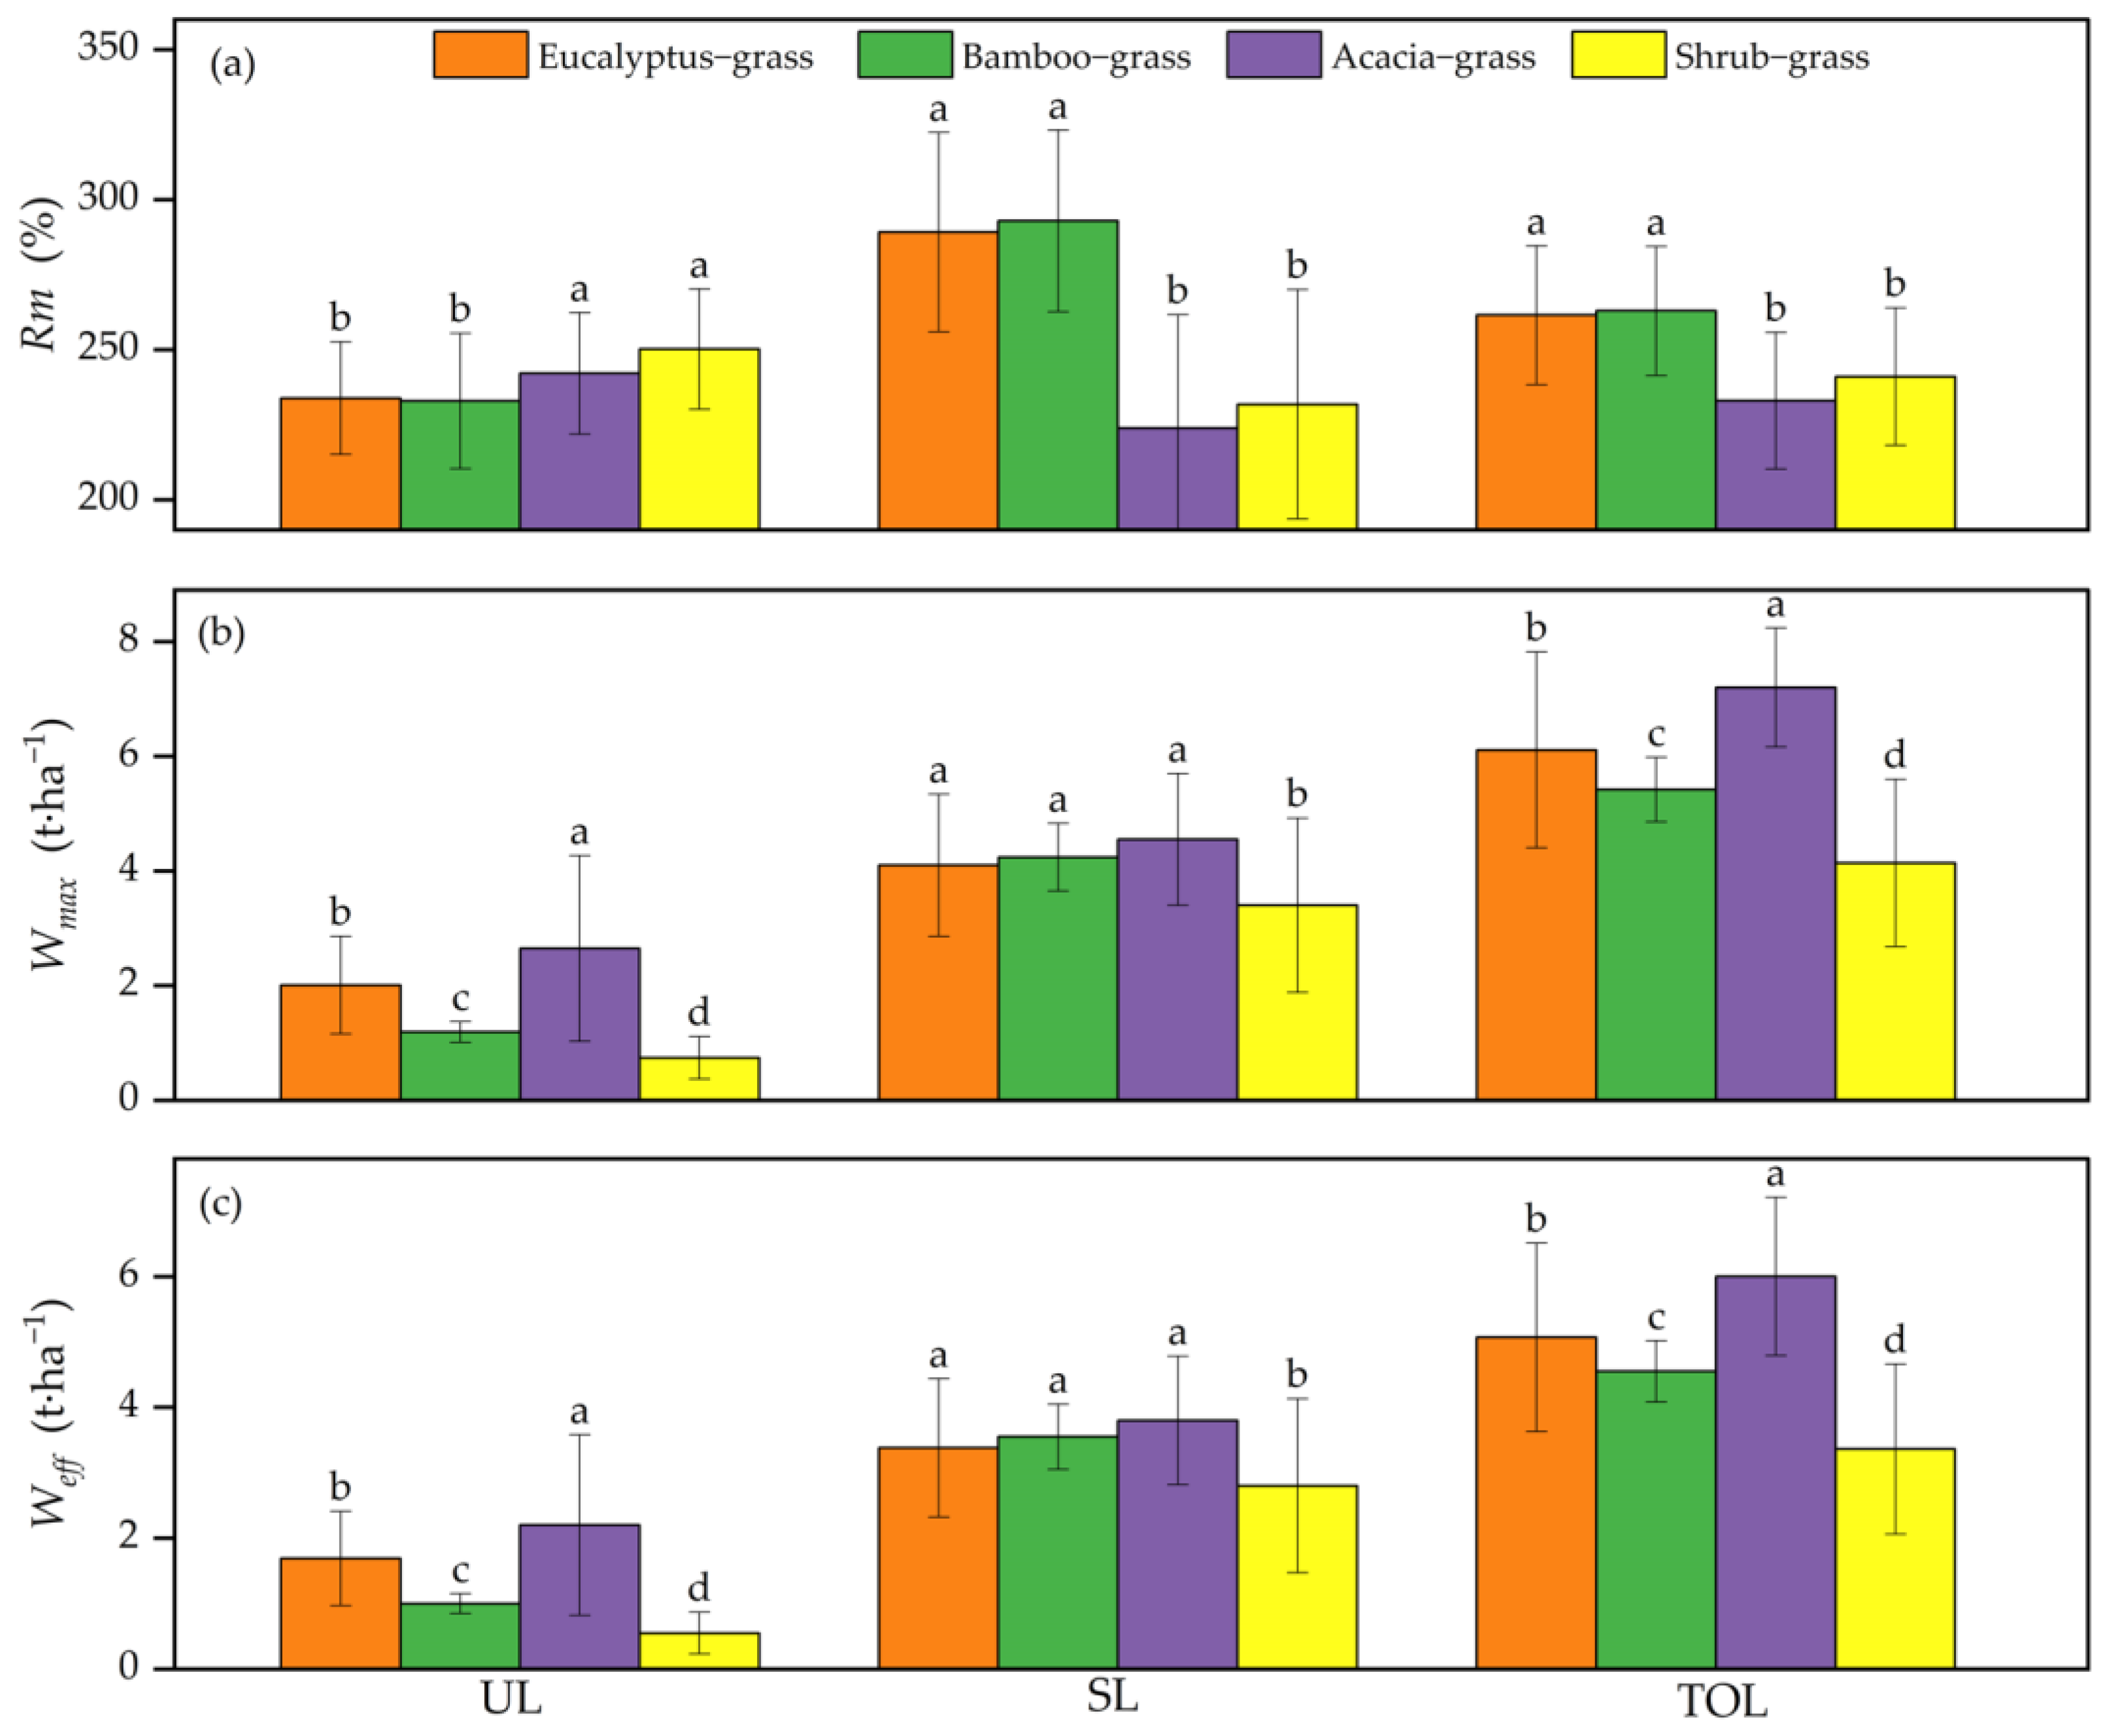
3.2. Rm, Weff, and Wmax

The Rm in the SL layer was 292.88% ± 30.24% for the bamboo–grass forest and was not significantly different from the eucalyptus–grass forest (289.17% ± 33.21%). However, both were significantly greater than the acacia–grass forest (223.88% ± 37.78%) and shrub–grass forest (231.84% ± 38.20%) (p < 0.05) (Figure 3a). The Rm of the UL layer ranged from 232.94% ± 22.57% to 250.22% ± 20.05%, and no significant difference was found between the eucalyptus–grass forest and the bamboo–grass forest or between the acacia–grass forest and the shrub–grass forest (p > 0.05). The Rm of the bamboo–grass forest was 262.91% ± 21.46%, which is roughly equivalent to that of the eucalyptus–grass forest (261.51% ± 23.13%); both stands were significantly higher than those of the shrub-grass forest (241.03% ± 22.94%) and acacia-grass forest (232.95% ± 22.77%) (p < 0.05). The Rm of the SL layer was larger than that of the UL layer in the bamboo–grass forest and eucalyptus–grass forest, but the opposite trend was observed for the acacia–grass forest and shrub–grass forest.
The Wmax differed significantly among the forest types (p < 0.05). The Wmax of the acacia–grass forest was 7.20 ± 1.04 t·ha−1, significantly greater than that of the eucalyptus–grass forest (6.11 ± 1.71 t·ha−1), and higher than those of the bamboo–grass forest (5.42 ± 0.56 t·ha−1) and shrub-grass forest (4.14 ± 1.46 t·ha−1) (p < 0.05) (Figure 3b). The Wmax of the SL layer was 4.65 ± 1.15 t·ha−1 for the acacia–grass forest, 4.24 ± 0.59 t·ha−1 for the bamboo–grass forest, and 4.10 ± 1.24 t·ha−1 for the eucalyptus–grass forest and was not observed to be significantly different. However, for all these vegetation restoration types, they were significantly larger than that for the shrub-grass forest (3.40 ± 1.52 t·ha−1) (p < 0.05). Moreover, the Wmax of the UL layer decreased in the following order: acacia–grass forest > eucalyptus–grass forest > bamboo–grass forest > shrub–grass forest (p < 0.05), ranging from 0.74 ± 0.37 t·ha−1 to 2.65 ± 1.62 t·ha−1. The Wmax of the SL layer was larger than the Wmax of the UL layer in the four forest types (p < 0.05).
The Weff was similar to the Wmax. The Weff significantly differed among the four forest types (p < 0.05). The Weff of the acacia–grass forest was 6.00 ± 1.21 t·ha−1, which was higher than the 5.07 ± 1.10 t·ha−1 of the eucalyptus–grass forest, the 4.55 ± 0.47 t·ha−1 of the bamboo–grass forest, and the 3.36 ± 1.30 t·ha−1 of the shrub–grass forest (p < 0.05) (Figure 3c). The acacia–grass forest had the greatest interception capacity (note that 1 mm of precipitation is equivalent to 1 t·ha−1), which was equal to a 6.00 mm depth equivalent of rainfall, with 5.07 mm in the eucalyptus–grass forest, 4.55 mm in the bamboo–grass forest, and 3.36 mm in the shrub–grass forest. The SL layer Weff did not differ significantly among the acacia–grass forest (3.80 ± 0.98 t·ha−1), eucalyptus–grass forest (3.38 ± 1.06 t·ha−1), and bamboo–grass forest (3.55 ± 0.50 t·ha−1) (p > 0.05), but all were significantly higher than the 2.80 ± 1.33 t·ha−1 observed for the shrub–grass forest (p < 0.05). The UL layer Weff significantly decreased in the following order: acacia–grass forest > eucalyptus–grass > bamboo–grass forest > shrub–grass forest (p < 0.05) and ranged from 0.55 ± 0.32 t·ha−1 to 2.20 ± 1.38 t·ha−1. The SL layer Weff was greater than the UL layer Weff among the four forest types (p < 0.05).

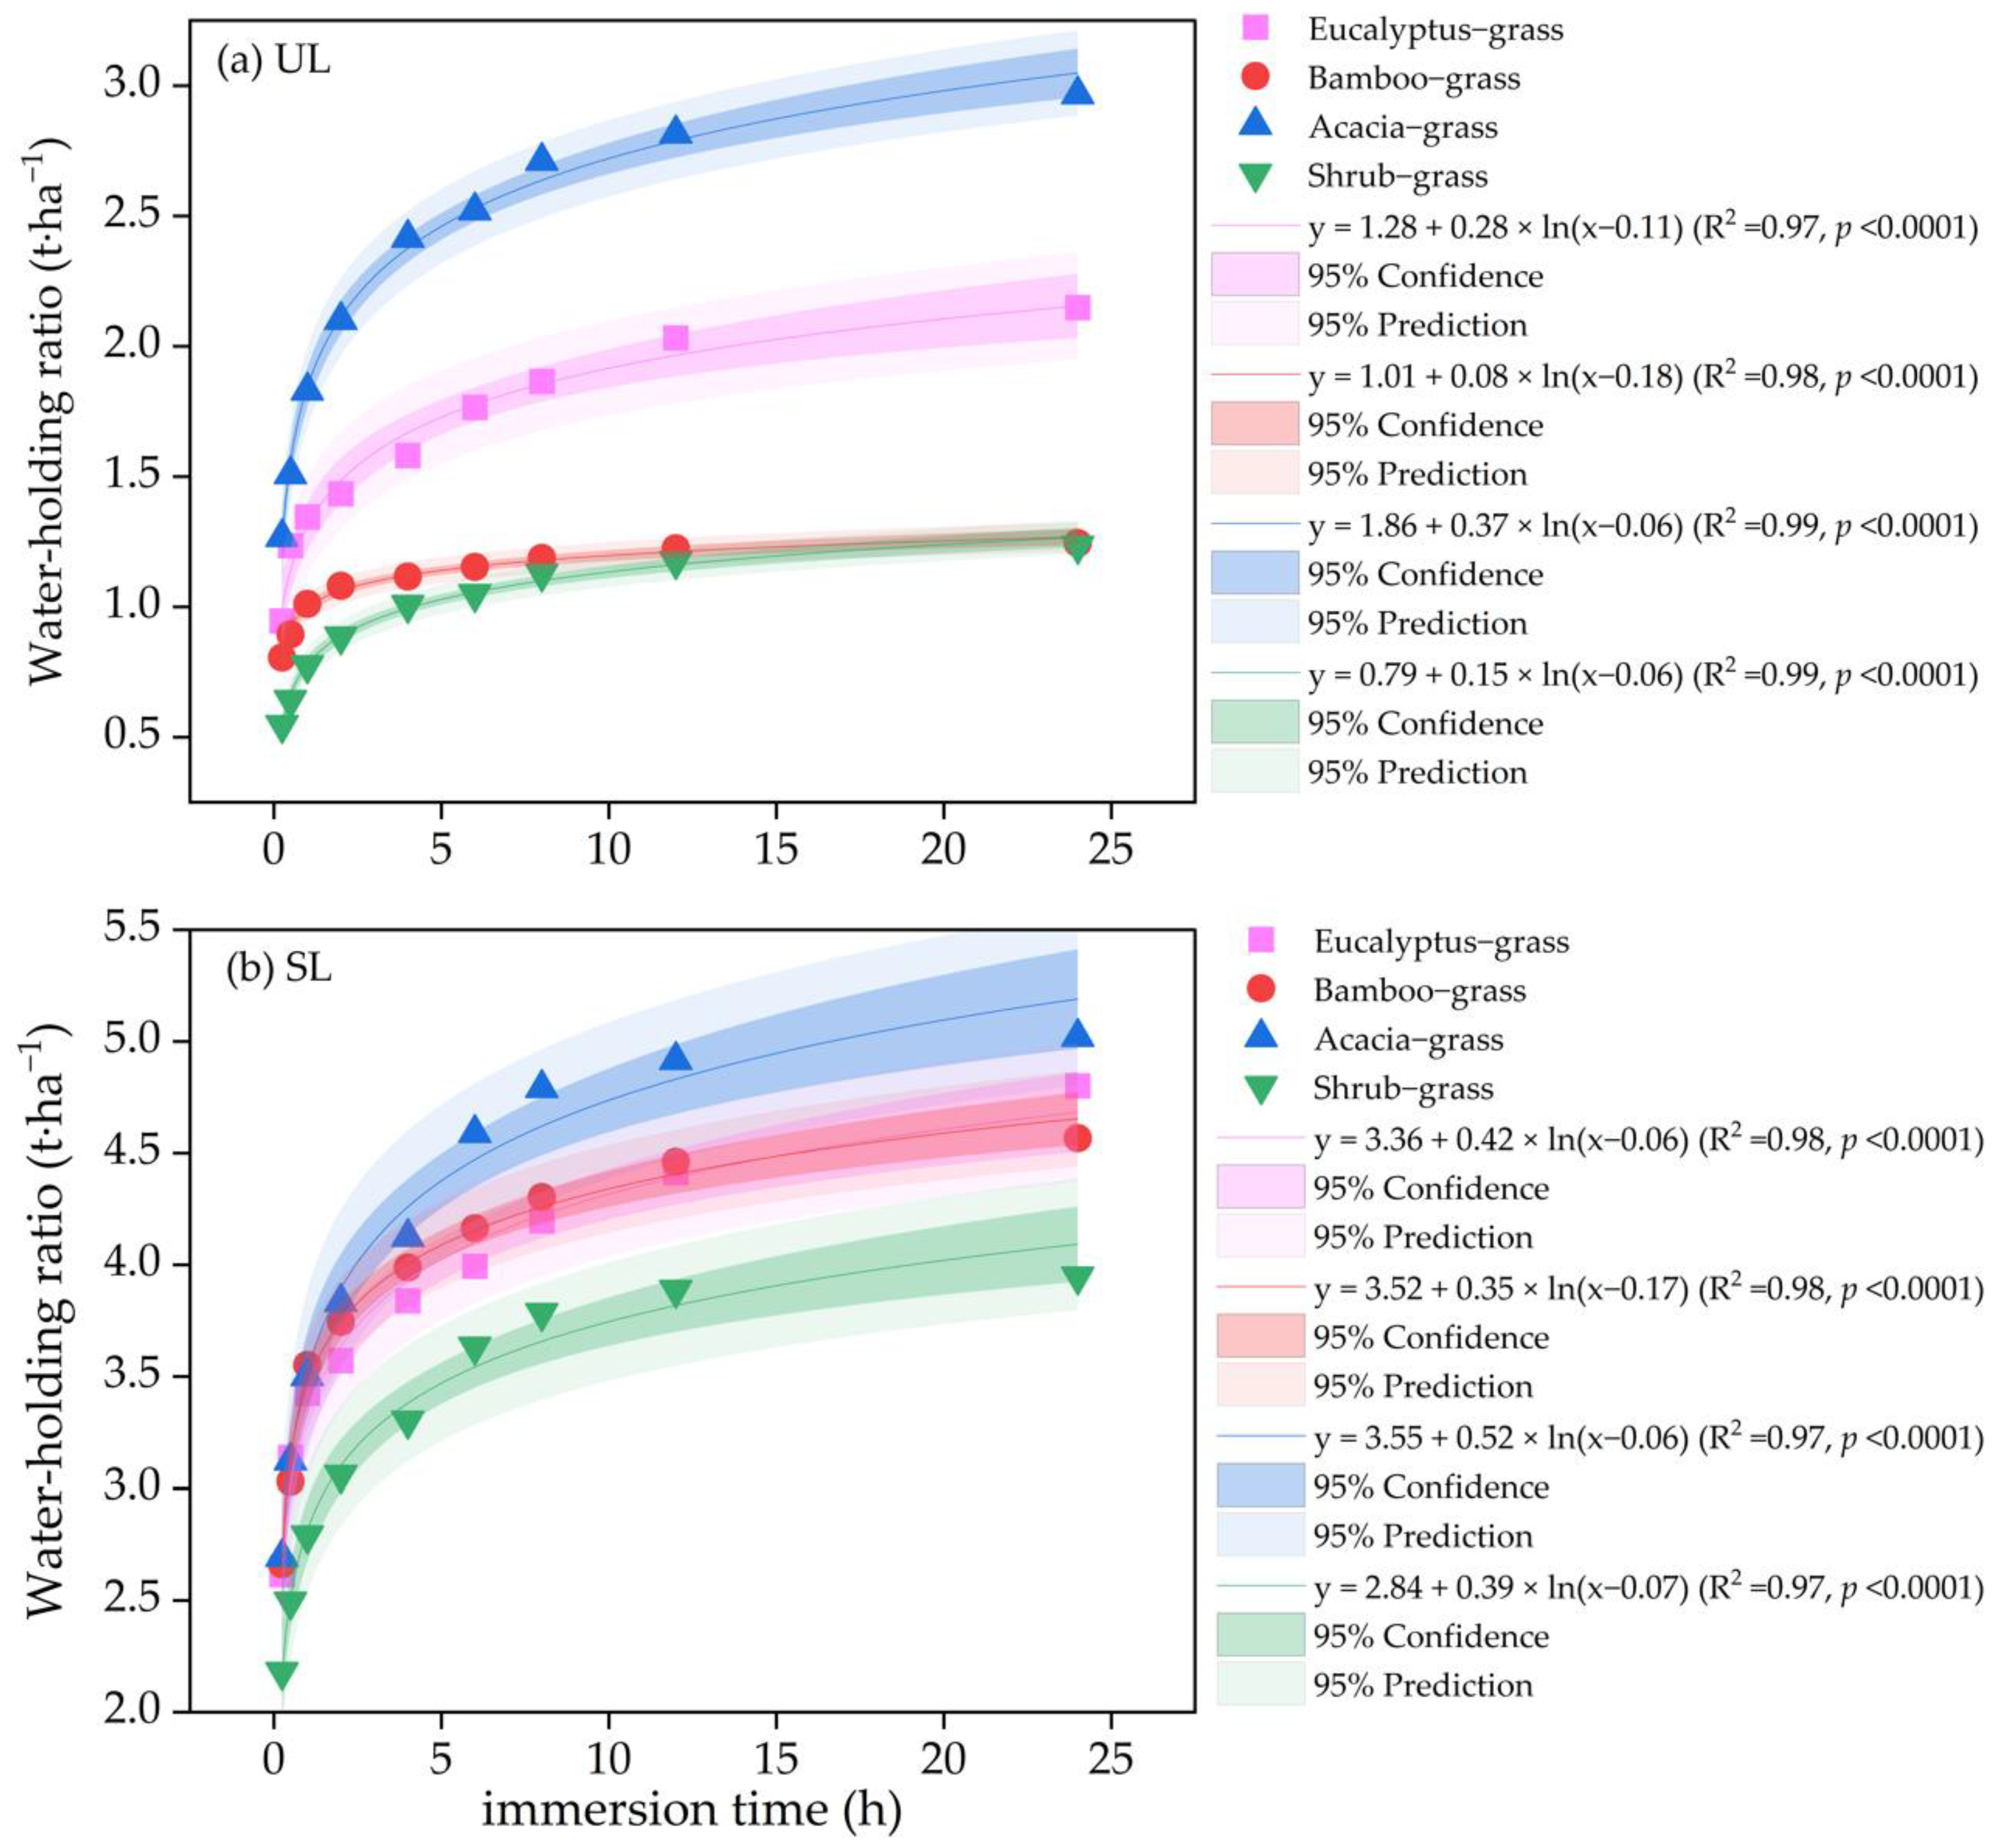
3.3. Variations in Water-Holding Capacity of Litter

The water-holding capacity varied among the forest types. The water-holding ratio increased with increasing immersion time. The water-holding ratio of the SL layer litter was relatively higher than that of the UL layer at the same immersion time. After 0.25 h of water immersion, the water-holding ratio of the UL and SL layers reached 0.94 ± 0.40 and 2.62 ± 0.84 t·ha−1, respectively, for the eucalyptus–grass forest, 0.80 ± 0.16 and 2.66 ± 0.51 t·ha−1 for the bamboo–grass forest, 1.26 ± 0.67 and 2.69 ± 0.77 t·ha−1 for the acacia–grass forest, and 0.54 ± 0.16 and 2.17 ± 0.77 t·ha−1 for the shrub–grass forest (Figure 4). The water-holding ratio slowly increased after two hours of water immersion and the UL and SL layers in the acacia–grass forest were higher than those in the other forest types (Figure 4). A logarithmic relationship was fitted between the water-holding ratio and the immersion times for both litter types of all four forest types.

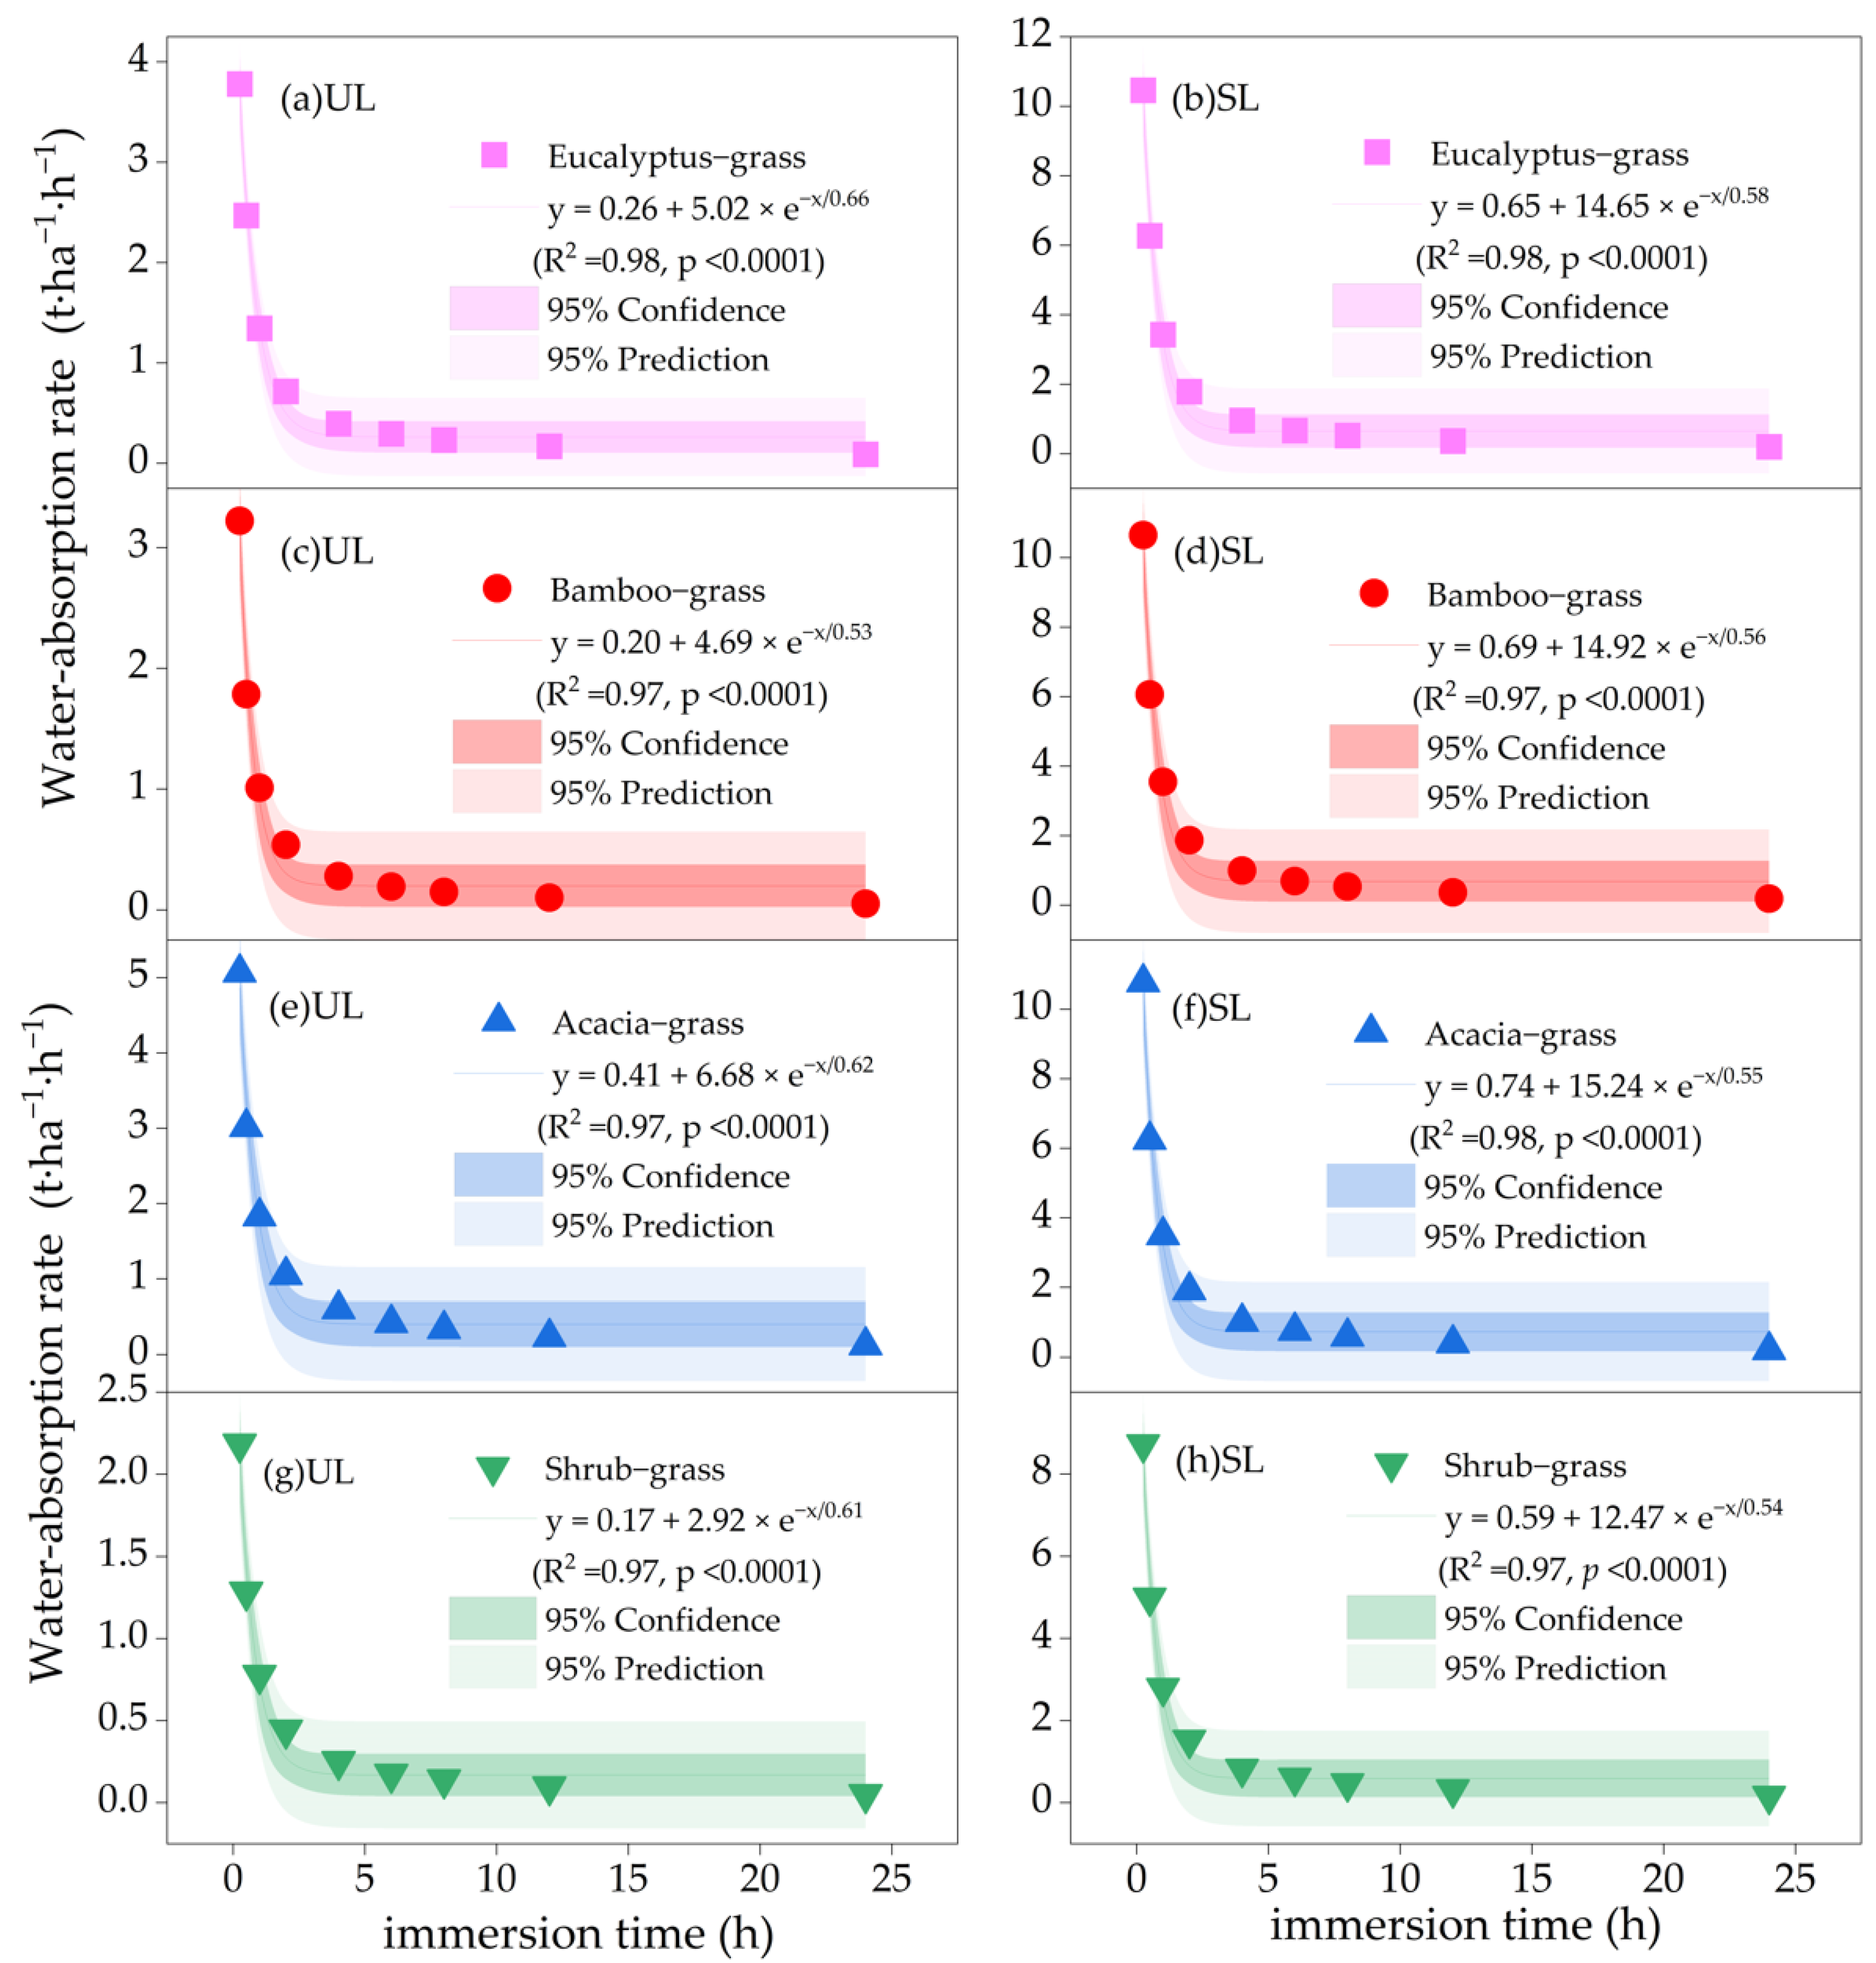
3.4. Variations in Litter Water Absorption Rate

The water absorption rate was greatest at the beginning of the experiment and declined rapidly in the first 2 h. The water absorption rate of the SL layer was larger than the UL layer at the same immersion time, and the rate slowed until 12 h (Figure 5). With similar immersion times, a significant difference was observed in the water absorption rates among the forest types. The water absorption rate of the acacia–grass forest was larger than those of the eucalyptus–grass forest, bamboo–grass forest, and shrub–grass forest. After the first hour, the water absorption rates of the SL layer were 3.42 ± 0.55 t·ha−1·h−1, 3.55 ± 0.17 t·ha−1·h−1, 3.50 ± 0.98 t·ha−1·h−1, and 2.79 ± 0.25 t·ha−1·h−1 for the eucalyptus–grass, bamboo–grass, acacia–grass, and shrub–grass forests, respectively (Figure 5b,d,f,h). Additionally, the water absorption rates of the UL layer were 1.34 ± 0.83 t·ha−1·h−1, 1.02 ± 0.51 t·ha−1·h−1, 1.83 ± 0.65 t·ha−1·h−1, and 0.78 ± 0.25 t·ha−1·h−1 for the eucalyptus–grass, bamboo–grass, acacia–grass, and shrub–grass forests, respectively (Figure 5a,c,e,g). An exponential relationship was observed between the water absorption rate and the immersion time in both types of litter in the four forest types.

3.5. Variations in Soil Water-Holding Capacity

The soil bulk density increased with the soil depth in all forest types. The total porosity of the soil gradually decreased with increasing soil depth in all stands. No significant differences were observed for the soil bulk density or total porosity among the forest types (p > 0.05) (Table 3). At the 0 to 60 cm soil layer, the eucalyptus–grass forest had the highest soil bulk density (1.54 ± 0.08 g·cm−3), followed by the shrub–grass forest, bamboo–grass forest, and acacia–grass forest (1.46 ± 0.05 g·cm−3) (Table 3). The soil porosity did not significantly differ among the forest types. The non-capillary porosity was (5.13 ± 0.60)%, (4.36 ± 0.27)%, (3.99 ± 0.59)%, and (3.95 ± 0.99)% for the acacia–grass forest, eucalyptus–grass forest, shrub–grass forest, and bamboo–grass forest, respectively. The capillary porosity was (32.00 ± 1.15)%, (30.87 ± 5.21)%, (29.04 ± 4.66)%, and (28.06 ± 1.00)% for the acacia–grass forest, bamboo–grass forest, eucalyptus–grass forest, and shrub–grass forest, respectively. The total soil porosity was (37.13 ± 1.51)%, (34.82 ± 5.94)%, (33.41 ± 4.79)%, and (32.06 ± 1.35)% for the acacia–grass forest, bamboo–grass forest, eucalyptus–grass forest, and shrub–grass forest, respectively(Table 3). Additionally, at the 0 to 60 cm soil layer depth, the soil water-holding capacity was highest in the acacia–grass forest (301.76 t·ha−1), followed by the eucalyptus–grass forest (263.53 t·ha−1) and then the shrub–grass forest (233.58 t·ha−1), and the bamboo–grass forest had the lowest value (220.78 t·ha−1) (Table 3).

3.6. Comprehensive Evaluation of Water Conservation Capacity

The water conservation capacities of the four forest types were evaluated via EWM. The indexes of the litter layer (litter thickness, litter mass, Rm, Weff, and Wmax) and soil layer (bulk density, capillary porosity, non-capillary porosity, total porosity, soil water-holding capacity) were selected based on the principles of scientific hierarchy. The weighted value of each index was calculated, and they ranged from 0.0770 to 0.1579 (Table 4).
The comprehensive evaluation value of the water conservation capacity of each forest type was calculated by combining the weight and the normalized index of each index. The WCCI was significantly the highest in the acacia–grass forest (0.5257), followed by the eucalyptus–grass forest (0.2310), bamboo–grass forest (0.1941), and shrub–grass forest, which had the lowest water conservation capacity (0.0492) (Table 5).

4. Discussion

Broad-leaved trees as the dominant species in forest ecosystems significantly increase the interception capacity of rainfall [40]. A thick litter layer may be conducive to water retention in shallow soil [10,28,34], which is due to a reduction in evaporation from the surface soil [26,27]. The total litter thickness varied from 1.71 to 3.74 cm in this study and was the highest in the acacia–grass forest, suggesting that acacia–grass forest greatly reduces evaporation compared to other forests. This result may be attributed to the A. mangium tree having a larger leaf area. The lengths and widths of the leaves in the four forests are different; the leaves of A. mangium are 10.0–25.0 cm long and 5.0–10.0 mm wide, the leaves of B. oldhamii are 12.0–30.0 cm long and 2.5–5.0 mm wide, the leaves of E. robusta are 8.0–17.0 cm long and 2.5–6.0 mm wide, and the leaves of B. oldhamii are 4.0–10.0 cm long and 3.5–8.0 mm wide. The litter thickness of the SL layer of the acacia–grass and bamboo–grass forests was higher than the thickness of the UL, but the eucalyptus–grass and shrub–grass forests demonstrated the opposite. This suggests that the litter of H. brasiliensis, M. candidum, and U. lobata decomposes more easily than that of A. mangium and B. oldhamii under field conditions. Previous studies have reported a decreased thickness of the SL litter when compared to the UL litter in broad-leaved forests [37,41]. Additionally, significant differences in the litter mass among the forest types and litter layers were found, and it was exceptionally larger in the acacia–grass forest. This indicates that acacia–grass forest is conducive to rainfall interception. The litter mass in the SL layer accounted for 64.97%~76.77% of the total litter mass, which was greater than the UL layer, and aligns with the previous reports [28,37,47]. However, more rainfall interception by acacia–grass litter may evaporate back into the atmosphere [40,42,53]. Therefore, long-term monitoring is needed to determine the net effect of the litter on the forest’s surface water flux.
The Rm defines the effectiveness per unit of mass litter in retaining water [28,32,47]. Forest ecosystems differ in terms of their water-holding capacity due to the variations in their litter coverage and litter decomposition rates [10,36,53,54]. In this study, the eucalyptus–grass and bamboo–grass stands demonstrated a higher Rm than the acacia–grass and shrub–grass stands. This difference in hydrological properties could be explained by the differences in the physical and chemical properties of the litter composition, such as the leaves, dead branches, and seeds. Moreover, this difference could be explained by the litter defoliation period since the litter components of acacia–grass and shrub–grass have thicker cuticles than eucalyptus–grass and bamboo–grass. In addition, we found that the Rm of the SL layer in the eucalyptus–grass and bamboo–grass forest was larger than that of the UL layer. The opposite was true in the acacia–grass and shrub–grass forests. Our results show that eucalyptus–grass and bamboo–grass had a higher degree of fragmentation and fewer dead branches in general [27,47]. These results align with Li et al. [37] in 2015 and Chen et al. [28] in 2018. Further investigations focusing on litter decomposition rates and processes are needed to better understand the differences among different vegetation types.
Wmax is a measure of rainfall absorption and, thus, a decrease in runoff [37], which is dependent on the litter water content under ambient conditions, the litter mass, and the nature of rainfall [42,55]. Our study shows that the Wmax of the acacia–grass forest was greater than those of the other forest types. These results could be explained by the larger litter mass of the acacia–grass forest being more effective than the other forest types. This is consistent with the previous studies that have shown that the Wmax depends on the litter storage [28,34,36]. Dong et al. [56] reported that the Wmax of A. mangium was larger than that of E. robusta. Additionally, we found that the Wmax of the SL layer was greater than the UL due to a larger litter mass and a more effective SL layer. Zhou et al. [47] and Chen et al. [28] have reported a higher water-retention capacity of the SL litter layer compared to the UL litter layer. In contrast, Li et al. [37] reported that the maximum water-retention capacity of the SL litter layer was lower than that of the UL litter layer. A comprehensive investigation into the litter characteristics across different forest ecosystems in different climate regions is needed.
The Weff defines the effective interception of precipitation by litter, which is an important hydrological property that can be used to consistently evaluate the potential to absorb rainfall and reduce surface runoff [31,37,53]. The Weff is also affected by the water content of litter, litter storage, and the nature of rainfall [27,40,45]. In this study, we found that the litter layer can theoretically intercept up to 6.00 mm of rainfall in the acacia–grass forest, 5.07 mm in the eucalyptus–grass forest, 4.55 mm in the bamboo–grass forest, and 3.36 mm in the shrub–grass forest. The results suggest that the acacia–grass forest had a higher capacity to minimize splash erosion and decrease runoff and had the greatest water-retention capacity, making it more effective at rainfall interception [26,29,57]. This is likely overestimated due to the large intact leaves of the litter layer [37]. Nevertheless, whether the Weff could be reached in situ during rainfall is unknown [28]. Therefore, the measured litter water content in situ should be further investigated to provide a more realistic evaluation of rainfall interception by litter.
The rapid water absorption rates of the SL land UL layers at the beginning of the experiment slowed down until 12 h and then were nearly unchanged. These results are likely explained by the drier litter having a lower matrix water potential in the first two hours after onset and becoming moist after 12 h. Previous studies have found the same trend in the litter water-holding ratio [28,30,33,56,57]. Additionally, the water-holding ratio of the SL layer was relatively larger than that of the UL layer. This may be attributed to the SL layer having a greater degree of fragmentation [10,37,53].
The soil layer of the forest ecosystem is a key component for water conservation. The water-holding capacity of the soil layer directly affects the surface runoff, soil subsurface flow, and groundwater recharge [30,37,44,56]. Variation in the hydro-physical properties of the soil layers indicates a likely dependence on the soil structure and pore space size [29]. In this study, our results show that the soil bulk density ranged from 1.46 g·cm−3 to 1.54 g·cm−3, and the total porosity ranged from 32.06% to 37.13%. The soil bulk density increased with increasing soil depth, while the total porosity gradually decreased. The results are consistent with the previous research [30,33,37]. Lower soil bulk density was associated with greater soil porosity and was responsible for increasing the water-holding capacity in the acacia–grass forest (301.76 t·ha−1). This was 1.37, 1.29, and 1.14-fold higher than that of the bamboo–grass, shrub–grass, and eucalyptus–grass forests, respectively. The higher soil total porosity in the acacia–grass forest may be attributed to the larger litter storage on the forest floor, which led to soil structural changes [17,56], improving the soil structure and porosity [30,33]. Further studies are needed to focus on the soil chemical properties for a better understanding of the hydrological properties of the soil layers, specifically, the soil organic matter, soil enzyme activities, and microbe communities among the different forest types.
We observed that the water storage capacity of the soil layer was larger than the litter layer, which is consistent with Bai et al. [30] in 2021 and Cheng et al. [33] in 2021. The WCCI was highest in the acacia–grass forest compared to the other forest types. From the perspective of the water conservation ecological service after vegetation restoration, our results suggest that the acacia–grass forest had a dense litter layer suitable for intercepting rainfall, reducing runoff, and buffering the impact of rainfall. Consequently, this improves the soil structure and size of the pore spaces in the soil layer, creating suitable conditions for infiltration and water holding in the soil, and thus reducing the loss of surface water [30,33,37,56]. Therefore, the vegetation restoration type of acacia–grass can improve the hydrological effects in the gully erosion area of latosol. In our study, we conducted experiments only under laboratory conditions. Further research should consider the climate and environmental factors affecting the hydrological properties of the litter and soil layer by way of in situ and long-term location investigation.

5. Conclusions

In the gully erosion area of latosol in the Mahuangling Watershed of Hainan province in China, we studied the hydrologic properties of the litter and soil layers in four restored plantation types. It was found that the litter thickness and litter mass in the acacia–grass forest were higher than those of the other forests. The effective water-retention capacity of the UL layer was relatively larger than that of the SL layer, especially in the acacia–grass forest, and is likely more effective for intercepting rainfall and reducing surface runoff. Lower soil bulk density was associated with greater porosity in the acacia–grass forest, which increases the soil water-holding capacity, thus reducing the loss of surface water. The comprehensive evaluation value of the water conservation capacity shows that the water storage capacity of the soil layer was larger than the litter layer. The WCCI in the acacia–grass forest was greater than in the other vegetation restoration types. This indicates that acacia–grass forest generally has favorable hydrological properties and plays an important role in water conservation during vegetation restoration. We suggest acacia–grass forest for restoration to mitigate soil erosion and improve hydrological effects in the gully erosion area of latosol in the future.

Author Contributions

Investigation, Z.T., S.C., D.R., Z.C., W.Z., Y.H. (Yujie Han), L.H., S.C., D.R., K.W. and Y.H. (Yanping Huang); methodology, Z.T.; software, Z.T.; validation, Z.T.; formal analysis, Z.T. and J.C.; data curation, Z.T. and S.C.; writing—original draft preparation, Z.T. and J.C.; writing—review and editing, Z.T. and J.C. All authors have read and agreed to the published version of the manuscript.

Funding

This research was funded by the National Natural Science Foundation of China, grant number 42267048; the Hainan Provincial Natural Science Foundation of China, grant numbers 420RC532 and 319QN159; the Scientific Research Fund of Hainan University, grant number KYQD(ZR)1950; and the Fund of Department of Water Resources of Hainan Province, grant numbers HD-KYH-2022350, HD-KYH-2022238, HD-KYH-2022017, and HD-KYH-2021062.

Institutional Review Board Statement

Not applicable.

Informed Consent Statement

Not applicable.

Data Availability Statement

The data that support the findings of this study are available from the corresponding author upon reasonable request.

Acknowledgments

We thank the reviewers and the editor for their valuable work and comments.

Conflicts of Interest

The authors declare no conflict of interest.

References

  1. Borrelli, P.; Robinson, D.A.; Fleischer, L.R.; Lugato, E.; Ballabio, C.; Alewell, C.; Meusburger, K.; Modugno, S.; Schütt, B.; Ferro, V. An assessment of the global impact of 21st century land use change on soil erosion. Nat. Commun. 2017, 8, 2013. [Google Scholar] [CrossRef]
  2. Xia, J.; Zhang, L.; Ge, P.; Lu, X.; Wei, Y.; Cai, C.; Wang, J. Structure degradation induced by wetting and drying cycles for the hilly granitic soils in collapsing gully erosion areas. Forests 2022, 13, 1426. [Google Scholar] [CrossRef]
  3. Zhang, L.; Xiao, T.; Liu, H.; Ge, P.; Xia, J.; Dai, C.; Zhang, W.; Zhao, X. Effects of AM fungi and grass strips on soil erosion characteristics in red sandstone erosion areas in Southern China. Forests 2022, 13, 1351. [Google Scholar] [CrossRef]
  4. Ahmad, N.N.S.B.; Mustafa, F.B.; Yusoff, S.Y.M.; Didams, G. A systematic review of soil erosion control practices on the agri-cultural land in Asia. Int. Soil Water Conserv. Res. 2020, 8, 103–115. [Google Scholar] [CrossRef]
  5. Li, N.; Zhang, Y.; Wang, T.W.; Li, J.W.; Yang, J.W.; Luo, M.Y. Have anthropogenic factors miti-gated or intensified soil erosion over the past three decades in South China? J. Environ. Manag. 2022, 302, 114093. [Google Scholar] [CrossRef]
  6. Liu, Z.; Tian, D.; Huang, Z.; Fu, Z.; Liu, J.; Hu, Y. Characteristics of soil and foliar N and P concentrations and stoichiometric ratio along restoration ages of Pinus massoniana plantations in red soils erosion regions of southern China. Chin. J. Appl. Environ. Biol. 2019, 25, 768–775. (In Chinese) [Google Scholar] [CrossRef]
  7. Zhu, P.; Zhang, Q.; Yang, W.; Zhao, J. Characteristics of soil ecological stoichiometry of different vegetation types in ephemeral gully of forestland in Red Soil Region. Res. Soil Water Conserv. 2020, 27, 60–65. (In Chinese) [Google Scholar] [CrossRef]
  8. Liang, Y.; Li, D.; Lu, X.; Xuan, Y.; Pan, X.; Mu, H.; Shi, D.; Zhang, B. Soil erosion changes over the past five decades in the red soil region of southern China. J. Mt. Sci.-Engl. 2010, 7, 92–99. [Google Scholar] [CrossRef]
  9. Mao, Y.T.; Hu, W.; Chau, H.W.; Lei, B.K.; Di, H.J.; Chen, A.Q.; Hou, M.T.; Whitley, S. Combined cultivation pattern reduces soil erosion and nutrient loss from sloping farmland on red soil in Southwestern China. Agronomy 2020, 10, 1071. [Google Scholar] [CrossRef]
  10. Pereira, L.C.; Balbinot, L.; Lima, M.T.; Bramorski, J.; Tonello, K.C. Aspects of forest restoration and hydrology: The hydrological function of litter. J. For. Res. 2022, 33, 543–552. [Google Scholar] [CrossRef]
  11. Crouzeilles, R.; Curran, M.; Ferreira, M.S.; Lindenmayer, D.B.; Grelle, C.E.V.; Rey Benayas, J.M. A global meta-analysis on the ecological drivers of forest restoration success. Nat. Commun. 2016, 7, 11666. [Google Scholar] [CrossRef] [PubMed]
  12. Bonner, M.T.L.; Herbohn, J.; Gregorio, N.; Pasa, A.; Avela, M.S.; Solano, C.; Moreno, M.O.M.; Almendras-Ferraren, A.; Wills, J.; Shoo, L.P.; et al. Soil organic carbon recovery in tropical tree plantations may depend on restoration of soil microbial composition and function. Geoderma 2019, 353, 70–80. [Google Scholar] [CrossRef]
  13. Bastin, J.-F.; Finegold, Y.; Garcia, C.; Mollicone, D.; Rezende, M.; Routh, D.; Zohner, C.M.; Crowther, T.W. The global tree restoration potential. Science 2019, 365, 76–79. [Google Scholar] [CrossRef]
  14. Yan, M.; Fan, L.; Wang, L. Restoration of soil carbon with different tree species in a post-mining land in eastern Loess Plateau, China. Ecol. Eng. 2020, 158, 106025. [Google Scholar] [CrossRef]
  15. Huang, J.; Jiang, D.; Deng, Y.; Ding, S.; Cai, C.; Huang, Z. Soil physicochemical properties and fertility evolution of permanent gully during ecological restoration in granite hilly region of South China. Forests 2021, 12, 510. [Google Scholar] [CrossRef]
  16. Ran, S.; Jin, J. Evolvement and control of vulnerable ecological region―A case study in ongniud banner and aohan banner, inner mongolia. Chinese Geogr. Sci. 2004, 14, 135–141. [Google Scholar] [CrossRef]
  17. Liu, G.; Shangguan, Z.; Yao, W.; Yang, Q.; Zhao, M.; Dang, X.; Guo, M.; Wang, G.; Wang, B. Ecological Effects of Soil Conservation in Loess Plateau. Bull. Chin. Acad. Sci. 2017, 32, 11–19. (In Chinese) [Google Scholar] [CrossRef]
  18. Ma, X.; Zhao, C.; Zhu, J. Aggravated risk of soil erosion with global warming—A global meta-analysis. Catena 2021, 200, 105129. [Google Scholar] [CrossRef]
  19. Kumar, R.; Bhardwaj, A.K.; Rao, B.K.; Vishwakarma, A.K.; Kakade, V.; Dinesh, D.; Singh, G.; Kumar, G.; Pande, V.C.; Bhatnagar, P.R.; et al. Soil loss hinders the restoration potential of tree plantations on highly eroded ravine slopes. J. Soil. Sediment. 2021, 21, 1232–1242. [Google Scholar] [CrossRef]
  20. Poesen, J.; Nachtergaele, J.; Verstraeten, G.; Valentin, C. Gully erosion and environmental change: Importance and research needs. Catena 2003, 50, 91–133. [Google Scholar] [CrossRef]
  21. Liu, H.; Zhang, T.; Liu, B.; Liu, G.; Wilson, G.V. Effects of gully erosion and gully filling on soil depth and crop production in the black soil region, northeast China. Environ. Earth Sci. 2013, 68, 1723–1732. [Google Scholar] [CrossRef]
  22. Mbaya, L.A.; Ayuba, H.K.; Abdullahi, J. An assessment of gully erosion in gombe town, gombe state, Nigeria. J. Geogr. Geol. 2012, 4, 110–121. [Google Scholar] [CrossRef]
  23. Tang, F.; Yao, Y.; Song, J.; Wang, C.; Liu, Y. Interactive influence of soil erosion and cropland revegetation on soil enzyme activities and microbial nutrient limitations in the Loess Hilly-Gully Region of China. Agronomy 2022, 12, 2796. [Google Scholar] [CrossRef]
  24. Austin, A.T.; Vivanco, L. Plant litter decomposition in a semi-arid ecosystem controlled by photodegradation. Nature 2006, 442, 555–558. [Google Scholar] [CrossRef] [PubMed]
  25. Mackay, D.S.; Band, L.E. Forest ecosystem processes at the watershed scale: Dynamic coupling of distributed hydrology and canopy growth. Hydrol. Process. 1997, 11, 1197–1217. [Google Scholar] [CrossRef]
  26. Ilek, A.; Kucza, J.; Szostek, M. The effect of stand species composition on water storage capacity of the organic layers of forest soils. Eur. J. Forest Res. 2015, 134, 187–197. [Google Scholar] [CrossRef]
  27. Gomyo, M.; Kuraji, K. Effect of the litter layer on runoff and evapotranspiration using the paired watershed method. J. Forest Res. 2016, 21, 306–313. [Google Scholar] [CrossRef]
  28. Chen, S.; Cao, T.; Tanaka, N.; Gao, T.; Zhu, L.; Zou, C. Hydrological properties of litter layers in mixed forests in Mt. Qinling, China. iForest 2018, 11, 243–250. [Google Scholar] [CrossRef]
  29. Ilek, A.; Szostek, M.; Mikołajczyk, A.; Rajtar, M. Does mixing tree species affect water storage capacity of the forest floor? Laboratory test of pine-oak and fir-beech litter layers. Forests 2021, 12, 1674. [Google Scholar] [CrossRef]
  30. Bai, Y.X.; Zhou, Y.C.; Zhang, X.Y.; Du, J.J. Water conservation capacity of litter and soil in mixed plantation of Pinus massoniana and Broadleaved Trees. Sci. Silvae Sin. 2021, 57, 24–36. (In Chinese) [Google Scholar] [CrossRef]
  31. Guevara-Escobar, A.; Gonzalez-Sosa, E.; Ramos-Salinas, M.; Hernandez-Delgado, G.D. Experimental analysis of drainage and water storage of litter layers. Hydrol. Earth Syst. Sci. 2007, 11, 1703–1716. [Google Scholar] [CrossRef]
  32. Zagyvai-Kiss, K.A.; Kalicz, P.; Szilágyi, J.; Gribovszki, Z. On the specific water holding capacity of litter for three forest ecosystems in the eastern foothills of the Alps. Agr. Forest Meteorol. 2019, 278, 107656. [Google Scholar] [CrossRef]
  33. Cheng, C.; He, K.N.; Yu, G.F.; Chai, S.X. Comparative study on water conservation capacity of different forest types of artificial forest in arid and semi-arid area. Acta Ecol. Sin. 2021, 41, 1979–1990. (In Chinese) [Google Scholar] [CrossRef]
  34. Wang, C.; Zhao, C.; Xu, Z.; Wang, Y.; Peng, H. Effect of vegetation on soil water retention and storage in a semi-arid alpine forest catchment. J. Arid Land 2013, 5, 207–219. [Google Scholar] [CrossRef]
  35. Dunkerley, D. Percolation through leaf litter: What happens during rainfall events of varying intensity? J. Hydrol. 2015, 525, 737–746. [Google Scholar] [CrossRef]
  36. Pang, X.; Bao, W. Effect of substituting plantation species for native shrubs on the water-holding characteristics of the forest floor on the eastern Tibetan Plateau. J Resour. Ecol. 2011, 2, 217–224. [Google Scholar]
  37. Li, Y.; Li, B.; Zhang, X.; Chen, J.J.; Zhan, F.D.; Guo, X.H.; Zu, Y.Q. Differential water and soil conservation capacity and associated processes in four forest ecosystems in Dianchi Watershed, Yunnan Province, China. J. Soil Water Conserv. 2015, 70, 198–206. [Google Scholar] [CrossRef]
  38. Wang, Y.; Wang, Y.; Zhang, H.; Xia, Y.; Xiao, J.; Wu, Y. Research on litter hydrology characteristic of typical vegetation in Jinyun mountain in Chongqing City. J. Soil Water Conserv. 2004, 4, 41–44. (In Chinese) [Google Scholar] [CrossRef]
  39. Keith, D.M.; Johnson, E.A.; Valeo, C. A hillslope forest floor (duff) water budget and the transition to local control. Hydrol. Process. 2010, 24, 2738–2751. [Google Scholar] [CrossRef]
  40. Neris, J.; Tejedor, M.; Rodríguez, M.; Fuentes, J.; Jiménez, C. Effect of forest floor characteristics on water repellency, infiltration, runoff and soil loss in Andisols of Tenerife (Canary Islands, Spain). Catena 2013, 108, 50–57. [Google Scholar] [CrossRef]
  41. Tu, Z.; Chen, S.; Ruan, D.; Chen, Z.; Huang, Y.; Chen, J. Differential hydrological properties of forest litter layers in artificial afforestation of eroded areas of latosol in China. Sustainability 2022, 14, 14869. [Google Scholar] [CrossRef]
  42. Sato, Y.; Kumagai, T.O.; Kume, A.; Otsuki, K.; Ogawa, S. Experimental analysis of moisture dynamics of litter layers—The effects of rainfall conditions and leaf shapes. Hydrol. Process. 2004, 18, 3007–3018. [Google Scholar] [CrossRef]
  43. Sun, J.; Yu, X.; Wang, H.; Jia, G.; Zhao, Y.; Tu, Z.; Deng, W.; Jia, J.; Chen, J. Effects of forest structure on hydrological processes in China. J. Hydrol. 2018, 561, 187–199. [Google Scholar] [CrossRef]
  44. Farahnak, M.; Mitsuyasu, K.; Otsuki, K.; Shimizu, K.; Kume, A. Factors determining soil water repellency in two coniferous plantations on a hillslope. Forests 2019, 10, 730. [Google Scholar] [CrossRef]
  45. Liu, X.; Feng, Y.; Liu, P.; Zhang, Q.; Njoroge, B.; Zhou, Q.; Gan, X.; Zhang, W.; Li, Y. Soil moisture dominated the temporal dynamics of litter moisture content in subtropical forests: A 7-year observation in south China. J. Hydrol.-Reg. Stud. 2022, 41, 101102. [Google Scholar] [CrossRef]
  46. Hua, W.; Jianli, Z.; Lifei, Y.; Lingbin, Y.; Congjun, Y.; Tengyong, L. Study on water conservation capacity of litter from different types of forest in Caohai Basin. Meteorol. Environ. Res. 2013, 4, 17–22, 26. [Google Scholar]
  47. Zhou, Q.; Keith, D.M.; Zhou, X.; Cai, M.; Cui, X.; Wei, X.; Luo, Y. Comparing the water-holding characteristics of broadleaved, coniferous, and mixed forest litter layers in a Karst Region. Mt. Res. Dev. 2018, 38, 220–229. [Google Scholar] [CrossRef]
  48. Zhang, Z.; Wang, D.; Lei, Y.; Su, K.; Wang, G.; Ma, H. Hydrological characteristics of litter in different forest succession stages at Liuxihe Watershed, southern China. Front. For. China 2009, 4, 317–322. [Google Scholar] [CrossRef]
  49. Lin, Y. Present situation and countermeasures of soil and water conservation in Hainan Province. Soil Water Conserv. China 2015, 3, 7–9. (In Chinese) [Google Scholar] [CrossRef]
  50. Carnol, M.; Bazgir, M. Nutrient return to the forest floor through litter and throughfall under 7 forest species after conversion from Norway spruce. For. Ecol. Manag. 2013, 309, 66–75. [Google Scholar] [CrossRef]
  51. Lentz, R.D.; Ippolito, J.A. Biochar and manure affect calcareous soil and corn silage nutrient concentrations and uptake. J. Environ. Qual. 2014, 43, 775. [Google Scholar] [CrossRef]
  52. Shi, Q.; Zhang, F.; Chen, Y.; Hu, Z. Optimal kinematics design of macpherson suspension: Integrated use of grey relational analysis and improved entropy weight method. J. Harbin Inst. Technol. (New Ser.) 2022, 29, 41–51. [Google Scholar]
  53. Acharya, B.S.; Stebler, E.; Zou, C.B. Monitoring litter interception of rainfall using leaf wetness sensor under controlled and field conditions. Hydrol. Process. 2017, 31, 240–249. [Google Scholar] [CrossRef]
  54. Martin, W.K.E.; Timmer, V.R. Capturing spatial variability of soil and litter properties in a forest stand by landform segmentation procedures. Geoderma 2006, 132, 169–181. [Google Scholar] [CrossRef]
  55. Bai, Y.; Zhou, Y.; Du, J.; Zhang, X.; Di, N. Effects of a broadleaf-oriented transformation of coniferous plantations on the hydrological characteristics of litter layers in subtropical China. Glob. Ecol. Conserv. 2021, 25, e01400. [Google Scholar] [CrossRef]
  56. Dong, H.; Yang, C.; Su, C.; Cao, H. Litter and Soil Hydrological Effects of Five No-commercial Forests in Dongguan. J. Soil Water Conserv. 2021, 35, 144–149, 160. (In Chinese) [Google Scholar] [CrossRef]
  57. Levia, D.F.; Bollinger, W.C.; Hrabik, R.A. Evaporation of intercepted precipitation from fruit litter of Liquidambar styraciflua L. (sweetgum) in a clearing as a function of meteorological conditions. Int. J. Biometeorol. 2005, 49, 325–331. [Google Scholar] [CrossRef] [PubMed]
Figure 1. The locations of the sampling sites at the Mahuangling Soil and Water Conservation Monitoring Station.
Forests 14 00360 g001
Figure 2. Variations in litter thickness (a) and litter mass (b) in the undecomposed litter (UL) layer and semi-decomposed litter (SL) layer of the forest type of eucalyptus–grass, bamboo–grass, acacia–grass, and shrub–grass. The different lowercase letters in each category indicate a significant difference among forest types.
Forests 14 00360 g002
Figure 3. Variations in the Rm (a), Wmax (b), and Weff (c) in the undecomposed litter (UL) layer and semi-decomposed litter (SL) layer of the forest types of eucalyptus–grass, bamboo–grass, acacia–grass, and shrub–grass. The different lowercase letters in each category indicate a significant difference among the forest types.
Forests 14 00360 g003
Figure 4. Logarithmic relationship between the water-holding ratio and immersion time of (a) undecomposed litter (UL) layer and (b) semi-decomposed litter (SL) layer of eucalyptus–grass, bamboo–grass, acacia–grass, and shrub–grass.
Forests 14 00360 g004
Figure 5. Exponential relationship between the water absorption rate and immersion time of the undecomposed litter (UL) layer for (a) eucalyptus–grass, (c) bamboo–grass, (e) acacia–grass, and (g) shrub–grass, and semi-decomposed litter (SL) layer for (b) eucalyptus–grass, (d) bamboo–grass, (f) acacia–grass, and (h) shrub–grass.
Forests 14 00360 g005
Table 1. The basic characteristics of the sampling plots.
Forest TypeDominant
Tree Species
Stand Age
(Years)
Average Tree Height (m)Average
Diameter at Breast Height (cm)
Tree
Density
(Trees·ha−1)
Canopy
Density
Slope Gradient (°)
Eucalyptus–grassE. robusta1010.95 ± 2.1510.10 ± 1.3125000.532~5
Bamboo–grassBambusa oldhamii103.52 ± 0.716.90 ± 0.3225000.422~5
Acacia–grassA. mangium108.51 ± 1.138.70 ± 0.5225000.752~5
Shrub–grassMelastoma candidum101.52 ± 0.251.70 ± 0.21 25000.352~5
Note: Data are presented as mean ± S.D. : Ground diameter of shrub.
Table 2. The effects on the litter thickness, mass, total litter thickness, and total litter mass by tree species and litter layer (SL and UL) based on the analysis by F-statistics from factorial ANOVA. df: degrees of freedom; SS: sum of squares; MS: mean square; ***: p < 0.001.
VariableFactordfSSMSFp
Litter thicknesstree3 11217.485.8368.36<0.001 ***
layer1 1121.801.8021.15<0.001 ***
tree × layer3 11215.945.3162.33<0.001 ***
Litter masstree3 1129.203.0721.35<0.001 ***
layer1 11229.8829.88208.11<0.001 ***
tree × layer3 1120.870.292.010.117
Total thicknesstree3 5644.8814.96233.34<0.001 ***
Total masstree3 5618.426.1426.27<0.001 ***
Table 3. Soil water-holding capacity in different forest types. The different lowercase letters in each category indicate a significant difference among the forest types.
Forest TypeSoil Depth
(cm)
Bulk Density
(g·cm−3)
Non-Capillary Porosity
(%)
Capillary Porosity
(%)
Total Porosity
(%)
Soil Water-Holding Capacity
(t·ha−1)
0 to 101.43 ± 0.08 a4.40 ± 2.10 a32.26 ± 2.65 a36.66 ± 1.91 a44.00 ± 5.82 b
10 to 201.53 ± 0.03 a4.17 ± 2.36 a31.32 ± 1.72 a35.48 ± 0.98 a41.70 ± 13.78 b
Eucalyptus–grass20 to 401.59 ± 0.06 a4.74 ± 1.38 a30.46 ± 3.12 a35.19 ± 2.83 a94.80 ± 11.92 a
40 to 601.60 ± 0.08 a4.15 ± 0.58 a22.14 ± 10.18 a26.29 ± 9.74 b83.03 ± 11.28 a
0 to 101.45 ± 0.12 a5.16 ± 0.52 a34.33 ± 2.54 a39.48 ± 2.74 a51.60 ± 30.05 b
10 to 201.50 ± 0.02 a4.37 ± 2.52 a34.15 ± 1.94 a38.52 ± 2.00 a43.77 ± 7.13 b
Bamboo–grass20 to 401.51 ± 0.09 a3.11 ± 0.71 a31.75 ± 0.74 a34.85 ± 0.29 a62.21 ± 10.37 a
40 to 601.45 ± 0.09 a3.16 ± 3.01 a23.26 ± 3.64 b26.42 ± 4.30 b63.20 ± 10.4 a
0 to 101.41 ± 0.10 a5.96 ± 3.55 a33.12 ± 0.53 a39.07 ± 3.75 a59.61 ± 10.64 c
10 to 201.44 ± 0.06 a4.95 ± 1.51 a32.46 ± 4.24 a37.40 ± 3.05 a49.51 ± 9.17 c
Acacia–grass20 to 401.54 ± 0.04 a4.54 ± 0.92 a32.00 ± 1.84 a36.54 ± 2.04 a90.81 ± 10.16 b
40 to 601.46 ± 0.13 a5.09 ± 1.06 a30.41 ± 3.12 a35.50 ± 3.02 a101.83 ± 11.07 a
0 to 101.44 ± 0.12 a4.81 ± 3.55 a28.74 ± 1.78 a33.54 ± 5.11 a48.11 ± 11.01 b
10 to 201.47 ± 0.05 a3.80 ± 1.51 a29.06 ± 5.02 a32.85 ± 4.01 a38.03 ± 9.17 b
Shrub–grass20 to 401.56 ± 0.04 a3.98 ± 1.10 a26.93 ± 1.78 a30.91 ± 1.56 a79.63 ± 10.16 a
40 to 601.50 ± 0.14 a3.39 ± 0.92 a27.53 ± 1.53 a30.93 ± 0.67 a67.81 ± 11.07 a
Table 4. Weighted values of water conservation capacity indexes in different forest types.
Grade I IndexWeightSerial No.Grade II IndexWeight
X1Litter thickness0.0936
X2Litter mass0.1467
Litter layer0.4826X3Rm0.0903
X4Weff0.0770
X5Wmax0.0751
X6Bulk density0.0678
X7Non-capillary porosity0.1579
Soil layer0.5174X8Capillary porosity0.0913
X9Total porosity0.0918
X10Soil water-holding capacity0.1085
Table 5. Comprehensive evaluation of water conservation capacity in different forest types.
Forest TypeWater Conservation CapacityComprehensive Evaluation ValueRank
Litter LayerSoil Layer
Eucalyptus–grass0.12180.10920.23102
Bamboo–grass0.09380.10030.19413
Acacia–grass0.20610.31970.52571
Shrub–grass0.03520.01400.04924
Disclaimer/Publisher’s Note: The statements, opinions and data contained in all publications are solely those of the individual author(s) and contributor(s) and not of MDPI and/or the editor(s). MDPI and/or the editor(s) disclaim responsibility for any injury to people or property resulting from any ideas, methods, instructions or products referred to in the content.

