Article

Explaining Landscape Levels and Drivers of Chinese Moso Bamboo Forests Based on the Plus Model

1
College of Life Science and Technology, Central South University of Forestry and Technology, Changsha 410004, China
2
Hunan Polytechnic of Environment and Biology, Hengyang 421005, China
3
College of Forestry, Central South University of Forestry and Technology, Changsha 410004, China
4
Academic Affairs Office, Hunan Open University, Changsha 410004, China
5
National Forestry and Grassland Administration State Forestry Administration Engineering Research Center for Forest Tourism, Changsha 410004, China
*
Author to whom correspondence should be addressed.
Forests 2023, 14(2), 397; https://doi.org/10.3390/f14020397
Submission received: 9 January 2023 / Revised: 11 February 2023 / Accepted: 13 February 2023 / Published: 15 February 2023
(This article belongs to the Special Issue Ecological Functions of Bamboo Forests: Research and Application)

Abstract

:
China is the richest country in the world in terms of bamboo forest resources, with moso bamboo as the dominated landscape distribution. Analysis of its spatial distribution, landscape change, and its drivers is crucial for forest ecosystem management and sustainable development. However, investigations on the effects of multiple geographical and environmental factors on changes in the landscape of moso bamboo forests are still limited. In this study, Chinese moso bamboo forests in 2010, 2015 and 2020 were selected as the study objects, and 19 provinces (data for Hong Kong, Macao, and Taiwan are unavailable), where Chinese moso bamboo forests were actually distributed, were taken as the study areas. This paper aims to determine the spatial distribution and landscape level of moso bamboo forests in China, as well as to conduct a preliminary study on the natural and socioeconomic factors of landscape change within moso bamboo forests and their buffer zones through density analysis, landscape fragmentation analysis, and patch-generating land use simulation model. The analysis using ArcGIS kernel density analysis revealed significant variability in the spatial distribution of moso bamboo forests in China, expanding in both the north and southwest directions. China’s moso bamboo forests expanded fast between 2010 and 2020, with the landscape becoming more fragmented, landscape fragmentation increasing, aggregation diminishing, and overall landscape quality declining. Climate has the greatest influence on the shifting landscape distribution of moso bamboo forests, followed by locational factors and soil and terrain, and socioeconomic factors such as location, population density, and GDP also impact the shifting distribution and landscape of the moso bamboo forest.

1. Introduction

Bamboo forests are widely acknowledged as a sustainable, renewable resource, energy reservoir, and suitable wood substitute [1]. Bamboo has several unique properties, including quick growth, rapid forest establishment, long-term use capacity, a short production cycle, high productivity, and a high potential for carbon sequestration [2,3,4]. Presently, the global bamboo forest area covers over 22 million hectares. The geographical distribution of bamboo in the world can be divided into three major bamboo regions, with the Asia-Pacific bamboo region being the largest. It extends from New Zealand at 42° S to the south, the central Kuril Islands at 51° N to the north, the Pacific islands to the east, and the southwestern Indian Ocean to the west [5]. China accounted for a quarter of the world’s total of bamboo species and forest area in 2018, producing over 10,000 bamboo products. Over the past 50 years, the bamboo forest area in China has significantly increased [2,6]. The bamboo forest in China is also an important carbon storage and industrial tree species [7,8]. The State Forestry and Grassland Administration, the National Development and Reform Commission, and ten other departments issued Opinions on Accelerating the Innovative Development of Bamboo Industry in 2021, with the goal of completing the basic construction of bamboo forest landscape in scenic rural areas by 2035 [9]. China’s bamboo sector has an annual output value of 200 billion RMB and employs more than 8 million people, which contributes to the improvement of human life, the development of a green economy, and the fight against climate change [10]. For their sustainable development and exploitation, an understanding of the spatial distribution of bamboo forests and the environmental and socioeconomic impacts on their distribution is required.
Influenced by factors such as natural geographical conditions, economic development, and biological characteristics of bamboo species, the distribution of bamboo resources in China is distinctly explicit regional, with moso bamboo dominating the landscape distribution [11,12]. According to the ninth national forest resources inventory, the bamboo forest in China encompasses 6,411,600 hectares, of which 4,677,800 hectares, or 72.69%, are moso bamboo forests [13]. As a major component of the forest landscape, the landscape pattern and of moso bamboo control the distribution form and combination of forest resources and physical environment and influence the Chinese forest ecosystems’ material cycle and energy flow production. Due to frequent human activities, it is impossible to observe the natural succession of moso bamboo forests in its entirety. The landscape pattern of moso bamboo is a concrete manifestation of bamboo landscape variability, and it is also the outcome of several ecological processes, including disturbance, working at different scales. The study of spatial heterogeneity and landscape pattern of moso bamboo is thus the focal point of forest landscape spatial analysis.
Density analysis, one of the analytical approaches used to examine ongoing changes in the spatial heterogeneity of forest landscapes, offers direct evaluation and visualization of the intensity of occurrences [14]. Density analysis has been utilized widely in forest landscapes and other land type studies for a variety of objectives, including crop yield estimation [15], forest assessment [16], and landscape ecology studies [17]. Density analysis techniques accessible in GIS environments enable researchers to transform values measured at specific places on a continuous surface to discover overall trends in the spatial distribution of the variables of interest [18]. Kernel density estimation (KDE) has been employed to describe and assess spatial trends generated by landscape features and their possible ecological interactions or influences on the surrounding landscape [19,20,21], as well as for spatial modeling of landscape quality [22]. In contrast to other gridding approaches, KDE is beneficial for showing structural elements in data that may not be revealed by the parametric approach [23].
Moreover, as technology has advanced, several remote sensing techniques, spatial modeling, and computational skills have considerably improved our ability to estimate and anticipate the causes of forest spatial distribution and landscape evolution [24,25], f or example, the beta cellular automata (CA) land use conversion, its impact modeling framework the conversion of land use and its effects (CLUE) model and its upgraded models the patch-generating land use simulation model (PLUS) model. However, CA models are ineffective at identifying the landscape’s underlying drivers [26,27,28]. CLUE models result in separation of macroscopically predicted land use demand and local change allocation [29,30]. The PLUS model is a more effective one [31,32], which employs the Random Forest Classification (RFC) algorithm and achieve good results in exploring the relationship between the growth of different land use types and multiple drivers.
The primary objectives of our study are to assess the spatial distribution and landscape level of moso bamboo forests in China and to analyze the relationship between the underlying factors (natural and socioeconomic) and landscape change in moso bamboo forests in China. However, it is crucial to note that the primary focus of this study is the spatial and temporal analysis of forest landscape change in moso bamboo, which is essential for the investigation of its drivers. The preliminary findings presented here on the drivers of forest landscape change in moso bamboo forests presented are the first studies relevant to the study area and provide a solid foundation for further research on the relevance of each factor to the observed types of forest landscape change. A second phase of the study is planned to analyze other possible drivers, such as specific social policies, laws, and regulations, and projections of the future landscape evolution of moso bamboo forests in China based on these factors.
The landscape pattern and dynamic succession of moso bamboo in China was chosen as the focus of this study in order to achieve our anticipated goals. We analyzed the dynamic change characteristics of the moso bamboo forest landscape over many years in 2010, 2015, and 2020 based on time series, and then we explored the change patterns and drivers of its landscape pattern using the PLUS model, in order to clarify the natural evolutionary trends and anthropogenic disturbance factors in the development of moso bamboo forest in China. This study not only provides a relatively accurate and comprehensive picture of the succession of moso bamboo in China over time and the intrinsic mechanisms involved, but also offers corresponding theoretical support and decision-making suggestions for ensuring forest management, ecological security, and promoting the development of ecological civilization. Through this investigation, we seek to address the following questions: (1) What are the spatial distribution and landscape pattern of moso bamboo forests in China, where are they mostly situated, and where are the intervals of spatial distribution with high and low densities? (2) What are the spatial changes in the distribution and landscape of moso bamboo forests during the 2010–2015 and 2015–2020 periods, and do they grow or contract to other regions? (3) What forces drive the degree of landscape change in China’s moso bamboo forests, and what factors influence the distribution and evolution of bamboo forests?

2. Materials and Methods

2.1. Data and Processing

2.1.1. Chinese Moso Bamboo Forest Database

China is located in the eastern part of Asia, with high topography in the west and low topography in the east, in a stepped pattern, and complex and diverse climate, including tropical, subtropical, warm temperate, middle temperate, and cold temperate climates zones from south to north. Moso bamboo forests are primarily found in the subtropical region in southern China. To analyze the evolution of landscape patterns of moso bamboo forests in China, this study accessed the forest resources database of the State Forestry and Grassland Administration of China and extracted all the national forest resources survey data for 31 provincial administrative regions (data for Hong Kong, Macao, and Taiwan are unavailable) for 2010, 2015, and 2020. The vector data of moso bamboo forest in each province in 2010, 2015, and 2020 were extracted from the national forest resources survey database. The obtained vector layers of moso bamboo forest in 2010, 2015, and 2020 nationwide were merged again to obtain the regional merged layer with moso bamboo forest distribution during 2010–2020. Based on the regional merged layer as a foundation, a 5000-m straight-line buffer zone layer is created to produce the buffer zone layer. In order to create the final layer for the subsequent study of the moso bamboo forest landscape, the buffer zone layer was intersected with the forest resource database of each province in 2010, 2015, and 2020. According to the Chinese moso bamboo forests distribution database, we have finally selected the study region for this project, which consists of all 19 provinces of Chinese bamboo forests distribution from 2010 to 2020 (data for Hong Kong, Macao, and Taiwan are unavailable), as shown in Figure 1.

2.1.2. Driving Factor Selection

On the influence of bamboo forest growth and change, researchers have mostly focused on a single component. We analyzed the driving factors of the evolution of bamboo forest landscape patterns by integrating meteorological, soil, topographic, location, population, and GDP parameters, among others, in order to investigate the factors influencing the evolution of bamboo forest landscape patterns. Meteorological data include annual minimum temperature, annual average temperature, annual minimum precipitation, annual average precipitation indicators. The data originate from the National Meteorological Science Data Center. Soil data include soil pH and soil thickness; The data originate from the 1:1 million soil map of the People’s Republic of China the database of Chinese soil species. The global SRTM (Surface Referenced Terrain Model) is the source of elevation-based topographic data, the data are related to altitude and come from the the Global SRTM (Shuttle Radar Topography Mission), i.e., the global shuttle radar topography mapping data. The geographic location data include latitude and longitude information. The regional location information includes distance from water system, distance from road and distance from urban center, the data of which come from the national geographic information public service platform; and the population dataset from the UN-corrected version of the 1000*1000 m global population dataset from the World pop Hub website. The economic data is GDP per capita from the GDP dataset of the landscan website. All the above data were converted to the 2000 National Ggeodetic Coordinate System and Albers Equal-Area Conic Projection coordinates. Table 1 presents the specific data sources.

2.2. Methods

2.2.1. Kernel Density Analysis

Kernel density analysis is a nonparametric method for estimating probability density functions that can effectively analyze the clustering of observed forest landscapes [19,33]. The original bamboo forest data were resampled to raster data with an image element size of 200 m, then the raster data were transformed into point data, followed by kernel density estimation, and the computational equation was:
F n x = 1 nh i = 1 n k x x i h ,
where: Fn(x) is the kernel density estimate of the bamboo forest landscape; K is the kernel function; h > 0 is the bandwidth; x − xi represents the distance from the estimated point to the sample xi. In KDE estimation, the determination or selection of bandwidth h has a substantial impact on the calculation results; the larger h is set, the smoother the generated density raster and the higher its probability; the smaller h is set, the more information is displayed in the generated density raster [34].

2.2.2. Landscape Fragmentation Analysis

Landscape indices can greatly condense landscape pattern information and present landscape composition and spatial distribution status through different levels of landscape indices, which have been widely used in numerous land use and landscape pattern studies. Using previous research results [35,36] and the data situation of the moso bamboo forest, this study selected seven landscape indices from all the indices to characterize the landscape pattern of bamboo forest: class area index (CA), number of patches index (NP), mean patch size index (MPS), patch density index (PD), Largest patch index (LPI), landscape shape index (LSI), and aggregation index (AI), to characterize the landscape pattern of bamboo forest. The Fragstats [37] software was used to calculate the values of each index to quantify and describe the landscape pattern changes and fragmentation of regional moso bamboo forests. The total significance and calculation of each index are as detailed below.
(1) NP refers to the total number of patches equal to a patch type in the landscape at the type level; its value range is NP >= 1 and NP = n.
(2) CA is the total area of a patch type, which reveals the degree of landscape fragmentation; the range of CA values is greater than 0.
(3) MPS, unit: hm2. Range: MPS > 0. MPS at the patch level equals to the total area of a patch type divided by the number of patches comprising that type. At the landscape level, we believe a landscape with a lower MPS value is more fragmented than one with a higher MPS value.
(4) PD refers to the number of patches per square kilometer. PD ≥ 0, no upper limit. The patch density index measures the degree of the landscape fragmentation. The higher the patch density, the smaller the patches and the greater the degree of fragmentation.
PD = N i A ,
where N represents the number of patches, and A represents the total landscape area.
(5) LPI is the ratio of the total area of the largest patch to the total area of a patch type or the whole landscape, is used to describe the level of a patch type in relation to the degree of the landscape. The calculation is as follows.
LPI = Max a 1   a n A 100 ,
where ai represents the patch area i and A represents the total landscape area. LPI is the percentage of the largest patch area in the patch type to the total landscape area, and in landscape ecology, LPI is a measure of dominance at the patch level, and its value range is between 0 and 100.
(6) LSI describes the complexity of the shape of the patch boundaries. LSI ≥ 1, no upper limit. When there is only a single square patch, the LSI is 1. The value of a landscape patch increases when its shape is irregular. The calculation is as follows.
LSI = P i 2 π A i ,
where Pi is the perimeter of landscape type i, Ai is the area of type i.
(7) AI, when the landscape gradually aggregates, AI will increase; if the landscape consists of a single patch, AI equals to 100, AI equals 0 when an element type is randomly dispersed throughou the landscape. The calculated is as follows.
A I = i = 1 m g ii max g ii 100 ,
where gii is the number of similar neighboring patches of landscape type i.

2.2.3. Patch-Generating Land Use Simulation Model

The patch-generating land use simulation (PLUS) model is a new land use model based on beta cellular automata that investigates the causes and dynamics of land use change simulation, particularly in forest landscape change patches [29,31,38]. First, samples of interconversion of various types of land use between two periods of land use data must be extracted for training, followed by simulation of future land use based on the probability of conversion. The land-use expansion and driving factors for each land use type are then calculated using the random forest technique. Finally, the development probability of each land use type and the contribution of driving factors to the expansion of each land use type are determined. In this study, the evolution of the landscape pattern of the moso bamboo forest was analyzed by means of the LEAS module of the PLUS model. We evaluated the bamboo forest data to obtain the change of land use types through the growth patches of each changing land use type, which can be used to characterize the land use changes during a certain time period. The random forest classification (RFC) technique was used to investigate the relationship between the growth of various land use types and several causes in order to quantify the probability of the development of each land use type using the formula [39].
P i , k X d = n = 1 M I h n X = d M ,
where X is a vector of driving factors. M is the number of decision trees. d is either 0 or 1, where 1 indicates that other land use types can be converted to land use type k and 0 indicates other land types cannot be converted to land type k. hn(X) is the expected land use type calculated when the decision tree has a value of n. I[hn(X) = d] is the exponential function of the decision number. P i , k X d is the growth probability of of land use type k at spatial unit i.

3. Results

3.1. Spatial Clustering Analysis of Moso Bamboo Forest

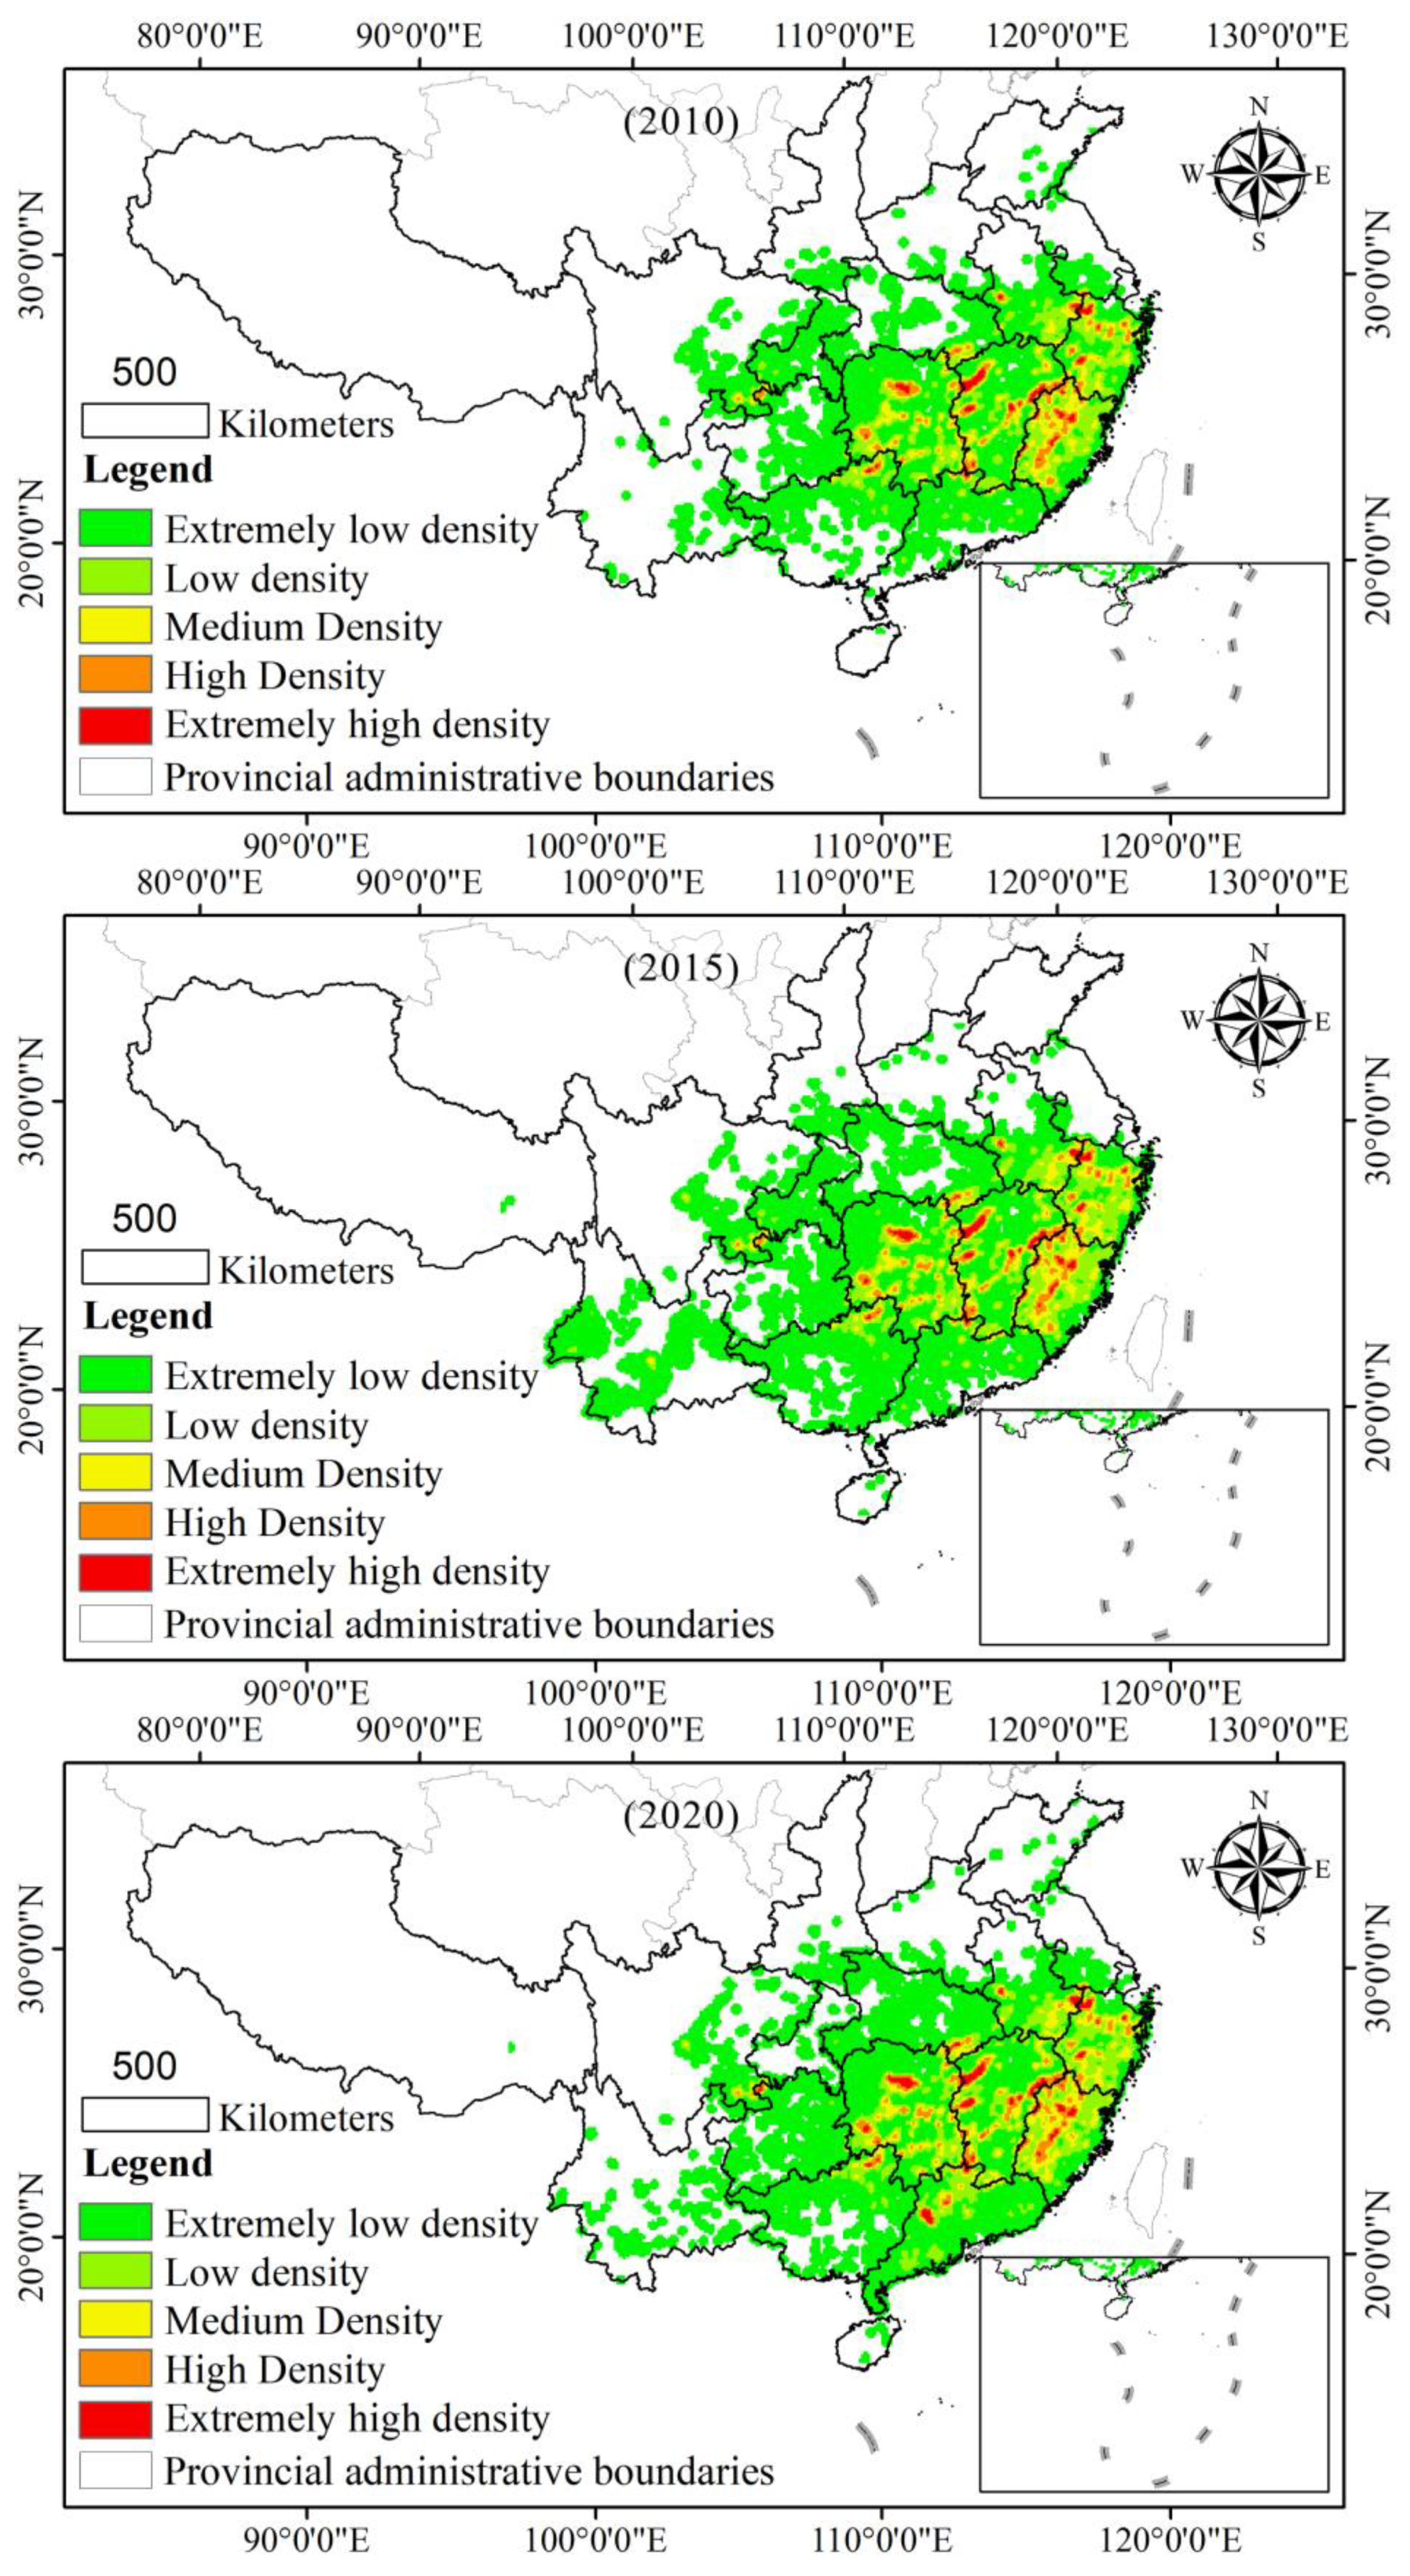
To determine the spatial clustering of moso bamboo forests in China, we first estimated the kernel density values of moso bamboo forests across the country using the kernel density analysis tool in Arcgis 10.8. It can reflect the spatial clustering of moso bamboo forests. The higher the value of this density, the more spatially clustering of moso bamboo forests are. According to the data, the range of nuclear density values of national moso bamboo forests in 2010, 2015, and 2015 was 0–14.228, 0–13.912, and 0–15.711, respectively. The natural breakpoint approach was used to divide them into five categories: extremely low-density zone (0–0.669), low-density zone (0.669–2.176), medium-density zone (2.176–4.240), and high-density area (4.240–7.086), and extremely high-density area (>7.086). It is evident from Figure 2 that the spatial distribution of moso bamboo forests in China is highly variable.
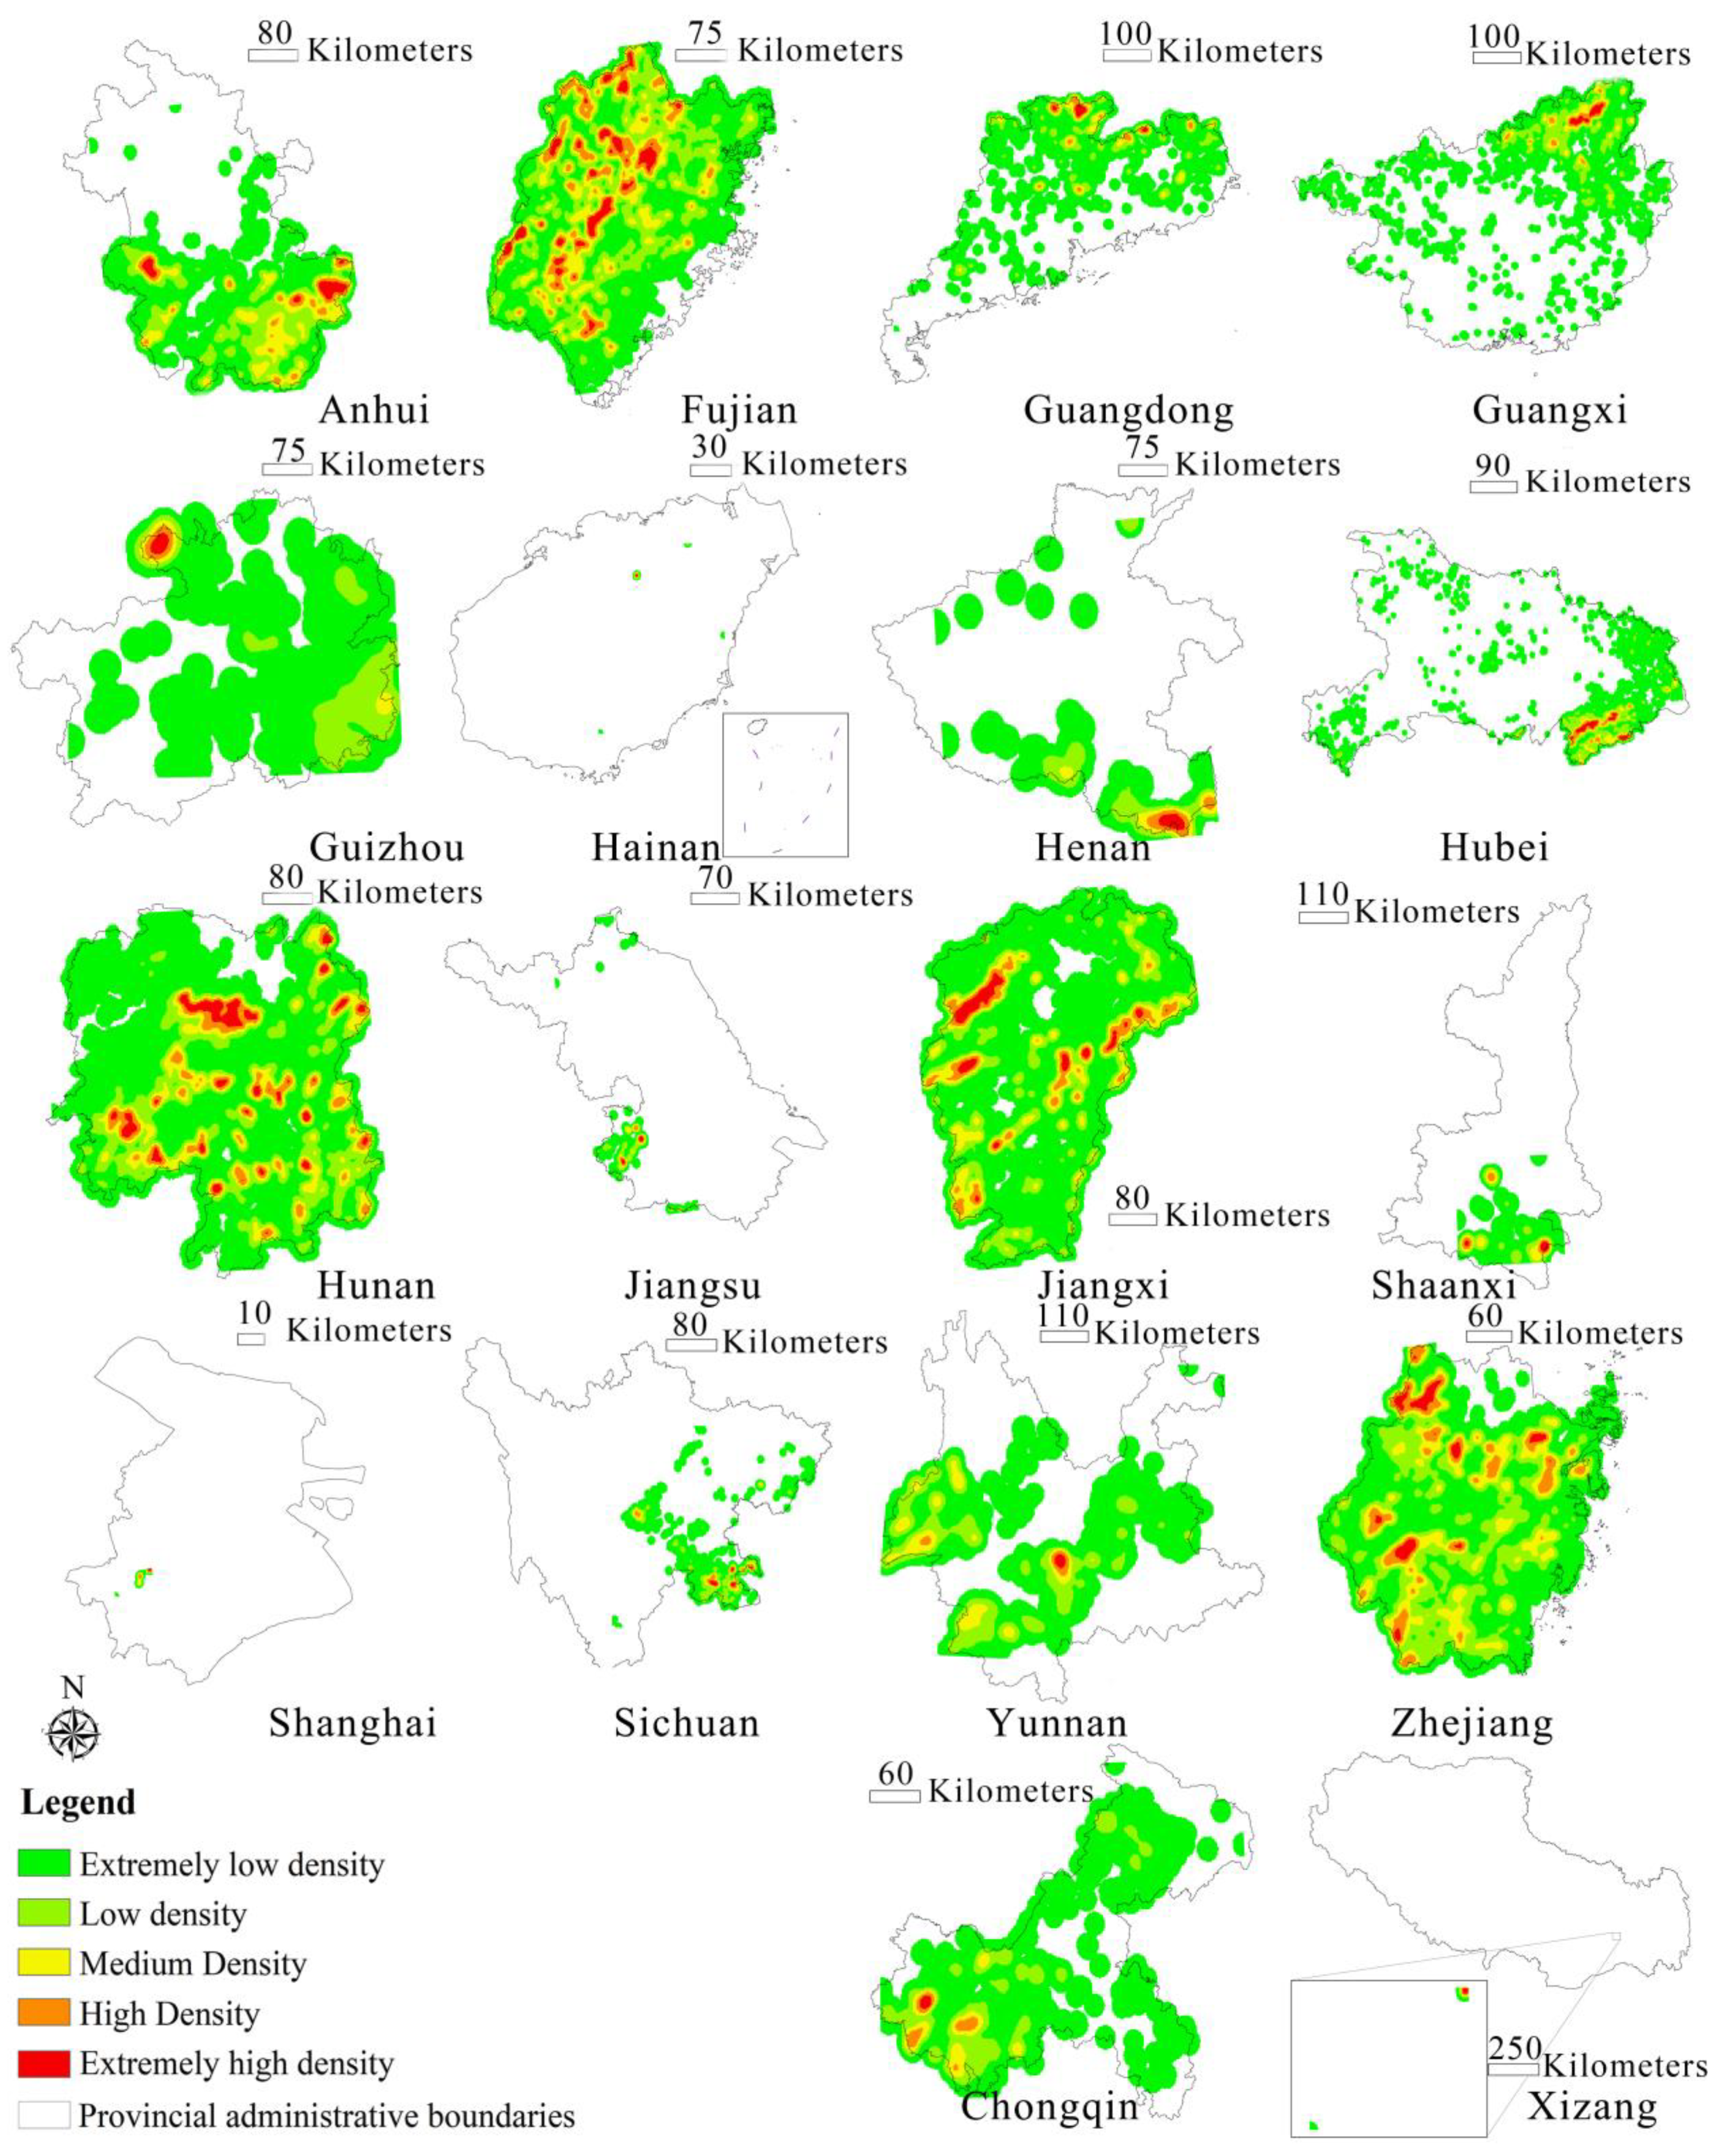
From 2010 to 2015, Chinese moso bamboo forests were distributed in 18 provinces spanning latitude between 16°46′33″ N and 38°57′12″ N and longitude between 92°35′14″ N and 126°59′58″ N. In 2020, it reached 19 provinces spanning latitude between 14°21′47″ N and 40°45′46″ N and longitude between 88°46′26″ N and 133°1′12″ N. In terms of the distribution of moso bamboo forest density in specific provinces (Figure 3, Figure 4 and Figure 5), high-density and extremely high-density areas are primarily distributed in Hunan, Zhejiang, Fujian, Jiangxi, and other provinces as well as Anhui and southern Jiangsu, with latitude range between 22°58′4″ N and 31°48′3″ N and longitude between 108°33′18″ N and 123°40′47″ N. 47″ N. From 2010 to 2015, the spatial increase in low-density and extremely low-density areas was significant, and the distribution of moso bamboo forests kept expanding to the provinces in the southwest, mainly in Yunnan, Guangxi, Hainan, and Xizang. From 2015 to 2020, the expansion of low-density and extremely low-density areas occurred mostly in the provinces of Shandong and Guangdong, indicating that the distribution of moso bamboo forests was growing in both north and south. The majority of the increase in high-density and extremely high-density areas were occurred in the northern Guangdong Province.

3.2. Spatial and Temporal Dynamics of Moso Bamboo Forest Landscape Patterns

In the landscape index of the moso bamboo forest (Table 2 and Table 3), the CA values showed that the area of the moso bamboo forest increasing from 2010 to 2020, indicating that the moso bamboo forest is expanding continuously. The extent of the moso bamboo forest grew by 456,200 hectares between 2010 to 2015, and 613,772 hectares from 2015 to 2020, which means its growth rate accelerated. Based on the landscape index of each province (Table 3 and Table 4), Fujian, Jiangxi, Hunan, Zhejiang, Anhui, Guangxi, Guangdong, and Hubei are the provinces with larger moso bamboo forest areas over the past three years. The extent of moso bamboo forest exceeds 100,000 hectares, with Fujian having the largest area at over 1 million hectares. Hunan, Zhejiang, and Anhui are the provinces with the greatest increase in CA value from 2010 to 2015, whereas Guangdong and Jiangxi have the most increase in bamboo forest area from 2015 to 2020.
The number of patches of moso bamboo forest exhibited an upward trend in terms of NP value, indicating that the rise in bamboo forest area was not due to the extension of the original patches, but rather to the addition of new patches. From 2010 to 2015, the number of patches of moso bamboo forest increased by 40,570, and from 2015 to 2020, the growth rate climbed to 45,580 patches per year. From 2010 to 2015, t Zhejiang Province had the greatest rise in the number of patches of moso bamboo forest, however from 2015 to 2020, Guangdong Province had the most increase in the number of patches of moso bamboo forest.
From 2010 to 2020, the average area of moso bamboo forest patches decreased according to MPS values. The combined CA, NP, and MPS values of the moso bamboo forest landscape indicated that between 2010 and 2020, the area of the moso bamboo forest expanded, the number of patches increased, the average distance between patches dropped, and the landscape fragmentation increased.
According to Table 2 and Table 4, the national moso bamboo forest patch density and the number of moso bamboo forest patches in the unit area rose based on the PD values. In terms of specific provinces, Hunan, Anhui, Zhejiang, and Fujian have the highest density of bamboo forest patch. From 2010 to 2015, the patch density in Xizang grew, and from 2015 to 2020, the patch density in Guangdong Province increased the most, while the patch density in Yunnan Province declined significantly.
Nationwide, the proportion of landscape area occupied by the largest patches of moso bamboo forest declined in terms of LPI values, whereas the LPI values of Xizang changed more than those of other provinces. The degree of aggregation of the moso bamboo forest environment fell in AI values across the nation, with the most substantial change occurring in Jiangsu Province. The PD, LPI, and AI values of the integrated bamboo forest landscape indicate that the landscape of the moso bamboo forest does not show a pattern of large-scale concentrated contiguous distribution. However, a trend toward greater dispersion and the rise in area were mostly driven by the expansion of somewhat dispersed tiny patches.
Three provinces, Hunan, Fujian, and Zhejiang, had the greatest patch shape index values, as measured by the LSI. Guangdong Province saw the greatest increase in LSI values from 2015 to 2020, with a complex patch shape. These imply that Chinese moso bamboo forests are subject to less human influence and have a greater proportion of natural extension and growth, and that moso bamboo forests are expansive vital.

3.3. Drivers of Landscape Change in Moso Bamboo Forests

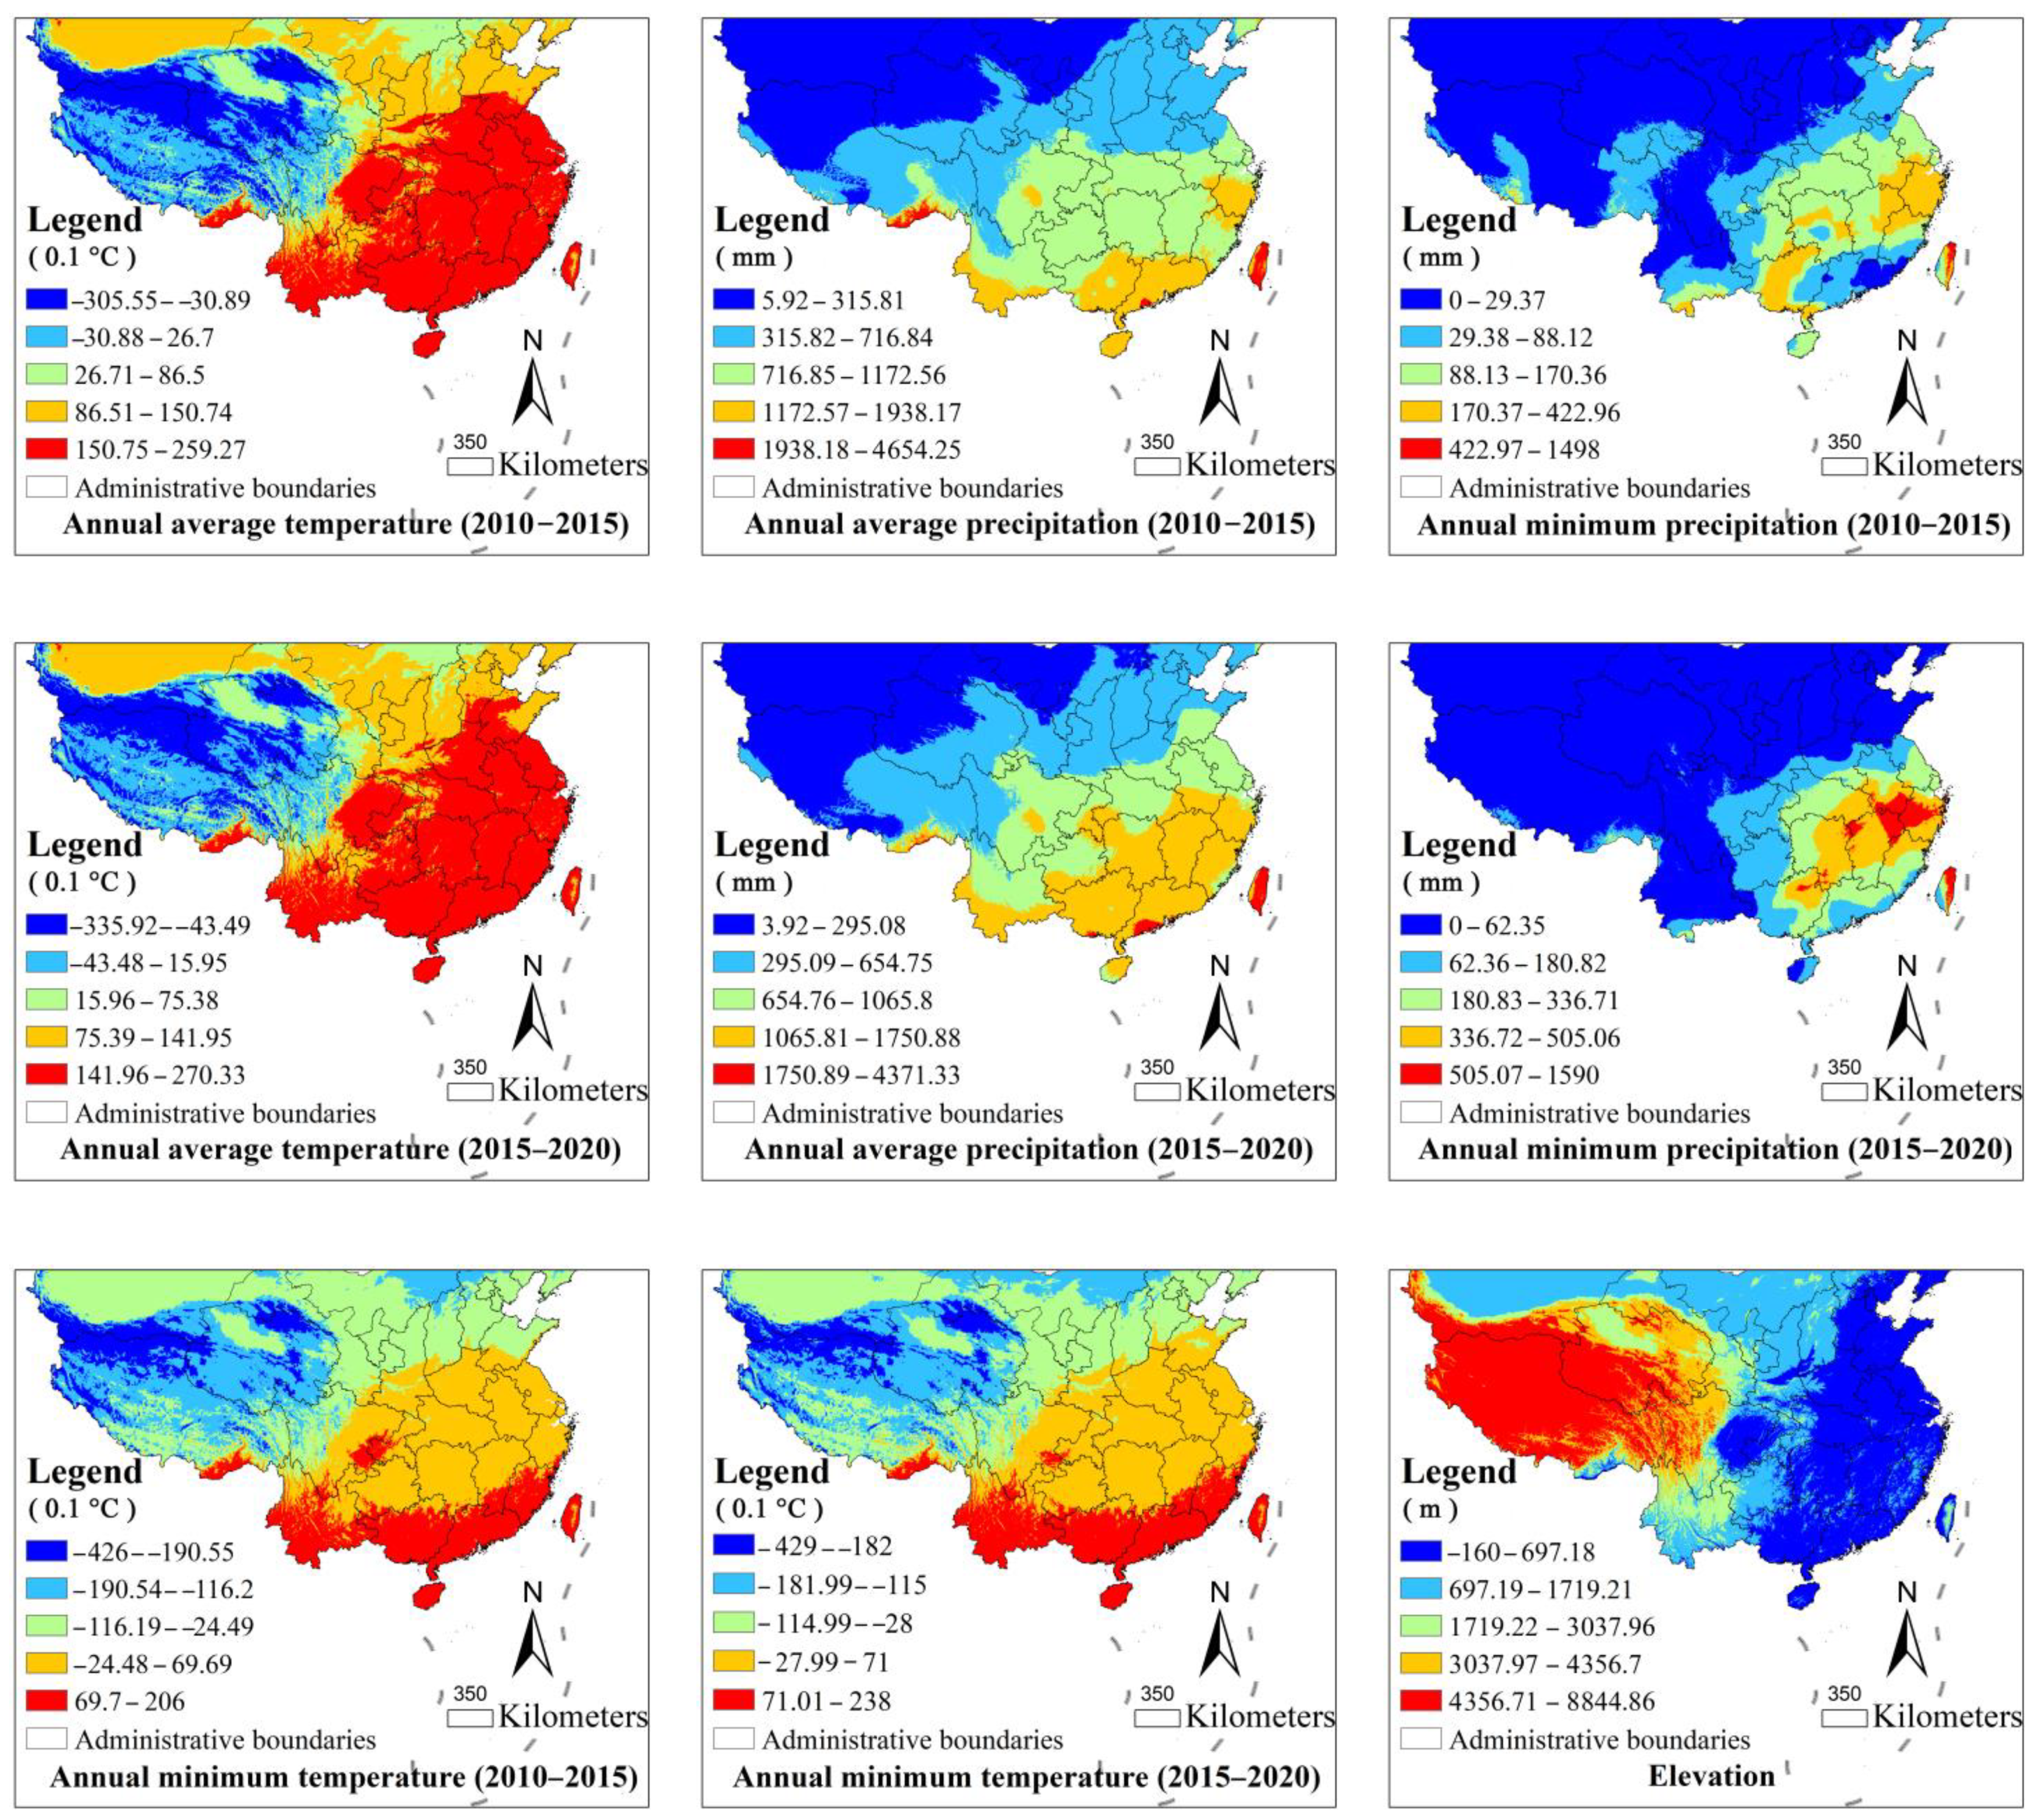
As shown in Figure 6 and Figure 7, this study calculated the contribution of seven dimensions of drivers, containing a total of 14 indicators such as GDP, longitude, latitude, annual minimum temperature, annual average temperature, annual minimum rainfall, annual average rainfall, soil pH, soil thickness, elevation, population density, distance from water systems, distance from roads, and distance from urban centers, and analyzed the changes in drivers of the evolution of the landscape pattern of moso bamboo forests in two phases, Phase A (2010–2015) and Phase B (2015–2020). Table 5 displays the errors and contributions of the various driving factors used to train the random forest model based on the PLUS model. It is evident that the landscape changes of the moso bamboo forest are driven by a combination of factors, including geographical location, climate, soil, topography, regional location, population and economy.
In 2010–2015, the contribution rate of climate factor was the highest among the driving factors of changes in moso bamboo forests, with a total contribution rate of 0.3491272. The average annual temperature contributed the most, with a contribution rate of 0.112919, followed by the average annual precipitation, the minimum annual precipitation, and the minimum annual temperature. In the second tier of the contribution rate, the geographical location factor is the most relevant component. The regional location factor is the third tier of influencing elements, which are, in order of contribution rate in order of contribution rate, the distance from the urban center, the distance from the water system, and the distance from the road. With a contribution of 0.112604, the demographic factor is the fourth tier. The fifth, sixth and seventh drivers are soil, GDP, and topography.
In 2015–2020, climate is still the driver with the highest contribution rate, with an overall contribution rate of 0.3617655, which is 0.02 higher than that of the previous period, primarily as a result of a significant increase in the contribution rate of average annual precipitation, which becomes the indicator with the highest contribution rate among the contributing factors. The second contribution rate is average annual temperature. The contribution rate of average annual minimum temperature and minimum precipitation decreases slightly. Geographical location factor is the second tier with a total contribution rate of 0.2141172. The third and fourth tiers are the regional location and population. At this level, the topographic component becomes the fifth tier, and the elevations contribution rate climbs from 0.037043 to 0.0930412. GDP and soil factors are the sixth and seventh tiers, and the contribution rate of each factor drops marginally compared to the preceding level.

4. Discussion

The expansion of moso bamboo forests is considered to be a concern, and the changes in their landscape patterns have been of interest to scholars [40]. The bamboo forest landscape fragmentation rises, aggregation decreases, and the overall landscape quality declines. Changes in forest landscape patterns are typically the consequence of a combination of natural drivers and socioeconomic factors [41,42], whereas prior studies on the effects of bamboo forest growth and change focused on a single component.
The most influential element on the distribution and landscape evolution of moso bamboo forests in China is climate, and change in th this factors have altered the spread of moso bamboo forests [11,43]. Studies have demonstrated the significance of annual minimum temperature, annual mean temperature, annual minimum precipitation, and annual mean precipitation in determining the spread of moso bamboo forests in both the preceding and subsequent phases. Temperature and precipitation play crucial roles in the development of moso bamboo forests. The annual precipitation necessary for bamboo growth ranges from 1200 to 2500 mm [44], with the average annual precipitation in southeastern China ranging from 1000 to 2000 mm and in southwestern China from 800 to 1000 mm [45]. Several earlier studies have demonstrated that temperatures above 30 °C during the germination stage of bamboo shoots inhibit shoot differentiation and lower the quantity of new bamboos, whereas a daily average temperature range of 15 to 25 °C is optimal for the growth of bamboo stands [43,46]. When the average temperature during the bamboo formation stage falls below 10 °C, bamboo growth slows or ceases [44]. Furthermore, according to Liang, precipitation is the primary factor restricting the dispersion of bamboo stands, whereas temperature is a secondary one [47]. Consequently, temperature and precipitation gradients might cause a steady decrease in the high and extremly high-density areas of bamboo forests from the southeast coast to the southwest coast (Figure 2).
The geographical location of moso bamboo forests is also a significant factor limiting landscape diversity. The current distribution of bamboo forests is primarily in the subtropical mid-latitude provinces of Hunan, Jiangxi, Fujian, and Zhejiang, corresponding with the finding of Cai Jin’s study that bamboo forests are spread in the central subtropics [45]. The data also revealed that the low-density distribution of moso bamboo forests in the majority of Sichuan, Yunnan, Xizang, Guangxi, and Guizhou provinces was a result of the comparatively high altitude and lower temperature. In contrast, the low-density distribution of bamboo forests in Shandong and Shaanxi is mainly due to the low average annual temperature due to latitudinal factors and the low and mostly scattered density of bamboo forests [45,48]. Moreover, a comparison of the two phases implies a further northward and southwestward expansion of the spatial distribution of moso bamboo forests in China. In the context of global warming, Li also anticipated that the possible distribution area of bamboo forests in southeastern China would move northward, whereas in southwestern China it would move southward [43]. These findings imply that changes in moso bamboo forests area are related to the geographical location of their distribution and their long-term trends in response to climate change.
Frequently, socioeconomic forces and biogeographic aspects influence landscape change [49,50]. Regional locational, demographic, and GDP characteristics will also influence the evolution and distribution of moso bamboo forest landscapes in China, according to studies. Integration of regional forest landscapes is aided by rational management practices, and human disruptions have altered the stability of landscape patterns as the economy has expanded [51]. Water systems, roads, and distances from urban center directly influence the accessibility of forests, which in turn affects the transformation of forest landscapes [52,53,54].
Soil and topographic influence the growth and development of bamboo forests, according to the results [55,56]. Long-term interaction and evolution of environmental elements such as vegetation type, climate, topography, and human activities [57] led to the formation of forest soil. The underground flagellar system of moso bamboo forests is unique, and the strong reproductive capacity of the flagellum causes the underground stems in the bamboo forest soil. The significant geographical heterogeneity of soil parameters suited for bamboo forest growth is a result of the unique biological traits of bamboo [58]. Several studies have demonstrated that topography, such as altitude, influences the local hydrothermal balance, which in turn can affect the entry and output processes of soil organic matter [59].
We were unable to discover data on the distribution of moso bamboo forests further back in time due to data restrictions. This study only examined the changes in the moso bamboo forest landscape from 2010 to 2020; the historical changes in the bamboo forest landscape and the future evolution of moso bamboo forests require additional study. The distribution of moso bamboo forests in China is influenced not only by climate (temperature, precipitation), location, population density, GDP, soil, and topography but also by variable covariates, other geographical factors, and the interactions between these factors. The new analysis indicates that the distribution area of moso bamboo forests will continue to expand in the future. Therefore, future research should investigate the effects of these other elements and their interactions on moso bamboo forests. Moreover, the fragmentation of the moso bamboo forest landscape means that it will have an impact on other forest landscape types, especially subtropical broadleaf evergreen forests. The specific types of landscape transformation in moso bamboo forests and their erosion impacts require additional study.

5. Conclusions

In this study, we analyzed the cold and hot spots and basic characteristics of the spatial distribution of Chinese moso bamboo forests in 2010, 2015, and 2020. We also elucidated the changing landscape pattern index of Chinese moso bamboo forests using the landscape index and explained the driving factors of moso bamboo forest distribution using the PLUS model. The conclusions are divided into three distinct sections.
(1)
The spatial distribution of Chinese moso bamboo forests demonstrates considerable variation. The range of moso bamboo forests is expanding in both the north and the southwest.
(2)
China’s moso bamboo forests expand rapidly between 2010 and 2020. The landscape of the bamboo forest becomes more fragmented, the aggregation reduces, and the overall landscape quality declines.
(3)
Changes in the landscape pattern of moso bamboo forests are attributable to the interaction of natural and socioeconomic causes. In terms of change, the climate is the most influential factor in the dispersion of the moso bamboo forest landscape; location considerations are secondary impacts. The landscape change in moso bamboo forests is influenced by the intersection of socioeconomic factors such as location, population density, and GDP with biological geographic features.
However, it should be noted that there are still some flaws in the study, which may be attributable to constraints such as the limited time period involved, and the lack of examination of causal links between drivers and specific changes in the landscapes of moso bamboo forests. In addition, the landscape transformation of moso bamboo forests in relation to other forest types and the future landscape transformation must be examined in more depth. We provide useful insights into the density distribution and landscape change of moso bamboo forests in China over a ten-year period and suggest avenues for further research on the social and economic drivers of landscape change and moso bamboo forests.

Author Contributions

Conceptualization, L.Y., J.W. and D.L; Data curation, J.W., D.L. and Z.Z.; Funding acquisition, Y.Z.; Methodology, J.W., D.L. and Z.Z.; Project administration, Y.Z.; Supervision, Y.Z.; Validation, Y.Z., J.W. and D.L.; Visualization, L.Y. and J.W.; Writing—original draft, L.Y. and J.W.; Writing—review and editing, Y.Z., L.Y. and J.W. All authors have read and agreed to the published version of the manuscript.

Funding

This research was funded by the Ministry of Science and Technology of The People’s Republic of China, grants 2019YFD1100400. This research was funded by Scientific research project of Hunan Radio and TV University, Study on the spatial pattern and evolution characteristics of star-rated leisure farms in Changsha, grant XDK2019-C-2.

Data Availability Statement

Please contact the authors via email for the data.

Acknowledgments

Thanks to the Forest Resources Data Platform of the State Forestry and Grassland Administration and other related open platforms for the support. Thanks to Qiong Xiao for revising the English language of the article.

Conflicts of Interest

The authors declare no conflict of interest.

References

  1. Scurlock, J.M.O.; Dayton, D.; Hames, B. Bamboo: An overlooked biomass resource? Biomass Bioenergy 2000, 19, 229–244. [Google Scholar] [CrossRef] [Green Version]
  2. Chen, X.; Zhang, X.; Zhang, Y.; Trevor, B.; He, X. Changes of carbon stocks in bamboo stands in China during 100 years. For. Ecol. Manag. 2009, 258, 1489–1496. [Google Scholar] [CrossRef]
  3. Yuen, J.Q.; Fung, T.; Ziegler, A.D. Carbon stocks in bamboo ecosystems worldwide: Estimates and uncertainties. For. Ecol. Manag. 2017, 393, 113–138. [Google Scholar] [CrossRef]
  4. Zhou, G.; Meng, C.; Jiang, P.; Xu, Q. Review of Carbon Fixation in Bamboo Forests in China. Bot. Rev. 2011, 77, 262. [Google Scholar] [CrossRef]
  5. Ohrnberger, D. The Bamboos of the World: Annotated Nomenclature and Literature of the Species and the Higher and Lower Taxa; Elsevier: Amsterdam, The Netherlands, 1999. [Google Scholar]
  6. Chen, X.; Zhang, Y.; Zhang, X.; Guo, Y. Changes of carbon storage in bamboo forest in China in the past 50 years. Acta Ecol. Sin. 2008, 28, 5218–5227. [Google Scholar] [CrossRef]
  7. Song, X.; Zhou, G.; Jiang, H.; Yu, S.; Fu, J.; Li, W.; Wang, W.; Ma, Z.; Peng, C. Carbon sequestration by Chinese bamboo forests and their ecological benefits: Assessment of potential, problems, and future challenges. Environ. Rev. 2011, 19, 418–428. [Google Scholar] [CrossRef] [Green Version]
  8. Shen, L.; Yang, J.; Zhang, R.; Shao, C.; Song, X. The Benefits and Barriers for Promoting Bamboo as a Green Building Material in China—An Integrative Analysis. Sustainability 2019, 11, 2493. [Google Scholar] [CrossRef] [Green Version]
  9. Forestry and Grassland Bureau Website. Opinions of Ten Departments on Accelerating the Innovation and Development of the Bamboo Industry. 11 November 2021. Available online: http://www.gov.cn/zhengce/zhengceku/2021-12/07/content_5658570.html (accessed on 12 December 2022).
  10. Li, X.; Mao, F.; Du, H.; Zhang, M. Spatiotemporal evolution and impacts of climate change on bamboo distribution in China. J. Environ. Manag. 2019, 248, 109265. [Google Scholar] [CrossRef]
  11. Wang, B.; Wei, W.; Liu, C.; You, W.; Niu, X.; Man, R. Biomass and carbon stock in moso bamboo forests in subtropical China: Characteristics and implications. J. Trop. For. Sci. 2013, 25, 137–148. [Google Scholar] [CrossRef]
  12. Ali, A.; Ma, W.; Yang, X.; Sun, B.; Xu, M. Biomass and Carbon Stocks in Schima Superba Dominated Subtropical Forests of Eastern China. J. For. Sci. 2014, 60, 198–207. [Google Scholar] [CrossRef] [Green Version]
  13. Li, Y.; Feng, P. Analysis of bamboo resources in China based on the 9th national forest resources inventory. World Bamboo Rattan. 2019, 17, 45–48. [Google Scholar]
  14. Vizzari, M.; Sigura, M. Landscape sequences along the urban–rural–natural gradient: A novel geospatial approach for identification and analysis—ScienceDirect. Landsc. Urban Plan. 2015, 140, 42–55. [Google Scholar] [CrossRef]
  15. Myers, R.; Foale, M.A. Row spacing and population density in grain sorghum—A simple analysis. Field. Crops Res. 1981, 4, 147–154. [Google Scholar] [CrossRef]
  16. Franklin, J.; Michaelsen, A.H. Strahler Spatial analysis of density dependent pattern in coniferous forest stands. Vegetatio 1985, 64, 29–36. [Google Scholar] [CrossRef]
  17. Miklós, L.; Špinerová, A.; Belčáková, I.; Diviaková, A. Instruments and tools for sustainable land use and spatial development processes. In Landscape Considerations in Spatial Planning, 1st ed.; Peter Lang: Berlin, Germany, 2019; pp. 33–87. [Google Scholar]
  18. Bailey, T.C.; Gatrell, A.C. Interactive Spatial Data Analysis; John Wiley & Sons Inc. Harlow. Longman: New York, NY, USA, 1995. [Google Scholar]
  19. Cai, X.; Wu, Z.; Cheng, J. Using kernel density estimation to assess the spatial pattern of road density and its impact on landscape fragmentation. Int. J. Geogr. Inf. Sci. 2013, 27, 222–230. [Google Scholar] [CrossRef]
  20. Modica, G.; Vizzari, M.; Pollino, M.; Fichera, C.R.; Zoccali, P.; Fazio, S.D. Spatio-temporal analysis of the urban–rural gradient structure: An application in a Mediterranean mountainous landscape (Serra San Bruno, Italy). Earth. Syst. Dynam. 2012, 3, 263–279. [Google Scholar] [CrossRef] [Green Version]
  21. Kuter, N.; Kuter, S. Investigation of wildfires at forested landscapes: A novel contribution to nonparametric density mapping at regional scale. Appl. Ecol. Env. Res. 2018, 16, 4701–4716. [Google Scholar] [CrossRef]
  22. Vizzari, M. Spatial modelling of potential landscape quality. Appl. Geogr. 2011, 31, 108–118. [Google Scholar] [CrossRef]
  23. Lin, Y.; Hu., X.; Zheng, X.; Hou, X.; Zhang, Z.; Zhou, X.; Qiu, R.; Lin, J. Spatial variations in the relationships between road network and landscape ecological risks in the highest forest coverage region of China. Ecol. Indic. 2019, 96, 392–403. [Google Scholar] [CrossRef]
  24. Guo, Y.L.; Li, X.; Zhao, Z.F.; Nawaz, Z. Predicting the impacts of climate change, soils and vegetation types on the geographic distribution of Polyporus umbellatus in China. Sci. Total Environ. 2019, 648, 1–11. [Google Scholar] [CrossRef]
  25. Martínez, B.; Radford, B.; Thomsen, M.S.; Connell, S.D.; Carreño, F.; Bradshaw, C.J.A.; Fordham, D.A.; Russell, B.D.; Gurgel, C.F.D.; Wernberg, T. Distribution models predict large contractions of habitat-forming seaweeds in response to ocean warming. Divers. Distrib. 2018, 24, 1350–1366. [Google Scholar] [CrossRef] [Green Version]
  26. Sohl, T.L.; Claggett, P.R. Clarity versus complexity: Land-use modeling as a practical tool for decision-makers. J. Environ. Manag. 2013, 129, 235–243. [Google Scholar] [CrossRef] [PubMed]
  27. Hamad, R.; Balzter, H.; Kolo, K. Predicting land use/land cover changes using a CA-Markov model under two different scenarios. Sustainability 2018, 10, 3421. [Google Scholar] [CrossRef] [Green Version]
  28. Kang, J.; Fang, L.; Li, S.; Wang, X. Parallel cellular automata Markov model for land use change prediction over MapReduce framework. ISPRS Int. J. Geo Inf. 2019, 8, 454. [Google Scholar] [CrossRef] [Green Version]
  29. Liu, X.; Liang, X.; Li, X.; Xu, X.; Ou, J.; Chen, Y.; Li, S.; Wang, S.; Pei, F. A future land use simulation model (FLUS) for simulating multiple land use scenarios by coupling human and natural effects. Landsc. Urban Plan. 2017, 168, 94–116. [Google Scholar] [CrossRef]
  30. Verburg, P.H.; Soepboer, W.; Veldkamp, A.; Limpiada, R.; Espaldon, V.; Mastura, S.S. Modeling the spatial dynamics of regional land use: The CLUE-S model. Environ. Manag. 2002, 30, 391–405. [Google Scholar] [CrossRef] [PubMed]
  31. Liang, X.; Guan, Q.; Clarke, K.C.; Liu, S.; Wang, B.; Yao, Y. Understanding the drivers of sustainable land expansion using a patch-generating land use simulation (PLUS) model: A case study in Wuhan, China. Comput. Environ. Urban Syst. 2021, 85, 101569. [Google Scholar] [CrossRef]
  32. Chen, Y.; Wang, J.; Xiong, N.; Sun, L.; Xu, J. Impacts of Land Use Changes on Net Primary Productivity in Urban Agglomerations under Multi-Scenarios Simulation. Remote Sens. 2022, 14, 1755. [Google Scholar] [CrossRef]
  33. Vizzari, M.; Hilal, M.; Sigura, M.; Antognelli, S.; Joly, D. Urban-rural-natural gradient analysis with CORINE data: An application to the metropolitan France. Landsc. Urban Plan. 2018, 171, 18–29. [Google Scholar] [CrossRef]
  34. Chen, C.; Xiu, C.; Chen, W.; Li, C. Spatial distribution characteristics of place-name landscape based on GIsapproach in Beijing and its reasons for the formation. Scentia Geogr. Sin. 2014, 34, 420–429. [Google Scholar] [CrossRef]
  35. Forman, R.T.T.; Godron, M. Landscape Ecology; John Wiley & Sons: New York, NY, USA, 1986. [Google Scholar]
  36. Liang, J. Mapping large-scale forest dynamics: A geospatial approach. Landsc. Ecol. 2012, 27, 1091–1108. [Google Scholar] [CrossRef]
  37. McGarigal, K.; Marks, B.J. FRAGSTATS: Spatial Pattern Analysis Program for Quantifying Landscape Structure; FRAGSTATS manual; Forest Service; USDA: Washington, WA, USA, 1995. [Google Scholar]
  38. Gao, L.; Tao, F.; Liu, R.; Wang, Z.; Leng, H.; Zhou, T. Multi-scenario simulation and ecological risk analysis of land use based on the PLUS model: A case study of Nanjing. Sustain. Cities Soc. 2022, 85, 104055. [Google Scholar] [CrossRef]
  39. Wu, X.; Liu, X.; Zhang, D.; Zhang, J.; He, J.; Xu, X. Simulating mixed land-use change under multi-label concept by integrating a convolutional neural network and cellular automata: A case study of Huizhou, China. Gisci. Remote. Sens. 2022, 59, 609–632. [Google Scholar] [CrossRef]
  40. Ge, Z.; Huang, S.; Ouyang, M.; Luan, F.; Fang, X.; Yang, Q.; Liu, J.; Song, Q. Stand Characteristics Rather than Soil Properties Contribute More to the Expansion of Moso Bamboo (Phyllostachys edulis) into Its Neighboring Forests in Subtropical Region. Forests. 2022, 13, 2159. [Google Scholar] [CrossRef]
  41. Viedma, O.; Melia, J. Monitoring temporal changes in the spatial patterns of a Mediterranean shrubland using Landsat images. Divers. Distrib. 1999, 5, 275–293. [Google Scholar] [CrossRef]
  42. Krajewski, P.; Solecka, I.; Mrozik, K. Forest Landscape Change and Preliminary Study on Its Driving Forces in Ślęża Landscape Park (Southwestern Poland) in 1883–2013. Sustainability 2018, 10, 4526. [Google Scholar] [CrossRef] [Green Version]
  43. Zhou, W. An analysis of the influence of precipitation on the growth of bamboo forest. J. Bamboo Res. 1991, 10, 33B–39B. [Google Scholar]
  44. Wu, B. Investigation on climate conditions and deep development of phyllostachys pubescens in shixing county. Guangdong Meteorol. 2000, 4, 27–29. [Google Scholar] [CrossRef]
  45. Cai, B.; Jin, H. Biological characteristics of bamboo and it application in scenic gardening. World Bamboo Rattan. 2010, 8, 39–43. [Google Scholar] [CrossRef]
  46. Zhang, Y.C. A study of the effects of climatic fluctuation on Chinese fir and bamboo ecological environment in subtropical regions of China. Q. J. Appl. Meteorol. 1995, 6, 75–82. [Google Scholar]
  47. Liang, T. Types and geographical flora characteristics of bamboo forest in China. J. Bamboo Res. 1990, 4, 1–16. [Google Scholar]
  48. Cui, L.; Du, H.; Zhou, G.; Li, X. Combination of decision tree and mixed pixel decomposition for extracting bamboo forest information in China. J. Remote Sens. 2019, 23, 166–176. [Google Scholar] [CrossRef]
  49. Liang, G.; Liu, J. Integrated geographical environment factors explaining forest landscape changes in Luoning County in the middle reaches of the Yiluo River watershed, China. Ecol. Indic. 2022, 139, 108928. [Google Scholar] [CrossRef]
  50. Ren, Y.; Deng, L.; Zuo, S.; Luo, Y.; Shao, G.; Wei, X.; Hua, L.; Yang, Y. Geographical modeling of spatial interaction between human activity and forest connectivity in an urban landscape of southeast China. Landsc. Ecol. 2014, 29, 1741–1758. [Google Scholar] [CrossRef]
  51. Zhang, Q.; Wang, J.; Zhang, Z.; Gu, H. Dynamic evolution of landscape pattern and driving mechanism of alpine meadow steppe. Acta Ecol. Sin. 2019, 39, 6510–6521. [Google Scholar] [CrossRef]
  52. Ferrara, C.; Carlucci, M.; Grigoriadis, E.; Corona, P.; Salvati, L. A comprehensive insight into the geography of forest cover in Italy: Exploring the importance of socioeconomic local contexts. For. Policy Econ. 2017, 75, 12–22. [Google Scholar] [CrossRef] [Green Version]
  53. Mcconnell, W.J.; Sweeney, S.P.; Mulley, B. Physical and social access to land: Spatio-temporal patterns of agricultural expansion in Madagascar Agric. Ecosyst. Environ. 2004, 101, 171–184. [Google Scholar] [CrossRef]
  54. Garbarino, M.; Lingua, E.; Weisberg, P.J.; Bottero, A.; Meloni, F.; Motta, R. Land-use history and topographic gradients as driving factors of subalpine Larix decidua forests. Landsc. Ecol. 2013, 28, 805–817. [Google Scholar] [CrossRef] [Green Version]
  55. Yang, L.; Li, Y.; Shan, B.; Shi, L. Spatial variation analysis of soil carbon storage in bamboo forest:A case study of Changning County, Sichuan. Chin. J. Ecol. 2022, 41, 1–11. [Google Scholar]
  56. Tang, X.; Xia, M.; Guan, F.; Fan, S. Spatial Distribution of Soil Nitrogen, Phosphorus and Potassium Stocks in Moso Bamboo Forests in Subtropical China. Forests 2016, 7, 267. [Google Scholar] [CrossRef] [Green Version]
  57. Zhang, Z.; Zhou, Y.; Huang, X.; Tian, X. Heterogeneity of soil organic carbon density and spatial distribution of carbon storage in karst small watershed. J. Soil Water Conserv. 2017, 31, 184–190. [Google Scholar] [CrossRef]
  58. Jiang, G.; Yu, L.; Li, Z.; Niu, H.; Shi, L. Branching system and quantitative characteristics of bamboo whip in the underground bamboo whip of Bamboo hairy. Chin. J. Ecol. 2017, 36, 3479–3484. [Google Scholar] [CrossRef]
  59. Liu, D.; Wang, Z.; Zhang, B.; Song, K.; Duan, H. Spatial distribution of soil organic carbon and analysis of related factorsin croplands of the black soil region, Northeast China. Agric. Ecosyst. Environ. 2006, 113, 73–81. [Google Scholar] [CrossRef]
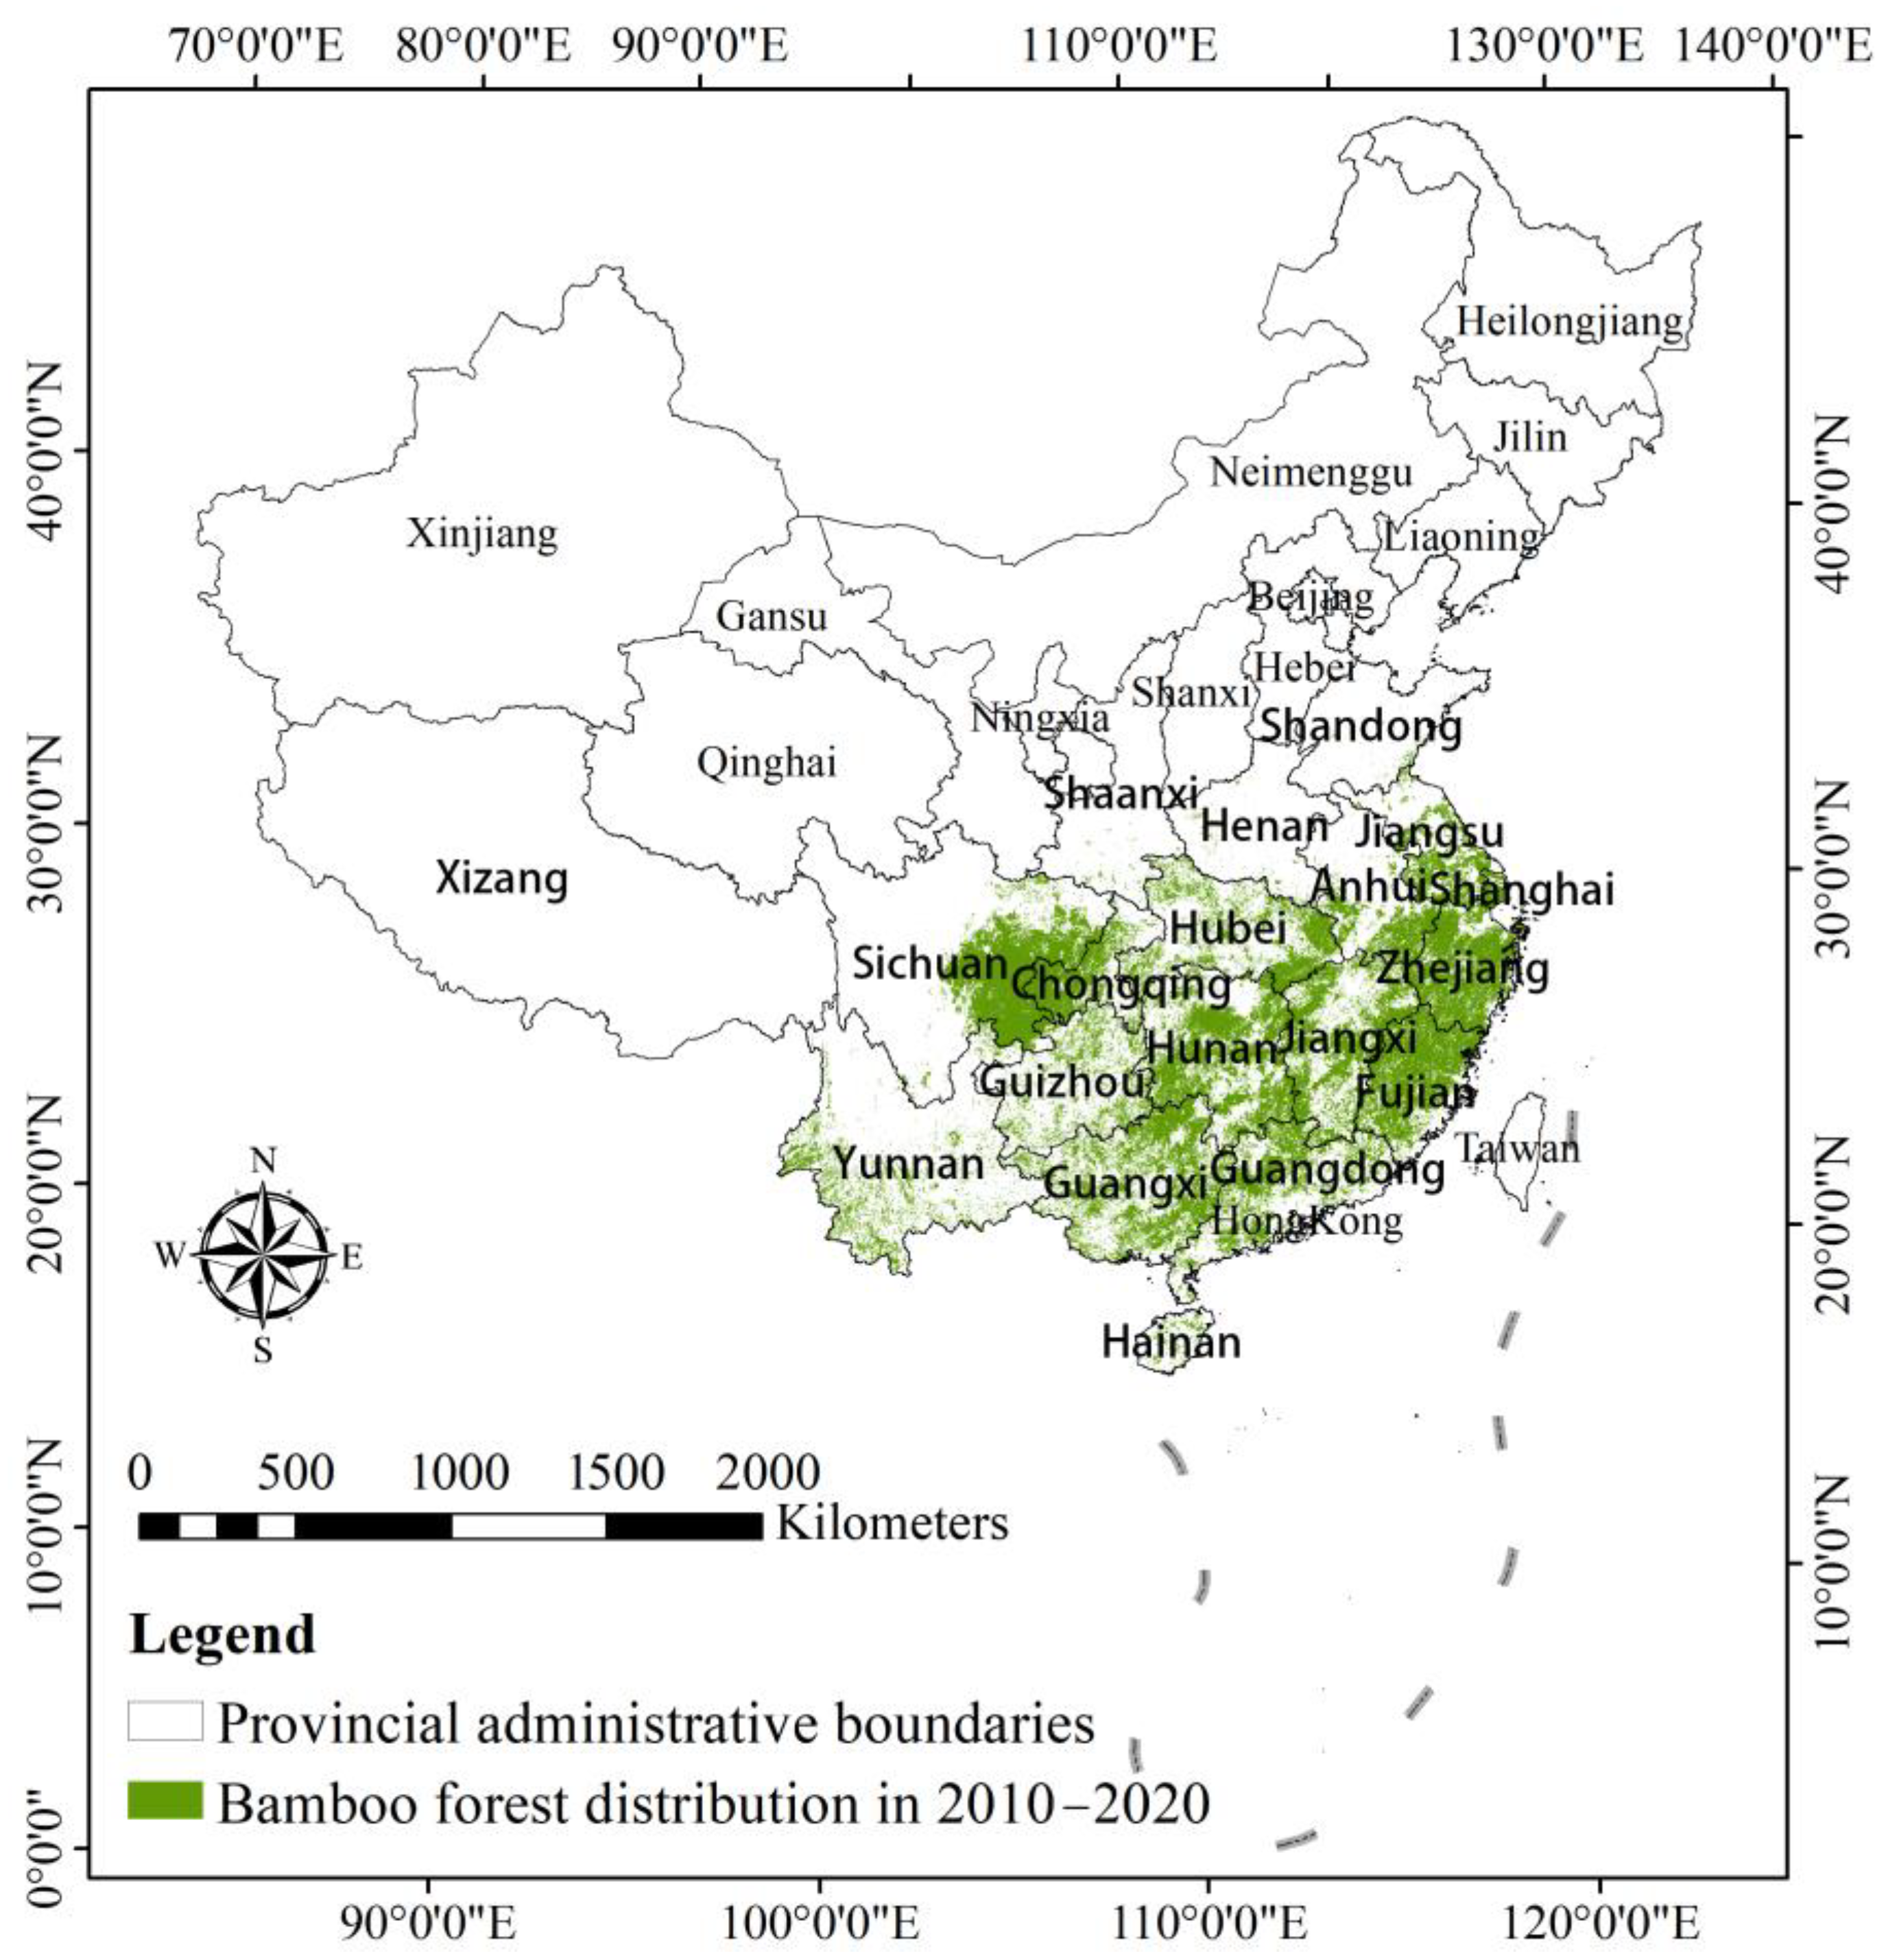
Figure 1. Study area.
Forests 14 00397 g001
Figure 2. Spatial aggregation of bamboo forests nationwide in 2010, 2015, and 2020.
Forests 14 00397 g002
Figure 3. Spatial aggregations of moso bamboo forests by the province in 2010.
Forests 14 00397 g003
Figure 4. Spatial aggregations of moso bamboo forests by the province in 2015.
Forests 14 00397 g004
Figure 5. Spatial aggregations of moso bamboo forests by the province in 2020.
Forests 14 00397 g005
Figure 6. Spatial distribution of driving factors (1).
Forests 14 00397 g006
Figure 7. Spatial distribution of driving factors (2).
Forests 14 00397 g007
Table 1. Data Sources.
DataIndicator SelectionData Source
Geographical Location dataLongitude
Latitude
Meteorological dataAnnual minimum temperatureNational Meteorological Science Data Center
(http://data.cma.cn/, accessed on 1 November 2022)
Annual average temperature
Annual minimum precipitation
Annual average precipitation
Terrain dataAltitudeGlobal SRTM (http://srtm.csi.cgiar.org/, accessed on 1 November 2022)
Soil dataSoil pH1:1 Million Soil Map of the People’s Republic of China
China Soil Species Journal
Soil thickness
Regional Location dataDistance to the water systemNational Geographic Information Public Service Platform
Distance to road
Distance to urban center
Demographic DataPopulation densityWorld pop Hub
(https://hub.worldpop.org/project/categories?id=17, accessed on 1 November 2022)
Economic DataGDPLands can GDP data (https://landscan.ornl.gov/, accessed on 1 November 2022)
Table 2. Changes in landscape indicators of national moso bamboo forests.
TimeCANPMPSPDLPILSIAI
20104,476,468160,95127.813.603.50477.1654.94
20154,932,668201,52124.484.093.18530.1552.31
20205,546,440247,10122.454.462.86578.8250.87
Table 3. Changes in CA, NP, and MPS indices of moso bamboo forests in each province.
CANPMPS
Time201020152020201020152020201020152020
Anhui268,020349,796346,14410,02716,36916,13226.7321.3721.46
Chongqing32,76426,9121128378031612058.678.515.5
Fujian1,032,3641,057,4601,109,18434,93437,14441,93929.5528.4726.45
Guangdong153,428156,444535,6164017420631,64338.1937.216.93
Guangxi186,328187,092202,52010,91911,19914,57717.0616.7113.89
Guizhou54,37259,96469,03633553725436016.2116.115.83
Hainan20180176157203625.14
Henan1632155612041681641309.719.499.26
Hubei118,864133,972172,2207150822313,38216.6216.2912.87
Hunan868,6641,004,6881,049,85640,54545,96148,83521.4221.8621.5
Jiangsu19,520144024,528942155134020.729.2918.3
Jiangxi979,7681,029,2321,170,39617,38220,81429,61056.3749.4539.53
Shanghai728080108127.2106.67
Shaanxi2928308430763313383198.859.129.64
Sichuan68,60079,26078,78039514438470617.3617.8616.74
Yunnan519663,8404608351627855714.810.178.27
Zhejiang683,728777,476777,54823,51139,81839,82329.0819.5319.53
Shandong168---28433---545.09---5.26
Xizang---6436---22---3218
Table 4. Changes in PD, LPI, LSI, and AI indices of moso bamboo forests in each province.
PDLPILSIAI
Time201020152020201020152020201020152020201020152020
Anhui0.330.550.540.570.50.61123.98153.79151.8352.2848.1148.49
Chongqing0.10.080.010.080.06067.9361.915.2624.824.398.49
Fujian0.480.50.560.290.570.58234239.37253.175453.5251.98
Guangdong0.070.080.590.320.351.2180.7181.35198.9559.0659.1245.75
Guangxi0.180.130.170.240.190.19121.03125.51141.4244.0842.137.18
Guizhou0.160.170.120.30.280.1161.7565.8270.1447.2546.646.92
Hainan0000.010.060.0411.862.1410084.2178.38
Henan0.080.080.060.050.050.0513.7613.6512.3732.5231.4429.81
Hubei0.370.160.250.510.260.393.23100.14124.3646.1545.3840.26
Hunan0.580.660.480.160.30.4242.76261265.0447.9547.9848.34
Jiangsu0.150.090.031.250.080.2132.9114.0539.1453.5727.2750.54
Jiangxi0.240.290.412.132.132.14158.85170.8198.4468.0366.4463.43
Shanghai0000.010.0103.563.56414.8125.8112.9
Shaanxi0.250.250.230.10.090.0920.3120.4320.2724.6326.7827.19
Sichuan0.040.040.050.070.090.0973.4976.3579.9944.24643.24
Yunnan0.010.250.010.010.14022.2987.5825.4438.4630.8325.67
Zhejiang0.460.560.561.130.850.71187.69239.15239.2254.7345.8445.83
Shandong0.03---0.050.01---0.026.08---7.477.04---12
Xizang---0.530.54---15.966.52---2.131.83---62.558.33
Table 5. Table of the contribution indicators of the drivers of the evolution of the landscape pattern of moso bamboo forest.
Driving Factor Indicators2010–20152015–2020
Error NoiseContribution RateError NoiseContribution Rate
Longitude0.2796250.1303160.3143450.1328130
Latitude0.2583140.1146870.2366020.0813042
Annual minimum temperature0.1769230.05499480.2156760.0674396
Average annual temperature0.2559030.1129190.275370.10699
Annual minimum rainfall0.215280.08312590.2105170.0640219
Annual average rainfall0.2356810.09808750.3000080.123314
Soil type0.1427160.02990740.1409140.0179062
Soil thickness0.1202840.0134560.13530.014187
Elevation0.1524450.0370430.2543170.0930412
Population density0.2554740.1126040.2628380.0986867
Distance to water system0.1728950.05204090.1853650.0473571
Distance to road0.1556550.03939690.1625130.0322171
Distance to city center0.2165770.08407710.2443840.0864599
GDP0.1528570.03734450.1656010.0342627
Disclaimer/Publisher’s Note: The statements, opinions and data contained in all publications are solely those of the individual author(s) and contributor(s) and not of MDPI and/or the editor(s). MDPI and/or the editor(s) disclaim responsibility for any injury to people or property resulting from any ideas, methods, instructions or products referred to in the content.