Article

Improving the Combustion Factor to Estimate GHG Emissions Associated with Fire in Pinus radiata and Eucalyptus spp. Plantations in Chile

1
Investigaciones Forestales Bioforest S.A., Camino a Coronel, Km. 15, Concepción 403 0000, Chile
2
Centro Interdisciplinario de Cambio Global, Pontificia Universidad Católica de Chile, Av. Vicuña Mackenna 4860, Santiago 782 0436, Chile
3
Facultad de Ciencias Forestales y de la Conservación de la Naturaleza, Universidad de Chile, Casilla 9206, Santiago 103 0000, Chile
4
Empresas CMPC S.A., Agustinas 1343, Santiago 103 0000, Chile
5
Corporación Chilena de la Madera A.G. (CORMA), Agustinas 1357 Piso, 3, Santiago 103 0000, Chile
*
Author to whom correspondence should be addressed.
Forests 2023, 14(2), 403; https://doi.org/10.3390/f14020403
Submission received: 11 November 2022 / Revised: 13 February 2023 / Accepted: 14 February 2023 / Published: 16 February 2023
(This article belongs to the Special Issue Fire Ecology and Management in Forest)

Abstract

:
Forest plantations can substantially contribute to carbon sequestration and greenhouse gas (GHG) mitigation at the country and global scales. Forest fires (especially when combined with droughts) may remarkably reduce such carbon sequestration capability. The IPCC has global-scale estimates for such losses, but they can vary widely depending on crops, climate, topography, and management, among other factors. The IPCC defines a factor for biomass loss as a consequence of forest fires, expressed as a fraction of total biomass. This methodology implies using aggregated data and the default emission factor, which are only recommended for countries where wildfires are not a key category. In Chile, over the last decade, there have been between 5000 and 8000 wildfires annually (an average of 6398 for the period 2011–2020), burning an average of 122,328 hectares each year. Countries may progress in the refinement of such factors depending on the availability and reliability of local values. This paper aims at estimating C f values for the main forest plantation species in Chile, Pinus radiata, Eucalyptus nitens, and Eucalyptus globulus, across different age-classes and forest fire severity. To achieve this aim, we assessed the biomass loss after forest fires for a stratified sample of forest plots for the season 2018–2019. We fitted a model to predict the amount of biomass loss during fires, and in this way, predict the emissions associated with wildfires. The model employs very simple predictive variables, age and species, because statistics for burnt areas in plantations are only provided by age-classes and species, without details about productivity or management.

1. Introduction

Forest plantations can provide a important contribution to carbon sequestration and greenhouse gas abatement on a national and global scale [1,2,3]. At the same time, forest fires (especially when combined with droughts) may appreciably reduce such carbon sequestration capability [4], in some cases shifting a forest from a carbon sink to a carbon source [5]. The risk of fire is predicted to increase globally as a consequence of climate change, and this could have an especially high impact on forest plantations [6]. The Intergovernmental Panel on Climate Change (IPCC) has world-scale estimates for such losses, which can vary dramatically depending on crops, climate, terrain, and management, among other factors [7].
Each year, wildfires burn an average of 379.5 million hectares in the world, and in South America, between 17.8 millions to 29.3 million hectares [8]. Worldwide, humans are the main source of ignition on flammable landscapes [9].
In Chile, the historical average (1964–2020) of burned area is 58,890 hectares/year over a total of 4493 forest fires. However, over the last decade, there have been between 5000 and 8000 wildfires annually (average 6398 for the period 2011–2020), burning an average of 122,328 hectares each year according to CONAF (Corporación Nacional Forestal) statistics. This large increase in burned area during the last 10 fire seasons is highly influenced by the mega-fire that developed in Central Chile during the 2016/2017 season, affecting 570,197 hectares, of which 467,537 hectares was burnt in only 25 days [10,11]. According to the National Inventory of Greenhouse Gasses [12], the total emissions associated with wildfires for the year 2017 were 54,891.8 Kt CO2 related to the loss of biomass by fire, plus 2564.4 Kt CO2 eq of non-CO2 emissions associated with the fires. The land use, land-use change, and forestry (LULUCF) sector has historically been a carbon sink sector with an average carbon absorption of 68,616 Kt CO2 eq during the previous five years. In 2017, the carbon absorption was only 11,710 Kt CO2 eq due to the impact of wildfire emissions.
The IPCC proposes a generic methodology to assess the quantity of greenhouse emissions from fire in the methodological standards for carbon accounting in forest areas [7,13]. For wildfires, this guide calculates the amount of greenhouse emissions based on the area burned, the mass of accessible fuel, and the combustion factor ( C f ), which has a high level of uncertainty. The IPCC sets three levels, Tier 1, Tier 2, and Tier 3, from less to higher certainty in terms the knowledge of parameters. Countries may progress in the refinement of such factors depending on the availability and reliability of local values. Tier 1 methodology implies using aggregated data and the default emission factor suggested by [7], being only recommended for countries where prescribed burning and wildfire are not a key category. In the case of Chile, and particularly in light of the wildfire events that occurred in 2017, greenhouse gas (GHG) emissions from fires meet the criteria of key categoriesas defined by IPCC [14]. Tier 2 follows the same general procedure as Tier 1 but using more refined country-derived factors. Tier 2 coefficients are mostly empirical and only valid within the domain in which they were calibrated. Furthermore, their accuracy is dependent on a thorough understanding of the many strata present [15]. As a consequence, sufficient measurements over the region’s variability (i.e., climate, topography, species, and age) are required. Finally, Tier 3 approaches are utilized when there is more detailed information available, such as fuel and fire dynamics. Despite the fact that Tier 3 models can produce estimates at fine geographical and temporal resolution, the data required to feed the models are not always available at the country level.
This paper aims at estimating Tier 2 C f values for the main forest plantation species in Chile, Pinus radiata, Eucalyptus nitens, and Eucalyptus globulus, across different age classes and forest fire severities. The main goal is to reduce uncertainties in the estimation of greenhouse gas emission associated with forest plantations fires and better understand the role of forest plantations in the national and global carbon cycle.

2. Materials and Methods
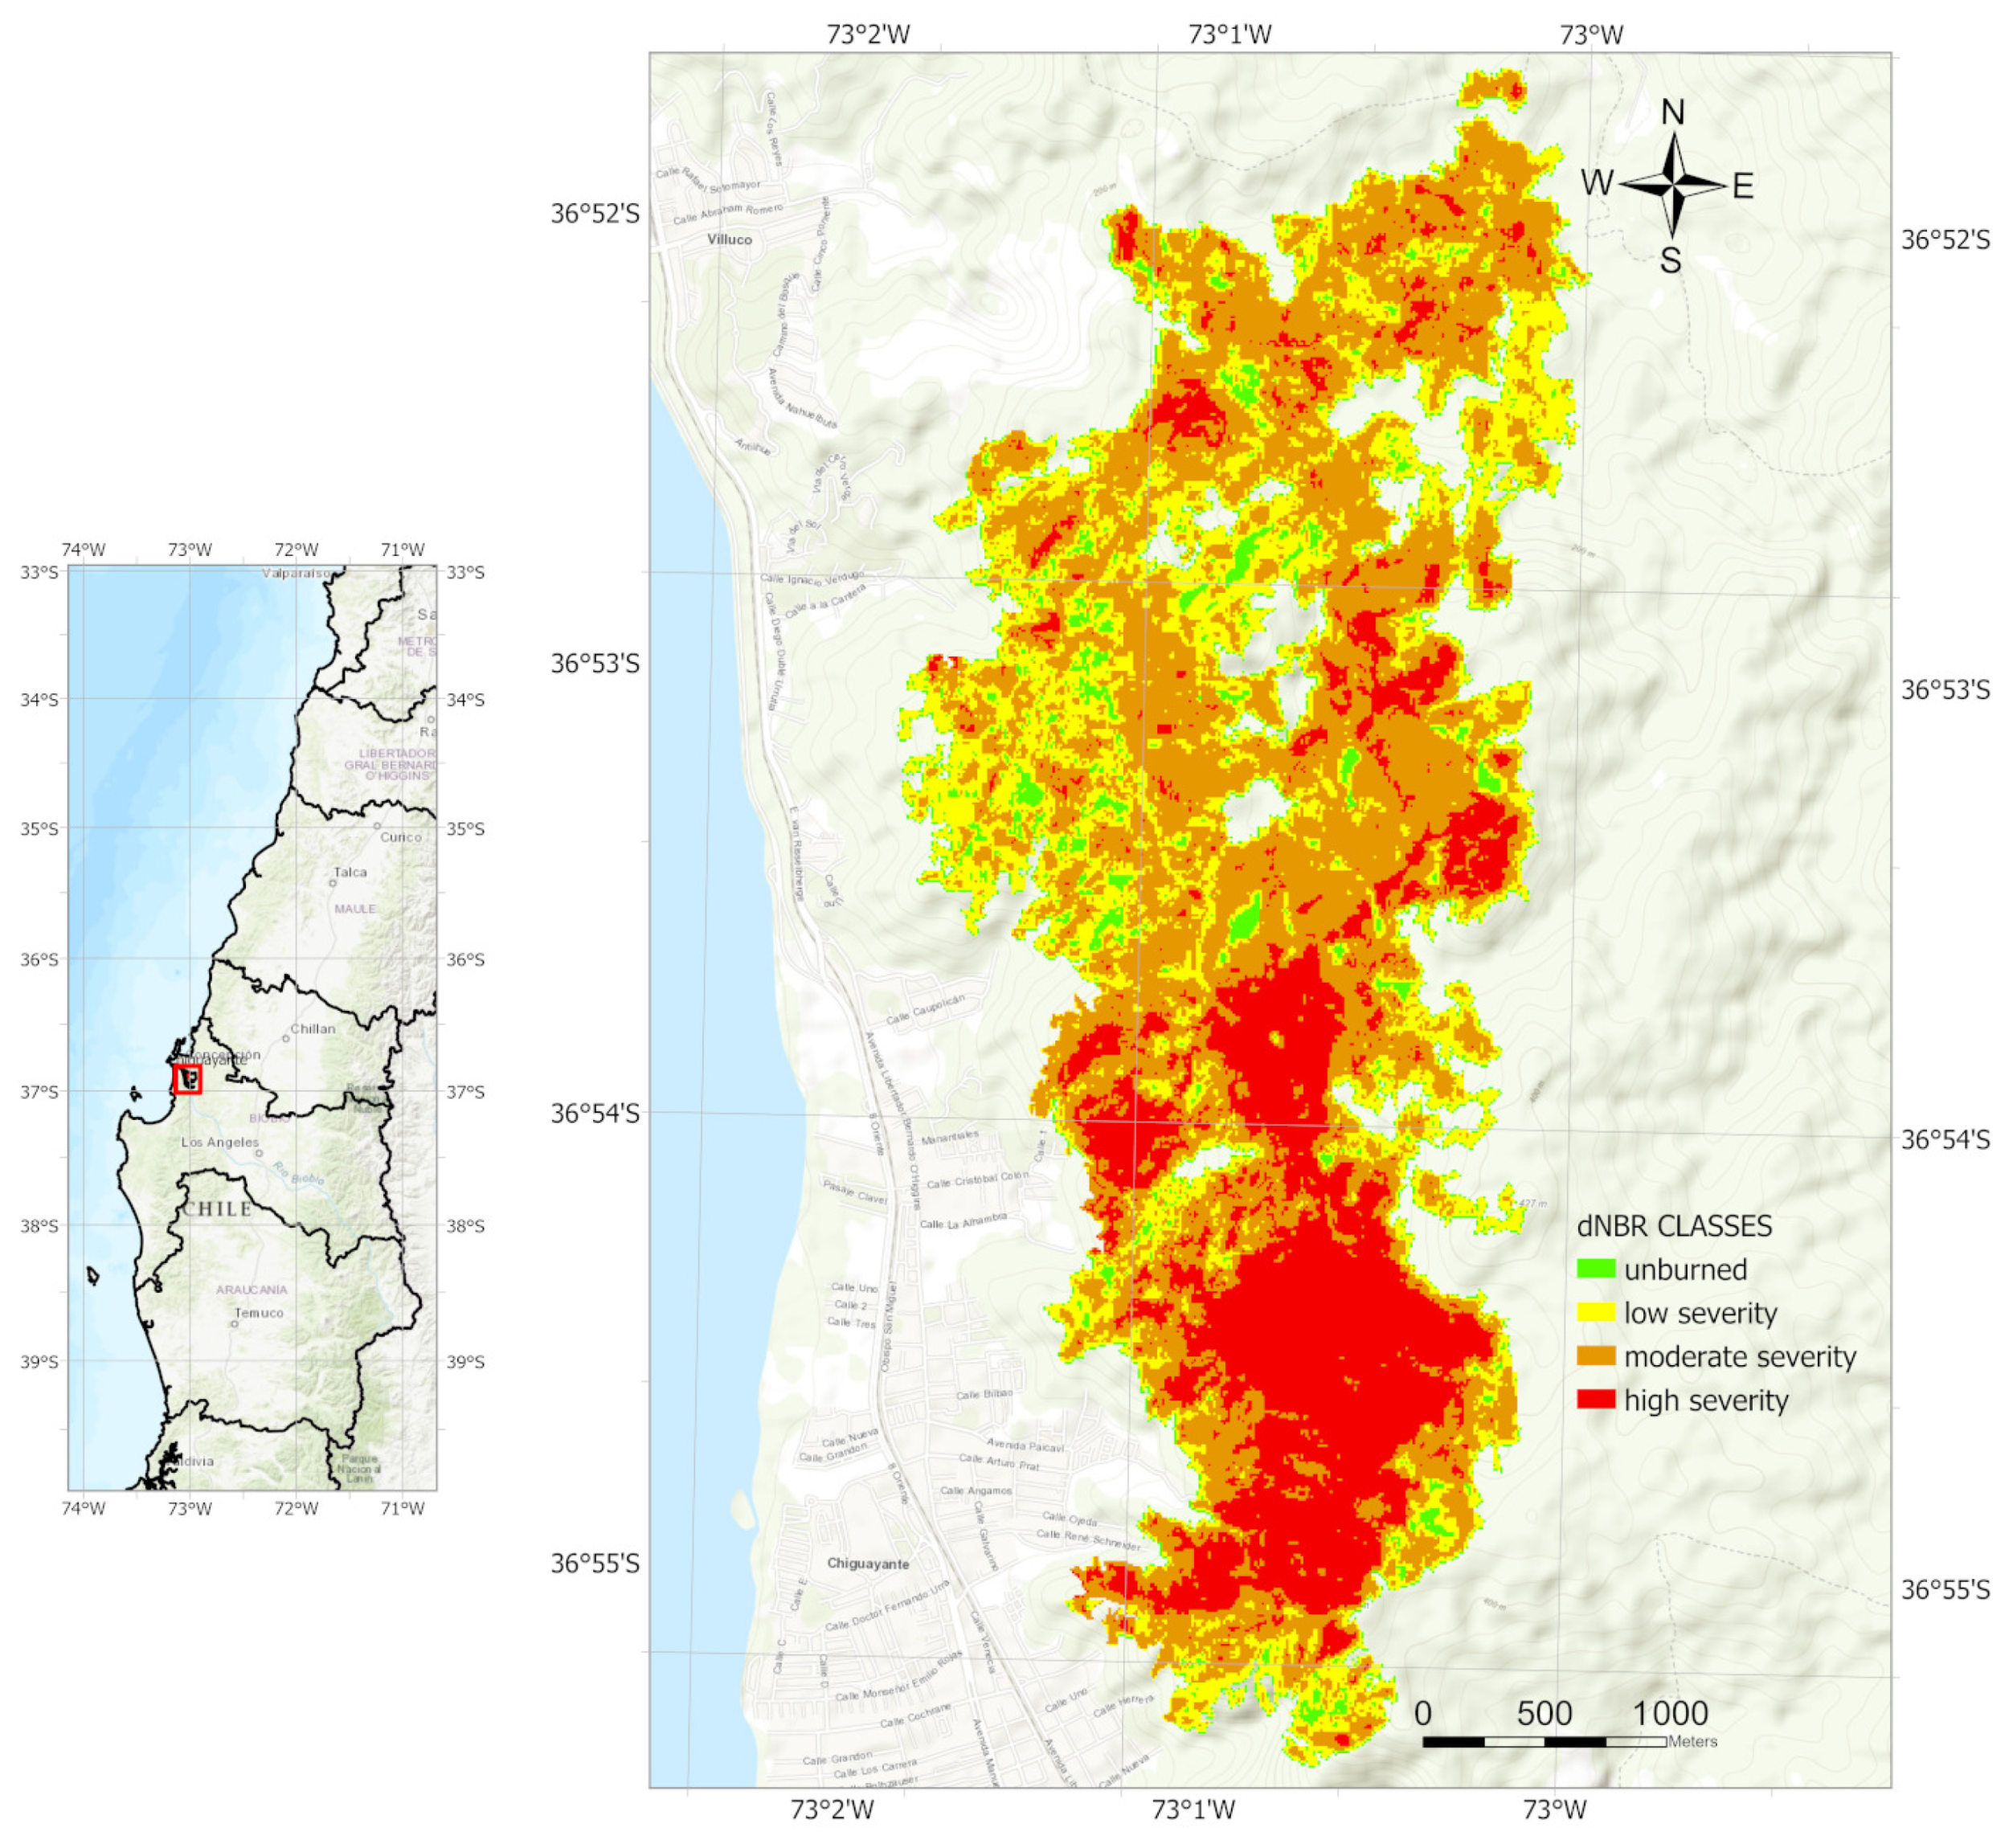
2.1. Study Area

The study area has a warm-summer Mediterranean climate, and a warm-summer Mediterranean climate with coastal influence (Csb and Csbi according to Köppen climate classification [16]). Annual precipitation in the area ranges from 630 to 1200 mm and a summer precipitation is less than 60 mm. The annual mean temperature is between 12 and 14 °C, whereas the average summer temperature ranges between 17 and 21 °C and reaches up to 38 °C. During the 2019–2020 season, we studied 12 wildfire events across three administrative regions in Chile (Maule, Ñuble, and Biobío Regions), between latitudes 34° S and 38° S. These wildfire occurrences impacted 92 stands on 23 different properties, totaling around 1700 hectares in Pinus radiata and Eucalyptus spp. forest plantations (Table 1).

2.2. Greenhouse Gas Emissions Associated with Forest Fires

GHGs associated with forest fires (L) can be estimated using Equation 2.27 proposed in [7]. This equation relates area burned (A), available fuel ( M b ), combustion factor ( C f ), and a specific emission factor for every greenhouse gas ( G e f ) as:
L fire = A × M b × C f × G e f × 10 3
There is usually information regarding the burned area (A), which is generally generated from remote sensing products. Available fuel ( M b ), i.e., biomass in forest plantations, is estimated by knowing planted species and age (sometimes age-classes) and using ad hoc allometric equations. However, the fraction of fuel that is actually combusted, as indicated by the C f in this model, is not easily available. Finally, the specific emission factors ( G e f ) are based on the ones proposed by [17], as suggested by [7].

2.3. Fire Severity

Fire severity was assessed by estimating the Normalized Burn Ratio (NBR) (Figure 1). The NBR is a remote sensing product calculated from the near-infrared and short-wave infrared reflectances proposed by [18] and widely used to assess fire severity using remote sensing [19,20]. The difference between pre-fire and post-fire NBR was used to calculate the delta NBR (dNBR), as a measurement of fire severity. To accomplish this this, Sentinel 2 satellite images were selected from dates just before and after the event. Sentinel 2 is a constellation of two satellites (Sentinel 2A and Sentinel 2B), with a spatial resolution of 10 m on bands 8 (near infrared (NIR), central wavelength 832.8 nm) and 20 m on band 11 (short wave infrared (SWIR), central wavelength 1613.7 nm) [21]. On every pre-fire and post-fire scene, the Normalized Burn Ratio (NBR) was calculated as the normalized difference of NIR and SWIR spectral bands using the following equation:
NBR = NIR SWIR NIR + SWIR
After this, the dNBR was calculated as follows:
dNBR = NBR pre - fire NBR post - fire

2.4. Field Sampling

To propose a country-derived C f and its relationship with species, age and fire severity, several field studies were undertaken throughout the 2019–2020 fire season to assess the amount of biomass and carbon loss on the various biomass components. Field assessments were conducted 2 or 3 weeks after wildfires of varying severity, in P. radiata and Eucalyptus spp. forest plantations of varying ages. Damage percentages on various biomass components were correlated with biomass proportions and then related to species, age, and fire severity to determine the C f for those conditions.
Field sampling was performed dynamically during the fire season on every fire event that affected and area above 10 ha, considering all the different stands and farms affected by that particular fire event. The sampling used a fixed density of 4 sampling points per hectare. On every fire event, sampling points were selected using a Latin hypercube sampling considering three stratification variables: land use, stand age, and fire severity. This sampling strategy provides a fair characterization of the strata contained in the data by covering the range of the three grouping variables [22,23]. These three strata have been categorized as follows: land use was categorized as Pinus or Eucalyptus plantations, and age was defined as young (0 to 4 years old), medium (5 to 15 years old), and mature (more than 15 years old) plantations for Pinus plantations, whereas the age of Eucalyptus plantations was divided into three categories, young (0 to 2 years old), medium (3 to 6 years old), and mature (more than 6 years old). Finally, dNBR images were classified as ‘unburned’ when the dNBR was below 0.1 , ‘low severity’ when the dNBR was between 0.1 and 0.27 , ‘moderate severity’ when the dNBR was between 0.27 and 0.66 , and ‘high severity’ when the dNBR was greater than 0.66.
In the field, trees within a 250-m radius of the sampling location were measured. The number of trees in each sampling plot was counted, as well as the condition of the forest floor. Furthermore, each tree’s height, proportion of damage to bark (considering height of damaged bark but also transverse section of damage), proportion of damage to stem, leaves, branches, and roots were all recorded.

2.5. Above-Ground Biomass Carbon Loss

To calculate the combustion factor ( C f ), the proportion ofdamage to each component was weighted, considering the proportion of the component to the above-ground biomass, using the following equation:
C f = d s × w s + d b a × w b a + d b r × w b r + d l v × w l v
where d s , d b a , d b r , and d l v are the observed damage to stem, bark, branches, and leaves, respectively. The weighting coefficients (i.e., w s , w b a , w b r , and w l v ) were estimated using allometric equations based on the height of the trees following the procedure presented by Sandoval et al. [24].

2.6. A Model to Predict the Combustion Factor

The model to estimate C f for plantations must be compatible with information that can be easily acquired by users and/or supplied publicly by some state agency or other data provider. Nationwide statistics about wildfires are gathered and provided by CONAF (Corporación Nacional Forestal), the forest agency from Chile’s Ministry of Agriculture. The information reported includes coordinates of the ignition, along with all the administrative information, e.g., region, province, township, and also dates and times for different stages of the wildfire control such as detection, first attack, extinction, etc. Relevant to this model is the information about burned areas and land uses that have been affected by wildfires. The data separate between areas of plantations (P. radiata, Eucalyptus spp.) and natural vegetation, with three age classes (years since planting) for P. radiata (1–10, 11–17, and ≥18), while burned Eucalyptus spp. areas are aggregated into one because the information provided by CONAF did not include data about details about Eucalyptus spp age. At the same time, this CONAF did not include fire severity or other information that can be used to separate areas by fire intensity or severity, although dNBR was considered as a potential predictive variable for the predictive models.
Individual tree measurements on 176 sampling plots at the designated species–age–fire severity groups were included in the database used to calibrate the predictive model; however, not all combinations were sampled. Aside from C f , C f (weighted average), dNBR, age, species, and plot biomass, the data included information about each plot’s geographic and administrative location, such as stand, farm, province, and region, as well as codes to link the plot to a file of digital pictures taken on-site when sampling the burned stands. Other standard plot-level characteristics, such as height, basal area, and number of trees, were not considered as possible predictive variables since the model must be applied to all plantation wildfires throughouta year, and detailed stand data for all burnt areas are not available. Age or age class, species (P. radiata or Eucalyptus spp.), and dNBR are therefore possible predictive factors for C f . Pruning was also evaluated as a possible predictive variable using a dummy (0/1) variable to assess the contribution of pruned trees on C f , but it was not included in the suggested models.
Because the plots were measured as clusters within stands, and stands are nested within farms, the models use a mixed-model approach to account for the likely correlation among plots measured within stands and properties, also taking into account random effects for some parameters in the model. Simple linear regression models fitted during the exploration stage show that log transformation (Napierian/natural) of the dependent variable ( C f ) consistently improves the model fit. As a result, the mixed model tested combinations of independent variables and random effects at the stand and farm level for the intercept ( β 0 ) and beta parameters associated with the independent variables. Furthermore, we tested separate models for P. radiata and Eucalyptus spp. and a single model where a dummy variable was used to account for differences between these two species.
The models were evaluated for fit by comparing the Akaike Information Criterion (AIC) [25] and taking into account the statistical significance and logic of the parameters, as well as the significance of the parameters in the variance–covariance matrix of random errors.
The basic notation of the model is ln ( C f ) = β 0 + β i X i , where X represents age, dNBR, or its log transformation, and for the model it uses a dummy variable for species. The models were fitted using PROC MIXED in the Software SAS (Version 9.4, Cary, North Carolina, USA).

3. Results

Tree and Plot Data

The data collected on trees were aggregated at the plot level in order to fit a model, where C f represents an area-level estimate of burned biomass more than a tree-level fraction. The potential predictive models for C f were used to estimate greenhouse gas emissions associated with plantation burned areas and therefore used nationwide wildfires statistics, which only reports burned areas by age-classes on plantations. Therefore, Table 2 shows simple descriptive statistics for this database.
According to our results, C f is correlated with age and dNBR, especially for P. radiata, and weakly correlated with dNBR, as shown in Figure 2.
Considering that the models using dNBR are more difficult to use, since they require estimating/measuring the dNBR for the area before and after the wildfire, we decided to use the model with stand-level random effects to estimate the value for C f (Table 3). Then, the model is
ln C f i j = β 0 + β 1 × ln ( age i j ) + β 2 × b i n S p i j + β 0 · j
where ln C f i j is the value of the combustion factor for plot i within stand j, age i j is the age (years) of the trees in plot i within stand j, and b i n S p i j is a dummy variable specifying the species in stand j. The term β 0 · j is a random deviation from the population-level β 0 , representing that each stand has a different intercept. Table 4 shows the value for the parameters β i .
The residuals in Figure 3 show the random distribution around the mean = 0 and a reasonable normal distribution, as expected.
The model predicts C f for plantations of P. radiata and Eucalyptus spp. in Chile, for any age between plantation and the typical harvest ages for both species (20–25 year for the former and 8–12 years for the latter). According to the structure of the models, C f declines with age for both species, and P. radiata losses are anticipated to be greater at the same age. Figure 4 depicts the shape of the models for a given stand of these species.

4. Discussion

According to the National Inventory of Greenhouse Gasses [12], the combustion factor used in Chile to report emissions associated with forest fires was 0.45. This value is the one suggested by IPCC [7] for the category “All ‘other’ temperate forests” and is reported as a mean value of 0.45 with a standard deviation (sd) of 0.16. One of the sources for this value evaluated the combustion completeness using post-burn surveys on three sites of secondary mixed deciduous forests [26]. The overall combustion factors for all the three sites were 0.30, 0.20, and 0.16, with mixed leaf litter and branch material as the pool that contributed to most of the combustion. These values are lower than 0.45 and are similar to the ones found from the evaluation of 176 sites on this research, with mean values for C f of 0.20 and 0.40 for P. radiata and Eucalyptus spp., respectively. If we compare the value used in Chile for reporting [12] with the values proposed by this research, we can note that emissions from fire are overestimated for fires occurring on Eucalyptus spp. plantations. Emissions are also overestimated on P. radiata plantations but only for plantations over 10 years. For younger plantations, emissions are underestimated using a C f of 0.45. As shown on Figure 4, values are above this level for plantations between 1 and 3 years and close to 0.45 for ages up to 5 years.
The values suggested by our research are lower thanbut similar to the ones suggested by IPCC [7] for boreal forests considering wildfires in general (mean 0.40, sd 0.06) [27] and crown fire (mean 0.43, sd 0.21) [28], but higher than the one suggested for surface fires (mean 0.15, sd 0.08) [28]. When compared with C f values suggested for slash-and-burn, the latter are higher. For Eucalyptus sp. forests felled and burned (land clearing fires), the C f reaches up to 0.49 [29]. Similar values are proposed for primary tropical forests (0.45, 0.50), secondary tropical forests (0.46, 0.50, 0.67), boreal forests (0.59), and other temperate forests (0.62) [7]. Combustion completeness is higher because, in the practice of slash and burn, the vegetation is downed and left to dry before burning. Similarly, the proportion of biomass burned is much higher in other vegetation types. For shrublands, the mean value suggested is 0.72 with an sd of 0.25. For savanna woodlands, a mean value of 0.40 with an sd of 0.22 for early dry-season burns, and a mean of 0.74 and an sd of 0.14 for mid/late dry-season burns. For savanna grasslands, the mean value is 0.74 for early dry season burns and 0.77 with an sd of 0.26 for mid/late dry season burns [7]. The increase in the value of the C f for these different types of vegetation is because burnt material is mainly composed of grasses and some sparse trees.
In Chile, emissions from forest fires are typically between 4 and 6% of total emissions of the LULUCF sector [12]. Nevertheless, during the mega-fires of 2017, emissions from forest fires peaked to 39% of the emissions of the sector. This implies that on some occasions, there may be a large impact of the C f used, and this translates to a greater uncertainty in the national greenhouse gas inventory and in the estimation of the carbon balance at the national scale. This is crucial because it is anticipated that as a result of climate change, more frequent occurrences of these catastrophic events would occur [30].

4.1. Model Performance

Different combinations of independent variables and random effects on the β i from the models were evaluated, using age, dNBR, their log transformations, and species, represented by a dummy variable ( b i n S p ) defined as 1 for Pinus radiata and 0 for Eucalyptus spp. During the exploration stage of model fitting, where different expressions for the independent and dependent variables were tested and we studied approaches to model errors’ auto-correlation and random effects, the question was raised regarding whether or not it is appropriate to fit separate models for P. radiata and Eucalyptus spp. We compared the performance of separate models for each species with the model finally selected, and the results indicate that Cf estimates are practically the same for P. radiata at all ages, while for Eucalyptus spp., there is a difference at earlier ages but not for the age considered to be representative of this species (13y). Therefore, we decided to propose a single model to keep it simple.
Random effects were also studied at the stand and farm levels. The best models, according to the results, were those with a random effect associated with the intercept ( β 0 ), either for plots within a certain stand or for plots inside a given farm. Table 3 shows the best-fitting models, all of which predict the natural log of C f .
According to the results (Table 3), there were local effects that needed to be accounted for in order to improve model fitting. The fit of the most basic model, in which age and species were predictors and there was a specific intercept for each farm, which was a cluster of stands, was improved by incorporating a specific intercept at the stand level, and this improvement was statistically important (p-value 0.001 ). When stand-level random effects were taken into account, the models that added a predictor dNBR exhibited the same result, a statistically substantial improvement (p-value = 0.001 ) in model fit. However, as presented in Figure 2, C f and dNBR are weakly correlated.

4.2. Relationship between Combustion Factor Values and Age on Plantations

The values for C f are reasonably associated with fire severity since the loss or consumption of biomass is related to fire extent and intensity, among other factors. A pattern in our data that is expressed in the models is that younger plantations have greater values of C f for both species. A study on the stand age’s effects on fire severity [31] concluded, that at least for Eucalyptus regnans stands in Australia, there is a strong relationship between fire severity and stand age. The shape of the function describing fire severity (probability of canopy consumption) is highly nonlinear, with a steep increase in fire severity for very young stands, reaching a maximum at about 15 years, but also decreasing rapidly after that age. This shape resembles the results in our data, with the only exception of the initial part for very young ages. The general pattern indicates that younger stands, for this species, are affected more severely than older stands, which is consistent with our results and results for conifer plantations in Oregon and California [32].
Given the sampling data with which the models were fitted, which include few young stands, these simple models are a good first approach to C f estimates as a function of stand age, which are in general consistent with published results. These C f estimates can be improved as long as more data are collected, covering all possible combinations of land use, fire severity, and stand age.

4.3. Combustion Factor Values’ Aggregates to Age Classes Used in Chile

CONAF provides official information for wildfire areas for all reported fires in Chile. The age of plantations impacted by wildfires is only recorded for P. radiata, whereas the areas for Eucalyptus spp. are only reported as a cumulative amount. P. radiata’s age classes are (in years) 0–10, 11–17, and ≥18. The models’ predictions and proposed revised values for C f utilize the mean age of these age-classes for P. radiata and 13y for Eucalyptus spp. (average age of samples). The proposed values, rounded to the nearest integer, are presented in Table 5.

5. Conclusions

The model uses very simple predictive variables, age and species, because statistics in Chile for burnt areas in plantations are only provided by age classes and species. Details about forest management, tree density, productivity, and fire intensity are not registered in the statistics, all of which can be used to make better estimates of biomass and then C f .
Some of these variables may be aggregated into reports on burnt areas in the future, but there is no indication of change in the disaggregation for Eucalyptus spp. plantation areas, which can be used to acquire separate values in C f for young and older plantations, or the addition of dNBR or dNBR-classes in the set of variables reported for each wildfire, to use the better model (AIC = 44.1).
The AIC for the best non-mixed, simple regression model was 116.5, and the models presented in this report show the importance of stand factors in the estimation of C f values, only adding a factor for nesting in the statistical model, improving the model’s fit significantly compared to non-random-effects models or the farm-level nesting factor.

Author Contributions

Conceptualization, G.F.O., H.G. and H.B.; methodology, G.F.O. and H.G.; investigation, G.F.O., H.G. and C.J.-S.; data curation, H.G.; writing—original draft preparation, G.F.O., H.G. and H.B.; writing—review and editing, G.F.O., H.G., H.B., R.S., P.S., C.J.-S. and F.S.; visualization, G.F.O., H.G. and C.J.-S.; project administration, P.S. and F.S.; funding acquisition, P.S., G.F.O. and F.S. All authors have read and agreed to the published version of the manuscript.

Funding

This research received no external funding.

Data Availability Statement

The data presented in this study are available on request from the corresponding author.

Acknowledgments

The authors would like to thank Juan Carlos Sepulveda of Forestal Arauco S.A. for their assistance with the fieldwork. Furthermore, we would like to thank Yasna Rojas (Chilean Forestry Institute—INFOR) and the participants of the Workshop “Actualización del estado del arte de parámetros asociados a las emisiones de incendios para el inventario de gases de efecto invernadero” (“Update of state-of-the-art parameters associated with fire emissions for the greenhouse gas inventory”) (27 October 2021) for providing feedback and discussing the results of this work.

Conflicts of Interest

The authors declare no conflict of interest.

References

  1. Ni, Y.; Eskeland, G.S.; Giske, J.; Hansen, J.P. The global potential for carbon capture and storage from forestry. Carbon Balance Manag. 2016, 11, 3. [Google Scholar] [CrossRef] [PubMed] [Green Version]
  2. Nunes, L.J.; Meireles, C.I.; Pinto Gomes, C.J.; Almeida Ribeiro, N.M. Forest Contribution to Climate Change Mitigation: Management Oriented to Carbon Capture and Storage. Climate 2020, 8, 21. [Google Scholar] [CrossRef] [Green Version]
  3. Olmedo, G.F.; Guevara, M.; Gilabert, H.; Montes, C.R.; Arellano, E.C.; Barría-Knopf, B.; Gárate, F.; Mena-Quijada, P.; Acuña, E.; Bown, H.E.; et al. Baseline of Carbon Stocks in Pinus radiata and Eucalyptus spp. Plantations of Chile. Forests 2020, 11, 63. [Google Scholar] [CrossRef]
  4. Brando, P.M.; Paolucci, L.; Ummenhofer, C.C.; Ordway, E.M.; Hartmann, H.; Cattau, M.E.; Rattis, L.; Medjibe, V.; Coe, M.T.; Balch, J. Droughts, Wildfires, and Forest Carbon Cycling: A Pantropical Synthesis. Annu. Rev. Earth Planet. Sci. 2019, 47, 555–581. [Google Scholar] [CrossRef]
  5. Walker, X.J.; Baltzer, J.L.; Cumming, S.G.; Day, N.J.; Ebert, C.; Goetz, S.; Johnstone, J.F.; Potter, S.; Rogers, B.M.; Schuur, E.A.; et al. Increasing wildfires threaten historic carbon sink of boreal forest soils. Nature 2019, 572, 520–523. [Google Scholar] [CrossRef]
  6. Lindenmayer, D.B.; Yebra, M.; Cary, G.J. Perspectives: Better managing fire in flammable tree plantations. For. Ecol. Manag. 2023, 528, 120641. [Google Scholar] [CrossRef]
  7. IPCC. Chapter 2 Generic Methodologies Applicable to Multiple Land-Use Categories. In 2019 Refinement to the 2006 IPCC Guidelines for National Greenhouse Gas Inventories; 2019; pp. 1–59. Available online: https://www.ipcc.ch/report/2019-refinement-to-the-2006-ipcc-guidelines-for-national-greenhouse-gas-inventories/ (accessed on 30 November 2022).
  8. Giglio, L.; Boschetti, L.; Roy, D.P.; Humber, M.L.; Justice, C.O. The Collection 6 MODIS burned area mapping algorithm and product. Remote. Sens. Environ. 2018, 217, 72–85. [Google Scholar] [CrossRef]
  9. Andela, N.; Morton, D.C.; Giglio, L.; Paugam, R.; Chen, Y.; Hantson, S.; van der Werf, G.R.; Randerson, J.T. The Global Fire Atlas of individual fire size, duration, speed and direction. Earth Syst. Sci. Data 2019, 11, 529–552. [Google Scholar] [CrossRef] [Green Version]
  10. CONAF. Análisis de la Afectación y Severidad de los Incendios Forestales Ocurridos en Enero y Febrero de 2017 Sobre los Usos de Suelo y los Ecosistemas Naturales Presentes Entre las Regiones de Coquimbo y Los Ríos de Chile. Technical Report. 2017. Available online: https://www.conaf.cl/tormenta_de_fuego-2017/INFORME-AFECTACION-Y_SEVERIDAD-DE-INCENDIOS-FORESTALES-VERANO-2017-SOBRE-ECOSISTEMAS-VEGETACIONALES-CONAF.pdf (accessed on 30 November 2022).
  11. de la Barrera, F.; Barraza, F.; Favier, P.; Ruiz, V.; Quense, J. Megafires in Chile 2017: Monitoring multiscale environmental impacts of burned ecosystems. Sci. Total Environ. 2018, 637–638, 1526–1536. [Google Scholar] [CrossRef]
  12. Ministry of the Environment. Informe del Inventario Nacional de Chile 2020: Inventario Nacional de Gases de Efecto Invernadero y Otros Contaminantes Climáticos 1990–2018; Technical report; Climate Change Office: Santiago, Chile, 2020.
  13. IPCC. Chapter 4 Forest land. Refinement 2006 IPCC Guidelines for National Greenhouse Gas Inventories 2019. Volume 4, p. 194. Available online: https://www.ipcc.ch/report/2019-refinement-to-the-2006-ipcc-guidelines-for-national-greenhouse-gas-inventories/ (accessed on 30 November 2022).
  14. Herold, A.; Monni, S.; Lin, E.; Meyer, C.; Flugsrud, K. Methodological Choice and Identification of Key Categories; Institute For Global Environmental Strategies: Kanagawa, Japan, 2006. [Google Scholar]
  15. Russell-Smith, J.; Murphy, B.P.; Meyer, C.M.; Cook, G.D.; Maier, S.; Edwards, A.C.; Schatz, J.; Brocklehurst, P. Improving estimates of savanna burning emissions for greenhouse accounting in northern Australia: Limitations, challenges, applications. Int. J. Wildland Fire 2009, 18, 1–18. [Google Scholar] [CrossRef]
  16. Sarricolea, P.; Herrera-Ossandon, M.; Meseguer-Ruiz, Ó. Climatic regionalisation of continental Chile. J. Maps 2017, 13, 66–73. [Google Scholar] [CrossRef] [Green Version]
  17. Andreae, M.O.; Merlet, P. Emission of trace gases and aerosols from biomass burning. Glob. Biogeochem. Cycles 2001, 15, 955–966. [Google Scholar] [CrossRef] [Green Version]
  18. Keeley, J.E. Fire intensity, fire severity and burn severity: A brief review and suggested usage. Int. J. Wildland Fire 2009, 18, 116–126. [Google Scholar] [CrossRef]
  19. Escuin, S.; Navarro, R.; Fernandez, P. Fire severity assessment by using NBR (Normalized Burn Ratio) and NDVI (Normalized Difference Vegetation Index) derived from LANDSAT TM/ETM images. Int. J. Remote Sens. 2008, 29, 1053–1073. [Google Scholar] [CrossRef]
  20. French, N.H.; Kasischke, E.S.; Hall, R.J.; Murphy, K.A.; Verbyla, D.L.; Hoy, E.E.; Allen, J.L. Using Landsat data to assess fire and burn severity in the North American boreal forest region: An overview and summary of results. Int. J. Wildland Fire 2008, 17, 443–462. [Google Scholar] [CrossRef]
  21. Drusch, M.; Del Bello, U.; Carlier, S.; Colin, O.; Fernandez, V.; Gascon, F.; Hoersch, B.; Isola, C.; Laberinti, P.; Martimort, P.; et al. Sentinel-2: ESA’s Optical High-Resolution Mission for GMES Operational Services. Remote Sens. Environ. 2012, 120, 25–36. [Google Scholar] [CrossRef]
  22. McKay, M.D.; Beckman, R.J.; Conover, W.J. A Comparison of Three Methods for Selecting Values of Input Variables in the Analysis of Output from a Computer Code. Technometrics 1979, 21, 239–245. [Google Scholar]
  23. Minasny, B.; McBratney, A.B. A conditioned Latin hypercube method for sampling in the presence of ancillary information. Comput. Geosci. 2006, 32, 1378–1388. [Google Scholar] [CrossRef]
  24. Sandoval, S.; Montes, C.R.; Olmedo, G.F.; Acuña, E.; Mena-Quijada, P. Modelling above-ground biomass of Pinus radiata trees with explicit multivariate uncertainty. For. Int. J. For. Res. 2022, 95, 380–390. [Google Scholar] [CrossRef]
  25. Sakamoto, Y.; Ishiguro, M.; Kitagawa, G. Akaike Information Criterion Statistics; D. Reidel: Dordrecht, The Netherlands, 1986; Volume 81, p. 26853. [Google Scholar]
  26. Prasad, V.K.; Kant, Y.; Gupta, P.K.; Sharma, C.; Mitra, A.P.; Badarinath, K.V. Biomass and combustion characteristics of secondary mixed deciduous forests in Eastern Ghats of India. Atmos. Environ. 2001, 35, 3085–3095. [Google Scholar] [CrossRef]
  27. Kasischke, E.S.; French, N.H.; Bourgeau-Chavez, L.L.; Christensen, N., Jr. Estimating release of carbon from 1990 and 1991 forest fires in Alaska. J. Geophys. Res. Atmos. 1995, 100, 2941–2951. [Google Scholar] [CrossRef]
  28. Stocks, B. Fire behavior in immature jack pine. Can. J. For. Res. 1987, 17, 80–86. [Google Scholar] [CrossRef]
  29. Stewart, H.; Flinn, D. Nutrient losses from broadcast burning of Eucalyptus debris in north-east Victoria. Aust. For. Res. 1985, 15, 321–332. [Google Scholar]
  30. Di Virgilio, G.; Evans, J.P.; Blake, S.A.; Armstrong, M.; Dowdy, A.J.; Sharples, J.; McRae, R. Climate change increases the potential for extreme wildfires. Geophys. Res. Lett. 2019, 46, 8517–8526. [Google Scholar] [CrossRef]
  31. Taylor, C.; McCarthy, M.A.; Lindenmayer, D.B. Nonlinear Effects of Stand Age on Fire Severity. Conserv. Lett. 2014, 7, 355–370. [Google Scholar] [CrossRef] [Green Version]
  32. Thompson, J.R.; Spies, T.A.; Olsen, K.A. Canopy damage to conifer plantations within a large mixed-severity wildfire varies with stand age. For. Ecol. Manag. 2011, 262, 355–360. [Google Scholar] [CrossRef]
Figure 1. Right: ’MIRADOR STA JUSTINA’ fire location (red frame) in relation with Central Chile. Left: Example of fire severity map as measured with dNBR for the ’MIRADOR STA JUSTINA’ fire, which affected more than 5 ha. during 2019. The map shows the area unburned and the areas affected with low, moderate, and high severity.
Forests 14 00403 g001
Figure 2. Relationship between the amount of biomass that is actually combusted during a wildfire ( C f ) and Age (top) and between C f and fire severity measured with remote sensing (dNBR) (bottom).
Forests 14 00403 g002
Figure 3. Diagnostic plots for the residuals of the proposed models: normal Q-Q plot comparing the probability distribution of the residuals with a normal distribution (a), histogram of the distribution of the residuals classified using the fire severity (b), and Pearson conditional residuals compared with the predicted value (c).
Forests 14 00403 g003
Figure 4. Shape of the combustion factor ( C f ) estimated using the proposal model using age, species, and a given stand, for P. radiata (red) and Eucalyptus spp. (blue).
Forests 14 00403 g004
Table 1. Wildfire events sampled during the summer seasons of 2019–2020. The table shows the farm affected, the area affected by fire, species present, and number of sampling plots.
Event NameFarmLongitudeLatitudeEventPre-FirePost-FireBurnedPlanted# of
Date 1NBR 1NBR 1Area [ha]Species 2Samples
AGUADA DOMKEFarm_P−66.18842−36.0546127/01/2024/01/2030/02/2026.97PR6
CARMEN_HUALQUIFarm_F−66.92295−37.0434130/12/1920/12/1904/01/2037.84ESP4
CARMEN_HUALQUIFarm_F−66.92705−37.0401330/12/1920/12/1904/01/2043.27PR13
CARMEN_HUALQUIFarm_Q−66.91797−37.0414130/12/1920/12/1904/01/201.16ESP1
CONG SN FRANCIFarm_C−66.89688−37.0288102/02/2029/01/2008/02/2010.64ESP3
CONG SN FRANCIFarm_G−66.90031−37.0166102/02/2029/01/2008/02/20239.29ESP44
CONG SN FRANCIFarm_G−66.90092−37.0156002/02/2029/01/2008/02/209.39PR5
CONG SN FRANCIFarm_Q−66.90786−37.0247402/02/2029/01/2008/02/203.89ESP1
CONG_LEONERAFarm_M−65.93062−35.2715229/12/1920/12/1904/01/201.44PR1
CONG_LEONERAFarm_S−65.93971−35.2722929/12/1920/12/1904/01/200.30PR2
EL PERAL MUNOZFarm_O−65.94716−34.7106027/01/2014/01/2008/02/200.25ESP1
EL PERAL MUNOZFarm_O−65.94220−34.7058827/01/2014/01/2008/02/206.78PR2
LA COLCHA_2Farm_T−67.34266−37.4226923/12/1920/12/1930/12/1915.07ESP5
LA COLCHA_2Farm_T−67.34087−37.4184123/12/1920/12/1930/12/1912.86PR2
LA COLCHA_2Farm_U−67.33028−37.4016823/12/1920/12/1930/12/194.38ESP1
LA COLCHA_2Farm_U−67.33057−37.4041223/12/1920/12/1930/12/1917.97PR4
LOS CAJONESFarm_N−65.83813−35.6798607/02/2029/01/2013/02/2046.47PR11
LOS ENCINOSFarm_A−66.94721−37.0120230/12/1920/12/1904/01/2012.98ESP4
LOS ENCINOSFarm_B−66.93243−37.0007030/12/1920/12/1904/01/2025.87ESP14
LOS ENCINOSFarm_D−66.91926−37.0291330/12/1920/12/1904/01/204.72ESP2
LOS ENCINOSFarm_E−66.95307−37.0263230/12/1920/12/1904/01/2076.44ESP15
LOS ENCINOSFarm_F−66.92089−37.0354330/12/1920/12/1904/01/2024.69ESP6
LOS ENCINOSFarm_F−66.92920−37.0335430/12/1920/12/1904/01/202.60PR2
LOS ENCINOSFarm_G−66.91431−37.0076930/12/1920/12/1904/01/2080.03ESP14
LOS ENCINOSFarm_Q−66.91479−37.0358930/12/1920/12/1904/01/2037.32ESP15
LOS ENCINOSFarm_R−66.94291−37.0256230/12/1920/12/1904/01/201.15ESP2
LOS ENCINOSFarm_R−66.93255−37.0269030/12/1920/12/1904/01/20138.31PR37
MIRADOR STA JUSTINAFarm_H−67.00712−36.9150624/01/2014/01/2029/01/205.31ESP6
PIDENCOFarm_V−66.93248−38.1655924/01/2014/01/2008/02/2036.99PR5
RESERVA AL BOLDAL_2Farm_I−64.98302−35.0051727/01/2014/01/2008/02/2089.26PR22
RESERVA AL BOLDAL_2Farm_J−65.02211−35.0000027/01/2014/01/2008/02/206.23PR2
RESERVA AL BOLDAL_2Farm_K−64.98454−34.9950027/01/2014/01/2008/02/203.46PR6
RESERVA AL BOLDAL_2Farm_L−64.99457−35.0022427/01/2014/01/2008/02/2014.55ESP9
RESERVA AL BOLDAL_2Farm_L−65.00494−34.9898627/01/2014/01/2008/02/2045.55PR18
STA ANA FBBFarm_W−66.14083−36.7262815/01/2004/01/2024/01/20258.08PR27
1 Dates are in Day/Month/Year format. 2 Planted species are Pinus radiata (PR) and Eucalyptus spp.
Table 2. Descriptive statistics of the database collected during the fire seasons in 2019–2020.
Variable# of plotsMinMaxMeanMedianVarianceStandard Deviation
Pinus radiata
Age, y832.029.012.812.015.23.9
C f , %839.0365.3619.8718.2893.969.69
dNBR830.100870.915760.456990.432610.033960.18430
Eucalyptus spp.
Age, y931.024.011.611.052.27.2
C f , %9316.47100.0040.0927.32732.9127.07
dNBR930.054591.185880.431810.383810.061310.24760
Table 3. Comparison of the quality of the statistical models fitted for the estimation of the combustion factor, its variables, and random effects.
IndependentRandomAIC
VariablesEffect
ln ( age ) , binSpFarm82.2
ln ( age ) , binSpStand72.8
ln ( age ) , binSp, dNBRFarm69.8
ln ( age ) , binSp, dNBRStand44.1
Table 4. Estimates for model parameters.
EffectEstimateError β i t-ValuePr > t
Intercept3.71130.07934446.82>0.0001
ln ( age ) −0.27150.0178129−15.24>0.0001
b i n S p 0.40430.06231296.49>0.0001
Table 5. C f values’ aggregates to age classes used in Chile.
SpeciesAge-ClassAge C f CI 1 LowerCI 1 Upper C f Range
BoundBoundAge-Class
P. radiata1–1050.410.350.450.63–0.33
P. radiata11–17140.310.260.340.33–0.29
P. radiata>18220.270.240.30
Eucalyptus spp.1–20130.210.180.230.42–0.18
1 CI: confidence interval.
Disclaimer/Publisher’s Note: The statements, opinions and data contained in all publications are solely those of the individual author(s) and contributor(s) and not of MDPI and/or the editor(s). MDPI and/or the editor(s) disclaim responsibility for any injury to people or property resulting from any ideas, methods, instructions or products referred to in the content.

