Article

Belowground Biomass and Root:Shoot Ratios of Three Willow Cultivars at Two Sites

Department of Sustainable Resources Management, College of Environmental Science and Forestry, State University of New York, 1 Forestry Dr., Syracuse, NY 13210, USA
*
Author to whom correspondence should be addressed.
Forests 2023, 14(3), 525; https://doi.org/10.3390/f14030525
Submission received: 31 December 2022 / Revised: 2 March 2023 / Accepted: 3 March 2023 / Published: 7 March 2023

Abstract

:
Belowground biomass is an important but less studied component of energy crop systems that is essential in understanding the greenhouse gas benefits of these systems. In this study, a complete above- and belowground biomass inventory (foliage, stems, stools, coarse and fine roots) was performed on three cultivars of short-rotation willow biomass crops at two sites. Mixed models were used to analyze the proportion of biomass allocated to each component and the ratios between different components. The root:shoot (R:S) ratio, defined here as the stable unharvested biomass (stool and coarse roots) divided by the shoot biomass, averaged 0.63 (SE: +0.04). Though the portion of the plant where the willows distributed their belowground biomass varied, the R:S ratio was not significantly different across sites (p = 0.8970), cultivars (p = 0.2834), nor in the site × cultivar interaction (p = 0.8481). These results may be associated with the consistently good growth across sites and limited differences in site conditions. However, the R:S ratios were affected by the overall productivity of the stand (p = 0.0978), with higher producing stands having moderately lower ratios. This information on biomass allocation between components is essential for understanding and estimating the carbon balance of these systems and breeding and selection programs.

1. Introduction

Willow biomass crops are a potentially significant source of feedstock for the production of bioenergy and bioproducts. Shrub willow is fast growing, easy to propagate, genetically diverse, tolerant to a range of site conditions, and can produce well on marginal land [1]. Willow biomass is similar in quality to forest residues [2], so the two sources can be blended to provide a reliable and consistent feedstock for end users. Using willow as an energy feedstock has the advantages of being renewable, emitting much less carbon than fossil fuels, promoting rural development, and enhancing biodiversity [3,4,5].
For willow biomass crops, yield typically refers to the quantity of biomass in the shoots (stems) of the willow per unit area per unit time and does not include other plant parts like foliage, stool, or roots. Yield is one of the most important factors affecting the economic success of these systems (e.g., Heaton et al. [6]; Buchholz and Volk [7], Frank et al. [8]). However, when assessing environmental benefits and impacts, belowground biomass is also critically important. Root systems stabilize soil, contribute to belowground net primary productivity, add organic matter into the soil, aid in biogeochemical cycling, and, importantly for perennial energy cropping systems, provide a carbon sink in the form of belowground biomass [9,10,11,12,13,14,15,16].
Studies comparing aboveground and belowground biomass for willow biomass crops show variable results. A common metric for botanical studies like these is the root:shoot (R:S) ratio, which usually compares the mass of more stable, unharvested parts of the plant, including the stool (both the aboveground stool (AGS) and belowground stool (BGS)) and the course roots (CRs) to the mass of the shoots. Sometimes fine roots (FRs) are also added to the total root mass, but this material has a short life span and is known to turn over several times a year [17] (Unless otherwise noted, values given for R:S ratios do not include fine root (FR) biomass). Rytter [18] grew one cultivar of S. viminalis in two environments in lysimeters and examined the roots on a year-by-year basis. She found R:S ratios of 0.22 in both environments at the end of the three years, though growing conditions were not characteristic of normal field conditions due to drip irrigation and fertilization, and occasional crown containment with nylon nets. Zan et al. [19] examined one willow cultivar after the first year of the second rotation at two sites. Significant differences between total biomass carbon were found between sites, but not for fine root:shoot ratios, which were 0.5–0.6 at the low-quality site and 0.3–0.4 at the high-quality site. Since 60% of root carbon was in the FRs, R:S ratios would be about 0.2–0.4. Matthews [20] did a limited study and found that the cultivar Bowles Hybrid, whose shoots varied in age from 1–3 years and stool from 4–11 years, had R:S ratios of 0.23–0.48. However, a sample of the cultivar Gigantea, grown on 1-year rotations for the past 22 years, had an R:S of 2.7. Volk [21] found that R:S ratios for willows with two-year-old root systems differed between cultivars at a given site and across sites for a single cultivar. Different coppicing treatments did not have an impact on R:S ratios, which ranged from 0.9 + 0.4 to 6.2 + 1.2 in these young willows. However, fine roots were included in these R:S calculations and on these young plants fine roots made up 70%–90% of the total belowground biomass. Pacaldo et al. [15] found that the R:S ratio (including FRs) of a single cultivar at one site ranged from 1.0 to 1.3 for root systems that were five to 19 years old. However, the same cultivar on a 12-year-old root system had a significantly higher R:S ratio (1.9) at a different site. Cunniff et al. [10] tracked root and shoot biomass throughout the year on four cultivars at two sites over two two-year rotations. Belowground biomass fraction (BGS + CR + FR/shoot + AGS) varied between 0.1 and 0.2 at the end of both rotations at one site for all cultivars studied and between 0.2 and 0.3 at the other site for all cultivars. Shrub willow at the end of the first three-year rotation had R:S ratios of 0.11 in a study in Saskatchewan [22]. There is a limited amount of data on belowground biomass and R:S in willow systems, and differences in how R:S ratios are calculated and reported provides an additional level of complication in trying to understand potential patterns.
The ways plants allocate resources between their aboveground and belowground components are complex and environmentally dependent. The “Thornley” model [23,24] is one method that describes the way trees control their root and shoot growth. It suggests that growth will occur to balance out photosynthetic rates and nitrogen uptake rates, with carbohydrate (carbon) shortages leading to more shoots, while nitrogen deficiencies lead to more roots. Roots absorb more nutrients than nitrogen alone, but since considerable energy resources must go into nitrogen assimilation, and since nitrogen is often a limiting factor, using nitrogen works well in the model.
Stools and CRs are expected to remain stable in the soil for the crop’s lifetime [15,25], so they can be treated as stored carbon in life cycle analyses (LCA) of these systems. Shoots, leaves, and fine roots, on the other hand, have short duration cycles throughout the crop’s life, with shoots harvested every three years then utilized (e.g., combusted) so the carbon is returned to the atmosphere, leaves cycling annually, and fine roots turning over on the order of 0.9 to 5.8 times annually [17,26], so the carbon in these plant parts is not added to the plant system’s sequestration potential, but are likely having an impact on soil carbon levels. Stool and root biomass data are critical in understanding the carbon and greenhouse gas balances of willow biomass crops. They can sway the whole system into becoming a low-carbon, carbon-neutral, or carbon-negative biomass source [27]. However, the time required to collect belowground biomass data and to understand its variability across the landscape makes it difficult to gather accurate figures, and many LCA studies do not take belowground carbon into account [3]. Those studies that incorporate belowground biomass relied on data that is limited both spatially and temporally, such as Heller et al. [28], who created an early assessment of the greenhouse gas (GHG) balance of willow systems in the U.S. and used an R:S ratio of 0.57 from willows that were one year old on two-year-old roots. This made the total sequestration potential to be estimated at −14.1 Mg CO2 eq ha−1 over the 7 rotation life of the crop. An updated LCA that used the belowground biomass data by [15] to develop a carbon sequestration value of the belowground biomass of −45.7 (SE ±4.0) Mg CO2 eq ha−1 for seven rotations [29]. However, because the relationship between above- and belowground biomass was lacking, this same belowground biomass data was used for all the LCA scenarios resulting in higher yield scenarios having higher greenhouse gas emissions (due to higher harvesting emissions). Nonetheless, all scenarios gave negative greenhouse gas balances ranging from −138.4 to −52.9 kg CO2 eq Mg−1. More recently, [27] incorporated the R:S ratio into their spatial LCA and found that the carbon stored in this biomass, along with changes in soil carbon, where key factors in determining if the life cycle GHG balance of the system was negative or slightly positive.
New high-yielding cultivars of willow from breeding and selection work have greater aboveground biomass production than older varieties [30,31], but the quantity of belowground biomass is unknown. Recognizing the uncertainty of R:S ratios and the importance of belowground biomass figures in understanding the greenhouse gas balance of these systems, the objectives of this analysis are to (1) inventory the aboveground and belowground biomass in the different components (leaves, shoots, above- and belowground stools, coarse roots, and fine roots) of three high yielding willow cultivars growing at two sites, and (2) perform analysis on the various biomass components to determine the quantity of carbon sequestered in the stool and root system.

2. Materials and Methods

2.1. Site and Cultivar Selection

Two paired research trials were selected for this study, one in Tully, New York (43.7898° N 76.1127° W, elevation 378 m) and one in Belleville, New York (42.7942° N 76.1164° W, elevation 141 m). The experimental design and management practices were similar for both sites. These sites had a randomized complete block design with four blocks and 18 cultivars per block. A total of 25 centimeter-long dormant willow cuttings were planted in May 2005. Each 6.86 × 7.92 m plot contained 78 willows of a single cultivar planted in three double rows with distances of 1.52 m between double rows, 0.76 m within a double row, and 0.61 m between plants for a planting density of approximately 14,400 plants ha−1 (Figure 1). Both sites were coppiced after the first growing season and have been harvested on three-year rotations since. In the spring, after coppicing and each harvest (2006, 2009, 2012), 100 kg N ha−1 was applied to each field. Aboveground biomass results for the cultivars in this trial are available in Sleight and Volk [32]. Mean annual precipitation and growing degree days (GDD) were similar between the sites, with GDD over nine years being slightly lower at Tully (3691) versus Belleville (4089) and annual precipitation levels being similar (1204 mm year−1 at Belleville and 1180 mm year−1 at Tully. See [32] for details). The soil at Tully is a well-drained Palmyra gravelly loam with a depth-to-water table of over 203 cm, while soil at Belleville is a well-drained Galway silt loam with a depth-to-water table of 46–107 cm, and bedrock at 51–107 cm [33]. Soils at Tully have a lower pH (4.99) than at Belleville (6.49) and similar percent organic matter (3.23% at Tully and 3.25% at Belleville) [34]. Nutrient concentrations vary, with Tully having statistically higher levels of potassium, magnesium, iron, aluminum, and ammonium, statistically lower levels of phosphorus, calcium, and nitrate, and similar levels of manganese and zinc. Further details about the soils at these sites can be found in Serapiglia et al., 2012 [34].
Three cultivars that were high yielding at both sites were selected for sampling in this study: Fish Creek (9882-34, S. purpurea), SX61 (S. miyabeana), and Oneida (9980-005, S. purpurea × S. miyabeana). Fish Creek was the highest yielding cultivar after three rotations at Belleville, SX61 was the highest yielding at Tully, and Oneida was the only cultivar (except SX61) that was one of the top five (out of 18) yielding cultivars at both sites [32]. In addition, these cultivars represent different growth forms of willow, with S. purpurea cultivars generally having many small stems, S. miyabeana cultivars generally having fewer but larger stems, and S. purpurea × S. miyabeana being a genetic cross between the two. Because of weather-caused limitations, sampling was only completed for three plots for some cultivars at each site, so the analysis is based on three replications.

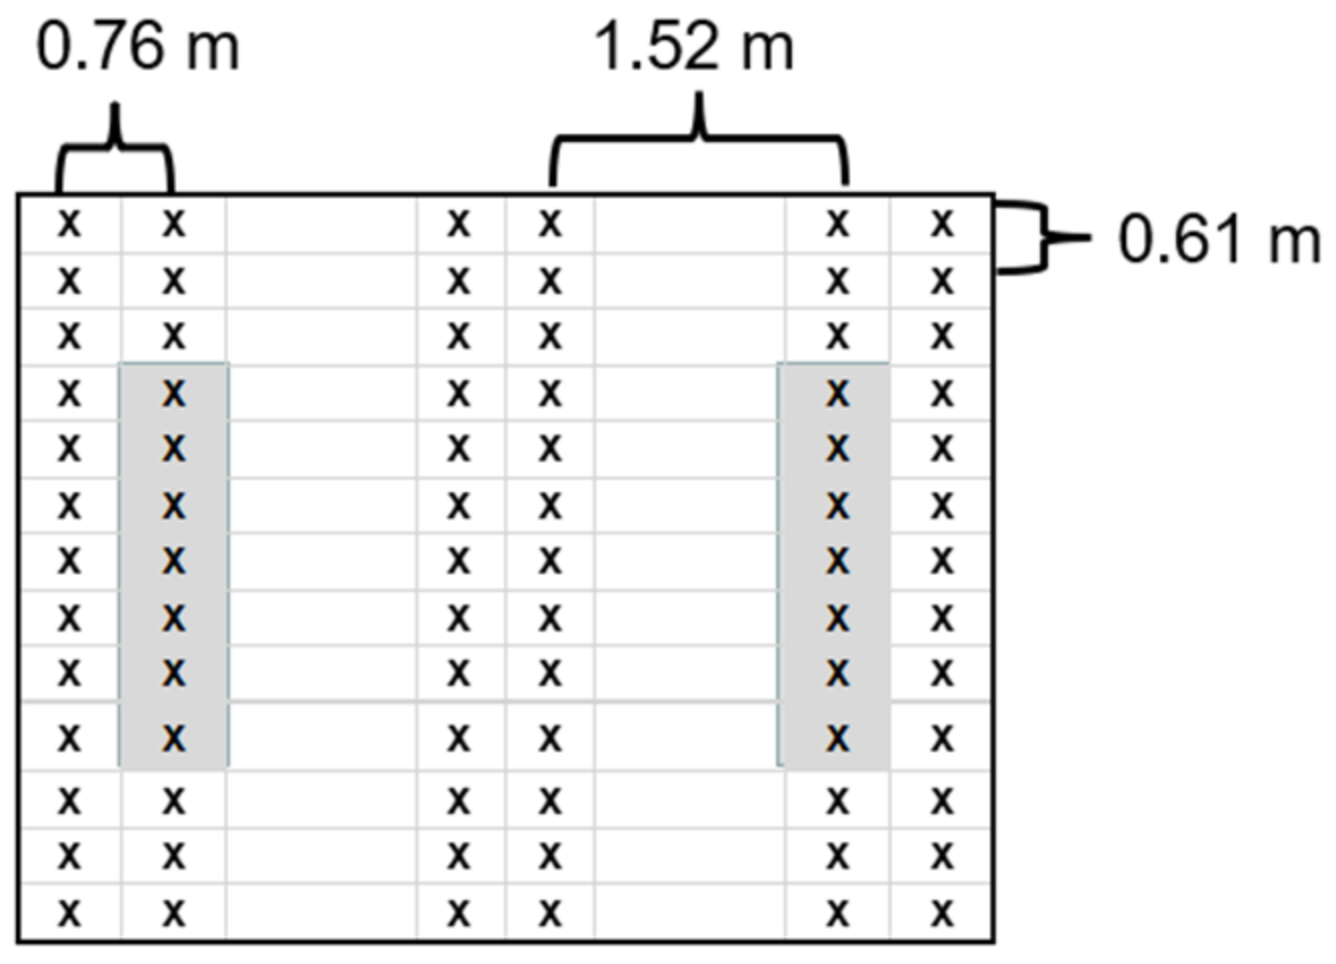
2.2. Sampling Procedure

Sampling was done in the fall of 2014, when the shoots were at the end of the third growing season of the third rotation, making the root system 10 years old. Each plot had three double rows, with the middle double row being a measurement area for yield studies and the outside double rows being border rows. So as not to disturb the measurement area, one willow from the inside row of the double-row border was selected for sampling. The willow chosen was representative of the willows in the measurement plot by visual inspection of plant height, stem count, and stem diameters. Plants where one of its neighbors was dead were avoided.
In late August and early September 2014, the selected willow shoots were cut approximately 5–10 cm above the soil. Leaves were manually stripped from the shoots and placed into paper bags and weighed in the field. When sampled, leaves at Belleville had started to change color but were still mostly green and had not dropped yet. Leaves at Tully had not started to change color. After stripping the leaves, the shoots were chipped and weighed in the field, and a subsample was taken and weighed. The leaves and shoot subsamples were placed in an oven at 60 °C and dried to a constant weight. Moisture contents of these two components were computed to convert field weights to dry weights.
From September to December 2014, the area representative of one willow plant was excavated to gather the AGS, BGS, CRs, and FRs. Because the willows in these trials were planted in a double-row design, the quadrat excavated extended 0.30 m on either side of the stool along the double row, 0.38 m into the double row on one side, and 0.76 m into the gap between border rows on the other side. The total excavated area was 0.70 m2. It was assumed that any roots from the selected willow leaving this space would be offset by roots from neighboring plants growing into the quadrat. The entire soil volume of the quadrat was excavated in 15 cm increments starting with the 0–15 cm layer and ending with the 45–60 cm layer. For each layer, 4 soil cores were taken across the diagonal of the pit with a 7.6 cm diameter × 15 cm long corer to sample FRs (<2 mm diameter). When possible, the cores were evenly spaced at approximately 26 cm increments but were moved if a rock or other obstruction prevented them from going the full depth. These 4 cores were combined and placed in a plastic bag and frozen. The rest of the soil of the layer was removed, and CRs (>2 mm diameter) were manually removed. The soil was separated from the CRs in the field using an archeological sifter or a cement mixer modified with a screen on one side. The CRs were placed into a separate plastic bag and stored in a freezer. This method was used for each layer so that there would be an FR and a CR sample for each layer. The stool was removed when it was free and put into a bag stored in a freezer.

2.3. Sample Processing

Soil cores were laid out on a lab bench and allowed to thaw, and then FRs were removed from each sample. Any CRs found were removed/cut off and added to the bag of CRs for that plot and layer. The FRs were washed and dried in an oven at 60 °C to a constant weight. Stools were washed to remove dirt, and any CRs still attached to the stool were removed and placed in the CR bag for that respective willow and layer. After washing, the stools were cut with a saws-all into their respective layers: an aboveground section, a 0–15 cm deep section, and a 15–30 cm deep section (the stools did not extend beyond 30 cm deep because the plots were planted with 25 cm long cuttings). The CR samples were removed from the freezer and washed and scrubbed with toothbrushes to remove the dirt. Calipers were used to measure the roots, and any roots <2 mm were removed. Both the CRs and the stools were placed in an oven and dried at 60 °C. After drying, all components of the willows were scaled using the appropriate area factor to dry megagrams per hectare. Though it is not assumed that one willow from three plots would be sufficient to appropriately predict results for an entire hectare of willows, converting all units to dry megagrams per hectare puts the values into commonly used and comparable units.

2.4. Chemical Analysis

Carbon levels were found for each sample for all plant components. Each sample was ground in a Wiley milling machine, and a subsample of that was pulverized using a SPEX Mixer-Mill (8000 M mixer/miller, LessonElec. Corp, St. Louis, MI, USA). For each sample, 10 mg of pulverized tissue (except for foliage in which 2.5 mg was used) was combusted and analyzed by an elemental analyzer (FlashEA 112 Elemental Analyzer, ThermoFisher Scientific, Waltham, MA, USA) for carbon concentrations.

2.5. Data Analysis

To determine allocation patterns, each plant was divided into the six components of leaf, shoot, AGS, BGS, CR, and FR, and the percentage of biomass in each component was computed. Aboveground biomass is considered leaf and shoot, and belowground biomass is considered AGS, BGS, CR, and FR. Percentages of total above- and belowground biomass were also computed.
Mixed models were constructed to estimate the effects of site, cultivar, and site × cultivar interactions on each allocation percentage using the GLIMMIX procedure in SAS 9.4 [35]. The site, cultivar, and site* cultivar interactions were considered fixed effects, and the block nested within the site was the random effect. Denominator degrees of freedom for fixed effects were computed using the containment method [35]. Significance was set at the α = 0.1 level. Considering the willows may occupy different conditions concerning the plot they live in, a direct comparison between allocation percentages may be misleading. To control this variability, the measurement plot in the middle double row of each plot adjacent to the plant sampled for root biomass was harvested, dry weight determined, and yield calculated and used as a covariate (see Sleight and Volk [32] for measurement plot yield results). Yield from the measurement plot is an objective, easy to understand, and relatively simple way to measure how well the stand is occupying the site. If, after running the model, the covariate was not deemed significant, it was removed and the model was run again with no covariate.
Root:shoot (R:S) ratios were calculated for all willows and were defined as the total biomass in the AGS, BGS, and CRs divided by the biomass of the shoots. Leaf:stem and FR:CR ratios were also computed. Mixed model analysis was applied to all ratios in the same manner as before. Since shoot mass directly represents the last 3 years of growth while stool and CR mass represent 10 years of growth, additional allocation percentages were calculated for AGS, BGS, CR, and FR with total belowground biomass as the denominator. These were also analyzed using the same modeling procedure as described previously.
Statistical models were not built on biomass quantity figures because of concerns that the differences shown may just be attributed to a random selection of which stools and the small number of plants sampled more than actual site or cultivar differences. Although effort was taken to pick a representative size plant, comparison with the harvesting results from the measurement plots, which contained up to 10 willow plants, showed that the willows picked for the R:S analysis often weighed more than the average willow in the measurement plot. A mixed model analysis was run on the results of the yield measurements conducted (See [32] for measured yield data), and neither site (p = 0.5142), cultivar (p = 0.7976), nor site × cultivar (p = 0.2905) factors were significant. Mean biomass production values of the shoots (±SE) for those cultivars were 37.8 (1.8) Mg ha−1 for Fish Creek, 32.2 (6.2) Mg ha−1 for Oneida, and 33.3 (7.8) Mg ha−1 for SX61 at Belleville and 26.6 (6.0) Mg ha−1 for Fish Creek, 30.4 (3.4) Mg ha−1 for Oneida, and 34.5 (3.3) Mg ha−1 for SX61 at Tully [32]. Therefore, the large differences sometimes seen in the biomass quantities represented by the three individual willow plants per cultivar selected for component sampling at each site may have been influenced by plant selection in addition to environmental factors.

3. Results

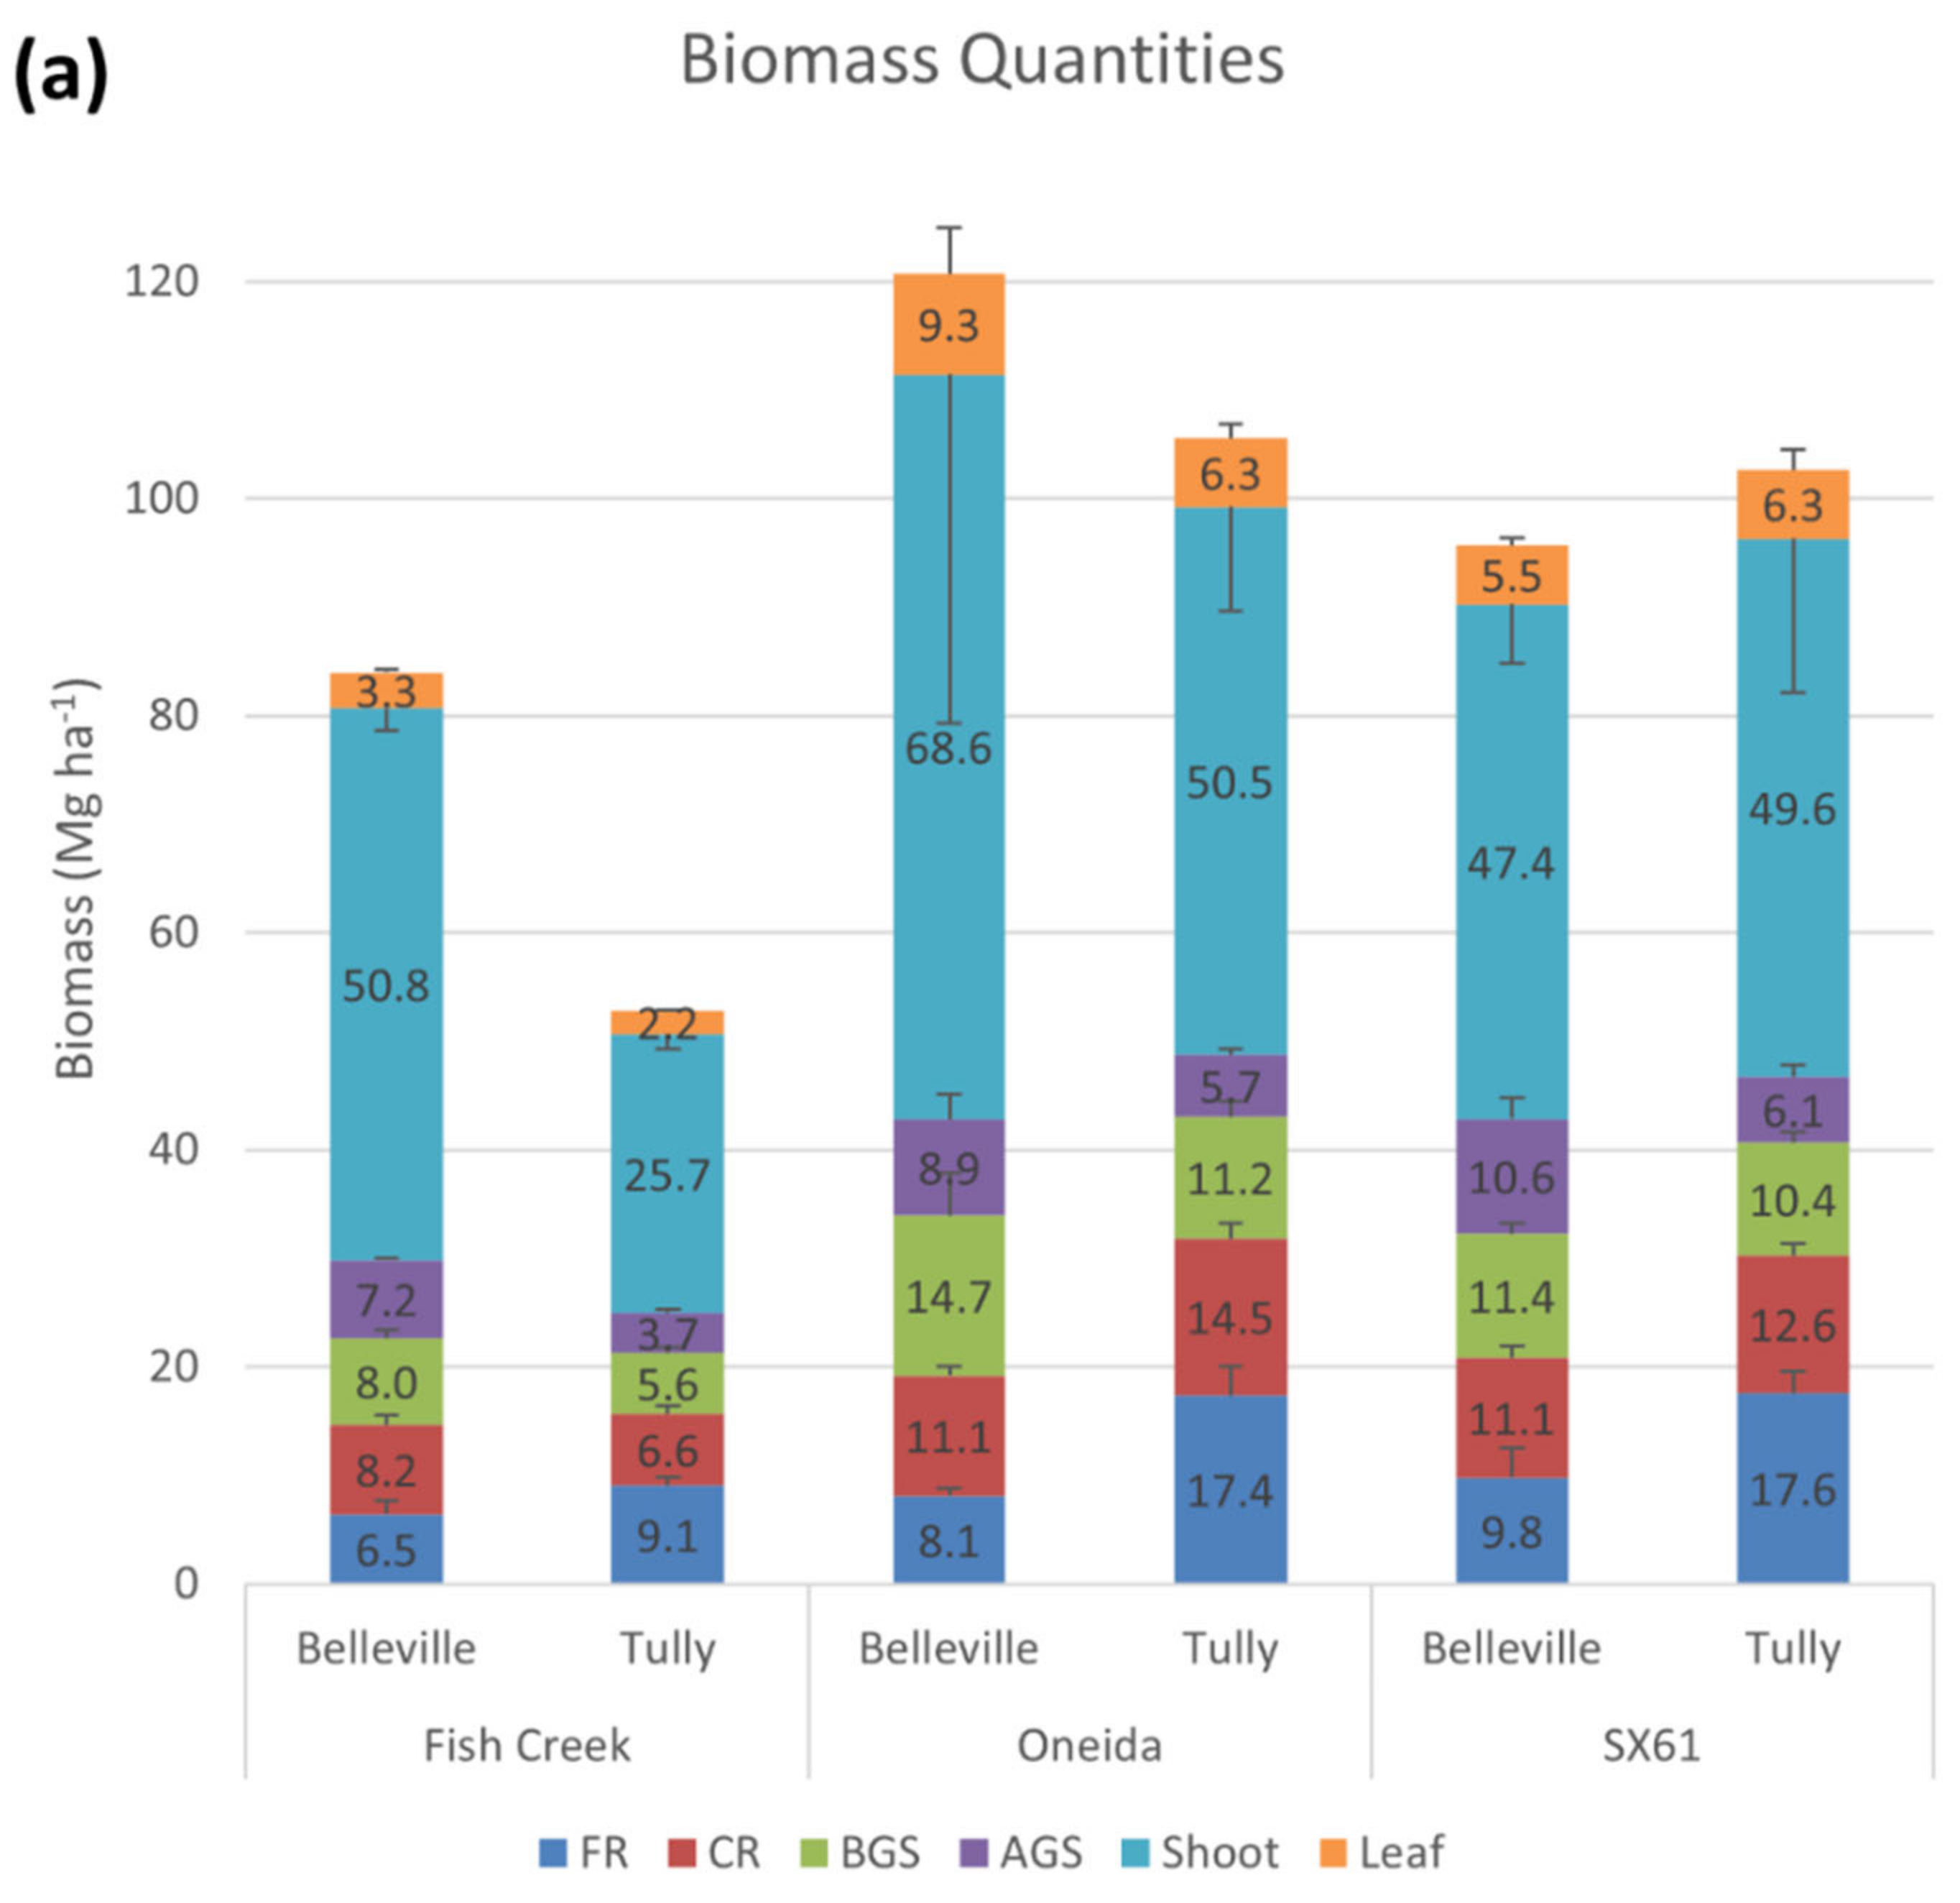
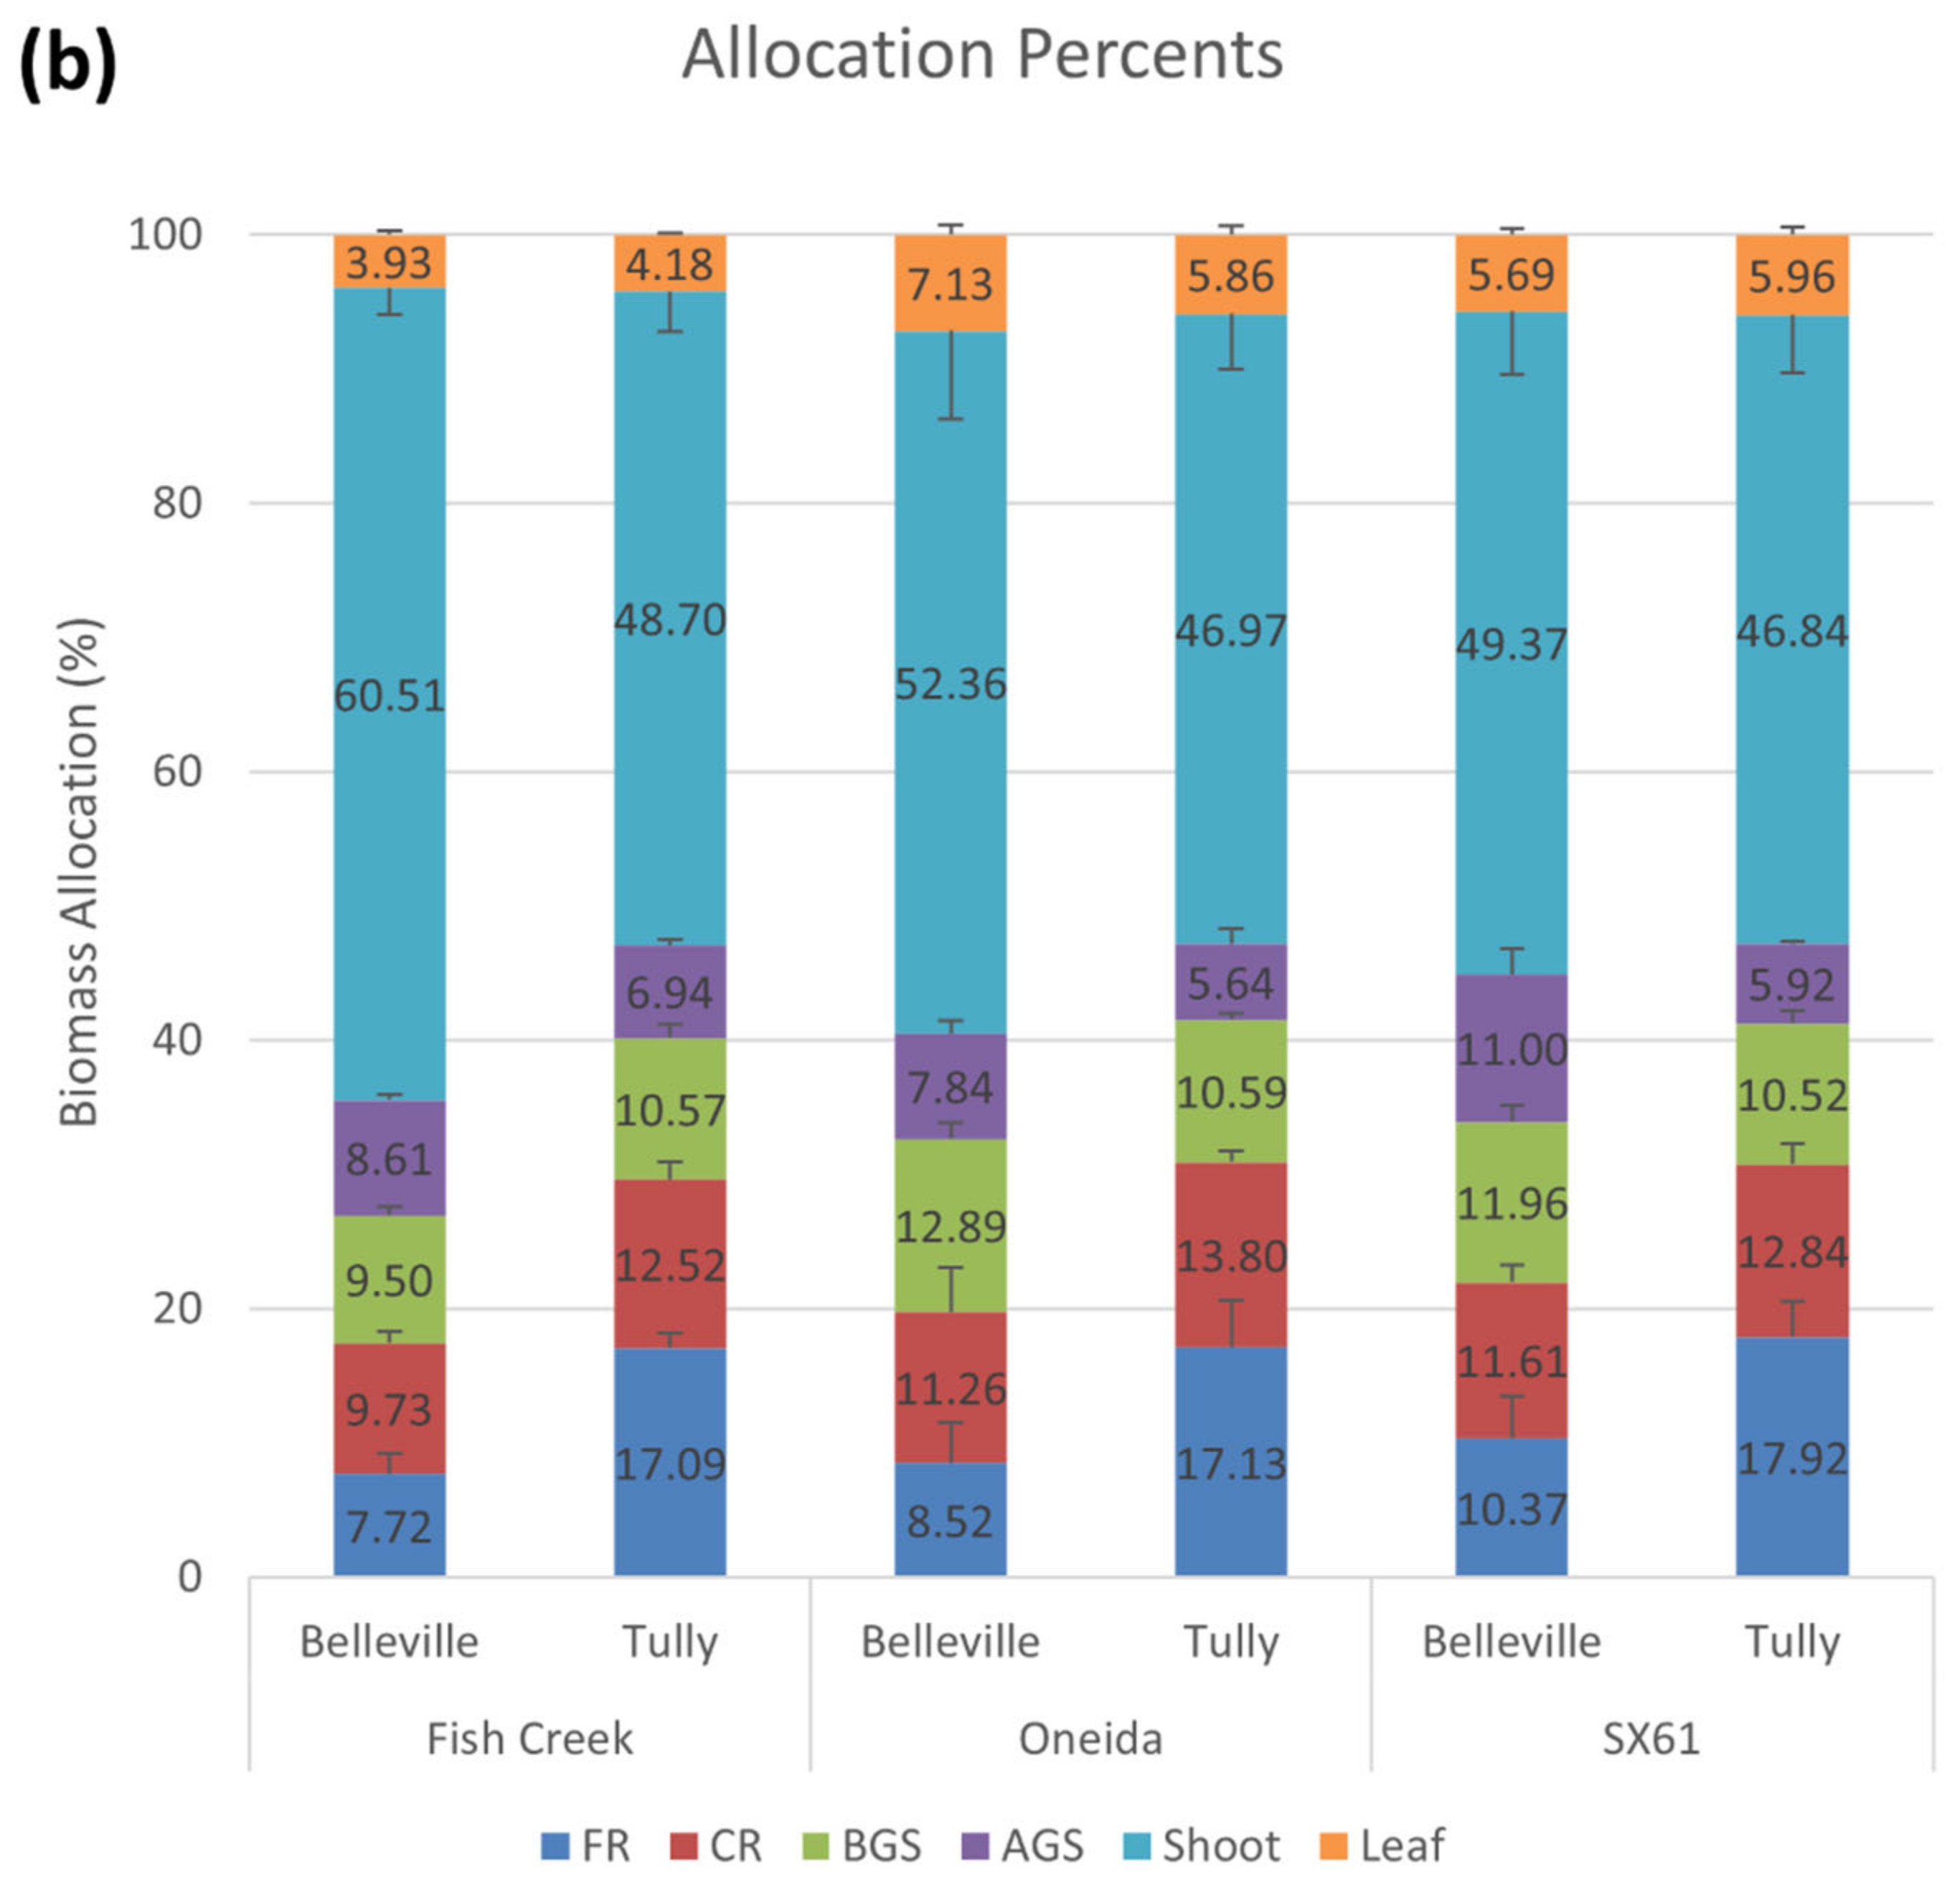
3.1. Biomass Allocation

The overall mean allocation of aboveground biomass in the willows was 56.3% (±2.0%) and belowground biomass was 43.7% (±2.0%) (Figure 2). No statistical difference was detected between sites (p = 0.2608), cultivars (p = 0.4059), nor in the site × cultivar interaction (p = 0.9423) (Table 1). Likewise, R:S ratios did not show any significant differences between site, cultivar, or in the interaction. The overall mean R:S ratio was 0.63 (±0.04), with values ranging from 0.46 for Fish Creek at Belleville to 0.72 for SX61 at Belleville (Table 1).
Within aboveground biomass components, the percent leaf was significantly different by cultivar (p = 0.0031), with Fish Creek having a lower proportion of foliage (4.1%) than either Oneida (6.6%) or SX61 (5.8%). There were no statistically significant differences in the percentage of biomass in the shoots across the sites or cultivars. Since leaf biomass was a small proportion of aboveground biomass (5.7%–12.8%), differences in percent foliage between cultivars were dwarfed by the variation in the percent shoot figures, resulting in no significant differences in the overall percent aboveground values. However, leaf:stem ratios did show a site × cultivar interaction (p = 0.0041) with five levels of means separations amongst the six site-cultivar combinations. Fish Creek at Belleville had both the largest percent shoot and lowest percent leaf and correspondingly had the lowest leaf:stem ratio (0.065). The largest leaf:stem ratio (0.137) was more than double the low-end value and was found in Oneida at Belleville.
For belowground biomass, similar mean percent allocations were found between BGS (11.0%), CR (12.0%), and FR (13.1%), with a lower proportion for AGS (7.7%). There were significant site × cultivar interactions for both percent AGS (p = 0.0805) and percent BGS (p = 0.0808). Willow at Belleville had a larger percent AGS allocation across all cultivars compared to Tully. The percent AGS for SX61 dropped significantly from Belleville, where it was the highest of the three cultivars (10.9%), to Tully, where it was the lowest of the three cultivars (5.7%). Percent BGS was the same across all three cultivars at Tully, but at Belleville it was significantly lower for Fish Creek (9.5%) compared to SX61 (12.0%) and Oneida (12.9%). There were no significant differences in the proportion of CRs across sites or cultivars. The percentage of FRs was significantly different between sites (p = 0.0130), with a higher value at Tully (16.7%) compared to Belleville (9.6%).
When calculating percentage allocation among the belowground biomass, the site × cultivar interactions are significant for percent AGS. The portion of belowground biomass in the AGS was significantly higher at Belleville compared to Tully for each of the three cultivars, but the decrease was greater for SX61 than for Fish Creek or Oneida. There were site differences in the proportion of belowground biomass in the BGS (p = 0.03) and FRs (p = 0.005). At Belleville, a higher proportion of biomass was allocated to the BGS (28.9%) than at Tully (22.6%), but Tully had a greater proportion of biomass in FRs (35.6%) than was found at Belleville (22.0%). Differences in FR biomass are also reflected in the FR:CR ratio, with Tully having a significantly higher ratio (1.33) than Belleville (0.80).
When analyzing belowground biomass by depth, all site-cultivar combinations show the largest amount of biomass in the 0–15 cm layer, with four out of the six combinations containing over 50% of the belowground biomass in that layer (Figure 3). Nevertheless, a mean of 10.6% of belowground biomass is still present in the fine and coarse roots between 30 cm and 60 cm, and some individual roots extended below 60 cm, though their proportion to the total biomass on these sites would be small.

3.2. Effect of Measurement Plot Yield

The significance of the measurement plot yield term in many of the analyses, including the R:S ratio analysis (p = 0.0978), indicates that the amount of biomass production in the surrounding area influenced the biomass allocation of a particular plant. In general, plants in plots with higher production had lower R:S ratios (Table 2), with every increase of 1 Mg ha−1 in measurement plot yield leading to a decrease in the R:S ratio of 0.01. However, when simple linear regression was performed, the relationship was not very strong in this limited data set of 18 samples, achieving an R2 value of only 0.26, though the R2 value jumps to 0.53 when one outlier with both high plot yield and R:S ratios is removed.

4. Discussion

4.1. Comparing R:S Levels

Roots play an important role in global carbon cycling and ecosystem function. Yet, research on them is limited due to the challenging and time-consuming methods to obtain accurate and reliable data [9]. There is a need for more empirical data on belowground biomass in willow biomass crops to better understand their impact on carbon dynamics [27,29,36]. In this study, the R:S ratio averaged 0.63 and did not vary significantly between the two sites or three cultivars. There did appear to be more variation in the R:S ratio among cultivars at one site, Belleville, and the limited number of replications (n = 3) may contribute to the lack of significance. All the willows sampled were the same age and under a similar management regime, so variability from these factors was minimized.
Data on belowground biomass and ratios of plant parts is limited for coppice shrub willow systems, and there are challenges in comparing results from the limited number of studies available. Differences in collection methods, sampling depth, definition of plant parts, and differences in the ages of the root systems and stems complicate comparisons (Table 3). Despite these challenges, putting the limited data in context is warranted and can provide useful information. In the current study, there were no significant differences in the R:S ratios between sites and among cultivars, but differences were found in other studies. Cunniff et al. [10] and Stadnyk [26] both reported differences in R:S ratios among cultivars at a given site, and Cunniff et al. [10] found differences between sites. Stadnyk [26] clearly states that the two sites where root biomass was sampled were selected because they represented the widest range of soil texture where trials were available (sand to sandy loam and heavy clay). The trials in the Cunniff et al. [10] study were a silty clay loam and a sandy silt loam. The differences in the soil texture in this study were not as broad, which may contribute to a lack of difference between sites. Cunniff et al. [10] is one of the few studies that measured changes over time, and it is interesting to note that the belowground fraction was similar at the end of each rotation for one site and only changed slightly at the second site. Both the Stadnyk [26] and Cunniff et al. [10] studies were conducted on younger root systems (2–5 years old), and sampling was completed when aboveground stems were only two years old. Because data is limited for these systems, it is unclear if R:S ratios are different across sites at younger ages and then converge over time or if the lack of differences in this study is because the sites were not different enough to cause a response.
The average R:S ratio of 0.63 in this study is higher than many studies in the literature, although it was much lower than the highest levels reported. Nine studies in Table 3 reported lower R:S values than this study, while three others found higher values. The values reported by Guidi and Labrecque [37] were similar (0.54) to this study. Several of the studies that reported lower values were conducted on younger root systems, and it has been noted root biomass increases with plant age in these coppice systems. Results from a chronosequence study of belowground biomass suggested that it increases until 12–15 years and then levels off in coppice systems with three-year harvest cycles [15]. Matthews [20] reported a higher R:S of 2.7 for willow on a 22-year-old root system, although the stems were only one year old. The higher values in the study by Volk [21] are from two-year-old plants with only one-year regrowth after coppicing. Pacaldo et al. [15] used methods for belowground biomass extraction similar to this study. They reported R:S ratios above 1.0 across a range of ages and sites for a single cultivar, but these plants were only two years old aboveground on root systems that were 5, 12, 14, and 19 years old. In addition, the cultivar (SV1) studied by Pacaldo et al. [15] was a wild collection, while the cultivars in this study were from breeding and selection (Fish Creek and Oneida) or selection programs (SX61) where aboveground biomass was the primary selection criteria [30]. It is possible that some of the yield gain seen among the improved cultivars in this study may be associated with a smaller allocation of biomass to roots and a greater allocation to aboveground shoots. Cunniff et al. [10] also reported differences among genotypes up to 10%, suggesting that there may be potential to manipulate the S:R ratio to produce more aboveground biomass. The averages of our three genotypes across sites varied by at most 22%, though no statistical differences were found, which may indicate higher variability in our plots and the need for more data to address this issue. The higher variability in these plots could also be related to the small number of samples (n = 3) because of the effort needed to accurately excavate and process belowground plant parts.
The influence of site on R:S was not significant in the current study, but there was a noticeable trend. R:S ratio ranged from 0.46 to 0.72 at Belleville but only from 0.63 to 0.65 at Tully. The limited sample size and large variability contributed to the non-significant results. Other studies have noted that site impacted R:S ratios (e.g., Pacaldo et al. [15]). One study noted that their proxy for the R:S ratio had a negative relationship with clay content [11] across sites with clay content ranging from 3.7%–43.1% in the top 25 cm. Site differences may become more pronounced over time as well. Cunniff et al. [10] found that the belowground biomass fraction was slightly different between sites near the end of the first rotation, but it increased in the second rotation at one site (Aberystwyth) while there was little change in the other site. Their study also found that environmental factors influenced allocation between roots and shoots to a greater degree than genotype differences. Whether R:S levels are influenced by the site also depends on whether FRs are included or not, as demonstrated in Hangs et al. [22]. Without FRs, R:S levels across the 4 sites in their study were all identical, but with FRs, one site has R:S ratios less than half that of two other sites. Results across studies show a large variation in percent allocation to FRs, but not as much variation in the rest of the plant. While data from this trial did not show a site impact, which was likely due to the minimal variation in site conditions, other studies suggest that site will be a factor for R:S in willow coppice systems.
Most studies where R:S levels were higher than those in this study occurred when the shoot age was under 3 years, which lowers shoot biomass. Roots do not grow at the same rate as the aboveground portion of these plants. Even so, the R:S levels in this study were sometimes higher than in other studies with younger shoot ages (e.g., Rytter, [18], Zan et al. [19]), but the root ages were often younger as well. Using similar methods for measuring belowground biomass, Pacaldo et al. [15] measured components of a single willow cultivar (SV1) over a chronosequence to better understand this important part of the system. They found that the biomass in most components, including AGS, BGS, and CRs, increased during the early years, but then plateaued after several rotations when the roots were 12 to 14 years old. Other studies also show that belowground biomass quantities in younger shrub willow crops is considerably lower than in older willows [10,26]. One exception was a study examining different sizes of willow planting material ranging from 0.5–3.0 m in length, where the R:S ratio of one-year-old plants ranged from 0.47–0.93. Another exception was a study focused on understanding the distribution of willow roots to develop recommendations for willow crop removal. The belowground biomass was extracted using a tree spade resulting in a R:S ratio of 1.19 [39]. The limited data on older willow crops suggests that the belowground biomass levels off after approximately four rotations Pacaldo et al. [15]. If R:S ratio is determined at the end of each rotation, it is likely that the value will increase over time until the belowground biomass production levels off.
From the studies available, it would appear that R:S ratios vary among genotypes and sites, but that is not what was found in this study, which was designed to specifically test for these differences. One of the challenges with understanding belowground biomass dynamics and R:S ratios is that there appears to be a considerable amount of variation in root systems. Collecting belowground biomass is time-consuming, so the number of replications is often limited. In this study, the R:S ratio of Fish Creek at Belleville (0.46) was considerably lower than the mean R:S ratio (0.63), but not significantly different due to the low number of replications, the variation in R:S ratios overall (CV = 27.5), and the fact that the plot yields for Fish Creek at Belleville were the highest of the six site-cultivar combinations. When adjusting for plot yields, Fish Creek at Belleville’s R:S ratio increases to 0.51 (Table 2), which is still the lowest, but not as far off the mean as before.
Important methods used to measure root and stool biomass differ between studies, such as the soil depth or ground area that is excavated. Willow systems are relatively short-lived, and the aboveground material is typically removed in two to three-year cycles, which adds further variation and makes comparisons between studies challenging. One of the difficult issues with measuring belowground biomass is that small areas, relative to aboveground biomass measurements, are excavated to estimate values. In this study, a plot area of 0.70 m2 encompassing a single plant was used. The assumption was that the roots that entered this area from the surrounding plants would be offset by the roots from the plant being measured that left the area. Therefore, the plants surrounding the sampled plant can impact the results.

4.2. Belowground Biomass Quantity and Distribution

The amount of biomass in the stable belowground plant parts (AGS, BGS, CR) accounted for 27.9 Mg ha−1 in 10-year-old willows. This is higher than the 21.9 Mg ha−1 reported for 12-year-old willow [15], which was the closest in root age to the plants sampled in this study. Both the cultivar and site where samples were collected were different than this study. Even for older willows (14 and 19 years old) sampled near the Tully site, Pacaldo et al. [15] found lower stable belowground biomass (25.4–25.5 odt ha−1) than this study. This suggests that there are differences in belowground biomass among willow cultivars, but some of these differences may be related to the overall productivity of the cultivars and site conditions.
Though overall allocation to belowground biomass was similar between sites and cultivars, the distribution of that biomass between belowground components varied, with general results showing Tully with higher percent FRs and Belleville with higher percent stool. Soil conditions, particularly lower nutrient concentrations, likely play an important role in why the percent of FRs was higher at Tully. Soils at Tully have a lower pH (5.0) compared to Belleville (6.5) [34], which likely has a negative impact on nutrient availability, and the soils at Tully have better drainage than at Belleville. Both of the features can contribute to a plant producing more belowground biomass, and in particular FRs, to access both nutrients and water [40,41]. Fertilization can help increase nutrient availability. However, if the sites are already productive, it will likely have minimal effect, as demonstrated by Kibet et al. [42], whose multiyear fertilization regimen had no effect on root biomass and soil properties in switchgrass. Climate conditions at Tully and Belleville are similar [32] and so probably have minimal impact on the differences seen.
Biomass distribution patterns from this study can also be compared to Pacaldo et al. [15] for their 12-year-old willow. The mean allocation of just belowground biomass to AGS was similar between studies, with this one showing 18.2% to AGS and Pacaldo et al. [15] showing 20.8%, but BGS was higher in this study (25.8% to 15.7%). This study also found considerably more biomass allocated to the CRs (27.2%) than Pacaldo et al. [15], (10.4%), and, correspondingly, less to the FRs (28.8% to 53.0%).
The amount of stable belowground biomass (AGS, BGS, CR) varied between cultivars, with Oneida (33.0 Mg ha−1) and SX61 (31.1 Mg ha−1) having more than Fish Creek (19.7 Mg ha−1) but was not significantly different between sites nor for the site × cultivar interaction. Stadnyk [26] found that SX61 had more belowground biomass than Fish Creek at the end of the first rotation at one site in Saskatchewan, but Fish Creek was greater than SX61 at the other site. Differences between cultivars are impacted, but site and potentially age and further data will be needed to make more definitive statements about belowground differences among cultivars.

4.3. R:S Variance Due to Biomass Production

As shown, R:S levels trend lower at higher producing sites due to the significant covariate of measurement plot yield (p = 0.0978) with a drop in R:S ratio of 0.01 for every 1 Mg ha−1 increase in biomass production. Practically this rate of decrease is rather small, but considering the measurement plot production varied from 15.3 to 43.3 Mg ha−1 across the 18 plots sampled in this study, the potential change in the R:S ratio across that range is 0.29. This is a considerable amount when these ratios are averaging only 0.63.
Though this study was not set up to determine the cause of this trend, there are several hypotheses as to why R:S ratios drop the more productive the surrounding willows are. Aboveground competition between plants may play a role as the surrounding plot increases in shoot biomass, the other plants must compete as well, or they will be shaded out. Furthermore, if the overall stand is better at occupying the location, it could indicate that the soil conditions at that location are superior, leading to less root mass needed to uptake the same level of water and nutrients.
Most of the willows chosen for this study were larger than the mean willow for that particular site and cultivar based on results from the yield trials at those sites (at least when comparing shoot biomass). Part of the reason for this is that we are sampling on a plant-by-plant basis, while the yield trials are conducted on an area basis. Because some plants have died in the yield measurement plot, the mean plant statistically is smaller than the mean living plant. Even so, the plants in this study were still larger than even the mean living plant in the yield trials, averaging 30% larger across the six site-cultivar combinations. There is a potential disparity between what we sampled and what is in the field, as most willow fields do not have 48.8 Mg ha−1 of shoot biomass at the end of a rotation like the average in this study. Therefore, using measurement plot yield as a covariate helped to relate the data found with a range of plant sizes we more normally see. Seeing that the data collected covered a wide range of willow yields, it provides some confidence that the patterns found will apply across a wide range of willow yields.

4.4. Implications for GHG Analysis in Willow Systems

Belowground biomass is intrinsically linked to aboveground biomass, which is much easier to measure, and establishing the relationship between the two can help predict belowground biomass across time and space. Improved information about R:S ratios across sites and cultivars improves LCAs of willow biomass crops by providing a way to calculate belowground carbon storage, which is crucial when determining the overall greenhouse gas balance of these systems [27].
We can use the results of this study to do a rough calculation of carbon storage at our sites. Mean third rotation biomass in the stable belowground plant parts (AGS, BGS, CR) ranged from 15.9–33.7 Mg ha−1, with an average of 27.9. Multiplying each value by the respective carbon proportion found in each component and summing gives the total (Table 4) belowground carbon sequestration, which can be converted to carbon dioxide equivalent. The total amount of storage would range from 26.2 to 57.3 Mg CO2eq ha−1 with an average of 48.0 CO2eq ha−1. This value is similar to the figure of 45.7 Mg CO2eq ha−1 used in an LCA of willow [29], but they did not apply an R:S ratio. Recent spatial LCAs where yields have varied across the landscape have incorporated R:S ratios to reflect the variation in belowground biomass [27,43], but there is not enough information to associate potential variations in R:S ratios across the landscape due to site and genotypes at this point. Frank et al. [43] showed that a change in R:S ratio from 0.35 to 0.99, which were individual plot values in this study, could shift the life cycle GHG emissions of the willow system from a net sequestration to one with small emissions. The impact that R:S ratios have in these recent LCA illustrates the importance of improving the aspect of the belowground portion of the willow system so that more accurate carbon accounting can occur.

4.5. Breeding Applications

From a bioenergy industry and economic standpoint, the chief concern in willow biomass crops is the quantity of shoot biomass because that is what is harvested and sold. If multiple cultivars have the same total biomass, but one allocates more to the aboveground portion than the other, that distribution will provide some benefit in terms of yield. Yield gains in annual crops have often been made by adjusting the harvesting index–the amount of the plant that is actually harvested–without increasing the total biomass production of the plant. Recently bred cultivars of willow biomass crops produce higher than older reference varieties [1,30]. It may be possible for breeders to select plants that take resources and allocate less toward roots and more towards shoots. This strategy has to be done in moderation, however, to make sure that regrowth ability is not inhibited [44]. On the other hand, when willows are used for streambank stabilization, erosion control, or phytoremediation, a greater root mass may be beneficial, leading to the selection of other cultivars. Also, if higher levels of carbon sequestration are desired, and there is a price on this stored carbon in the future, cultivars with more belowground biomass may be favored. No matter the objective, it is an important step in developing willow biomass crops to understand further biomass partitioning between the plants above- and belowground components.

5. Conclusions

Data collection on the belowground system in willow is much more difficult to perform than those on the aboveground system, but it impacts the economic and environmental aspects of these systems. This study makes an important contribution to the knowledge of biomass partitioning by performing a complete biomass inventory of the different components of three cultivars of short-rotation willows at two sites. The R:S ratio in these plants did not significantly vary by cultivar nor by site, averaging 0.63 on a 10-year-old root system with 3 years of shoot growth since the last harvest. However, the R:S ratios were moderately affected by the overall productivity of the stand, with higher producing stands having lower ratios. Even though overall belowground allocation was similar, differences did occur within belowground components, with the Tully site having a higher percent of fine roots and the Belleville site having a higher percent stool value. This study also showed the distribution of belowground biomass by depth, showing the majority of it was found in the top 15 cm on these sites, but there were substantial amounts of biomass down to at least 60 cm. Knowledge regarding resource partitioning and carbon levels is crucial to understanding greenhouse gas balances of willow biomass crops and the economics of these systems, especially as markets develop and a price is put on carbon.

Author Contributions

Conceptualization, N.J.S. and T.A.V.; methodology, N.J.S. and T.A.V.; formal analysis, N.J.S. and M.E.; investigation, N.J.S., T.A.V. and M.E.; resources, T.A.V.; data curation, N.J.S. and T.A.V.; writing—original draft preparation, N.J.S.; writing—review and editing, N.J.S., T.A.V. and M.E.; visualization, N.J.S., T.A.V. and M.E.; supervision, T.A.V.; project administration, T.A.V.; funding acquisition, T.A.V. All authors have read and agreed to the published version of the manuscript.

Funding

Support for the initial establishment of these trials was provided by USDA AFRI and the New York State Energy Research and Development Authority (NYSERDA). Essential funding to maintain and monitor these plots for several rotations was provided by the North Central Regional Sun Grant Center at South Dakota State University through a grant provided by the US Department of Energy Bioenergy Technologies Office under Award number DE-FC36-05GO85041. Additional funding to support N.J. Sleight and M. Eisenbies came from the NEWBio Research Consortium, supported by the US Department of Agriculture NIFA Grant number 2012-68005-19703, and MASBio, which is supported by the US Department of Agriculture AFRI Grant number 2020-68012-31881.

Data Availability Statement

The authors are willing to share data and collaborate with potential partners upon request.

Acknowledgments

Special thanks to all the workers in the ESF willow biomass crew who spent multitudinous hours digging, picking, cleaning, and analyzing countless roots. Thanks also to Belleville Henderson Central School in Belleville, NY, USA, which made land available for the willow trial there and has supported its maintenance. This study would not have been possible without the foundational work on willow biomass crops in North America done by Edwin White and Lawrence Abrahamson and the breeding work for many of the cultivars in this trial done by Richard Kopp with assistance from Larry Smart and Lawrence Abrahamson.

Conflicts of Interest

The authors declare no conflict of interest. The funders had no role in the design of the study; in the collection, analyses, or interpretation of data; in the writing of the manuscript; or in the decision to publish the results.

Compliance with Ethical Standards

T.A.V. is a co-inventor on the patents for the following willow cultivars included in these trials: Fish Creek (US PP 17,710) and Oneida (US PP 17,682).

References

  1. Volk, T.A.; Berguson, B.; Daly, C.; Halbleib, M.D.; Miller, R.; Rials, T.G.; Abrahamson, L.P.; Buchman, D.; Buford, M.; Cunningham, M.W.; et al. Poplar and Shrub Willow Energy Crops in the United States: Field Trial Results from the Multiyear Regional Feedstock Partnership and Yield Potential Maps Based on the PRISM-ELM Model. GCB Bioenergy 2018, 10, 735–751. [Google Scholar] [CrossRef]
  2. Eisenbies, M.H.; Volk, T.A.; Posselius, J.; Shi, S.; Patel, A. Quality and Variability of Commercial-Scale Short Rotation Willow Biomass Harvested Using a Single-Pass Cut-and-Chip Forage Harvester. BioEnergy Res. 2014, 8, 546–559. [Google Scholar] [CrossRef]
  3. Djomo, S.N.; Kasmioui, O.E.; Ceulemans, R. Energy and Greenhouse Gas Balance of Bioenergy Production from Poplar and Willow: A Review: Energy and Greenhouse Gas Balance of Bioenergy Production. GCB Bioenergy 2011, 3, 181–197. [Google Scholar] [CrossRef]
  4. Rowe, R.; Street, N.; Taylor, G. Identifying Potential Environmental Impacts of Large-Scale Deployment of Dedicated Bioenergy Crops in the UK. Renew. Sustain. Energy Rev. 2009, 13, 271–290. [Google Scholar] [CrossRef]
  5. Volk, T.A.; Heavey, J.P.; Eisenbies, M.H. Advances in Shrub-Willow Crops for Bioenergy, Renewable Products, and Environmental Benefits. Food Energy Secur. 2016, 5, 97–106. [Google Scholar] [CrossRef] [Green Version]
  6. Heaton, R.J.; Randerson, P.F.; Slater, F.M. The Economics of Growing Short Rotation Coppice in the Uplands of Mid-Wales and an Economic Comparison with Sheep Production. Biomass Bioenergy 1999, 17, 59–71. [Google Scholar] [CrossRef]
  7. Buchholz, T.; Volk, T.A. Improving the Profitability of Willow Crops—Identifying Opportunities with a Crop Budget Model. BioEnergy Res. 2011, 4, 85–95. [Google Scholar] [CrossRef]
  8. Frank, J.R.; Brown, T.R.; Volk, T.A.; Heavey, J.P.; Malmsheimer, R.W. A Stochastic Techno-Economic Analysis of Shrub Willow Production Using EcoWillow 3.0S: A Stochastic Techno-Economic Analysis of Shrub Willow Production Using EcoWillow 3.0S. Biofuels Bioprod. Bioref. 2018, 12, 846–856. [Google Scholar] [CrossRef]
  9. Addo-Danso, S.D.; Prescott, C.E.; Smith, A.R. Methods for Estimating Root Biomass and Production in Forest and Woodland Ecosystem Carbon Studies: A Review. For. Ecol. Manag. 2016, 359, 332–351. [Google Scholar] [CrossRef]
  10. Cunniff, J.; Purdy, S.J.; Barraclough, T.J.P.; Castle, M.; Maddison, A.L.; Jones, L.E.; Shield, I.F.; Gregory, A.S.; Karp, A. High Yielding Biomass Genotypes of Willow (Salix spp.) Show Differences in below Ground Biomass Allocation. Biomass Bioenergy 2015, 80, 114–127. [Google Scholar] [CrossRef] [Green Version]
  11. Fontana, M.; Collin, A.; Courchesne, F.; Labrecque, M.; Bélanger, N. Root System Architecture of Salix Miyabeana “SX67” and Relationships with Aboveground Biomass Yields. Bioenerg. Res. 2020, 13, 183–196. [Google Scholar] [CrossRef]
  12. Gamble, J.D.; Johnson, G.A.; Current, D.A.; Wyse, D.L.; Zamora, D.S.; Sheaffer, C.C. Alley Cropping Affects Perennial Bioenergy Crop Root Distribution, Carbon, and Nutrient Stocks. Agron. J. 2020, 112, 3718–3732. [Google Scholar] [CrossRef]
  13. Ghestem, M.; Sidle, R.C.; Stokes, A. The Influence of Plant Root Systems on Subsurface Flow: Implications for Slope Stability. BioScience 2011, 61, 869–879. [Google Scholar] [CrossRef]
  14. Martani, E.; Ferrarini, A.; Serra, P.; Pilla, M.; Marcone, A.; Amaducci, S. Belowground Biomass C Outweighs Soil Organic C of Perennial Energy Crops: Insights from a Long-term Multispecies Trial. GCB Bioenergy 2021, 13, 459–472. [Google Scholar] [CrossRef]
  15. Pacaldo, R.S.; Volk, T.A.; Briggs, R.D. No Significant Differences in Soil Organic Carbon Contents along a Chronosequence of Shrub Willow Biomass Crop Fields. Biomass Bioenergy 2013, 58, 136–142. [Google Scholar] [CrossRef]
  16. Wilkinson, A.G. Poplars and Willows for Soil Erosion Control in New Zealand. Biomass Bioenergy 1999, 16, 263–274. [Google Scholar] [CrossRef]
  17. Rytter, R.-M.; Rytter, L. Growth, Decay and Turnover of Fine Roots of Basket Willows. Can. J. For. Res. 1998, 28, 863–902. [Google Scholar] [CrossRef]
  18. Rytter, R.-M. Biomass Production and Allocation, Including Fine-Root Turnover, and Annual N Uptake in Lysimeter-Grown Basket Willows. For. Ecol. Manag. 2001, 140, 177–192. [Google Scholar] [CrossRef]
  19. Zan, C.S.; Fyles, J.W.; Girouard, P.; Samson, R.A. Carbon Sequestration in Perennial Bioenergy, Annual Corn and Uncultivated Systems in Southern Quebec. Agric. Ecosyst. Environ. 2001, 86, 135–144. [Google Scholar] [CrossRef]
  20. Matthews, R. Modelling of Energy and Carbon Budgets of Wood Fuel Coppice Systems. Biomass Bioenergy 2001, 21, 1–19. [Google Scholar] [CrossRef]
  21. Volk, T.A. Alternative Site Preparation and Coppice Management during the Establishment of Short Rotation Woody Crops. PhD Dissertation, State University of New York College of Environmental Science and Forestry, Syracuse, NY, USA, 2002. [Google Scholar]
  22. Hangs, R.D.; Schoenau, J.J.; Van Rees, K.C.J.; Bélanger, N.; Volk, T.; Jensen, T. First Rotation Biomass Production and Nutrient Cycling within Short-Rotation Coppice Willow Plantations in Saskatchewan, Canada. BioEnergy Res. 2014, 7, 1091–1111. [Google Scholar] [CrossRef] [Green Version]
  23. Johnson, I.R.; Thornley, J.H.M. A Model of Shoot: Root Partitioning with Optimal Growth. Ann. Bot. 1987, 60, 133–142. [Google Scholar] [CrossRef]
  24. Thornley, J.H.M. A Balanced Quantitative Model for Root: Shoot Ratios in Vegetative Plants. Ann. Bot. 1972, 36, 431–441. [Google Scholar] [CrossRef]
  25. Rytter, R.-M. The Potential of Willow and Poplar Plantations as Carbon Sinks in Sweden. Biomass Bioenergy 2012, 36, 86–95. [Google Scholar] [CrossRef]
  26. Stadnyk, C. Root Dynamics and Carbon Accumulation of Six Willow Clones in Saskatchewan. Master’s Thesis, University of Saskatchewan, Saskatoon, Saskatchewan, Canada, 2010. [Google Scholar]
  27. Yang, S.; Volk, T.; Fortier, M.-O. Willow Biomass Crops Are a Carbon Negative or Low-Carbon Feedstock Depending on Prior Land Use and Transportation Distances to End Users. Energies 2020, 13, 4251. [Google Scholar] [CrossRef]
  28. Heller, M.C.; Keoleian, G.A.; Volk, T.A. Life Cycle Assessment of a Willow Bioenergy Cropping System. Biomass Bioenergy 2003, 25, 147–165. [Google Scholar] [CrossRef]
  29. Caputo, J.; Balogh, S.B.; Volk, T.A.; Johnson, L.; Puettmann, M.; Lippke, B.; Oneil, E. Incorporating Uncertainty into a Life Cycle Assessment (LCA) Model of Short-Rotation Willow Biomass (Salix spp.) Crops. BioEnergy Res. 2013, 7, 48–59. [Google Scholar] [CrossRef]
  30. Fabio, E.S.; Volk, T.A.; Miller, R.O.; Serapiglia, M.J.; Kemanian, A.R.; Montes, F.; Kuzovkina, Y.A.; Kling, G.J.; Smart, L.B. Contributions of Environment and Genotype to Variation in Shrub Willow Biomass Composition. Ind. Crop. Prod. 2017, 108, 149–161. [Google Scholar] [CrossRef]
  31. Volk, T.A.; Abrahamson, L.P.; Cameron, K.D.; Castellano, P.; Corbin, T.; Fabio, E.; Johnson, G.; Kuzovikina-Eischen, Y.; Labrecque, M.; Miller, R.; et al. Yields of Biomass Crops across a Range of Sites in North America. Asspects Appl. Biol. 2011, 112, 67–74. [Google Scholar]
  32. Sleight, N.J.; Volk, T.A. Recently Bred Willow (Salix spp.) Biomass Crops Show Stable Yield Trends Over Three Rotations at Two Sites. Bioenerg. Res. 2016, 9, 782–797. [Google Scholar] [CrossRef]
  33. USDA Natural Resources Conservation Service Web Soil Survey. Available online: https://websoilsurvey.sc.egov.usda.gov/ (accessed on 11 June 2017).
  34. Serapiglia, M.J.; Cameron, K.D.; Stipanovic, A.J.; Abrahamson, L.P.; Volk, T.A.; Smart, L.B. Yield and Woody Biomass Traits of Novel Shrub Willow Hybrids at Two Contrasting Sites. BioEnergy Res. 2012, 6, 533–546. [Google Scholar] [CrossRef] [Green Version]
  35. SAS. Institute SAS/STAT 9.2 User’s Guide, 2nd ed.; SAS Institute Inc.: Cary, NC, USA, 2009. [Google Scholar]
  36. Amichev, B.Y.; Hangs, R.D.; Bélanger, N.; Volk, T.A.; Vujanovic, V.; Schoenau, J.J.; Van Rees, K.C.J. First-Rotation Yields of 30 Short-Rotation Willow Cultivars in Central Saskatchewan, Canada. BioEnergy Res. 2014, 8, 292–306. [Google Scholar] [CrossRef]
  37. Guidi, W.; Labrecque, M. Effects of High Water Supply on Growth, Water Use, and Nutrient Allocation in Willow and Poplar Grown in a 1-Year Pot Trial. Water Air Soil Pollut. 2010, 207, 85–101. [Google Scholar] [CrossRef]
  38. Phillips, C.J.; Marden, M.; Suzanne, L.M. Observations of Root Growth of Young Poplar and Willow Planting Types. N.Z. J. For. Sci. 2014, 44, 15. [Google Scholar] [CrossRef] [Green Version]
  39. Tylek, P.; Pietrzykowski, M.; Walczyk, J.; Juliszewski, T.; Kwasniewski, D. Root Biomass and Morphological Characterization of Energy Willow Stumps. Croat. J. For. Eng. 2017, 38, 47–54. [Google Scholar]
  40. Chimento, C.; Amaducci, S. Characterization of Fine Root System and Potential Contribution to Soil Organic Carbon of Six Perennial Bioenergy Crops. Biomass Bioenergy 2015, 83, 116–122. [Google Scholar] [CrossRef]
  41. Keyes, M.R.; Grier, C.C. Above- and below-Ground Net Production in 40-Year-Old Douglas-Fir Stands on Low and High Productivity Sites. Can. J. For. Res. 1981, 11, 599–605. [Google Scholar] [CrossRef]
  42. Kibet, L.C.; Blanco-Canqui, H.; Jasa, P. Long-Term Tillage Impacts on Soil Organic Matter Components and Related Properties on a Typic Argiudoll. Soil Tillage Res. 2016, 155, 78–84. [Google Scholar] [CrossRef]
  43. Frank, J.; Therasme, O.; Volk, T.A.; Brown, T.; Malmsheimer, R.W.; Fortier, M.-O.; Eisenbies, M.H.; Ha, H.; Heavey, J. Integrated Stochastic Life Cycle Assessment and Techno-Economic Analysis for Shrub Willow Production in the Northeastern United States. Sustainability 2022, 14, 9007. [Google Scholar] [CrossRef]
  44. Senerby-Forsse, L.; Ferm, A.; Kauppi, A. Coppicing Ability and Sustainability. In Ecophysiology of Short Rotation Forest Crops; Elsevier: Essex, UK, 1992; pp. 146–184. [Google Scholar]
Figure 1. Individual plot of a single cultivar at either the Tully or Belleville site. X indicates individual willow plants in the original planting design. Gray areas indicate the areas where an individual plant in each plot was selected for excavation and measurements of both belowground and aboveground biomass.
Forests 14 00525 g001
Figure 2. Allocation of biomass to the components of leaf, shoot, aboveground stool (AGS), belowground stool (BGS), coarse root (CR), and fine root (FR) for three willow cultivars growing at two sites showing (a) biomass quantities and (b) percentage distribution of total plant biomass. Standard error bars for each component rise from the top of the bar segment, except for shoots, which drop down from the top of the bar segment so as to not cover the leaf bar segment.
Forests 14 00525 g002aForests 14 00525 g002b
Figure 3. Allocation of belowground biomass by component in 15 cm depth increments for the three willow cultivars (Cultivars are in rows at two sites (sites are in columns). The aboveground portion of the stool is included as a separate category. Note: (a) is Fish Creek at Belleville, (b) is Fish Creek at Tully, (c) is Oneida at Belleville, (d) is Oneida at Tully, (e) is SX61 at Belleville, and (f) is SX 61 at Tully.
Forests 14 00525 g003
Table 1. Means (±standard error) and ANOVA results for allocation proportions and ratios of different plant components for the three willow cultivars of Fish Creek (FC), Oneida (ON), and SX61 (SX) grown at the two different sites of Belleville (B) and Tully (T). p-values less and 0.1 are in bold for site effect, cultivar effect, site × cultivar interaction, and yield trial production covariate effect. Least square mean separations for all six simple effects are reported when the site × cultivar term was significant and for the main effects when only the site or cultivar terms were significant. Aboveground biomass is leaves and shoots, and belowground biomass includes the aboveground stool (AGS), belowground stool (BGS), coarse roots (CRs), and fine roots (FRs).
ParameterMean (SE)p-Values from ANOVA for Effects of Site, Cultivar, and Site × Cultivar Interactions aLeast Squares Means Separations for Significant ANOVA Parameters in Column to the Left (a = 0.1) b
SiteCultivarSite × CultivarMeasurement Plot YieldBellevilleTullyFish CreekOneidaSX61
% Aboveground Biomass56.3 (2.0)0.26080.40590.9423 0.0435
% Belowground Biomass43.7 (2.0)0.26080.40590.9423 0.0435
% Leaf5.5 (0.3)0.9275 0.0031 0.1647 0.0897 4.1 b6.6 a5.7 a
% Shoot50.8 (1.9)0.22760.18350.9331 0.0443
% AGS7.7 (0.6) 0.0258 0.3071 0.0805 0.0538 SX: 10.9 a; FC: 8.0 b; ON: 7.9 bFC: 7.6 b; ON: 5.9 b; SX: 5.7 b
% BGS11.0 (0.4)0.4622 0.0808 0.0808 x T: 10.6 ab; B: 9.5 bB: 12.9 a; T: 10.6 abB: 12.0 a; T: 10.5 ab
% CRs12.0 (0.7)0.35750.45530.7318 0.0155
% FRs13.1 (1.4) 0.0130 0.43840.7561 0.0137 9.6b16.7a
% AGS of Belowground Biomass18.2 (1.6) 0.0024 0.0323 0.0177 0.0005 SX: 24.8 a; FC: 22.2 ab; ON: 20.3 bcFC: 17.4 c; ON: 12.7 d; SX: 12.0 d
% BGS of Belowground Biomass25.8 (1.2) 0.0300 0.25580.3930 x 28.9 a22.6 b
% CR of Belowground Biomass27.2 (0.7)0.89980.77190.2881 0.0723
% FR of Belowground Biomass28.8 (2.2) 0.0050 0.46760.5414 0.0275 22.0 b35.6 a
root:shoot
ratio
0.63 (0.04)0.89700.28340.8481 0.0978
leaf:stem
ratio
0.109 (0.006) 0.0806 <0.0001 0.0041 x T: 0.086 d; 0.065 eB: 0.137 a; T: 0.125 bcT: 0.127 b; B: 0.116 c
FR:CR
ratio
1.07 (0.08) 0.0142 0.50070.9566x0.80 b1.33 a
a Note: When the covariate term was not significant, it was removed from the model and the model was rerun with no covariate. b Note: The six simple effects are placed either under the site headings or cultivar headings so as not to necessitate six more columns in the table. Which heading is used is determined by which main effect has the lowest p-value, but placement does not minimize the significance of the six-way breakdown.
Table 2. Root:Shoot (R:S) ratios of three shrub willow cultivars at two different sites. Root biomass for this ratio includes an aboveground stool, belowground stool, and coarse roots.
SiteCultivarR:S RatioSEAdjusted a
R:S Ratios
BellevilleFish Creek0.460.030.52
BellevilleOneida0.650.160.65
BellevilleSX610.720.120.73
TullyFish Creek0.630.080.57
TullyOneida0.650.090.63
TullySX610.640.100.66
a Adjusted R:S ratio takes into account the influence of the measurement plot yield covariate, adjusting each site-cultivar combination to equal conditions (with a measurement plot yield of 32.4 Mg ha−1, which is the mean for this study).
Table 3. A summary of shrub willow R:S ratios reported in the literature, including a summary of key information on sites, cultivars included, shoot and root ages at the time of the data collection, and R:S ratios both with and without fine roots included.
SourceSite(s)CultivarRoot Age (years)Shoot Age (years)RotationR:S RatioR:S Ratio (Including FRs)
Rytter 2001 [18]Clay site; Sandy siteS. viminalis a1
2 or 3
1
2 or 3
1
1
0.22–0.29
0.16–0.21
0.55–0.68
0.33–0.36
Zan et al., 2001 [19]high and low-quality sitesS. alba × glatfelteri4120.2–0.40.5–1.0
Matthews 2001 [20]IngerthorpeBowles hybrid4; 6; 111; 2; 33; 4; 50.23–0.480.27–0.56
Matthews 2001 [20]Long AshtonGigantea221222.73.0
Volk 2002 [21]Tully, NY, USASV1
SX61
211 5.7–6.2
2.4–3.0
Volk 2002 [21]Wolcott, NY, USASV1211 0.9–1.1
Guidi and Labrecque 2010 [37] 0.54
Stadnyk 2010 [26]Saskatoon, SK, USACAN
SHE
FC
ALL
SX61
SX64
2210.38
0.34
0.22
0.30
0.32
0.28
Stadnyk 2010 [26]Prince Albert, SK, USACAN
SHE
FC
ALL
SX61
SX64
2210.22
0.33
0.18
0.81
0.13
0.28
Pacaldo et al., 2013 [15]Tully, NY, USASV15; 14; 1922; 5; 61.0–1.31.9–2.5
Pacaldo et al., 2013 [15]Lafayette, NY, USASV112241.94.1
Phillips et al., 2014 [38]Gisborne, New ZealandHiwinui and Tangoio1110.47–0.93
Hangs et al., 2014 b [22]4 sites in Saskatchewan6 cultivars4310.110.38–0.98
Cunniff et al., 2015 [10]HarpendenEndurance, Resolution, Terra Nova, Tora3; 521 or 20.1–0.2 c
Cunniff et al., 2015 [10]AberystwythEndurance, Resolution, Terra Nova, Tora3; 521 or 20.2–0.3 c
Tylek et al., 2017 [39]KaniówSalix spp.12341.191.23
Current StudyTully and Belleville, NYFish Creek, Oneida, SX611032
a Cultivar abbreviations: Where a cultivar name is not provided, genus or species level information is used. CAN—Canastota, SHE—Sherburne, FC—Fish Creek, ALL—Allegany; b No statistical breakdown into differences by cultivar or site for Hangs et al. [22]; c Cunniff et al. [10] reports belowground biomass fraction which seems to include indicate (BGS + CR + FR)/(shoot + AGS). No breakdown into components is given to convert to R:S.
Table 4. Mean (standard error) of percent carbon content for different plant parts for three willow cultivars planted at two sites.
PositionBellevilleTully
9882-349980-005SX619882-349980-005SX61
Percent Carbon (Mean and Standard Error)
Foliage47.1 (0.06)45.1 (0.28)45.5 (0.15)47.5 (0.12)46.3 (0.24)45.3 (0.51)
Stem46.5 (0.11)46.3 (0.12)45.8 (0.22)47.0 (0.38)46.6 (0.03)46.3 (0.01)
Aboveground Stool47.3 (0.68)46.0 (0.19)46.2 (0.08)47.7 (0.63)46.5 (0.09)46.5 (0.03)
Belowground Stool46.7 (0.29)46.0 (0.12)45.4 (0.23)46.2 (0.42)46.0 (0.20)45.4 (0.23)
Coarse Roots44.3 (0.19)44.6 (0.16)44.5 (0.44)45.1 (0.11)45.3 (0.14)44.8 (0.10)
Fine Roots45.1 (0.38)45.5 (0.37)44.6 (0.42)45.2 (0.41)45.6 (0.22)46.0 (0.41)
Disclaimer/Publisher’s Note: The statements, opinions and data contained in all publications are solely those of the individual author(s) and contributor(s) and not of MDPI and/or the editor(s). MDPI and/or the editor(s) disclaim responsibility for any injury to people or property resulting from any ideas, methods, instructions or products referred to in the content.

