
Field Drying for Enhancing Biomass Quality of Eucalyptus Logs and Trees in Florida, USA


Abstract
:1. Introduction
2. Materials and Methods
2.1. FORCE Study
2.2. IRREC Study
3. Results and Discussion
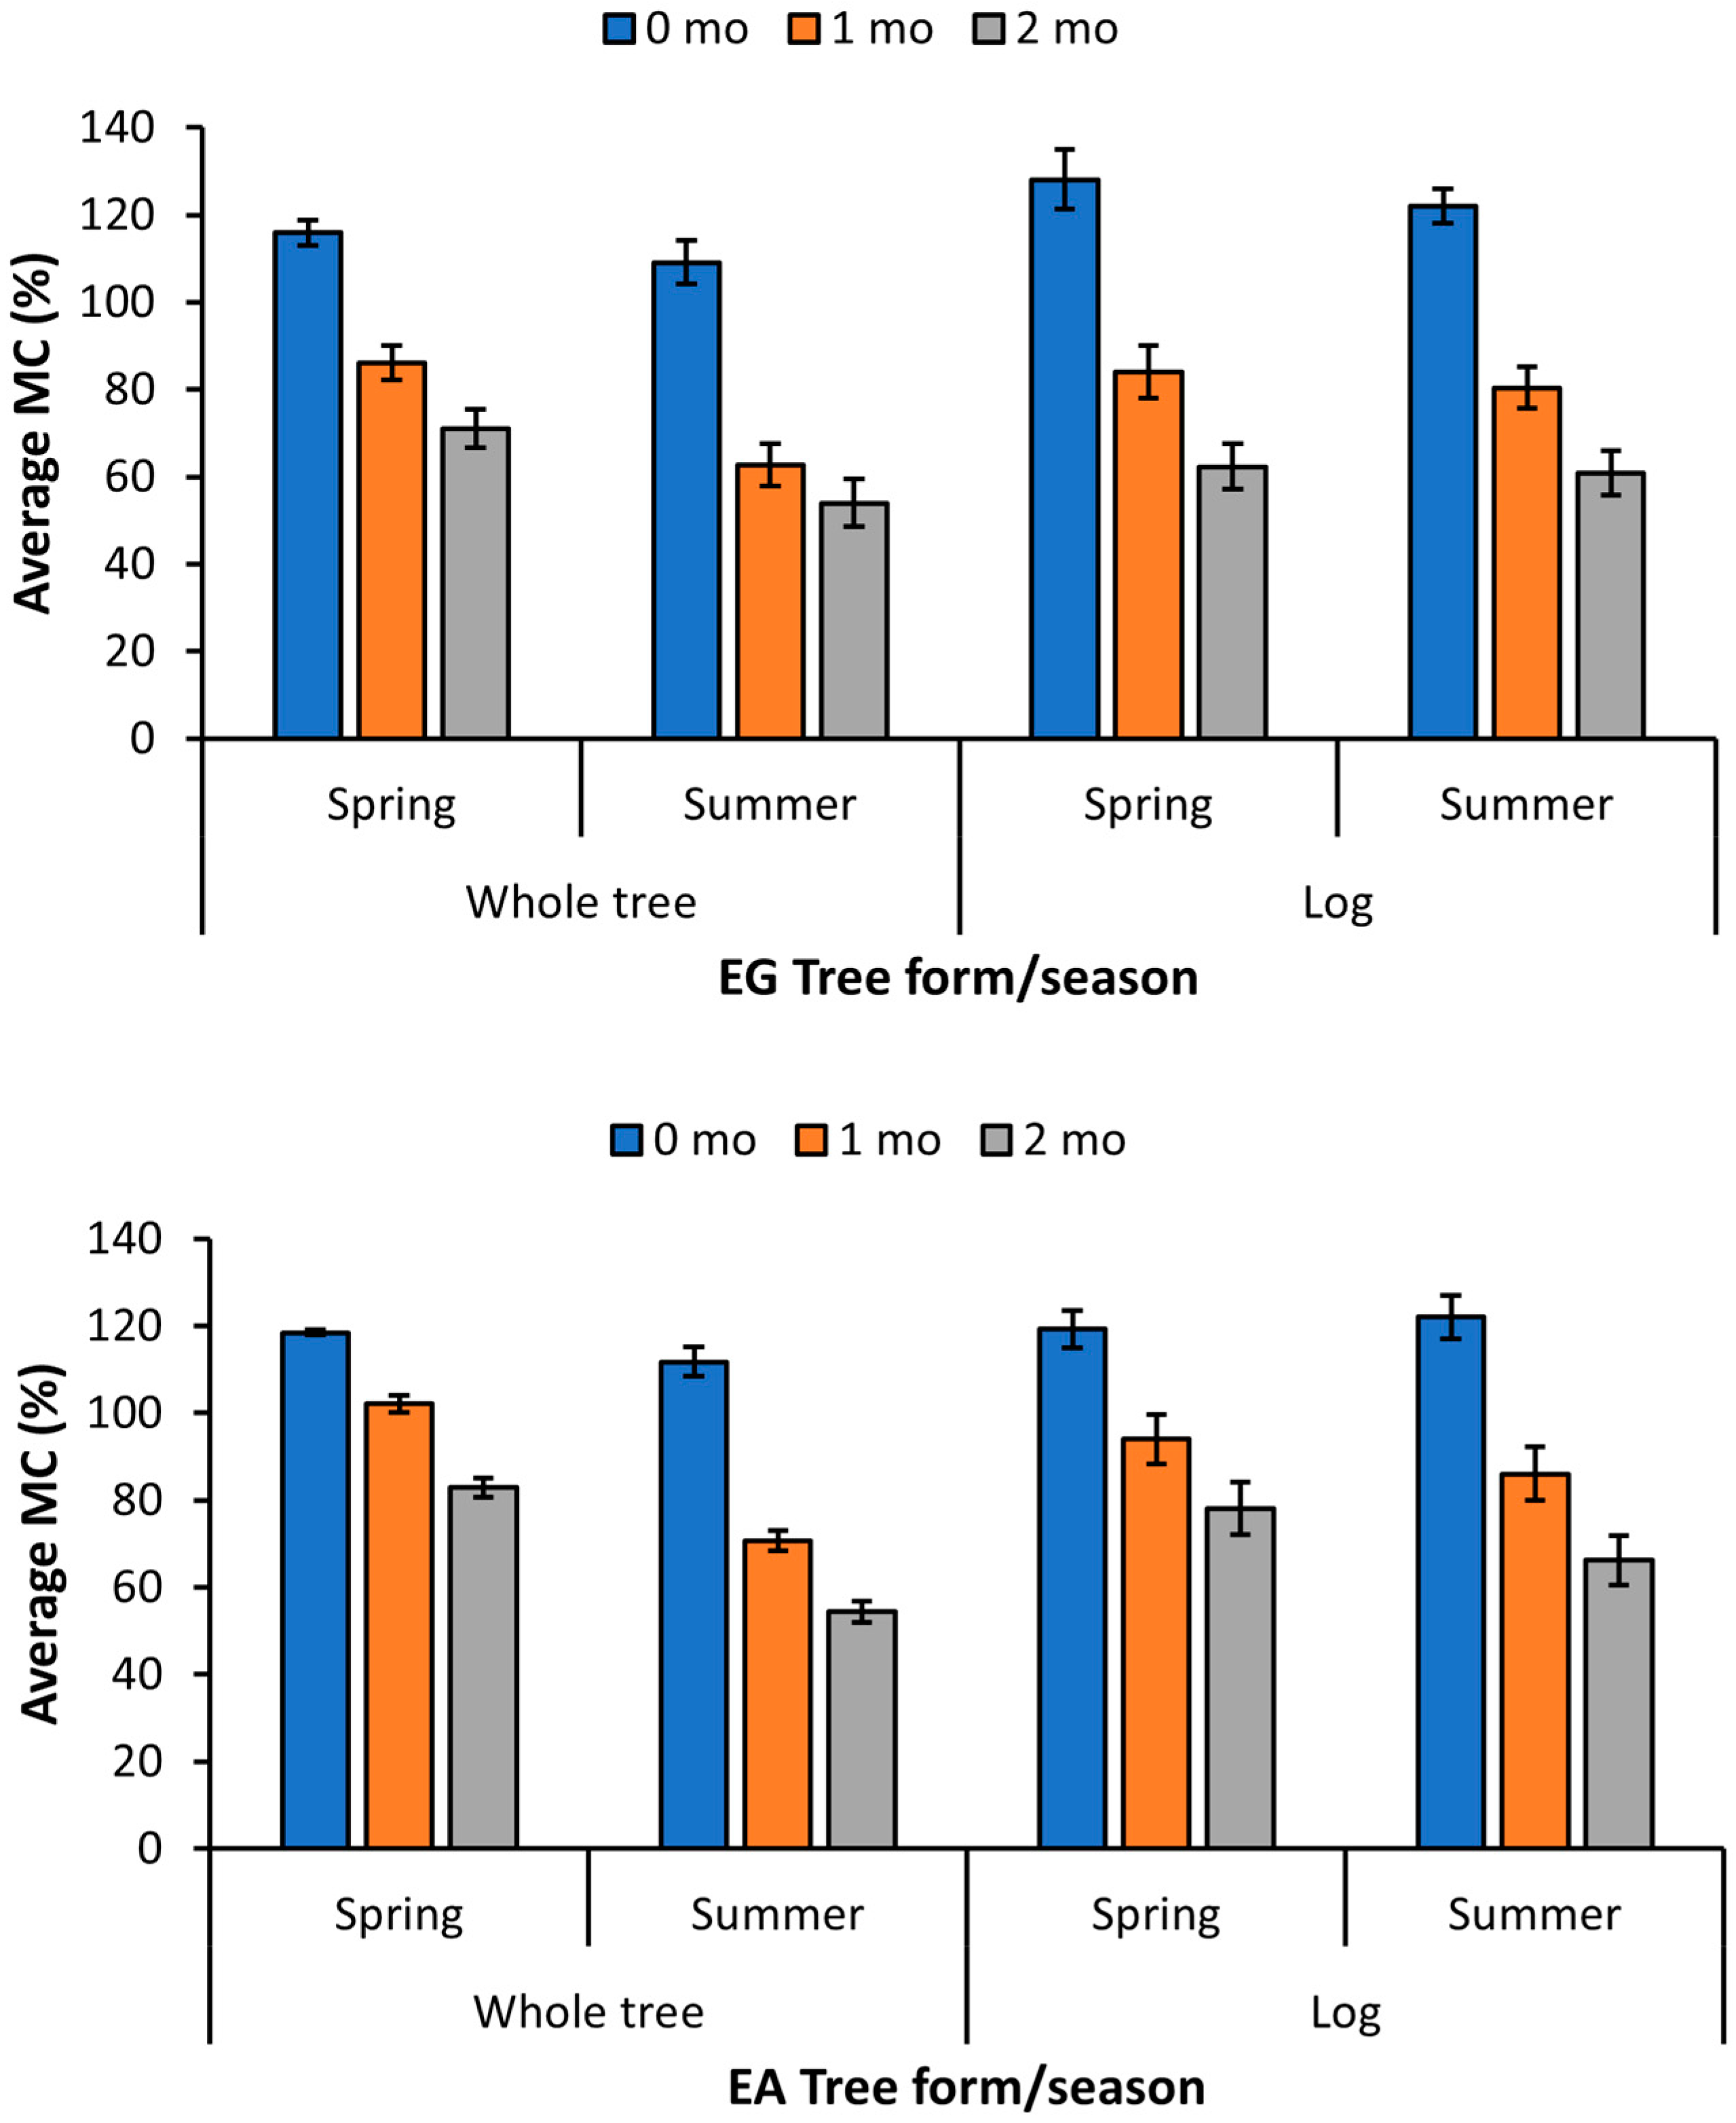
3.1. FORCE Study
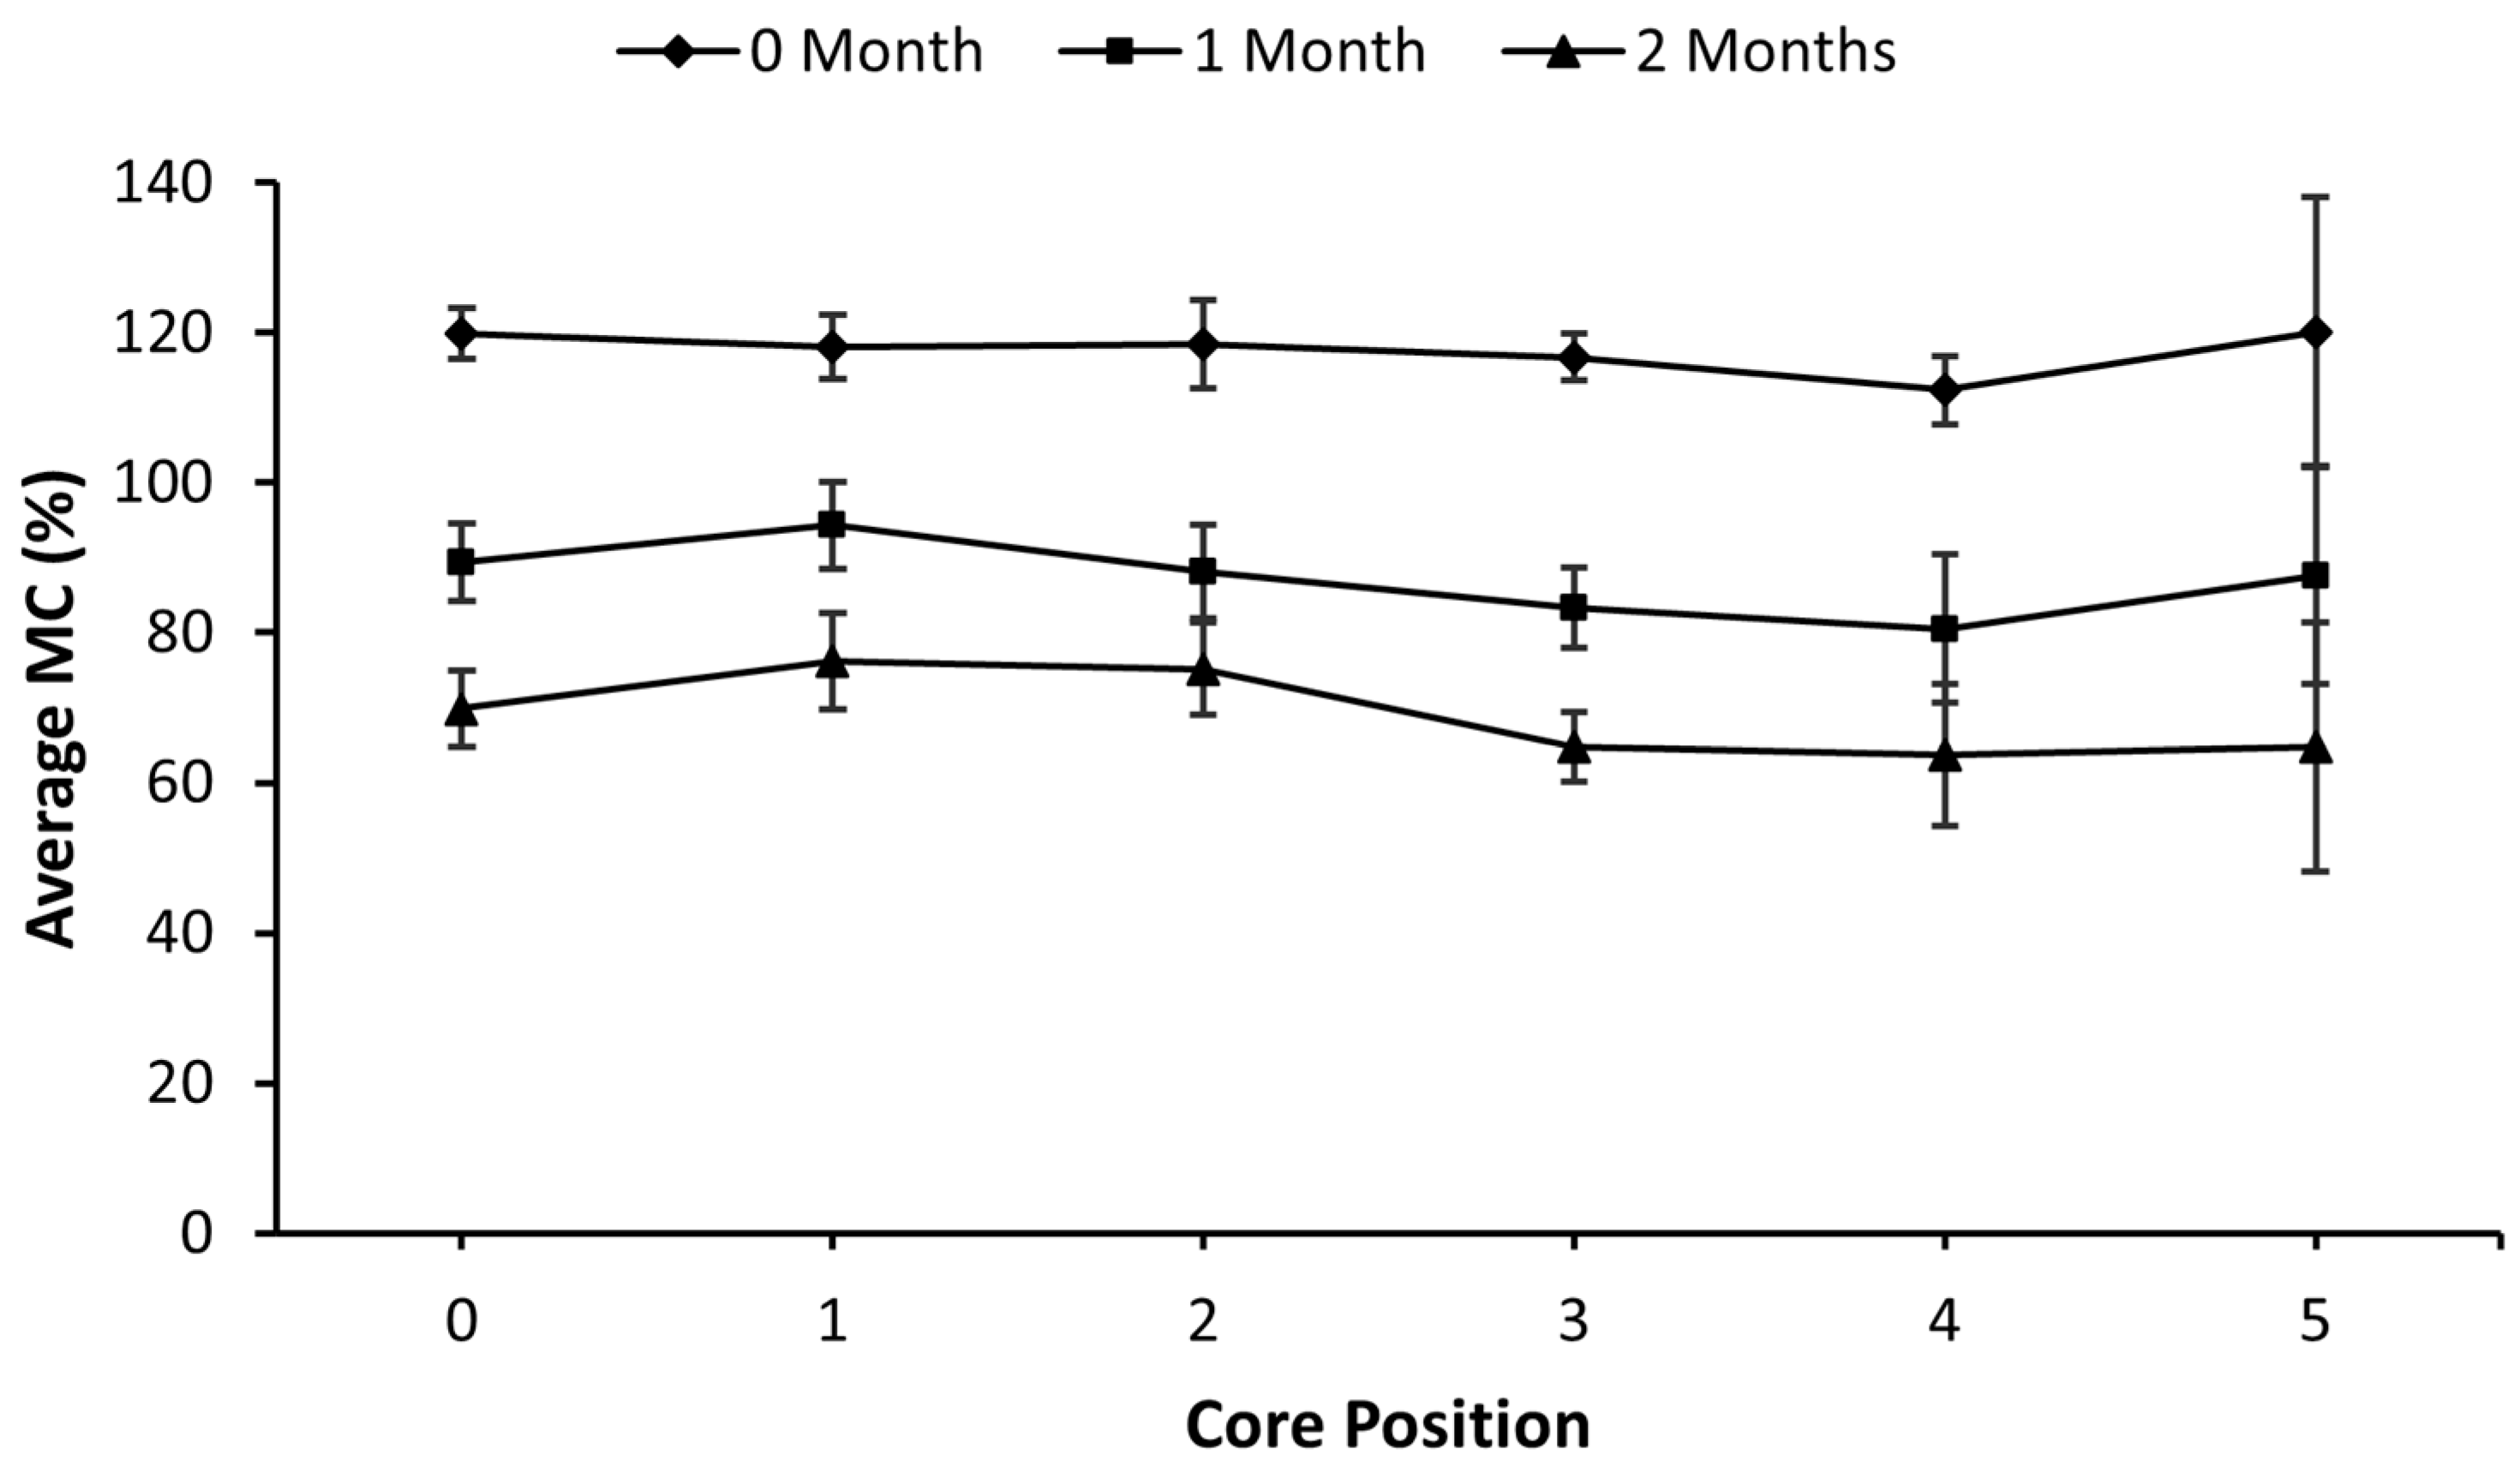
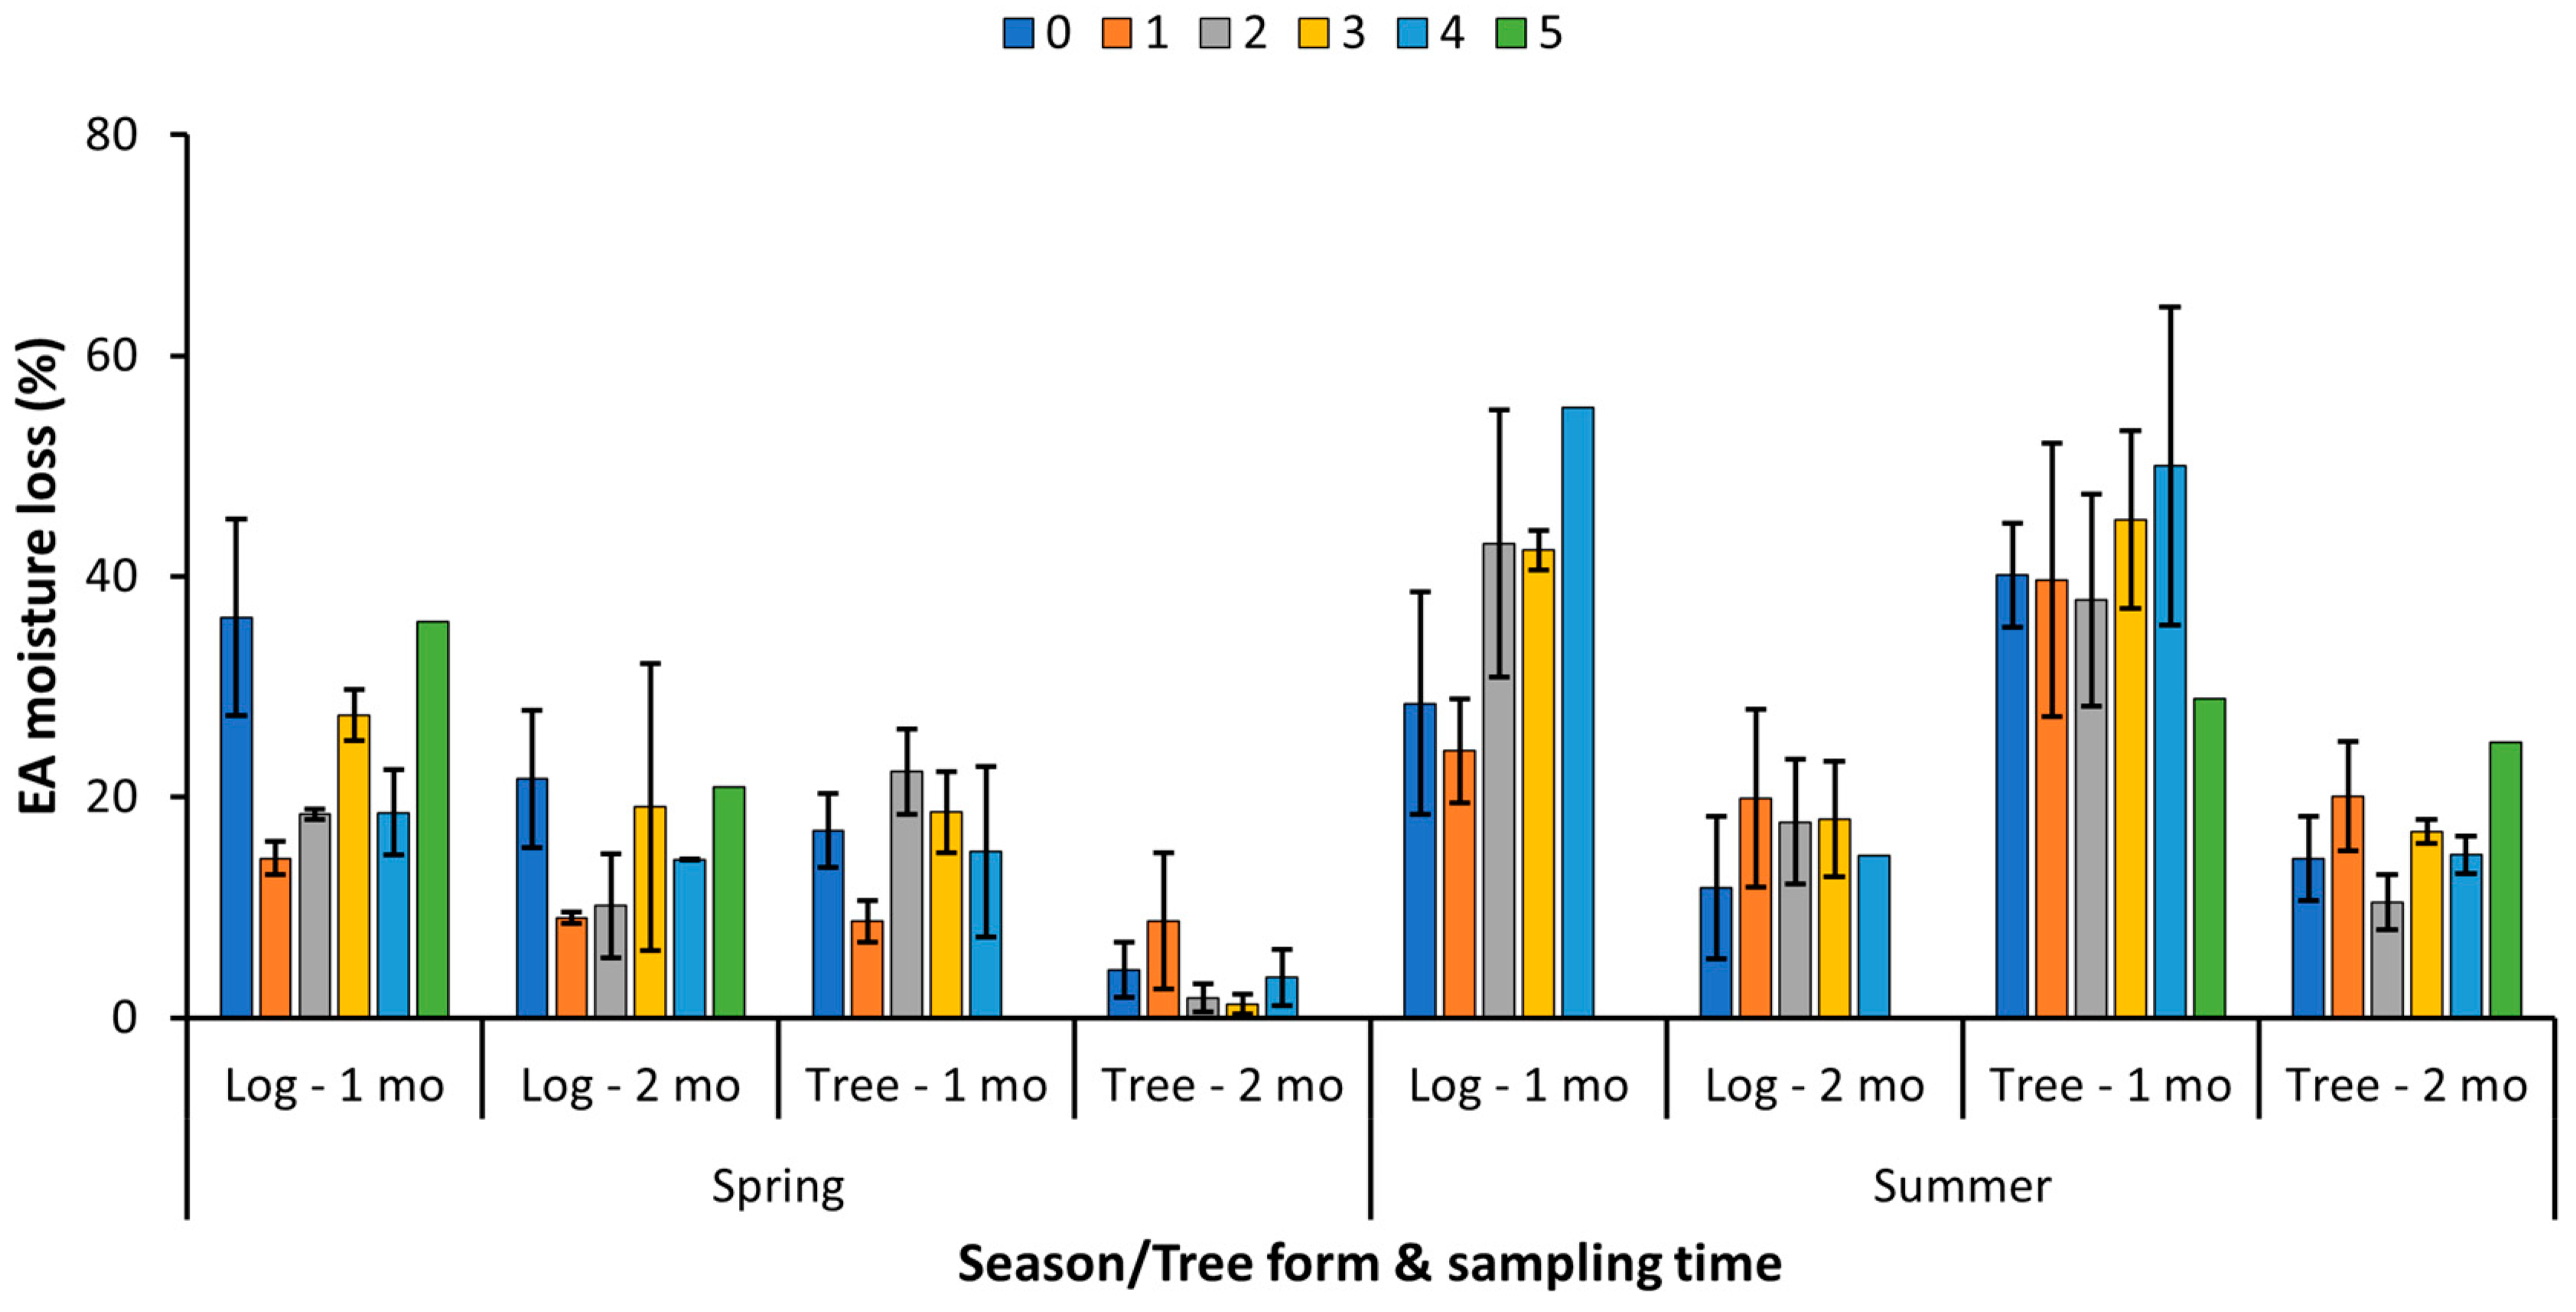
3.2. IRREC Study
4. Conclusions
Author Contributions
Funding
Data Availability Statement
Acknowledgments
Conflicts of Interest
Appendix A

| Tree ID | Species | Tree Form | Class Size | Height (m) | DBH (cm) | Crown Length (m) | Crown Width (m) |
|---|---|---|---|---|---|---|---|
| 16-78E a | EA | Tree | Large | 19.5 | 31.1 | 16.2 | 4.0 |
| 16-70E a | EA | Log | Large | 22 | 26.1 | 15.8 | 3.4 |
| 20-68 a | EA | Log | Medium | 22.8 | 21.2 | 17.4 | 3.9 |
| 20-63 | EA | Tree | Medium | 20.5 | 20.0 | 18.2 | 4.7 |
| 20-40 | EA | Tree | Small | 9.4 | 11.5 | 7.4 | 1.8 |
| 20-28 | EA | Log | Small | 12.8 | 10.8 | 11.4 | 2.3 |
| 20-42 | EG | Tree | Large | 25.9 | 29.6 | 15.0 | 7.3 |
| 20-104 | EG | Tree | Large | 23.8 | 27.5 | 17.1 | 10.2 |
| 20-58 | EG | Log | Medium | 24.5 | 21.2 | 17.1 | 6.0 |
| 20-47 | EG | Tree | Medium | 21.3 | 21.1 | 17.1 | 6.0 |
| 20-100 | EG | Log | Small | 13.1 | 19.2 | 9.0 | 2.6 |
| 20-41 | EG | Log | Small | 12.1 | 10.4 | 7.0 | 3.3 |
| Tree ID | Species | Tree Form | Class Size | Height (m) | DBH (cm) | Crown Length (m) | Crown Width (m) |
|---|---|---|---|---|---|---|---|
| 20-23 | EA | Log | Large | 21.5 | 26.1 | 15.9 | 4.9 |
| 20-137 | EA | Tree | Large | 20.0 | 25.2 | 16.5 | 4.4 |
| 20-140 | EA | Tree | Medium | 18.3 | 21.5 | 16.6 | 3.8 |
| 20-25 | EA | Log | Medium | 19.2 | 21.4 | 16.5 | 4.2 |
| 20-139 | EA | Tree | Small | 12.5 | 11.5 | 10.0 | 2.3 |
| 16-40E | EA | Log | Small | 11.4 | 10.9 | 9.4 | 2.9 |
| 13-44 | EG | Tree | Large | 26.3 | 25.7 | 12.9 | 2.8 |
| 13-45 | EG | Log | Large | 24.3 | 25.5 | 13.4 | 2.9 |
| 20-53 | EG | Log | Medium | 25.5 | 22.3 | 14.3 | 3.7 |
| 16-171E | EG | Tree | Medium | 21.2 | 21.6 | 12.2 | 4.0 |
| 20-113 | EG | Log | Small | 19.5 | 13.9 | 11.6 | 1.8 |
| 20-162 | EG | Tree | Small | 14.6 | 13.1 | 10.5 | 0.8 |
| Tree ID | Density | Top | Month | DBH | Height | Crown Height | MC |
|---|---|---|---|---|---|---|---|
| 1 | 3333 | Yes | 0 | 8.7 | 15.5 | 11.9 | 136.6 |
| 2 | 3333 | No | 2 | 6.1 | 13.4 | 9.5 | 50.8 |
| 3 | 3333 | No | 1 | 4.1 | 10.1 | 6.4 | 22.4 |
| 4 | 3333 | Yes | 0 | 7.3 | 14.3 | 9.8 | 138.5 |
| 5 | 3333 | Yes | 2 | 8.8 | 18.9 | 11.9 | 46.9 |
| 6 | 3333 | Yes | 1 | 5.1 | 11.9 | 9.1 | 34.1 |
| 7 | 1111 | Yes | 0 | 12.9 | 18.3 | 9.8 | 123.9 |
| 8 | 1111 | No | 2 | 9.9 | 17.4 | 9.8 | 63.1 |
| 9 | 1111 | No | 1 | 4.9 | 9.5 | 4.3 | 23.0 |
| 10 | 1111 | Yes | 2 | 10.7 | 17.7 | 11.0 | 48.0 |
| 11 | 1111 | Yes | 1 | 9.0 | 16.5 | 10.7 | 52.0 |
| 12 | 1111 | Yes | 0 | 9.4 | 16.8 | 10.4 | 138.3 |
| 13 | 1667 | No | 1 | 8.7 | 15.3 | 9.5 | 69.5 |
| 14 | 1667 | No | 2 | 11.8 | 17.7 | 9.5 | 66.4 |
| 15 | 1667 | Yes | 0 | 8.8 | 17.1 | 9.5 | 119.4 |
| 16 | 1667 | Yes | 1 | 10.3 | 17.4 | 9.5 | 57.6 |
| 17 | 1667 | Yes | 2 | 10.8 | 15.5 | 9.8 | 43.7 |
| 18 | 1667 | Yes | 0 | 10.9 | 18.0 | 9.8 | 126.4 |
| G | 1667 | No | 2 | 13.4 | - | - |
| Species | Form | Season | Duration | MC by Core Position | |||||||
|---|---|---|---|---|---|---|---|---|---|---|---|
| 0 | 1 | 2 | 3 | 4 | 5 | 6 | 7 | ||||
| EG | Whole | Spring | 0 | 136.0 | 132.8 | 117.0 | 108.1 | 106.0 | 105.8 | 105.4 | 96.2 |
| 1 | 107.7 | 102.4 | 92.6 | 83.6 | 79.3 | 71.6 | 60.2 | 61.4 | |||
| 2 | 88.4 | 91.4 | 83.2 | 72.9 | 61.6 | 54.2 | 38.9 | 43.1 | |||
| Summer | 0 | 127.6 | 119.9 | 102.8 | 94.8 | 91.1 | 91.7 | 98.3 | 97.2 | ||
| 1 | 96.8 | 78.3 | 57.1 | 59.4 | 51.2 | 44.1 | 45.2 | 29.1 | |||
| 2 | 95.0 | 73.6 | 55.3 | 51.5 | 45.8 | 35.4 | 33.3 | 12.2 | |||
| Log | Spring | 0 | 147.2 | 146.5 | 115.2 | 107.0 | 108.4 | 107.8 | 103.1 | - | |
| 1 | 91.7 | 102.1 | 79.8 | 73.8 | 63.1 | 63.8 | 62.5 | - | |||
| 2 | 78.0 | 64.2 | 62.3 | 58.0 | 47.2 | 50 | 41.8 | - | |||
| Summer | 0 | 131.7 | 128.6 | 128.2 | 123.3 | 116.0 | 115.8 | 112.4 | 95.1 | ||
| 1 | 106.6 | 90.2 | 82.5 | 84.4 | 75.3 | 61.9 | 56.6 | 52.5 | |||
| 2 | 88.6 | 69.9 | 62.6 | 63.6 | 47.0 | 44.4 | 42.1 | 38.3 | |||
| EA | Whole | Spring | 0 | 121.0 | 117.0 | 119.8 | 118.2 | 115.3 | - | - | - |
| 1 | 104.0 | 108.3 | 97.5 | 99.6 | 100.3 | - | - | - | |||
| 2 | 86.2 | 85.5 | 84.1 | 79.5 | 77.4 | - | - | - | |||
| Summer | 0 | 116.7 | 115.2 | 107.2 | 111.9 | 108.9 | - | - | - | ||
| 1 | 76.6 | 75.5 | 69.4 | 66.7 | 58.9 | - | - | - | |||
| 2 | 62.2 | 55.4 | 58.9 | 49.9 | 44.2 | - | - | - | |||
| Log | Spring | 0 | 110.9 | 119.1 | 124.0 | 119.7 | 117.2 | 138.1 | - | - | |
| 1 | 74.6 | 104.7 | 105.6 | 92.3 | 98.6 | 102.2 | - | - | |||
| 2 | 53.0 | 95.6 | 95.4 | 73.2 | 84.3 | 81.3 | - | - | |||
| Summer | 0 | 130.7 | 122.5 | 123.3 | 117.0 | 103.3 | 102.0 | - | - | ||
| 1 | 102.2 | 98.3 | 80.1 | 74.7 | 48.0 | 73.1 | - | - | |||
| 2 | 77.9 | 78.4 | 62.3 | 56.6 | 33.3 | 48.1 | - | - | |||

References
- Caputo, A.C.; Palumbo, M.; Pelagagge, P.M.; Scacchia, F. Economics of biomass energy utilization in combustion and gasification plants: Effects of logistic variables. Biomass Bioenergy 2005, 28, 35–51. [Google Scholar] [CrossRef]
- McKendry, P. Energy production from biomass (part 2): Conversion technologies. Bioresour. Technol. 2002, 83, 47–54. [Google Scholar] [CrossRef]
- Pang, S.; Xu, Q. Drying of Woody Biomass for Bioenergy Using Packed Moving Bed Dryer: Mathematical Modeling and Optimization. Dry. Technol. 2010, 28, 702–709. [Google Scholar] [CrossRef]
- Baxter, L. Biomass-coal co-combustion: Opportunity for affordable renewable energy. Fuel 2005, 84, 1295–1302. [Google Scholar] [CrossRef]
- Liang, T.; Khan, M.; Meng, Q. Spatial and temporal effects in drying biomass for energy. Biomass Bioenergy 1996, 10, 353–360. [Google Scholar] [CrossRef]
- Farr, A.K.; Atkins, D. Fuel Supply Planning for Small-Scale Biomass Heating Systems. West. J. Appl. For. 2010, 25, 18–21. [Google Scholar] [CrossRef]
- Rockwood, D.L.; Squillace, A. Increasing alcohol production from wood by utilizing genetic variation in wood characteristics. In Proceedings of the 1981 TAPPI Annual Meeting, Chicago, IL, USA, 2–5 March 1981; pp. 307–316. [Google Scholar]
- McMinn, J. Transpirational drying of red oaks, sweetgum, and yellow-poplar in the Upper Piedmont of Georgia. For. Prod. J. 1986, 36, 25–27. [Google Scholar]
- McMinn, J.; Taras, M. Transpirational drying. In Proceedings of the Sixth Internatinal FPRS Industrial Wood Energy Forum, Washington, DC, USA, 8–10 March 1982; pp. 206–207. [Google Scholar]
- Ou, L.; Kim, H.; Kelley, S.; Park, S. Impacts of feedstock properties on the process economics of fast-pyrolysis biorefineries: Understanding how feedstock properties affect process economics. Biofuels Bioprod. Biorefin. 2018, 12, 442–452. [Google Scholar] [CrossRef]
- Liu, P.; Hague, R.; Bridgwater, T. Effect of Feedstock Moisture Content on the Quality of Liquids from Fast Pyrolysis of Spruce Wood. 2001. Available online: p2infohouse.org/ref/35/34329.pdf (accessed on 6 December 2022).
- CIRAD—FRA; IUFRO—AUT; MUSE—FRA. Eucalyptus 2018: Managing Eucalyptus Plantation under Global Changes; CIRAD: Montpellier, France, 2018. [Google Scholar] [CrossRef]
- Rockwood, D.L.; Ellis, M.F.; Liu, R.; Zhao, F.; Fabbro, K.W.; He, Z.; Derbowka, D.R. Forest trees for biochar and carbon sequestration: Production and benefits. In Applications of Biochar for Environmental Safety; Abdel-hafez, A., Abbas, M., Eds.; IntechOpen: London, UK, 2020. [Google Scholar] [CrossRef]
- Fabbro, K.W.; Rockwood, D.L. Optimal management and productivity of Eucalyptus grandis on former phosphate mined and citrus lands in central and southern Florida: Influence of genetics and spacing. In Proceedings of the 18th Biennial Southern Silvicultural Research Conference, Knoxville, TN, USA, 2–5 March 2015; pp. 510–517. [Google Scholar]
- Ahmed, A.; Kurian, J.; Raghavan, V. Biochar influences on agricultural soils, crop production, and the environment: A review. Environ. Rev. 2016, 24, 495–502. [Google Scholar] [CrossRef]
- Jeffery, S.; Abalos, D.; Prodana, M.; Bastos, A.C.; Van Groenigen, J.W.; Hungate, B.A.; Verheijen, F. Biochar boosts tropical but not temperate crop yields. Environ. Res. Lett. 2017, 12, 053001. [Google Scholar] [CrossRef]
- Ahmed, F.; Arthur, E.; Plauborg, F.; Razzaghi, F.; Kørup, K.; Andersen, M.N. Biochar amendment of fluvio-glacial temperate sandy subsoil: Effects on maize water uptake, growth and physiology. J. Agron. Crop Sci. 2018, 204, 123–136. [Google Scholar] [CrossRef]
- Blanco-Canqui, H. Biochar and soil physical properties. Soil Sci. Soc. Am. J. 2017, 81, 687–711. [Google Scholar] [CrossRef]
- Bruun, E.W.; Petersen, C.T.; Hansen, E.H.; Holm, J.K.; Hauggaard-Nielsen, H. Biochar amendment to coarse sandy subsoil improves root growth and increases water retention. Soil Use Manag. 2014, 30, 109–118. [Google Scholar] [CrossRef]
- Hussain, M.; Farooq, M.; Nawaz, A.; Al-Sadi, A.; Solaiman, Z.M.; Alghamdi, S.S.; Ammara, U.; Ok, Y.S.; Siddique, K. Biochar for crop production: Potential benefits and risks. J. Soils Sediments 2017, 17, 685–716. [Google Scholar] [CrossRef]
- Rockwood, D.L.; Ellis, M.F.; Fabbro, K.W. Economic potential for carbon sequestration by short rotation eucalypts using biochar in Florida, USA. Trees For. People 2022, 7, 100187. [Google Scholar] [CrossRef]
- Rockwood, D.L.; Ellis, M.F.; Fabbro, K.W.; Ozores-Hampton, M.; Varshovi, A. Carbon Sequestration by Eucalypts in Florida, USA: Management Options Including Biochar and Associated Economics. IntechOpen 2022. Available online: https://www.intechopen.com/online-first/81752 (accessed on 6 December 2022).
- White, D.A.; Silberstein, R.P.; Balocchi-Contreras, F.; Quiroga, J.J.; Meason, D.F.; Palma, J.H.; de Arellano, P.R. Growth, water use, and water use efficiency of Eucalyptus globulus and Pinus radiata plantations compared with natural stands of Roble-Hualo forest in the coastal mountains of central Chile. For. Ecol. Manag. 2021, 501, 119676. [Google Scholar] [CrossRef]
- White, D.A.; Ren, S.; Mendham, D.S.; Balocchi-Contreras, F.; Silberstein, R.P.; Meason, D.; Iroumé, A.; de Arellano, P.R. Is the reputation of Eucalyptus plantations for using more water than Pinus plantations justified? Hydrol. Earth Syst. Sci. 2022, 26, 5357–5371. [Google Scholar] [CrossRef]
- Maier, C.A.; Albaugh, T.J.; Cook, R.I.; Hall, K.; McInnis, D.; Johnsen, K.H.; Johnson, J.; Rubilar, R.A.; Vose, J.M. Comparative water use in short-rotation Eucalyptus benthamii and Pinus taeda trees in the Southern United States. For. Ecol. Manag. 2017, 397, 126–138. [Google Scholar] [CrossRef]
- Engelund, E.T.; Thygesen, L.G.; Svensson, S.; Hill, C.A.S. A critical discussion of the physics of wood–water interactions. Wood Sci. Technol. 2013, 47, 141–161. [Google Scholar] [CrossRef]
- Skaar, C. Water in Wood, 4th ed.; Syracuse University Press: Syracuse, NY, USA, 1972. [Google Scholar]
- Rockwood, D.L.; Rudie, A.W.; Ralph, S.A.; Zhu, J.Y.; Winandy, J.E. Energy Product Options for Eucalyptus Species Grown as Short Rotation Woody Crops. Int. J. Mol. Sci. 2008, 9, 1361–1378. [Google Scholar] [CrossRef]
- Yang, L.; Zheng, J.; Huang, N. The Characteristics of Moisture and Shrinkage of Eucalyptus urophylla × E. Grandis Wood during Conventional Drying. Materials 2022, 15, 3386. [Google Scholar] [CrossRef] [PubMed]
- Da Silva, W.M.; Zanuncio, A.J.V.; Carvalho, A.G.; de Castro, V.R.; Carneiro, A.D.C.O.; Araújo, S.D.O. Drying of eucalyptus logs from plantations with different spacing between trees. Bioresources 2023, 18, 1177–1184. [Google Scholar] [CrossRef]
- Clark, A.I.; Daniels, R. Estimating Moisture Content of Tree-Length Roundwood. Pulping/Process and Product Quality Conference, Sheraton Boston. 2000. Available online: http://www.treesearch.fs.fed.us/pubs/9741 (accessed on 18 February 2023).
- Stöhr, H.-P. Initial Moisture Content and Density and Drying Rate of Three Pine Species Growing in the Natal Midlands. S. Afr. For. J. 1980, 114, 49–57. [Google Scholar] [CrossRef]
- Nicholls, D.L.; Brackley, A.M.; Allen, T. Moisture Distributions in Western Hemlock Lumber from Trees Harvested near Sitka, Alaska; Research Note PNW-RN-530; Pacific Northwest Research Station: Corvallis, OR, USA, 2003. [CrossRef]
- Schroeder, J.; Phillips, D. Seasonal moisture content of loblolly and slash pine. For. Prod. J. 1972, 22, 54–56. [Google Scholar]
- Patterson, D.W.; Doruska, P. Effect of seasonality on bulk density, moisture content, and specific gravity of loblolly pine tree-length pulpwood logs in southern Arkansas. For. Prod. J. 2005, 55, 204–208. [Google Scholar]
- Yang, L.; Liu, H. A Review of Eucalyptus Wood Collapse and its Control during Drying. Bioresources 2018, 13, 2171–2181. [Google Scholar] [CrossRef]
- Mishra, G.; Collings, D.A.; Altaner, C.M. Physiological changes during heartwood formation in young Eucalyptus bosistoana trees. IAWA J. 2018, 39, 382–394. [Google Scholar] [CrossRef]
- Nascimento, T.M.D.; Monteiro, T.C.; Baraúna, E.E.P.; Moulin, J.C.; Azevedo, A.M. Drying influence on the development of cracks in Eucalyptus logs. Bioresources 2019, 14, 220–233. [Google Scholar] [CrossRef]
- Gislerud, O. Drying and storing of comminuted wood fuels. Biomass 1990, 22, 229–244. [Google Scholar] [CrossRef]
- McDaniel, J. Biomass Cogasification at Polk Power Station; Final Technical Report to Department of Energy; Tampa Electric Company: Tampa, FL, USA, 2002. [Google Scholar]
- Zanuncio, A.J.V.; Carvalho, A.G.; Da Silva, L.F.; Lima, J.T.; Trugilho, P.F.; Da Silva, J.R.M. Predicting moisture content from basic density and diameter during air drying of Eucalyptus and corymbia logs. Maderas. Cienc. Y Tecnol. 2015, 17, 335–344. [Google Scholar] [CrossRef]
- Sims, R.E.; Venturi, P. All-year-round harvesting of short rotation coppice eucalyptus compared with the delivered costs of biomass from more conventional short season, harvesting systems. Biomass Bioenergy 2004, 26, 27–37. [Google Scholar] [CrossRef]
- Lowe, H.T.; Sims, R.E.H.; Maiava, T. Evaluation of a low cost method for drying fuelwood from short rotation tree crop for small scale industry. In Proceedings of the “Biomass for Energy, Environment, Agriculture and Industry”, Eighth European Biomass Conference, Vienna, Austria, 3–5 October 1994; Chartier, P., Beenackers, A.A.C.M., Grassi, G., Eds.; Pergamon Press: Vienna, Austria, 1994; Volume 1, pp. 461–467. [Google Scholar]


| Study | Date | Species | Density | Treatments |
|---|---|---|---|---|
| FORCE-102 | 09/2002 | E. amplifolia, E. grandis, Populus deltoides Bartr. | 3333, 6666 | Control, compost, irrigation, compost + irrigation; |
| FORCE-102A | 04/2004 | E. amplifolia, E.grandis, P. deltoides, Taxodium distichum (L.) Rich | 4651 | Control, compost, irrigation, irrigation + fertilizer, irrigation + compost |
| IRREC | 06/2015 | E. grandis× E. urophylla | 1111, 1667, 3333 | Control, four fertilizers |
| Study Season/Species | Number of Trees | Height (m) | DBH (cm) | Crown Length (m) | Crown Diameter (m) |
|---|---|---|---|---|---|
| FORCE Spring 1 | |||||
| E. amplifolia | 6 | 9.4–22.8 | 10.8–31.1 | 7.7–18.2 | 1.8–3.9 |
| E. grandis | 6 | 12.1–25.9 | 10.4–29.6 | 7.0–17.1 | 2.6–10.2 |
| FORCE Summer 2 | |||||
| E. amplifolia | 6 | 11.4–21.5 | 10.9–26.1 | 9.4–16.6 | 2.3–4.9 |
| E. grandis | 6 | 14.6–26.3 | 13.1–25.7 | 10.5–14.3 | 0.8–4.0 |
| IRREC Summer 3 | |||||
| EH1 | 19 | 9.5–18.9 | 4.1–12.9 | 2.8–8.5 | - |
| Study Season | Months after Harvest | ||
|---|---|---|---|
| 0 | 1 | 2 | |
| FORCE Spring | 10 February 2010 | 10 March 2010 | 13 April 2010 |
| FORCE Summer | 12 May 2010 | 15 June 2010 | 13 July 2010 |
| IRREC Summer | 1 August 2022 | 2 September 2022 | 3 October 2022 |
| Variable | Months after Harvest | ||
|---|---|---|---|
| 0–1 | 1–2 | 0–2 | |
| FORCE Spring | |||
| T; RH; ET | 10.1; 67; 5.59 | 18.1; 73; 10.08 | 14.4; 71; 15.67 |
| FORCE Summer | |||
| T; RH; ET | 26.0; 75; 16.23 | 27.3; 82; 13.11 | 26.8; 78; 29.34 |
| IRREC Summer (Ft. Pierce) | |||
| T; RH; ET | 27.8; 75; 14.61 | 25.9; 77; 10.52 | 26.8; 76; 25.12 |
| IRREC Summer (Okeechobee) | |||
| T; RH; ET | 26.9; 84; 13.03 | 25.4; 87; 10.13 | 26.1; 86; 23.16 |
| Study-Species | Form | Season | n | MC by Duration | ||
|---|---|---|---|---|---|---|
| 0 | ~1 | ~2 | ||||
| FORCE-E. grandis | Whole | Spring | 3 | 115.9 | 86.1 | 71.1 |
| Summer | 3 | 106.0 | 63.5 | 57.8 | ||
| Log | Spring | 3 | 128.2 | 83.7 | 62.4 | |
| Summer | 3 | 122.0 | 80.4 | 60.9 | ||
| FORCE-E. amplifolia | Whole | Spring | 3 | 118.5 | 102.1 | 82.9 |
| Summer | 3 | 111.8 | 70.7 | 54.4 | ||
| Log | Spring | 3 | 119.2 | 94.0 | 78.1 | |
| Summer | 3 | 122.1 | 86.1 | 66.2 | ||
| IRREC-EH1 | No Top | Summer | 3 | 38.3 | 60.1 | |
| Top | Summer | 6; 3; 3 | 130.5 | 47.9 | 46.2 | |
| Blocks | Summer | 7 | - | 19.4 | ||
| Tree ID | Stem Height (m) | Chlorine Content (%) |
|---|---|---|
| 16-78E | 2.4 | 0.15 |
| 16-70E | 4.8 | 0.32 |
| 20-68 | 4.8 | 0.49 |
| Month-Top | n | MC by Disk Position | |||||
|---|---|---|---|---|---|---|---|
| 0 | 1 | 2 | 3 | 4 | Average | ||
| 0-All | 6 | 138.0 ± 3.2 | 135.0 ± 4.2 | 127.3 ± 3.6 | 121.1 ± 4.4 | 114.2 ± 3.5 | 130.5 |
| 1-All | 6 | 54.4 ± 9.9 | 42.7 ± 9.5 | 34.7 ± 7.6 | 33.5 ± 7.8 | 32.9 ± 3.7 | 43.1 |
| 2-All | 6 | 69.6 ± 4.3 | 56.3 ± 5.2 | 41.9 ± 3.5 | 36.4 ± 2.9 | 34.8 ± 5.0 | 53.2 |
| 1-No Top | 3 | 47.7 ± 18.4 | 37.9 ± 19.7 | 28.1 ± 14.6 | 37.1 ± 18.7 | 22.8 | 38.3 |
| 1-Top | 3 | 61.0 ± 10.4 | 47.6 ± 6.1 | 41.2 ± 6.0 | 31.0 ± 7.7 | 37.9 ± 2.3 | 47.9 |
| 2-No Top | 3 | 75.5 ± 6.5 | 65.5 ± 7.0 | 48.1 ± 4.6 | 40.0 ± 4.9 | 45.3 ± 3.1 | 60.1 |
| 2-Top | 3 | 63.8 ± 3.9 | 47.1 ± 1.0 | 35.7 ± 0.6 | 32.8 ± 2.4 | 24.2 ± 1.8 | 46.2 |
| Factor | MC Average | ||
|---|---|---|---|
| Top | Month | Top | Month 1 |
| Yes | 0 | 130.5 ± 3.1 | 130.5 ± 3.1 A |
| No | 1 | 38.3 ± 12.7 | 43.1 ± 7.3 B |
| Yes | 47.9 ± 5.8 | ||
| No | 2 | 60.1 ± 3.9 | 53.2 ± 3.5 B |
| Yes | 46.2 ± 1.1 | ||
Disclaimer/Publisher’s Note: The statements, opinions and data contained in all publications are solely those of the individual author(s) and contributor(s) and not of MDPI and/or the editor(s). MDPI and/or the editor(s) disclaim responsibility for any injury to people or property resulting from any ideas, methods, instructions or products referred to in the content. |
© 2023 by the authors. Licensee MDPI, Basel, Switzerland. This article is an open access article distributed under the terms and conditions of the Creative Commons Attribution (CC BY) license (https://creativecommons.org/licenses/by/4.0/).
Share and Cite
Rockwood, D.L.; Tamang, B.; Ellis, M.F. Field Drying for Enhancing Biomass Quality of Eucalyptus Logs and Trees in Florida, USA. Forests 2023, 14, 899. https://doi.org/10.3390/f14050899
Rockwood DL, Tamang B, Ellis MF. Field Drying for Enhancing Biomass Quality of Eucalyptus Logs and Trees in Florida, USA. Forests. 2023; 14(5):899. https://doi.org/10.3390/f14050899
Chicago/Turabian StyleRockwood, Donald L., Bijay Tamang, and Martin F. Ellis. 2023. "Field Drying for Enhancing Biomass Quality of Eucalyptus Logs and Trees in Florida, USA" Forests 14, no. 5: 899. https://doi.org/10.3390/f14050899
APA StyleRockwood, D. L., Tamang, B., & Ellis, M. F. (2023). Field Drying for Enhancing Biomass Quality of Eucalyptus Logs and Trees in Florida, USA. Forests, 14(5), 899. https://doi.org/10.3390/f14050899