Article

Effects of Leaf Hydrophilicity and Stomatal Regulation on Foliar Water Uptake Capacity of Desert Plants

1
College of Ecology and Environment, Xinjiang University, Urumqi 830046, China
2
Key Laboratory of Oasis Ecology of Education Ministry, Xinjiang University, Urumqi 830046, China
*
Author to whom correspondence should be addressed.
Forests 2023, 14(3), 551; https://doi.org/10.3390/f14030551
Submission received: 29 January 2023 / Revised: 3 March 2023 / Accepted: 8 March 2023 / Published: 10 March 2023
(This article belongs to the Special Issue Plant Adaptation to Extreme Environments in Drylands—Series II)

Abstract

:
Foliar water uptake (FWU) is one of the primary water sources for desert plants. Desert plants’ water uptake capacity is essential in maintaining the balance of carbon and water. However, there are few studies on FWU capacity in desert plants and the physiological and ecological characteristics that lead to differences in FWU capacity. In order to clarify FWU strategies and the influencing factors of plants in desert ecosystems, this study measured the contact angle, FWU parameters, and hydraulic parameters to explore six desert plants’ FWU capacity and the effects of leaf wettability and hydraulic parameters on FWU capacity. The results showed that all six plants had FWU capacity, among which the leaves of Nitraria sibirica Pall. and Halimodendron halodendron (Pall.) Voss had a high foliar water uptake rate (k) and high foliar water uptake accumulation (FWU storage), and the leaves of Glycyrrhiza uralensis Fisch. had a high k and low FWU storage. The leaves of Populus euphratica Oliv., Apocynum hendersonii Hook. f., and Alhagi sparsifolia Shap. had a low k and low FWU storage. Additionally, FWU capacity was mainly affected by stomatal regulation compared with leaf wettability and leaf structure. The results of this study will help to improve the understanding of the physiological and ecological adaptability of desert plants.

1. Introduction

During leaf-wetting events, a water film with a water potential close to zero can be formed on the leaf surface. Water flows bidirectionally inside the leaves through pores. At this time, the external water potential of the leaf is higher than the internal water potential, thus producing the foliar water uptake phenomenon (FWU) [1]. FWU is a common physiological phenomenon in natural ecosystems [2,3] and one of the critical survival strategies for plants to maintain their water balance [4]. Previous studies have found that in the process of FWU, plants with physiological and structural differences have different FWU strategies [5,6,7,8]. In some plants, there is a trade-off between the foliar water uptake rate (k) and foliar water uptake accumulation (FWU storage). The species with high FWU storage have a low k, while those with a high k have low FWU storage [7,8,9,10]. Some scholars have also pointed out that a high k and high FWU storage can coexist in the same species [7], leading to higher water use efficiency. However, the current research on FWU strategies mainly focuses on Brazil’s high-fog and high-humidity habitats [7,10]. Due to the difference in water input, plants living in different habitats will adopt different water adaptation strategies [5]. Therefore, it is necessary to research the FWU strategies in other habitats.
In arid desert ecosystems, leaf-wetting events also occur frequently with water as the main limiting factor [11]. Previous studies found that most plants are capable of FWU, and that the absorbed water could be transported downward through the xylem and improve the branch water status and photosynthetic capacity, promoting the carbon and water balance of plants in arid areas [11,12]. FWU also plays an important role in the survival and growth of trees in drought periods, helping to repair xylem embolism and increase water conduction efficiency [13,14]. In recent years, there has been an increase in the amount of research on FWU in arid areas [11,12,13,14], but there are few studies on FWU strategies.
The differences in the physiological and structural characteristics of plants lead to different FWU strategies [5,15,16]. For example, the differences in leaf anatomical structure, water status, stomatal conductance, and oxidative metabolites between species significantly impacted FWU strategies [5,6,7]. Due to the diversity of species and habitats, numerous factors lead to different FWU strategies for plants. Some plants will promote FWU by evolving unique FWU structures, such as cork warts and trichomes [17,18], and maintain leaf water balance. Therefore, it is necessary to further study the influencing factors of FWU strategies and explore the water utilization strategies of plant leaves, especially in arid areas.
Leaf wettability is a common phenomenon in various habitats, showing the adhesive capacity of leaves to water [19,20]. Water adherence to the plant surface is a prerequisite for FWU to occur [14,21]. Fernández et al. found that leaf morphology and structure have an impact on FWU based on the leaf’s hydrophilicity or hydrophobicity (wettability) [22]. Plants with high leaf wettability have higher FWU storage [23]. In arid areas, in order to adapt to harsh habitats and prevent water loss, plants generally form thicker cuticles on their leaves. The cuticle is the main factor affecting the wettability of the leaves, and the cuticle is hydrophobic [24,25,26,27]. Whether the wettability difference caused by the cuticle will affect FWU storage and whether it is related to k besides FWU storage remain to be elucidated [28]. Furthermore, Goldsmith and others [29] found that leaf wettability will also have a certain adaptability to changes in the environment. Under different water gradients (from tropical rainforests to cloudy mountain forests), leaf wettability will change accordingly. Areas with low precipitation and low temperature have stronger leaf hydrophobicity. Therefore, will leaf wettability change with changes in the environment? Will the difference in hydrophobicity and hydrophilicity generated by this adaptation of the environment affect the FWU strategies?
The stomata is the most important structure for water and gas exchange between leaves and the atmosphere [30], and it is the prediction index of plant response to drought. Facing the potential risk of hydraulic imbalance caused by drought, plants have evolved different stomatal regulation strategies, namely, isohydric regulation and anisohydric regulation. When the atmospheric water vapor pressure deficit (VPD) increases or the soil water content decreases, isohydric plants maintain the minimum leaf water potential relatively constant through strict stomatal regulation [31]. On the contrary, the stomata of anisohydric plants always maintains a certain opening [32,33]. Previous studies on mangrove and temperate species found that plants with anisohydric regulation had higher FWU storage, while plants with isohydric regulation had lower FWU storage [34,35]. However, at present, there is little research on FWU strategies through iso-/anisohydric regulation, especially for plants in arid areas, which needs to be discussed.
The Ebinur Lake Basin has a typical temperate continental arid climate. Due to the scarcity and uneven distribution of precipitation, water resources are incredibly scarce [36,37]. P. euphratica, N. sibirica, H. halodendron, A. sparsifolia, A. hendersonii, and G. uralensis are typical psammophytes in the Ebinur Lake Basin. They can not only improve the ecological environment in desert areas, but also weaken the ground evaporation and reduce the degree of soil drought to some extent. At the same time, the growth of psammophytes can reduce the amount of floating sand on the ground, which can create more suitable living space for other plant species and create more opportunities for the better growth and development of psammophytes [38]. Therefore, this study includes six typical desert plants in the Ebinur Lake Basin, namely, P. euphratica, N. sibirica, H. halodendron, A. sparsifolia, A. hendersonii, and G. uralensis, which were used as research objects to explore the following questions: (1) Do these six desert plants show the FWU phenomenon, and what FWU strategies do they adopt? (2) Do leaf wettability and iso/anisohydric regulation affect the FWU strategies of plants in arid areas? The purpose of this study was to explore FWU strategies from the perspective of leaf wettability and stomatal regulation, so as to enrich the understanding of the water use strategies of desert plants and provide a theoretical basis for the effective restoration and protection of degraded vegetation in desert areas.

2. Materials and Methods

2.1. Research Sites

The Ebinur Wetland Nature Reserve, which is situated in the Xinjiang Uygur Autonomous Region of northwest China (44°43′–45°12′ N, 82°35′–83°40′ E), is the lowest depression and the center of saltwater collection in the Ebinur Wetland western boundary of the Gurbantonggut Desert (Figure 1a). The reserve belongs to a typical temperate continental arid climate. The average yearly temperature ranges from 6.6 to 7.8 °C, and the annual evaporation exceeds 1600 mm [39]. The average annual precipitation is 90.8 mm [40], and the distribution is uneven throughout the year, with summer precipitation accounting for 34.0% to 66.6% of the annual precipitation. The spatial distribution of the soil in this area shows the law of meridional zonality and vertical zonality. The soil types are mainly clay, silt, and sand [41]. The main plant species in the study area are P. euphratica, H. ammodendron, H. halodendron, A. sparsifolia, R. soongarica, N. sibirica, A. hendersonii, G. uralensis, S. terrae-albae, P. australis, etc.

2.2. Field Experiments

2.2.1. Sample Plot Design

In July 2022, a 100 m × 2000 m sample strip was set up from south to north near Dongqiao Station in the reserve, along the direction perpendicular to the Aqikesu River. A 100 m × 100 m quadrat was set every 1000 m on the sample strip, with a total of 3 quadrats, which were set as high water (T1), medium water (T2), and low water (T3) (Figure 1b,c).
Soil from the 0–20 cm, 20–40 cm, and 40–60 cm soil layers was collected at three randomly selected locations within each sample square, packed into aluminum boxes, and brought back to the laboratory to determine the soil water content for water gradient division for backup. The soil water content was measured using the drying method by first measuring the fresh weight (SFW) and then drying at 105 °C for 48 h to a constant weight using an electric blast oven (DHG-9055A, CHN), and then the dry weight (SDW) of the soil samples was recorded to calculate the soil water content (SWC) using the following formula:
SWC   ( % ) = SFW SDW SDW   ×   100 %

2.2.2. Plant Selection and Sample Collection with Determination

Plant selection: the plants selected were P. euphratica, N. sibirica, H. halodendron, A. sparsifolia, A. hendersonii, and G. uralensis (Figure 1d). The field investigation found that H. halodendron was only distributed in T1, and G. uralensis was only distributed in T1 and T2. Therefore, the plants selected in T1 were P. euphratica, N. sibirica, H. halodendron, A. sparsifolia, A. hendersonii, and G. uralensis, with a total of 6 species. The plants selected in T2 were P. euphratica, N. sibirica, A. sparsifolia, A. hendersonii, and G. uralensis, with a total of 5 species. The plants selected in T3 were P. euphratica, N. sibirica, A. sparsifolia, and A. hendersonii, with a total of 4 species. Four plants were randomly selected from each species in each quadrat, and their crown width and diameter at breast height/base diameter were recorded (Table S1).
Determination of morphological indicators: A total of 4 plants were randomly selected within the sample plot, and 3 leaves were randomly selected from each plant in different directions, with a total of 12 leaves. The fresh weight was recorded using a one-ten-thousandth precision balance (AL204, METTLER TOLEDO, CHN). The leaf thickness (LT) was recorded using an electronic vernier caliper with an accuracy of 0.01 mm and photographed and uploaded to IMAGE J software to calculate the leaf area. Then, the leaves were brought back to the laboratory for drying, and the dry weight was recorded. Finally, the specific leaf area (SLA) and leaf dry matter content (LDMC) were calculated using the above measurements.

2.3. Laboratory Experiments

2.3.1. Leaf Wettability

To characterize leaf wettability, the contact angle of a droplet of water was measured on the surface of a leaf. A total of 4 healthy plants were selected as replicates for each species in the sample plot, and 12 healthy and intact leaves were collected. The leaves were placed horizontally on the sampling table using double-sided adhesive tape, and then water droplets were titrated on the leaf surface with a micropipette (range 5~100 μL). Finally, the droplet side view was taken with a macro camera (Nikon Corp, Tokyo, Japan). Two equal water droplets per leaf were used as a parallel experiment of this treatment [29].
The contact angle (also referred to as θ) was measured as the angle between the horizontal line of contact of the water droplet on the leaf surface and the line tangent at the edge of the water droplet (Figure 2). A larger contact angle indicates higher leaf water repellency [29,42,43,44]. Before determining the contact angle, the water droplet was outlined as an ellipse to aid in a more accurate identification of the tangent. Analysis was conducted in IMAGE J v.1.47 (NIH, Bethesda, MD, USA).

2.3.2. Determination of FWU Parameters

According to the method proposed by Liang et al. [45], the randomly selected leaves were cut from the plants, weighed immediately, and recorded as the initial weight (CW). They were then soaked in distilled water with the leaves covered with filter paper to prevent them from floating above the water surface. During absorption, the leaves were weighed every 15 min in the first 2 h, and then every 30 min in the next two hours. Finally, the leaves were immersed in water for 1 h again and weighed to obtain the saturated weight (SW) (a total of 13 measurements). The leaf area (LA) was measured before the experiment. After the experiment, the leaves were dried at 108 °C for 48 h, and the dry weight (DW) was recorded. The main FWU parameters were as follows:
Foliar water uptake accumulation per unit area (FWUcapacity; mg cm−2):
FWU capacity = SW   -   CW LA
The increase in leaf water content (ΔLWC; %):
LWC = SW   -   DW SW   ×   100   -   CW   -   DW CW   ×   100
Foliar water uptake accumulation (ΔM; mg·mg−1):
Δ M = SW   -   CW CW
Foliar water uptake rate (k; mg·cm−2·min−1):
k = FWU capacity t
where SW is the leaf saturation weight, CW is the fresh weight, LA is the leaf area, DW is the dry weight, and t is time.

2.3.3. Determination of Pressure–Volume Curves

The pressure–volume (P–V) curves were determined using the method proposed by Tyree et al. [46]. Due to the small leaves and short petioles of N. sibirica, H. halodendron, A. sparsifolia, A. hendersonii, and G. uralensis, a pressure chamber (PMS model 1505 D, Albany, OR, USA) could not be used to determine the water potential. Therefore, the above plants’ P–V curves measured about 10 cm of leafy twigs; only P. euphratica was directly measured using the leaves. The P–V curves were plotted following the procedures described by Sack and Pasquet-Kok [47]. The leaves were weighed and rehydrated in distilled water for 12 h at 4 °C and then gradually dried in a well-ventilated room at 25 °C. During the drying process, the leaves were weighed, and the water potential was measured using a pressure chamber (PMS model 1505 D, Albany, OR, USA) until a complete P–V curve with at least ten points was established. No ‘plateau effect’ was observed for any sample. Leaf dry mass was determined after at least 72 h at 70 °C. The full turgor and turgor loss points (Ψtlp) were established by considering the highest R2 of a linear fit for the linear portion of the -1/Ψ vs. 1-RWC relationship (RWC: relative water content). The following parameters were obtained from the P–V curves: osmotic potential at turgor loss point (πo); capacitance at turgor loss point (Ctlp); capacitance at full turgor (Cft); bulk modulus of elasticity (ε, calculated from the total relative water content); and osmotic adjustment ability (πotlp)

2.4. Statistical Analyses

ANOVA was performed to compare the variability of the three water gradients, and the results are shown in Table 1. Two-way ANOVA and one-way ANOVA explored the differences in the leaf wettability, FWU parameters, leaf structure, and hydraulic parameters of the plants to be tested across the water gradients as well as between species, using LSD for comparison when the variances were equal and Games–Howell for comparison when the variances were not equal. Secondly, logistic and exponential equations were used to fit the model of FWU with time, and the confidence level was 0.95. Multiple factor analysis (MFA) was used to reveal the multiple relationships among the following groups: (1) species and water gradient (high water, medium water, low water); (2) hydraulic parameters (Ψtlp, π0, ɛ, πotlp); (3) FWU parameters (ΔM, ΔLWC, FWUcapacity, k45); (4) leaf structure (LDMC, LT); (5) leaf wettability (CA). Two-way ANOVA was performed in SPSS 19.0 (IBM SPSS Inc., Chicago, IL, USA). Logistic and exponential model fitting and graphical production were completed in Origin 2023 (OriginLab, Northampton, MA, USA). MFA and RV coefficient calculations were completed using R ‘FactoMineR’ and ‘coffRV’ packages (R version 4.2.2 ucrt, http://cran.rproject.org accessed on 31 October 2022). The significance level was uniformly set to 0.05.

3. Results

3.1. Leaf Wettability

Among the six desert plants, the leaf contact angle (CA) of G. uralensis was significantly lower than that of the other plants (p < 0.05), and its hydrophilic ability was the strongest. N. sibirica came in second, and its CA was less than 90°, which is hydrophilic. The CAs of P. euphratica, H. halodendron, A. sparsifolia, and A. hendersonii were all above 90°, and the surfaces of the leaves were hydrophobic. While under different water gradients, there was no significant difference in CA among species (p > 0.05) (Table 2).

3.2. FWU Characteristics of Six Plants

3.2.1. Patterns of FWU Characteristics over Time

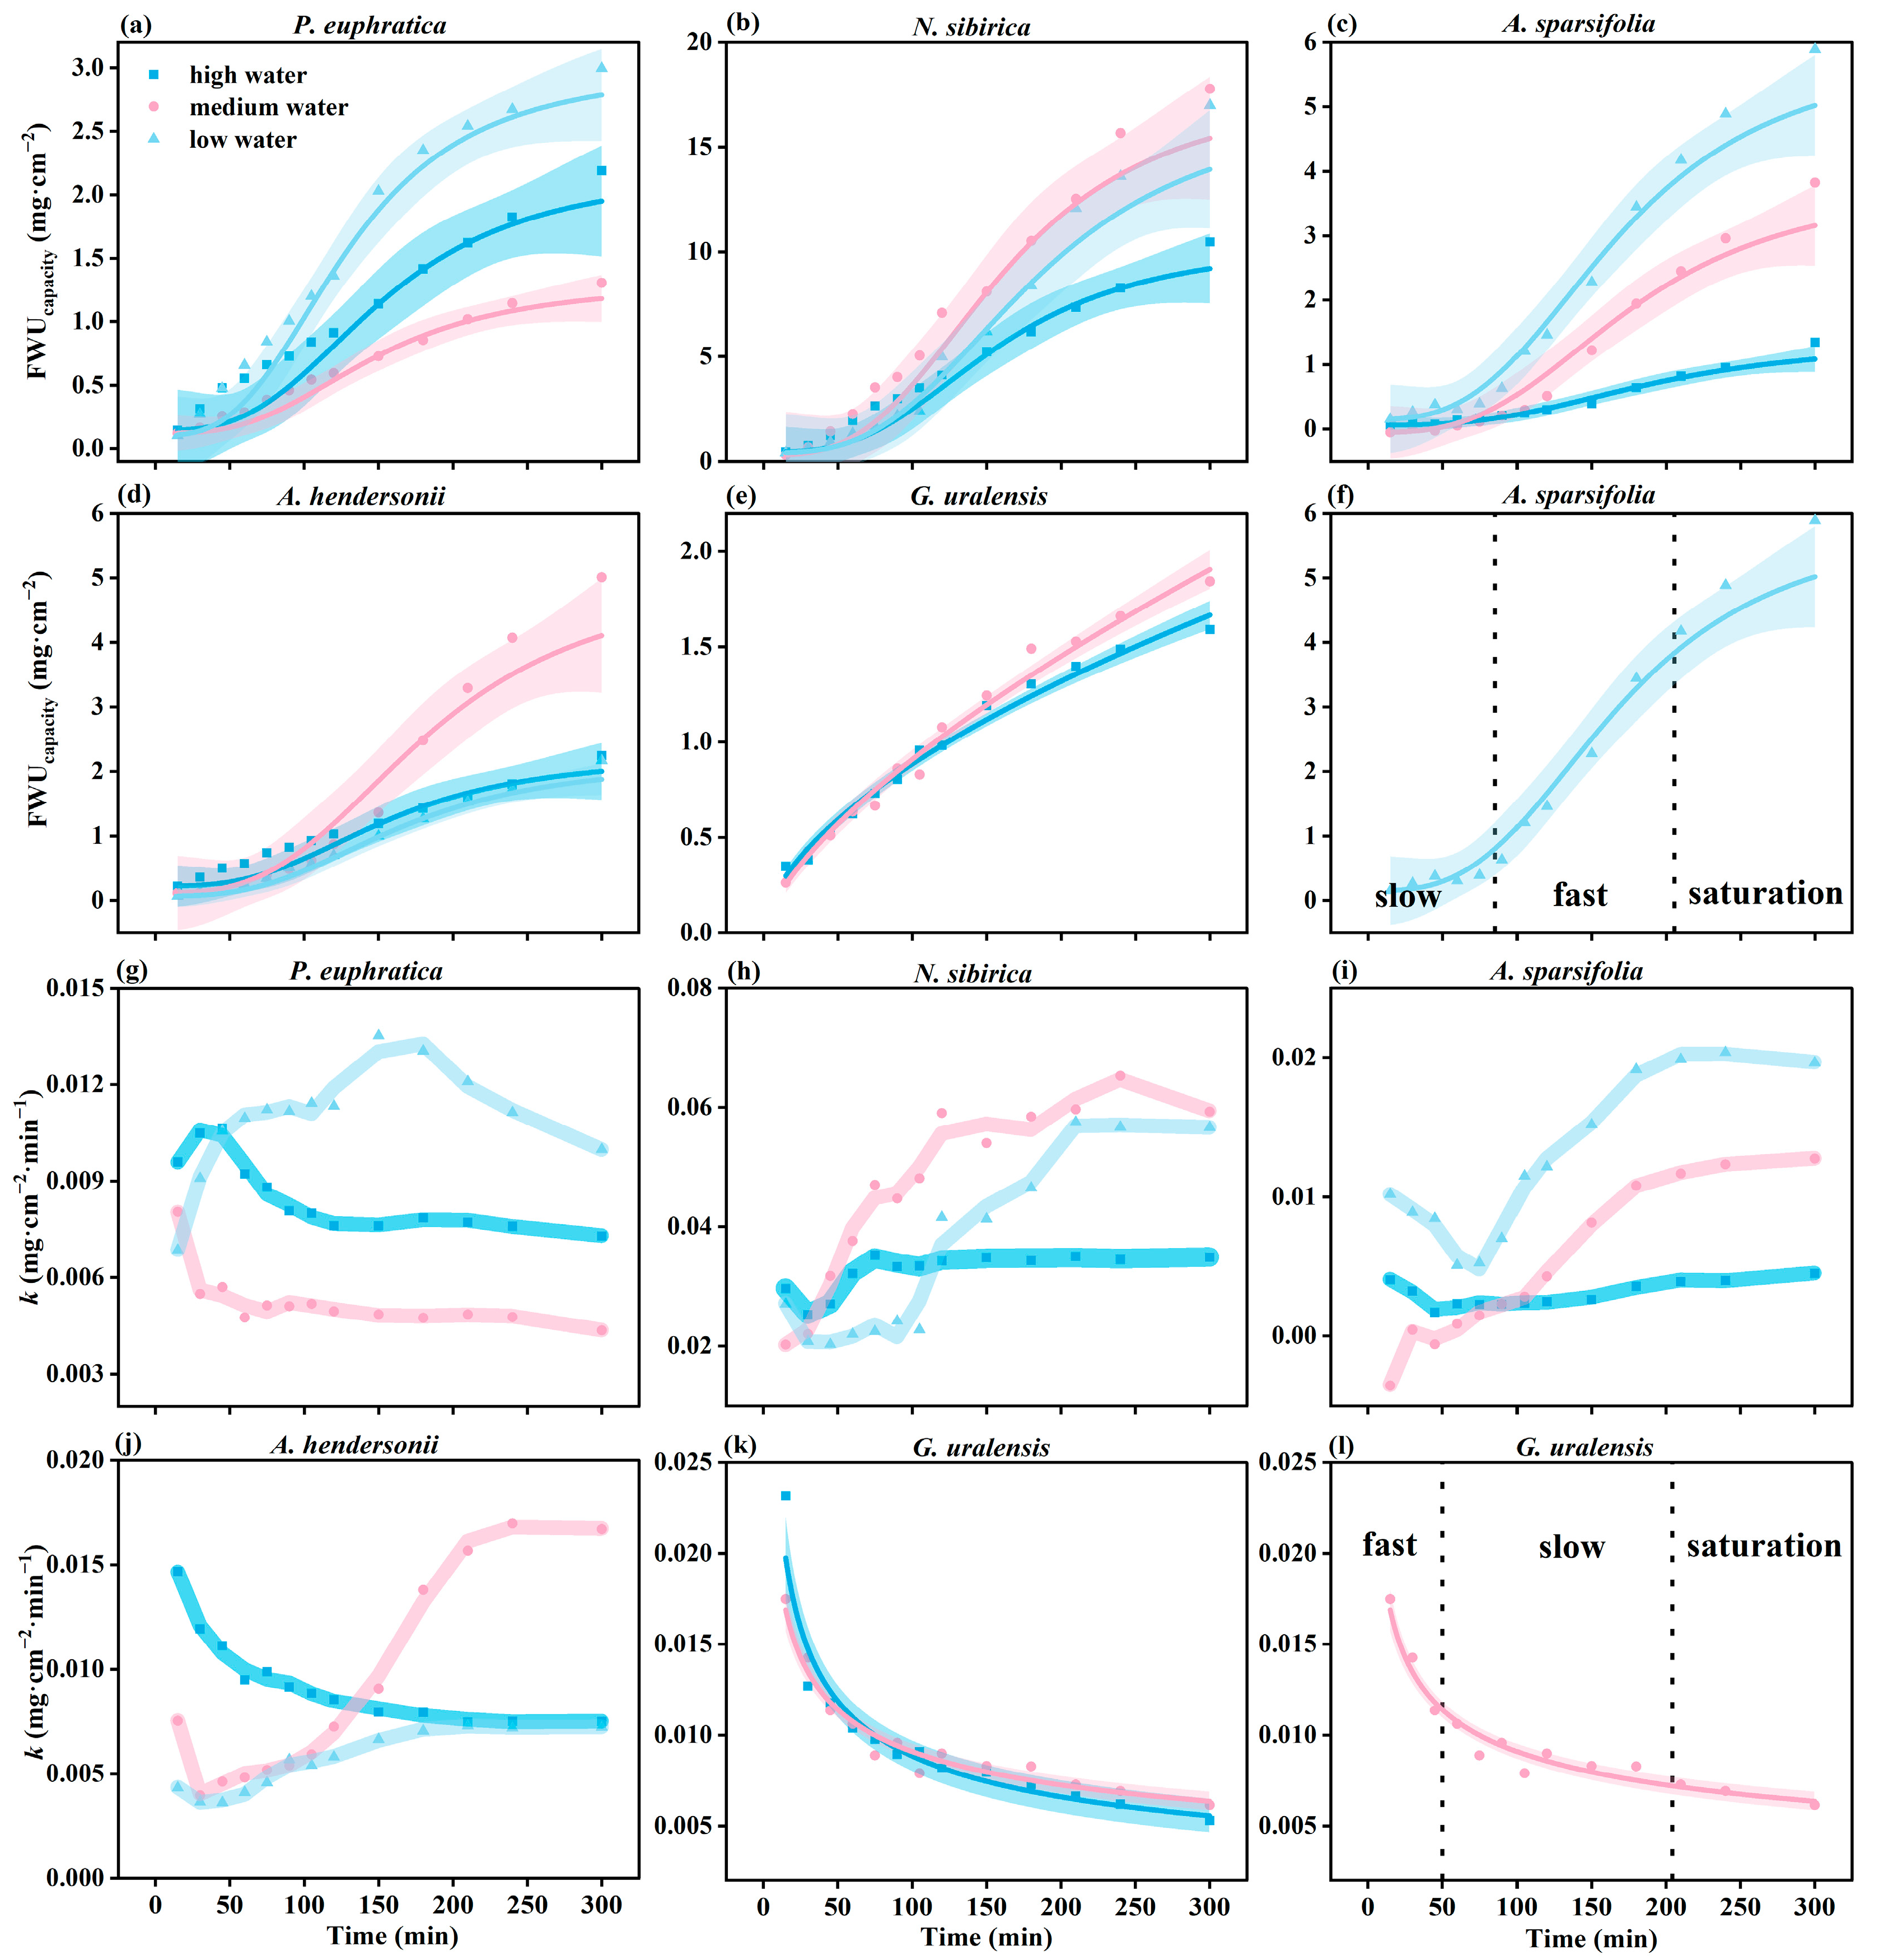
The six plants’ foliar water uptake accumulation per unit area (FWUcapacity) showed differences. Among them, the FWUcapacity of N. sibirica was significantly higher than that of the other species (p < 0.05), followed by H. halodendron, and the lowest was found for G. uralensis, A. hendersonii, P. euphratica, and A. sparsifolia (Figure 3a–c).
The foliar water uptake rate (k) was also different among species. The k of G. uralensis decreased gradually with time. The k of N. sibirica, A. sparsifolia, and A. hendersonii increased initially and tended to be stable with time. The k of P. euphratica and H. halodendron increased first and then decreased with time (Figure 3d,e).
The initial k of G. uralensis was significantly higher than that of the other species (p < 0.05), followed by N. sibirica and H. halodendron. The lowest rates were found for P. euphratica, A. sparsifolia, and A. hendersonii. When the water was absorbed for 300 min, the k of N. sibirica was the highest, followed by that of H. halodendron (Figure 3d,e).

3.2.2. Patterns of FWU Characteristics under Water Gradients with Time

The FWUcapacity of the six plants was different under different water gradients. The FWUcapacity of N. sibirica and A. sparsifolia under low water was higher than that under high water. However, the FWUcapacity of P. euphratica and A. hendersonii had no apparent regularity with the increase in the drought degree (Figure 4a–f).
Under different water gradients, with the increase in the drought degree, the k of N. sibirica, G. uralensis, and A. sparsifolia showed an increasing trend. There was no apparent regularity between the k of P. euphratica and A. hendersonii (Figure 3g–i).
The FWUcapacity of the six plants showed two trends with time. One is exponential growth with time (G. uralensis), which is divided into a fast water absorption period, a slow water absorption period, and a saturation period (Figure 3l). The other is the logistic curve growth mode (P. euphratica, H. halodendron, A. sparsifolia, N. sibirica, and A. hendersonii), divided into a slow water absorption period, fast water absorption period, and saturation period, taking A. sparsifolia as an example (Figure 4f).

3.2.3. FWU Characteristics under Different Water Gradients and Interspecific Differences

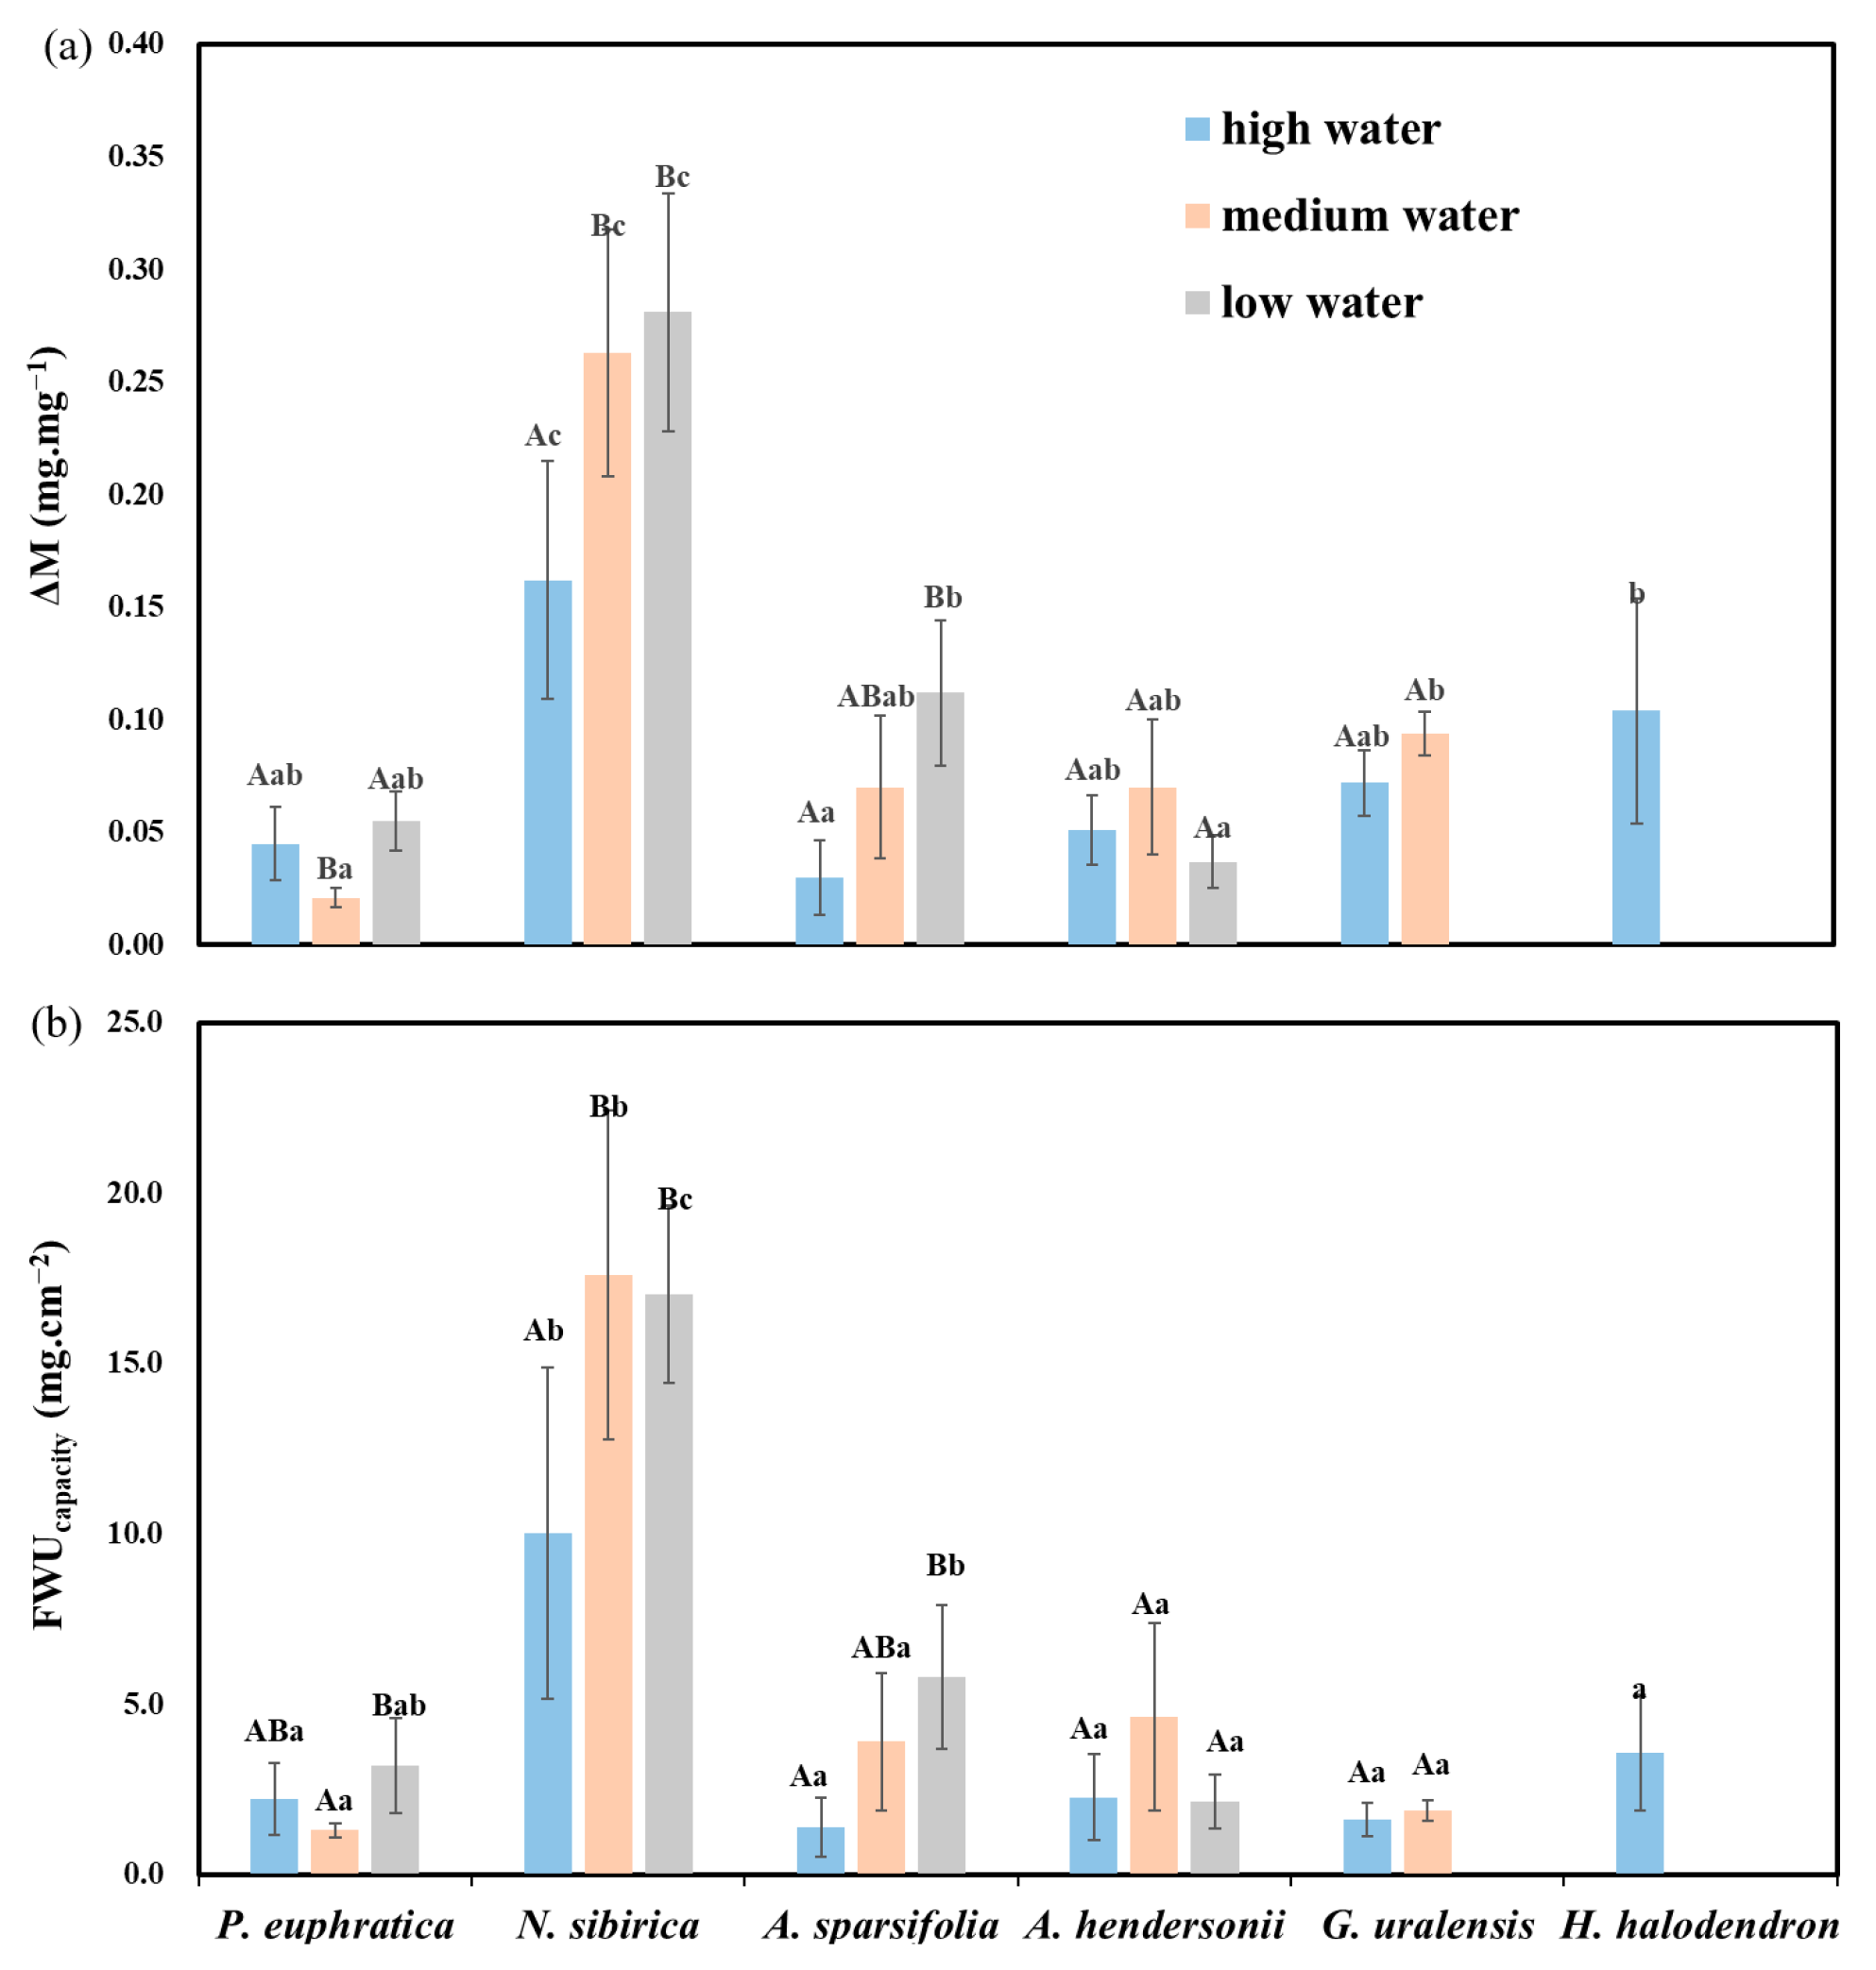
The water gradients and interspecific differences had significant effects on the FWU parameters (ΔM, FWUcapacity) (p < 0.05; Table S3).
Under high water, the FWU parameters of N. sibirica were significantly higher than those of the other plants (p < 0.05), followed by H. halodendron. Under medium water, N. sibirica had significantly higher parameters than the other plants (p < 0.05), followed by G. uralensis and P. euphratica. Under low water, N. sibirica had significantly higher parameters than the other plants (p < 0.05), while A. hendersonii had the lowest (Figure 5a).
Regarding the different water gradients, the FWU parameters of N. sibirica and A. sparsifolia under low water were significantly higher than those under high water (p < 0.05), and there was no clear rule among the other species (Figure 5).

3.3. Leaf Structural Characteristics

Among the six plants, N. sibirica had the thickest leaves, which were significantly thicker than the leaves of the other plants (p < 0.05), and the leaf dry matter content (LDMC) was significantly lower than that of the other plants (p < 0.05). G. uralensis had the thinnest leaves and the highest LDMC, while there was no significant difference between the LT and LDMC of P. euphratica, A. hendersonii, and A. sparsifolia (Table 3).

3.4. Hydraulic Parameters of Six Plants

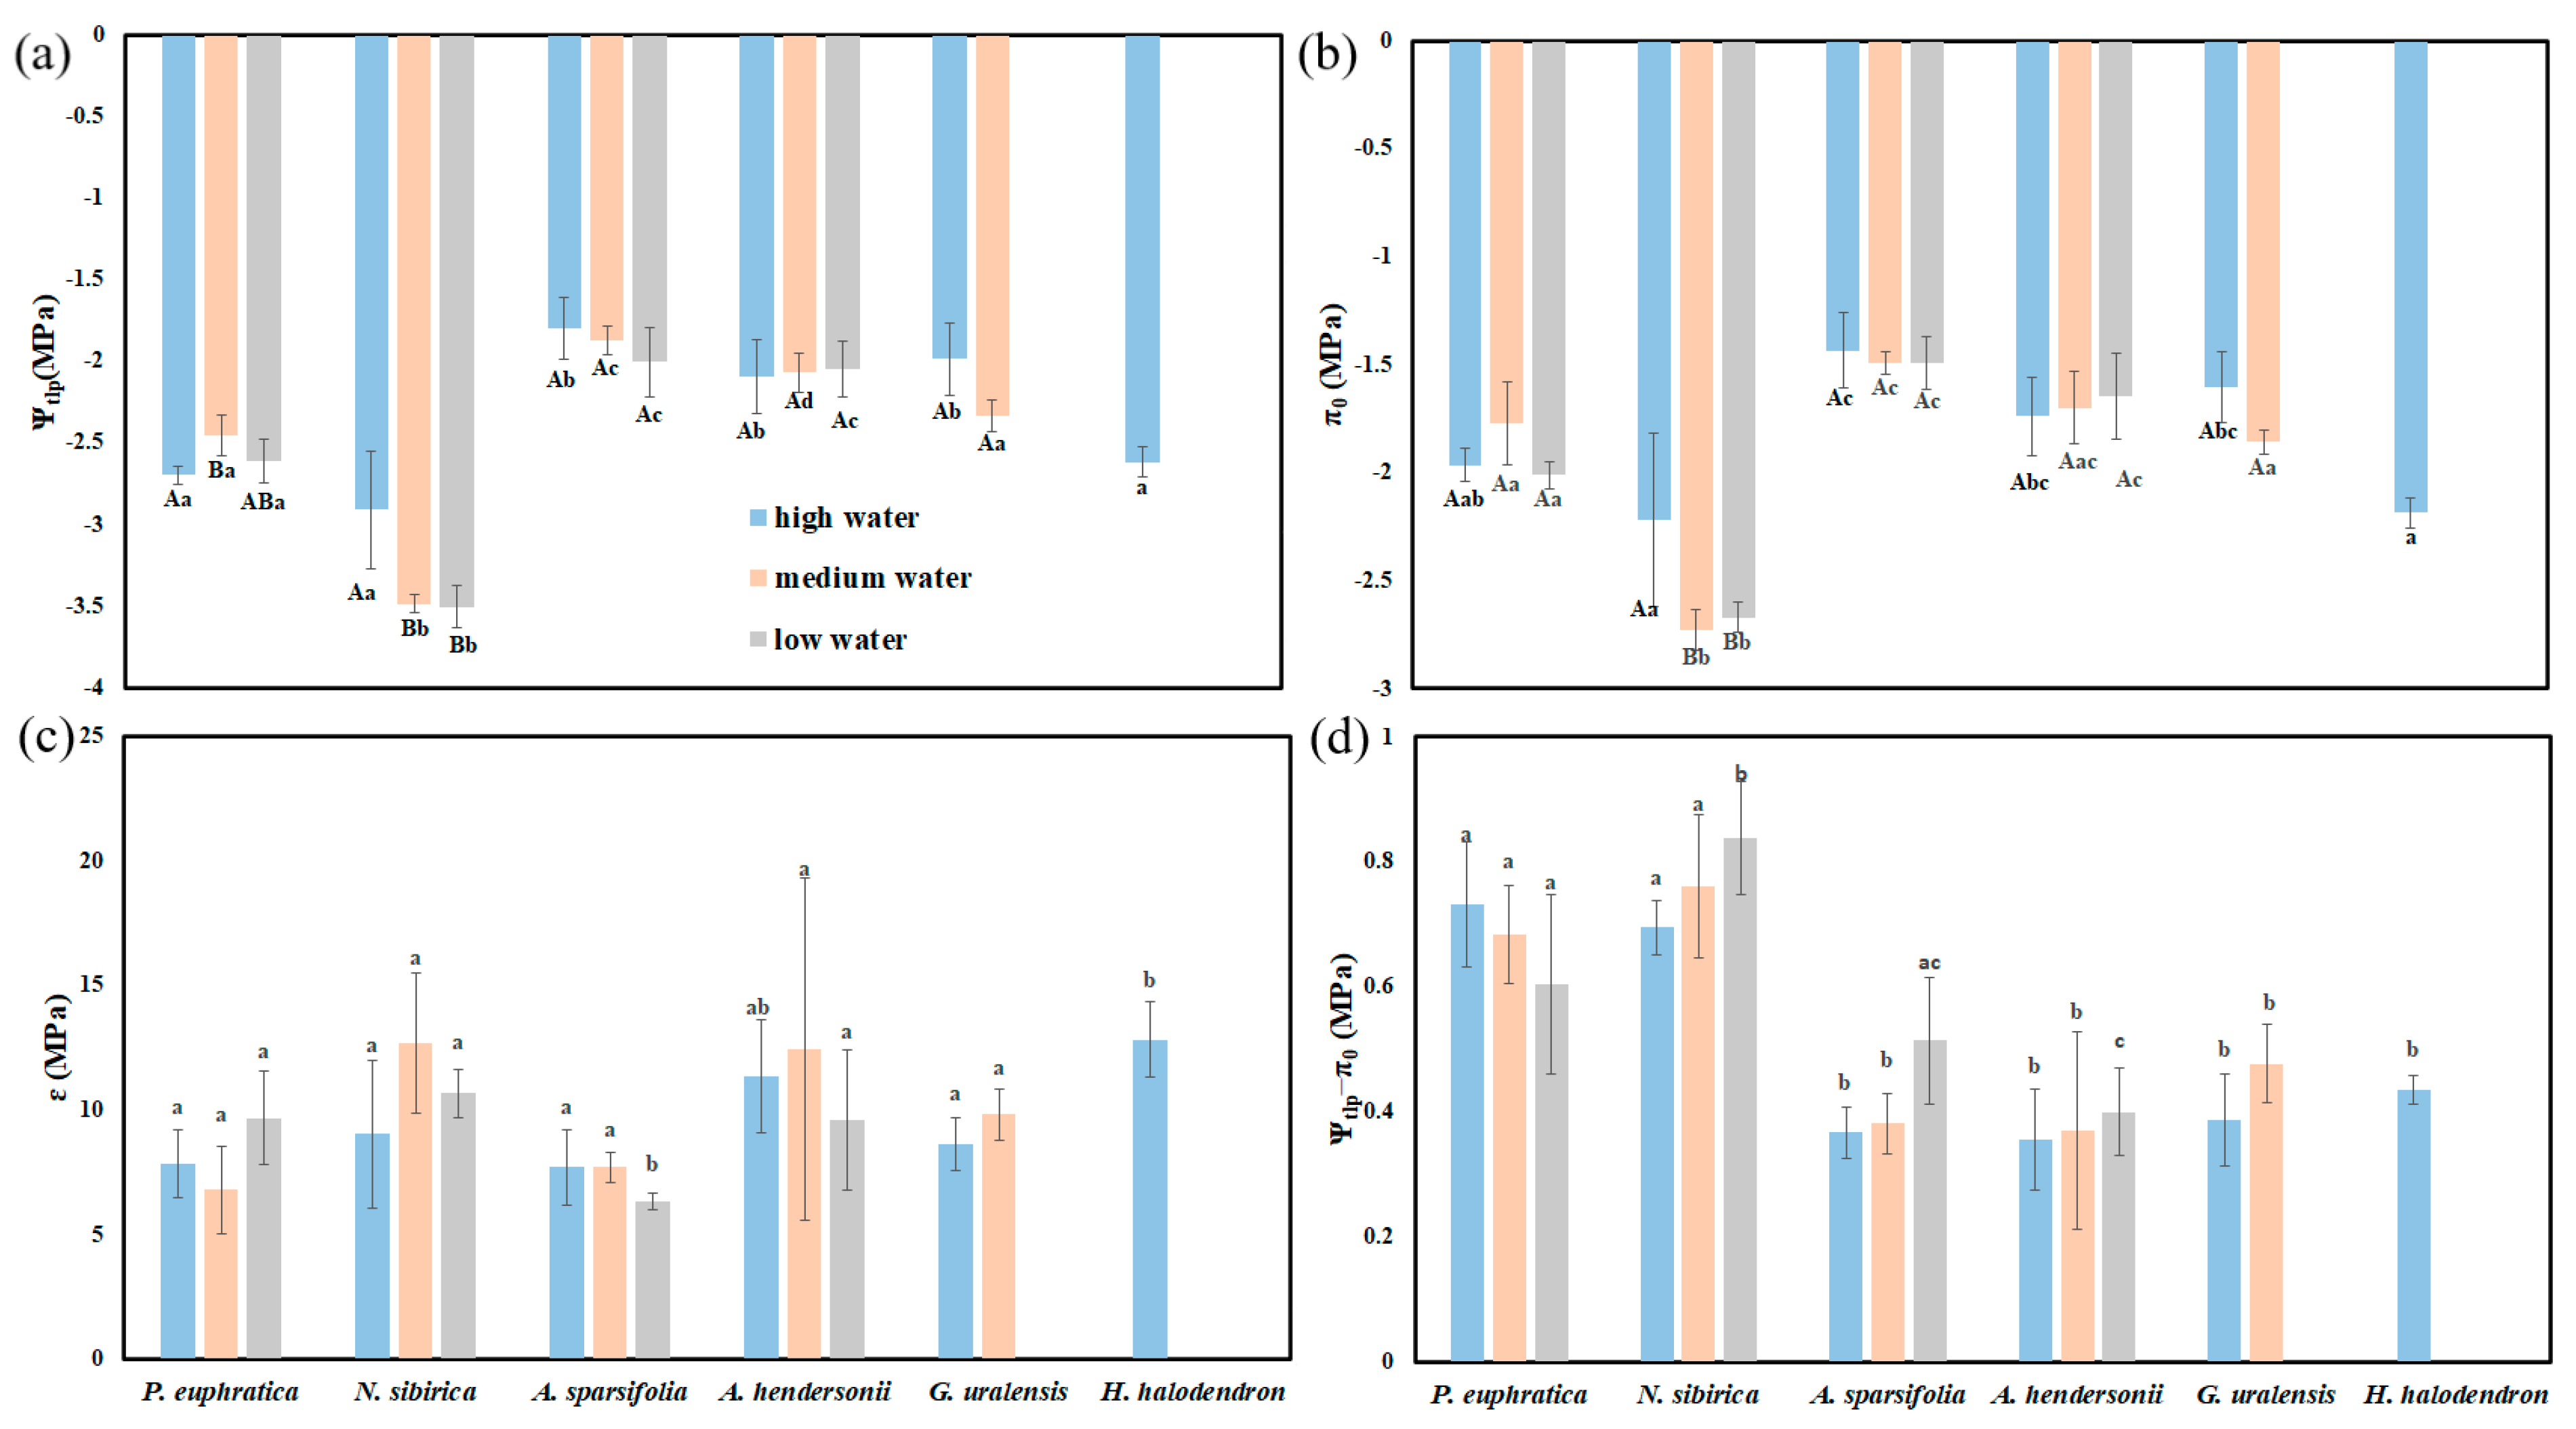
The results of the two-way ANOVA showed that the water gradients and interspecific differences had significant effects on the turgor loss point (Ψtlp) (p < 0.05). The elastic modulus (ε) and osmotic adjustment ability (Ψtlp0) were significantly different among species (p < 0.05). The saturated osmotic potential (π0) was significantly different between species and under the interaction of species and water gradients (p < 0.05) (Table S3).
Ψtlp and π0 showed differences among species. Under high water, the Ψtlp and π0 of P. euphratica, N. sibirica, and H. halodendron were significantly higher than those of G. uralensis, A. hendersonii, and A. sparsifolia (p < 0.05). Under medium water, the Ψtlp and π0 of N. sibirica were the highest, while those for A. hendersonii and A. sparsifolia were the lowest. Under low water, the Ψtlp and π0 of N. sibirica were the highest, followed by those of P. euphratica (Figure 6a,b). Ψtlp0 also showed differences among species, and the Ψtlp0 values of P. euphratica and N. sibirica were significantly higher than those of the other plants (p < 0.05) (Figure 6d).
With the deepening of drought stress, the Ψtlp and π0 of G. uralensis and A. sparsifolia increased or decreased, but there was no significant difference (p > 0.05). The Ψtlp and π0 of N. sibirica under high water were significantly higher than those under low water (p < 0.05). The Ψtlp and π0 of P. euphratica and A. hendersonii showed no apparent regularity (Figure 6).

3.5. Relationship between FWU, Leaf Structure, and Hydraulic Parameters

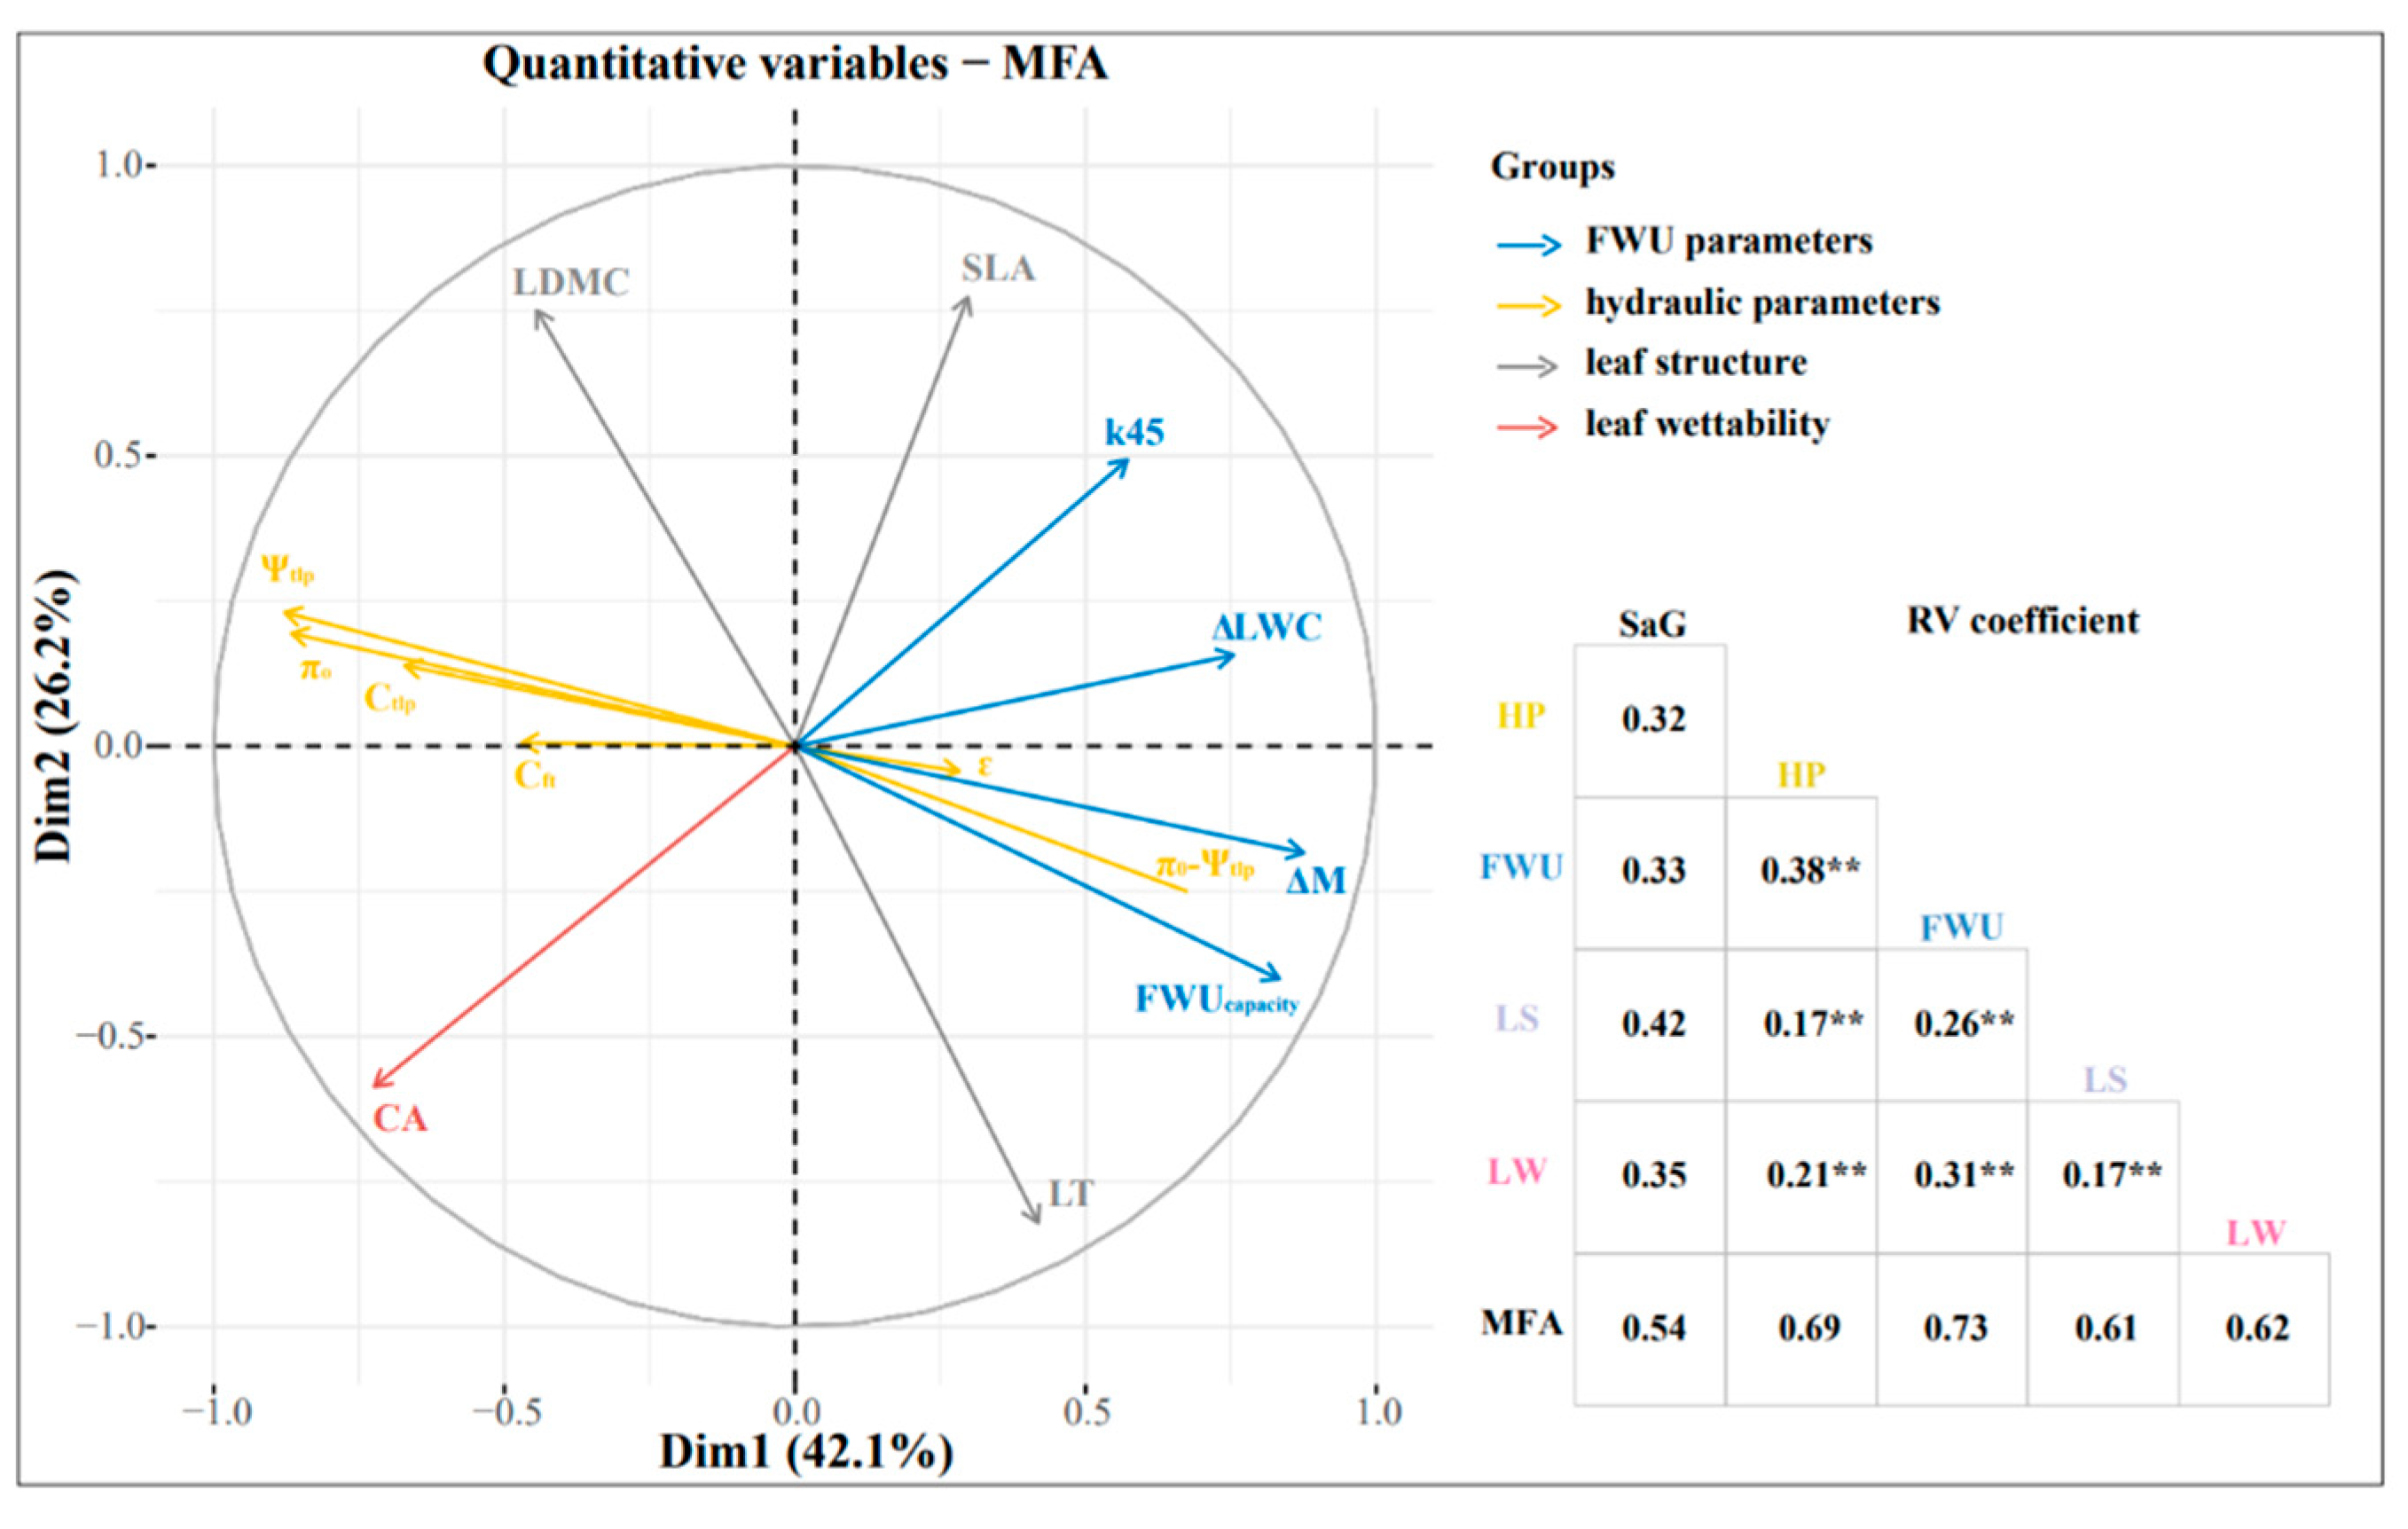
The MFA results (Figure 7) showed that the first and second axes accounted for 42.1% and 26.2% of the total variance, respectively. The hydraulic parameters had the most significant influence on the FWU parameters. The RV coefficients between the FWU parameters and hydraulic parameters, leaf wettability, and leaf structure were 0.38, 0.31, and 0.26, respectively (Figure 7). FWUcapacity was positively correlated with LT and k45 (R2 = 0.66; R2 = 0.3) and negatively correlated with Ψtlp, π0, and CA (R2 = −0.73; R2 = −0.73; R2 = −0.33). The initial water uptake rate (k45) was negatively correlated with CA (R2 = −0.59). The turgor loss point (Ψtlp) was positively correlated with π0 and CA (R2 = 0.96; R2 = 0.48), which was negatively correlated with ΔM, FWUcapacity, and LT (R2 = −0.71; R2 = −0.73; R2 = −0.48) (Figure S1).

4. Discussion

4.1. FWU Strategies of Six Plants

The leaves of all six plants showed water absorption phenomena after the soaking experiments, and different FWU strategies were adopted. G. uralensis showed a high k and low FWU storage. Consistent with the research results of Boanares et al. [5,6,7], there is a negative correlation between the k and FWU storage of plants. N. sibirica and H. halodendron showed a high k as well as high FWU storage. This result strongly proves that a high k and high FWU storage can also coexist in the same plant so that it has higher water use efficiency [5,6,7]. However, P. euphratica, A. hendersonii, and A. sparsifolia showed a low k and low FWU storage, which is different from the previous research results [5,6,7] and may have been caused by the differences in the climate and environment of the study area. The previous study area was mainly located in Brazil’s tropical high-fog habitat. This study area is located in northwest China and belongs to a typical arid ecosystem [37]. Due to the difference in water input, plants living in arid areas have different water acquisition and maintenance mechanisms [48], resulting in different water adaptation strategies.

4.2. Effects of Leaf Wettability and Leaf Structure on FWU Strategies

The change in the foliar water uptake accumulation per unit area (FWUcapacity) of the six plants with time presents two patterns, which may be mainly related to the wettability of the leaves. Among them, the changes in the FWUcapacity of P. euphratica, N. sibirica, H. halodendron, A. sparsifolia, and A. hendersonii showed a logistic curve growth pattern with time (Figure 3, Table S2). The existence of cuticles (hydrophobicity) in the early stage of FWU affects the leaf wettability, resulting in a low k (the first part of the logistic curve). With the extension of the water absorption time, FWU will promote the rehydration of the epidermis and accelerate the k (the second part of the logistic curve). With the increase in FWU, the k of leaves gradually decreases and finally approaches zero, and the leaves no longer absorb water (the third part of the logistic curve; Figure 4f), which is consistent with the research results of Guzmán-Delgado et al. [49]. However, G. uralensis leaves have high wettability (Table 2) [50]. The upper and lower cuticles are thin [51,52], which reduces the resistance of FWU [49,53,54,55] and then produces the maximum initial k (Figure 3), so the water absorption of G. uralensis leaves shows an exponential growth pattern with time (Figure 2 and Figure 3e, Table S2), which can be divided into a fast water absorption period, slow water absorption period, and saturation period. This conclusion is consistent with the research results of Liang [45], Li [24], and Guzmán-Delgado [49].
The difference between leaf wettability and leaf structural characteristics shows that N. sibirica and H. halodendron adopt different adaptation methods to maintain high FWU strategies. N. sibirica leaves are thick (Table 3) and have high wettability (Table 2), which may be one of the reasons why N. sibirica has a high FWU capacity. Consistent with previous research results [17,56,57,58], plants with thicker leaves have higher FWU storage, while plants with hairy leaves or succulent leaves have higher leaf wettability, and their k is significantly higher than that of plants with lower leaf wettability. However, there was specificity between the leaf wettability, structural characteristics, and FWU strategies of H. halodendron leaves. The H. halodendron results showed that the leaves were thin (Table 3) and the leaf epidermis was hydrophobic (Table 2). According to the results of previous studies, the higher the leaf wettability, the higher the k [57,58], and the thicker the leaf, the higher the FWU storage [6,7,8,9], indicating that the FWU strategies of H. halodendron are theoretically a low k and low FWU storage. However, the actual research results are exactly the opposite. It may be that the stomata on the epidermis of the H. halodendron leaves are densely distributed, which leads to the hydrophobicity of the leaves [44]. At the same time, the stomata are also the primary way for the leaves to absorb water [59]. Densely distributed stomata will further promote FWU, thus producing a strong FWU capacity.

4.3. Effects of Stomatal Regulation on FWU Strategies

The turgor loss point (Ψtlp) is the osmotic potential at the initial plasmolysis, reflecting the plants’ limited osmotic potential to maintain the lowest turgor. It is one of the best indicators to measure the drought tolerance of plants. The lower the Ψtlp value, the stronger the ability of plants to maintain turgor and the stronger their tolerance to drought [60,61,62,63]. In arid or semi-arid habitats with severe water shortage, the average value of the Ψtlp is about three times that of tropical rainforest species [64]. Secondly, the Ψtlp is one trait most closely related to the relative isohydric degree of species. The higher the Ψtlp, the more plants tend to be isohydric [64]. Meinzer et al. [65] proposed the use of the Ψtlp as an indicator to measure the degree of isohydric regulation, which has been proven in many plant species [66,67]. Therefore, based on the value of the Ψtlp, this paper judged the stomatal regulation behavior of plants. N. sibirica and H. halodendron are more inclined to adopt anisohydric regulation, while P. euphratica. A. hendersonii, A. sparsifolia, and G. uralensis are more inclined to adopt isohydric regulation.
This study found that the FWU strategies are related not only to leaf wettability and leaf structure but also to stomatal regulation behavior. The FWU capacity decreases with the increase in the Ψtlp of different plants (Figure 7). That is, anisohydric plants with faster water loss rates have a higher FWU capacity, and FWU can be used as a temporary water source to reduce their hydraulic risks. Species with a low FWU capacity will rely more on alternative strategies, such as stomatal regulation behavior that tends to be isohydric, to reduce water loss and maintain leaf turgor under drought stress, which is consistent with the results of Eller et al. [68]. For example, for N. sibirica and H. halodendron, as plants that are more inclined to adopt anisohydric regulation, their stomata are insensitive to environmental changes and always maintain a certain opening. Their leaves have a significantly higher FWU capacity than other plants [69,70,71,72]. P. euphratica is also more inclined to adopt anisohydric regulation, and its FWU capacity is significantly lower than that of N. sibirica and H. halodendron (Figure 5; Table S4). Compared with other works, the FWU capacity of trees in temperate arid areas is significantly lower than that of P. euphratica [66]. Therefore, when comparing trees, P. euphratica has a higher FWU capacity, which accords with the characteristics of plants with anisohydric regulation. However, for A. sparsifolia, A. hendersonii, and G. uralensis, as plants that are more inclined to adopt isobaric regulation, their stomata are sensitive to environmental changes. Due to the influence of plant internal factors, soil moisture status, and atmospheric vapor pressure deficit, plants will adopt a conservative strategy to reduce water loss by closing their stomata, so they have a relatively low FWU capacity [31,34].
With the deepening of drought stress, stomatal regulation behavior will also lead plants to adopt different FWU strategies. With the increase in drought stress, the FWU parameters of N. sibirica leaves increased significantly (Figure 5), and the Ψtlp decreased significantly (Figure 6), which is consistent with the results of Schreel et al. The FWU of anisohydric plants increases with the decrease in soil water potential [69,71], and the Ψtlp changes with the degree of soil drought [72]. However, the FWU parameters and Ψtlp of P. euphratica have no obvious regularity with the deepening of drought stress. The main reason may be that P. euphratica is an arbor, and its root system is very developed and has a high drought tolerance [73]. The water gradient selected in the plot is not sufficient to significantly impact its water physiology. In summary, anisohydric plants can reduce the effects of drought stress at the leaf level by increasing FWU [35].

4.4. Relationship between FWU and Leaf Wettability, Leaf Structure, and Stomatal Behavior

Comprehensive analysis showed that the effect of stomatal regulation on FWU capacity was higher than that of leaf wettability and structure (Figure 7b). For example, for H. halodendron, as a plant that is more biased towards anisohydric regulation, its stomata always maintain a certain degree of openness, and water loss is faster. Because the stomata are also the main route for FWU [58], although the epidermis of H. halodendron leaves is hydrophobic (Table 2) and the leaves are thin (Table 3), its FWU capacity is still significantly higher than that of other isohydric plants (plants that keep water by closing their stomata in stress environments). Therefore, stomatal regulation behavior is the main reason for high k as well as high FWU storage of anisohydric-regulating plants (H. halodendron and N. sibirica).

5. Conclusions

Our study found that the leaves of all six plants had absorbing water phenomena, and their water absorption ability was significantly different due to the influence of leaf wettability, leaf structure, and iso/anisohydric regulation behavior. Affected by the wettability of the leaves, the FWUcapacity shows two changing laws with time: (i) when the wettability of the leaves is high, the FWUcapacity shows an exponential growth pattern with time; (ii) when the leaf wettability is low, the change in FWUcapacity with time shows a logistic curve growth mode. Moreover, the FWU capacity is most affected by iso/anisohydric regulation behavior compared with leaf wettability and structure. This study deepens our understanding of FWU strategies and provides a theoretical basis for understanding the mechanism of plant water use in arid regions.

Supplementary Materials

The following supporting information can be downloaded at: https://www.mdpi.com/article/10.3390/f14030551/s1. Figure S1: Pearson correlation analysis (heat map) between FWU parameters and leaf structural, leaf wettability, hydraulic parameters; Table S1: plant basic information table; Table S2: fitting model of FWUcapacity changing with time; Table S3: two-way ANOVA table; Table S4: analysis of leaf water relationship among species under water gradient.

Author Contributions

Conceptualization, H.W. and J.Y.; methodology, H.W.; software, H.W.; formal analysis, H.W.; investigation, H.W.; data curation, H.W.; writing—original draft preparation, H.W.; writing—review and editing, Z.L.; visualization, H.W.; supervision, J.Y.; project administration, J.Y.; funding acquisition, J.Y. All authors have read and agreed to the published version of the manuscript.

Funding

This research was financially supported by the National Natural Science Foundation of China (42171026), Xinjiang Uygur Autonomous Region innovation environment Construction special project & Science and technology innovation base construction project (PT2107) and Xinjiang Uygur Autonomous Region Graduate Research and Innovation Project (XJ2021G043).

Institutional Review Board Statement

Not applicable.

Informed Consent Statement

Not applicable.

Data Availability Statement

Data will be made available on request.

Conflicts of Interest

The authors declare no conflict of interest.

References

  1. Burkhardt, J. Hygroscopic Particles on Leaves: Nutrients or Desiccants? Ecol. Monogr. 2010, 80, 369–399. [Google Scholar] [CrossRef]
  2. Feng, T.J.; Zhang, Z.Q.; Zhang, L.X.; Xu, W.; He, J.S. Review on the influencing factors and functions of condensated water in arid and semi-arid ecosystems. Acta Ecol. Sin. 2021, 41, 456–468. [Google Scholar]
  3. Chin, A.R.O.; Guzmán-Delgado, P.; Sillett, S.C.; Kerhoulas, L.P.; Ambrose, A.R.; McElrone, A.R.; Zwieniecki, M.A. Tracheid Buckling Buys Time, Foliar Water Uptake Pays It Back: Coordination of Leaf Structure and Function in Tall Redwood Trees. Plant Cell Env. 2022, 45, 2607–2616. [Google Scholar] [CrossRef]
  4. Darby, A.; Draguljić, D.; Glunk, A.; Gotsch, S.G. Habitat Moisture Is an Important Driver of Patterns of Sap Flow and Water Balance in Tropical Montane Cloud Forest Epiphytes. Oecologia 2016, 182, 357–371. [Google Scholar] [CrossRef] [PubMed]
  5. Boanares, D.; Kozovits, A.R.; Lemos-Filho, J.P.; Isaias, R.M.S.; Solar, R.R.R.; Duarte, A.A.; Vilas-Boas, T.; França, M.G.C. Foliar Water-Uptake Strategies Are Related to Leaf Water Status and Gas Exchange in Plants from a Ferruginous Rupestrian Field. Am. J. Bot. 2019, 106, 935–942. [Google Scholar] [CrossRef]
  6. Boanares, D.; Jovelina da-Silva, C.; Mary dos Santos Isaias, R.; Costa França, M.G. Oxidative Metabolism in Plants from Brazilian Rupestrian Fields and Its Relation with Foliar Water Uptake in Dry and Rainy Seasons. Plant Physiol. Biochem. 2020, 146, 457–462. [Google Scholar] [CrossRef] [PubMed]
  7. Boanares, D.; Isaias, R.R.M.S.; de Sousa, H.C.; Kozovits, A.R. Strategies of Leaf Water Uptake Based on Anatomical Traits. Plant Biol. 2018, 20, 848–856. [Google Scholar] [CrossRef]
  8. Lima, J.F.; Boanares, D.; Costa, V.E.; Moreira, A.S.F.P. Do Photosynthetic Metabolism and Habitat Influence Foliar Water Uptake in Orchids? Plant Biol. 2023, 25, 257–267. [Google Scholar] [CrossRef]
  9. Gotsch, S.G.; Nadkarni, N.; Darby, A.; Glunk, A.; Dix, M.; Davidson, K.; Dawson, T.E. Life in the Treetops: Ecophysiological Strategies of Canopy Epiphytes in a Tropical Montane Cloud Forest. Ecol. Monogr. 2015, 85, 393–412. [Google Scholar] [CrossRef] [Green Version]
  10. Pan, Z.L.; Guo, W.; Wang, T.; Li, Y.P.; Yang, S.J. Research progress on foliar water uptake. Plant Physiol. J. China 2021, 57, 19–32. [Google Scholar] [CrossRef]
  11. Dawson, T.E.; Goldsmith, G.R. The Value of Wet Leaves. New Phytol. 2018, 219, 1156–1169. [Google Scholar] [CrossRef] [Green Version]
  12. Li, Z.-K.; Gong, X.-W.; Wang, J.-L.; Chen, Y.-D.; Liu, F.-Y.; Li, H.-P.; Lü, G.-H. Foliar Water Uptake Improves Branch Water Potential and Photosynthetic Capacity in Calligonum mongolicum. Ecol. Indic. 2023, 146, 109825. [Google Scholar] [CrossRef]
  13. Schreel, J.D.M.; Steppe, K. Foliar Water Uptake Changes the World of Tree Hydraulics. NPJ Clim. Atmos. Sci. 2019, 2, 1–2. [Google Scholar] [CrossRef] [Green Version]
  14. Fan, X.; Hao, X.; Zhang, S.; Zhao, Z.; Zhang, J.; Li, Y. Populus Euphratica Counteracts Drought Stress through the Dew Coupling and Root Hydraulic Redistribution Processes. Ann. Bot. 2023, mcac159. [Google Scholar] [CrossRef] [PubMed]
  15. Akram, M.A.; Zhang, Y.; Wang, X.; Shrestha, N.; Malik, K.; Khan, I.; Ma, W.; Sun, Y.; Li, F.; Ran, J.; et al. Phylogenetic Independence in the Variations in Leaf Functional Traits among Different Plant Life Forms in an Arid Environment. J. Plant Physiol. 2022, 272, 153671. [Google Scholar] [CrossRef] [PubMed]
  16. Dos Santos Garcia, J.; Boanares, D.; França, M.G.C.; Sershen; López-Portillo, J. Foliar Water Uptake in Eight Mangrove Species: Implications of Morpho-Anatomical Traits. Flora 2022, 293, 152100. [Google Scholar] [CrossRef]
  17. Bryant, C.; Fuenzalida, T.I.; Zavafer, A.; Nguyen, H.T.; Brothers, N.; Harris, R.J.; Beckett, H.A.A.; Holmlund, H.I.; Binks, O.; Ball, M.C. Foliar Water Uptake via Cork Warts in Mangroves of the Sonneratia Genus. Plant Cell Environ. 2021, 44, 2925–2937. [Google Scholar] [CrossRef]
  18. Martin, C.E.; von Willert, D.J. Leaf Epidermal Hydathodes and the Ecophysiological Consequences of Foliar Water Uptake in Species of Crassula from the Namib Desert in Southern Africa. Plant Biol. 2000, 2, 229–242. [Google Scholar] [CrossRef]
  19. Neinhuis, C.; Barthlott, W. Seasonal Changes of Leaf Surface Contamination in Beech, Oak, and Ginkgo in Relation to Leaf Micromorphology and Wettability. New Phytol. 1998, 138, 91–98. [Google Scholar] [CrossRef]
  20. Wagner, P.; Furstner, R.; Barthlott, W.; Neinhuis, C. Quantitative Assessment to the Structural Basis of Water Repellency in Natural and Technical Surfaces. J. Exp. Bot. 2003, 54, 1295–1303. [Google Scholar] [CrossRef] [Green Version]
  21. Fernandez, V.; Brown, P.H. From Plant Surface to Plant Metabolism: The Uncertain Fate of Foliar-Applied Nutrients. Front. Plant Sci. 2013, 4, 289. [Google Scholar] [CrossRef] [PubMed] [Green Version]
  22. Fernández, V.; Sancho-Knapik, D.; Guzmán, P.; Peguero-Pina, J.J.; Gil, L.; Karabourniotis, G.; Khayet, M.; Fasseas, C.; Heredia-Guerrero, J.A.; Heredia, A.; et al. Wettability, Polarity, and Water Absorption of Holm Oak Leaves: Effect of Leaf Side and Age. Plant Physiol. 2014, 166, 168–180. [Google Scholar] [CrossRef] [PubMed] [Green Version]
  23. Pan, Z.L.; Guo, W.; Zhang, Y.J.; Schreel, J.D.M.; Gao, J.Y.; Li, Y.P.; Yang, S.J. Leaf Trichomes of Dendrobium Species (Epiphytic Orchids) in Relation to Foliar Water Uptake, Leaf Surface Wettability, and Water Balance. Environ. Exp. Bot. 2021, 190, 104568. [Google Scholar] [CrossRef]
  24. Li, J.J.; Bai, G.S.; Zhang, R. Water absorption of common trees leaves in loess hilly and gully region of Northern Shaanxi. Chin. Soil Water Conserv. Sci. 2013, 11, 99–102. [Google Scholar] [CrossRef]
  25. Guzmán-Delgado, P.; Laca, E.; Zwieniecki, M.A. Unravelling Foliar Water Uptake Pathways: The Contribution of Stomata and the Cuticle. Plant Cell Environ. 2021, 44, 1728–1740. [Google Scholar] [CrossRef]
  26. Koch, K.; Hartmann, K.D.; Schreiber, L.; Barthlott, W.; Neinhuis, C. Influences of Air Humidity during the Cultivation of Plants on Wax Chemical Composition, Morphology and Leaf Surface Wettability. Environ. Exp. Bot. 2006, 56, 1–9. [Google Scholar] [CrossRef]
  27. Chin, A.R.O.; Guzmán-Delgado, P.; Kerhoulas, L.P.; Zwieniecki, M.A. Acclimation of Interacting Leaf Surface Traits Affects Foliar Water Uptake. Tree Physiol. 2022, tpac120. [Google Scholar] [CrossRef]
  28. Roth-Nebelsick, A.; Hacke, U.G.; Voigt, D.; Schreiber, S.G.; Krause, M. Foliar Water Uptake in Pinus Species Depends on Needle Age and Stomatal Wax Structures. Ann. Bot. 2022, mcac141. [Google Scholar] [CrossRef]
  29. Goldsmith, G.R.; Bentley, L.P.; Shenkin, A.; Salinas, N.; Blonder, B.; Martin, R.E.; Castro-Ccossco, R.; Chambi-Porroa, P.; Diaz, S.; Enquist, B.J.; et al. Variation in Leaf Wettability Traits along a Tropical Montane Elevation Gradient. New Phytol. 2017, 214, 989–1001. [Google Scholar] [CrossRef]
  30. Burkhardt, J.; Basi, S.; Pariyar, S.; Hunsche, M. Stomatal Penetration by Aqueous Solutions–an Update Involving Leaf Surface Particles. New Phytol. 2012, 196, 774–787. [Google Scholar] [CrossRef]
  31. Luo, D.D.; Wang, C.K.; Jin, Y. Plant water-regulation strategies: Isohydric versus anisohydric behavior. Chin. J. Plant Ecol. 2017, 41, 1020–1032. [Google Scholar]
  32. Tardieu, F.; Simonneau, T. Variability among Species of Stomatal Control under Fluctuating Soil Water Status and Evaporative Demand: Modelling Isohydric and Anisohydric Behaviours. J. Exp. Bot. 1998, 49, 419–432. [Google Scholar] [CrossRef] [Green Version]
  33. Klein, T. The Variability of Stomatal Sensitivity to Leaf Water Potential across Tree Species Indicates a Continuum between Isohydric and Anisohydric Behaviours. Funct. Ecol. 2014, 28, 1313–1320. [Google Scholar] [CrossRef]
  34. Eller, C.B.; Lima, A.L.; Oliveira, R.S. Cloud Forest Trees with Higher Foliar Water Uptake Capacity and Anisohydric Behavior Are More Vulnerable to Drought and Climate Change. New Phytol. 2016, 211, 489–501. [Google Scholar] [CrossRef] [Green Version]
  35. Schreel, J.D.M.; von der Crone, J.S.; Kangur, O.; Steppe, K. Influence of Drought on Foliar Water Uptake Capacity of Temperate Tree Species. Forests 2019, 10, 562. [Google Scholar] [CrossRef] [Green Version]
  36. Meng, X.Y.; Meng, B.C.; Wang, Y.J.; Liu, Z.H.; Ji, X.N.; Yu, D.L. Influence of Climate Change and Human Activities on Water Resources in Ebinur Lake in Recent 60 Years. Hydrol. China 2015, 35, 90–96. [Google Scholar]
  37. Qin, W.H.; Meng, W.Q. Desert Salt Lake–Ebinur Lake National Nature Reserve. Lifeworld China 2020, 7, 16–27. [Google Scholar]
  38. Wang, X.F. Development Countermeasures of Psammophytes in Northwest China. Rural Technol. 2022, 13, 115–117. [Google Scholar] [CrossRef]
  39. Zhang, X.N.; Li, Y.; He, X.M.; Lv, G.H. Effects of soil water and salinity on relationships between desert plant functional diversity and species diversity. Chin. J. Ecol. 2019, 38, 2354–2360. [Google Scholar] [CrossRef]
  40. Li, Y.; Sima, Y.Z.B.B.; Dong, Y.; Sheng, Y.C.; Tan, J. Analysis of Variation Rules and Abrupt Changes of Precipitation in Aibi Lake Oasis. Water-Sav. Irrig. China 2017, 10, 41–45. [Google Scholar]
  41. Wang, S.Y.; Lv, G.H.; Jiang, L.M.; Wang, H.F.; Li, Y.; Wang, J.L. Multi-scale Analysis on Functional Diversity and Phylogenetic Diversity of Typical Plant Community in Ebinur Lake. Chin. J. Ecol. Environ. 2020, 29, 889–900. [Google Scholar] [CrossRef]
  42. Rosado, B.H.P.; Holder, C.D. The Significance of Leaf Water Repellency in Ecohydrological Research: A Review. Ecohydrology 2013, 6, 150–161. [Google Scholar] [CrossRef]
  43. Holder, C.D. Leaf Water Repellency of Species in Guatemala and Colorado (USA) and Its Significance to Forest Hydrology Studies. J. Hydrol. 2007, 336, 147–154. [Google Scholar] [CrossRef]
  44. Shi, H.; Wang, H.X.; Li, Y.Y. Wettability on plant leaf surface and its ecological significance. Acta Ecol. Sin. 2011, 31, 4287–4298. [Google Scholar]
  45. Liang, X.; Su, D.; Yin, S.; Wang, Z. Leaf Water Absorption and Desorption Functions for Three Turfgrasses. J. Hydrol. 2009, 376, 243–248. [Google Scholar] [CrossRef]
  46. Tyree, M.T.; Hammel, H.T. The Measurement of the Turgor Pressure and the Water Relations of Plants by the Pressure-Bomb Technique. J. Exp. Bot. 1972, 23, 267–282. [Google Scholar] [CrossRef]
  47. Leaf Pressure-Volume Curve Parameters. PROMETHEUS. Available online: https://prometheusprotocols.net/function/water-relations/pressure-volume-curves/leaf-pressure-volume-curve-parameters/ (accessed on 24 October 2022).
  48. Reich, P.B.; Wright, I.J.; Cavender-Bares, J.; Craine, J.M.; Oleksyn, J.; Westoby, M.; Walters, M.B. The Evolution of Plant Functional Variation: Traits, Spectra, and Strategies. Int. J. Plant Sci. 2003, 164, 143–164. [Google Scholar] [CrossRef]
  49. Guzmán-Delgado, P.; Mason Earles, J.; Zwieniecki, M.A. Insight into the Physiological Role of Water Absorption via the Leaf Surface from a Rehydration Kinetics Perspective. Plant Cell Environ. 2018, 41, 1886–1894. [Google Scholar] [CrossRef]
  50. Ma, C.Y.; Wang, W.Q.; Zhao, Y.X.; Xiao, K. Study on leaf anatomical structure of Glycyrrhiza uralensis. Chin. J. Tradit. Chin. Med. 2009, 34, 1034–1037. [Google Scholar]
  51. Yin, Q.L. Leaf Anatomical Structure of Main Plants and Its Environmental Adaptations in the Hilly-Gullied Platrau Region. Master’s Thesis, Northwest University, Kirkland, WA, USA, 2015. Available online: http://kns.cnki.net/kcms/detail/frame/list.aspx?dbcode=CMFD&filename=1015333288.nh&dbname=CMFD201601&RefType=1&vl=p3BxlfZtEZV6ZlMXQ2T_6zj4w92WuEZpqvC4gPiHsafUhB_cklND0PZDZUpK1FZy (accessed on 26 November 2022).
  52. Wang, S.J.; Ren, L.Q.; Han, Z.W.; Qiu, Z.M.; Zhou, C.H. non–smooth morphology of typical plant leaf surface and its anti–adhesion and hydrophobicity. Chin. J. Agric. Eng. 2005, 9, 16–19. [Google Scholar]
  53. Liu, Y.X.; Ma, Y.L.; Lan, H.Y. Advances in morphology and function of plant non-glandular trichomes. Plant Physiol. China 2018, 54, 1527–1534. [Google Scholar] [CrossRef]
  54. Schwerbrock, R.; Leuschner, C. Air Humidity as Key Determinant of Morphogenesis and Productivity of the Rare Temperate Woodland Fern Polystichum Braunii. Plant Biol. 2016, 18, 649–657. [Google Scholar] [CrossRef] [PubMed]
  55. Yang, J.H.; Meng, N.; Zuo, F.Y.; Liu, Y.J.; Li, J.K. Leaf water potential, anatomical structure of epidermis and leaf salt-tolerant characteristics of wild Nitraria tangutorum B.and Suaeda glauca B. J. Tianjin Agric. Univ. China 2013, 20, 5–8. [Google Scholar]
  56. Chen, L.; Yang, X.G.; Song, N.P.; Yang, M.X.; Xiao, X.P.; Wang, X. Leaf water uptake strategy of plant in the arid and semi–arid region of Ningxia. J. Zhejiang Univ. China (Agric. Life Sci.) 2013, 39, 565–574. [Google Scholar]
  57. Boanares, D.; Ferreira, B.G.; Kozovits, A.R.; Sousa, H.C.; Isaias, R.M.S.; França, M.G.C. Pectin and Cellulose Cell Wall Composition Enables Different Strategies to Leaf Water Uptake in Plants from Tropical Fog Mountain. Plant Physiol. Biochem. 2018, 122, 57–64. [Google Scholar] [CrossRef]
  58. Berry, Z.C.; Emery, N.C.; Gotsch, S.G.; Goldsmith, G.R. Foliar Water Uptake: Processes, Pathways, and Integration into Plant Water Budgets. Plant Cell Environ. 2019, 42, 410–423. [Google Scholar] [CrossRef] [Green Version]
  59. Rascio, A.; Nicastro, G.; Carlino, E.; Di Fonzo, N. Differences for Bound Water Content as Estimated by Pressure-Volume and Adsorption Isotherm Curves. Plant Sci. 2005, 169, 395–401. [Google Scholar] [CrossRef]
  60. Powell, T.L.; Wheeler, J.K.; de Oliveira, A.A.R.; Lola da Costa, A.C.; Saleska, S.R.; Meir, P.; Moorcroft, P.R. Differences in Xylem and Leaf Hydraulic Traits Explain Differences in Drought Tolerance among Mature Amazon Rainforest Trees. Glob. Change Biol. 2017, 23, 4280–4293. [Google Scholar] [CrossRef] [Green Version]
  61. Zhu, S.-D.; Chen, Y.-J.; Ye, Q.; He, P.-C.; Liu, H.; Li, R.-H.; Fu, P.-L.; Jiang, G.-F.; Cao, K.-F. Leaf Turgor Loss Point Is Correlated with Drought Tolerance and Leaf Carbon Economics Traits. Tree Physiol. 2018, 38, 658–663. [Google Scholar] [CrossRef]
  62. Huo, J.; Shi, Y.; Zhang, H.; Hu, R.; Huang, L.; Zhao, Y.; Zhang, Z. More Sensitive to Drought of Young Tissues with Weak Water Potential Adjustment Capacity in Two Desert Shrubs. Sci. Total Environ. 2021, 790, 148103. [Google Scholar] [CrossRef]
  63. Bartlett, M.K.; Scoffoni, C.; Sack, L. The Determinants of Leaf Turgor Loss Point and Prediction of Drought Tolerance of Species and Biomes: A Global Meta-Analysis. Ecol. Lett. 2012, 15, 393–405. [Google Scholar] [CrossRef] [PubMed]
  64. Meinzer, F.C.; Woodruff, D.R.; Marias, D.E.; Smith, D.D.; McCulloh, K.A.; Howard, A.R.; Magedman, A.L. Mapping ‘Hydroscapes’ along the Iso-to Anisohydric Continuum of Stomatal Regulation of Plant Water Status. Ecol. Lett. 2016, 19, 1343–1352. [Google Scholar] [CrossRef] [PubMed]
  65. Proxies for Stringency of Regulation of Plant Water Status (Iso/Anisohydry): A Global Data Set Reveals Coordination and Trade-Offs among Water Transport Traits. Tree Physiol. 2019, 39, 122–134. [CrossRef] [PubMed] [Green Version]
  66. Li, X.; Blackman, C.J.; Peters, J.M.R.; Choat, B.; Rymer, P.D.; Medlyn, B.E.; Tissue, D.T. More than Iso/Anisohydry: Hydroscapes Integrate Plant Water Use and Drought Tolerance Traits in 10 Eucalypt Species from Contrasting Climates. Funct. Ecol. 2019, 33, 1035–1049. [Google Scholar] [CrossRef]
  67. Eller, C.B.; Burgess, S.S.O.; Oliveira, R.S. Environmental Controls in the Water Use Patterns of a Tropical Cloud Forest Tree Species, Drimys Brasiliensis (Winteraceae). Tree Physiol. 2015, 35, 387–399. [Google Scholar] [CrossRef] [Green Version]
  68. Wu, Y.; Song, L.; Liu, W.; Liu, W.; Li, S.; Fu, P.; Shen, Y.; Wu, J.; Wang, P.; Chen, Q.; et al. Fog Water Is Important in Maintaining the Water Budgets of Vascular Epiphytes in an Asian Tropical Karst Forests during the Dry Season. Forests 2018, 9, 260. [Google Scholar] [CrossRef] [Green Version]
  69. Schaepdryver, K.H.D.; Goossens, W.; Naseef, A.; Kalpuzha Ashtamoorthy, S.; Steppe, K. Foliar Water Uptake Capacity in Six Mangrove Species. Forests 2022, 13, 951. [Google Scholar] [CrossRef]
  70. Carmichael, M.J.; White, J.C.; Cory, S.T.; Berry, Z.C.; Smith, W.K. Foliar Water Uptake of Fog Confers Ecophysiological Benefits to Four Common Tree Species of Southeastern Freshwater Forested Wetlands. Ecohydrology 2020, 13, 2240. [Google Scholar] [CrossRef]
  71. Liu, Z.; Zhang, H.; Yu, X.; Jia, G.; Jiang, J. Evidence of Foliar Water Uptake in a Conifer Species. Agric. Water Manag. 2021, 255, 106993. [Google Scholar] [CrossRef]
  72. Maréchaux, I.; Bartlett, M.K.; Iribar, A.; Sack, L.; Chave, J. Stronger Seasonal Adjustment in Leaf Turgor Loss Point in Lianas than Trees in an Amazonian Forest. Biol Lett. 2017, 13, 20160819. [Google Scholar] [CrossRef] [Green Version]
  73. Long, Y.X. Water Regulation Strategies of Five Dominant Woody Plants in Desert Forest of Ebinur Lake Basin. Master’s Thesis, Xinjiang University, Urumqi, China, 2021. [Google Scholar] [CrossRef]
Figure 1. The study area and plots. (a) Location map of the Xinjiang Uygur Autonomous Region. Where the red area represents Ebinur Lake; (b,c) location of the study area; (d) leaves of A. sparsifolia, G. uralensis, H. halodendron, A. hendersonii, P. euphratica, and N. sibirica.
Forests 14 00551 g001
Figure 2. Sketch of contact angle of water droplet and leaf surface.
Forests 14 00551 g002
Figure 3. The variation in foliar water uptake accumulation per unit area (FWUcapacity) and foliar water uptake rate (k) over time. (ac) FWUcapacity of six plants under high water, medium water, and low water gradients over time; (df) k of six plants under high water, medium water, and low water gradients over time. Colored regions show 95% confidence intervals for the mean predicted value estimated using logistic and exponential models, and the parameters fit using each model are presented in Table S2 (N = 4).
Forests 14 00551 g003
Figure 4. The variation in FWUcapacity and k over time (al) under different water gradients. The parameters fit using each model are presented in Table S2 (N = 40).
Forests 14 00551 g004
Figure 5. Differences in FWU parameters (ΔM and FWUcapacity) among water gradients and species. (a) The difference in foliar water uptake accumulation (ΔM) between species and water gradients; (b) FWUcapacity among species and water gradients. Different lowercase letters indicate significant differences between species, and different uppercase letters indicate significant differences between water gradients (mean + SE; N = 4), α = 0.05.
Forests 14 00551 g005
Figure 6. The differences in hydraulic parameters between water gradients and species. (a) The difference in the turgor loss point (Ψtlp); (b) the difference in the saturated osmotic potential (π0); (c) the difference in the elastic mudulus (ɛ); (d) the difference in osmotic adjustment ability (Ψtlp−π0). Different lowercase letters indicate significant differences between species, and different uppercase letters indicate significant differences between water gradients (mean + SE; N = 4), α = 0.05.
Forests 14 00551 g006
Figure 7. Multivariate factor analysis and correlation analysis of six plants’ FWU parameters, leaf structure, and hydraulic parameters. Leaf structure (LS) includes LDMC and LT; FWU parameters (FWU) include ΔM, ΔLWC, FWUcapacity, and k45; hydraulic parameters (HP) include Ψtlp, π0, ε, and π0tlp; leaf wettability (LW) represents CA; SaG denotes species and gradients; k45 represents the initial foliar water uptake rate; LDMC represents leaf dry matter content; SLA represents specific leaf area; Cft represents capacitance at full turgor; Ctlp represents capacitance at turgor loss point; CA represents leaf contact angle. Blue, yellow, gray, and red represent FWU, HP, LS, and LW, respectively, ** p < 0.01.
Forests 14 00551 g007
Table 1. Analysis of variance of soil water content and division of water gradients.
Water GradientSoil Sample DepthSoil Water Content
High water0–20 cm0.131 ± 0.026 a
20–40 cm0.144 ± 0.013 a
40–60 cm0.137 ± 0.009 a
Medium water0–20 cm0.093 ± 0.013 b
20–40 cm0.119 ± 0.022 b
40–60 cm0.128 ± 0.018 a
Low water0–20 cm0.028 ± 0.007 c
20–40 cm0.026 ± 0.005 c
40–60 cm0.035 ± 0.003 b
Note: different lowercase letters indicate significant differences in soil water content in different squares (mean + SD; N = 3), α = 0.05.
Table 2. Determination of contact angles of the leaves of six desert plant species.
Species5 μL Contact Angle (°)
High WaterMedium WaterLow Water
P. euphratica101.69 ± 2.22 Aa101.62 ± 2.28 Aa99.33 ± 3.7 Aa
N. sibirica83.56 ± 4.62 Ab81.82 ± 5.57 Ab80.58 ± 3.67 Ab
A. sparsifolia122.08 ± 6.96 Ac127.27 ± 6.12 Ac125.82 ± 4.48 Ac
A. hendersonii129.22 ± 3.63 Ad131.97 ± 4.33 Ac131.23 ± 6.16 Ad
G. uralensis59.42 ± 4.28 Ac61.37 ± 3.44 Ad-
H. halodendron123.58 ± 4.17 e--
Note: lowercase letters indicate significant differences between species, and uppercase letters indicate significant differences between water gradients (mean + SD; N = 6), α = 0.05.
Table 3. Differences in leaf structure characteristics among three water gradients and species.
GradientSpeciesLT (mm)LDMC (%)
High waterP. euphratica0.463 ± 0.038 ABd0.357 ± 0.037 Ac
N. sibirica0.652 ± 0.009 Ae0.198 ± 0.026 Aa
A. sparsifolia0.382 ± 0.014 Ac0.350 ± 0.017 Ac
A. hendersonii0.435 ± 0.078 Acd0.276 ± 0.032 Ab
G. uralensis0.208 ± 0.008 Aa0.400 ± 0.012 Ac
H. halodendron0.296 ± 0.037 b0.389 ± 0.031 c
Medium waterP. euphratica0.513 ± 0.080 Abc0.253 ± 0.008 Bb
N. sibirica0.682 ± 0.115 Ad0.215 ± 0.019 Aa
A. sparsifolia0.469 ± 0.016 Bb0.312 ± 0.018 Bc
A. hendersonii0.635 ± 0.072 Bcd0.234 ± 0.017 Aab
G. uralensis0.203 ± 0.004 Aa0.393 ± 0.019 Ad
Low waterP. euphratica0.410 ± 0.019 Ba0.334 ± 0.026 Aa
N. sibirica0.728 ± 0.217 Ab0.214 ± 0.038 Ab
A. sparsifolia0.489 ± 0.028 Ba0.312 ± 0.019 Ba
A. hendersonii0.483 ± 0.046 Aa0.282 ± 0.026 Aa
Note: LT represents leaf thickness; LDMC represents leaf dry matter content. Different lowercase letters indicate significant differences between species, and different uppercase letters indicate significant differences between water gradients (mean + SE; N = 4), α = 0.05.
Disclaimer/Publisher’s Note: The statements, opinions and data contained in all publications are solely those of the individual author(s) and contributor(s) and not of MDPI and/or the editor(s). MDPI and/or the editor(s) disclaim responsibility for any injury to people or property resulting from any ideas, methods, instructions or products referred to in the content.