Article

Carbon Sink Limitation Determines the Formation of the Altitudinal Upper Limit of an Evergreen Oak in Eastern China

1
Tiantong National Forest Ecosystem Observation and Research Station, Shanghai Key Lab for Urban Ecological Processes and Eco-Restoration, School of Ecological and Environmental Sciences, East China Normal University, Dongchuan Road 500, Shanghai 200241, China
2
Institute of Eco-Chongming, Cuiniao Road 20, Shanghai 202162, China
3
Institute of Environmental Sciences (CML), Leiden University, Einsteinweg 2, 2333 CC Leiden, The Netherlands
4
Te Pukenga—Nelson-Marlborough Institute of Technology, Hardy Street 322, Nelson 7010, New Zealand
*
Author to whom correspondence should be addressed.
Forests 2023, 14(3), 597; https://doi.org/10.3390/f14030597
Submission received: 9 February 2023 / Revised: 8 March 2023 / Accepted: 14 March 2023 / Published: 17 March 2023
(This article belongs to the Special Issue Biodiversity along Elevational Gradients: Insights from Multiple Taxa)

Abstract

:
Temperature is a critical environmental factor determining the upper limits of evergreen broadleaved tree taxa. However, whether carbon source or carbon sink limitation shapes this limit is not yet fully understood. We studied a subtropical evergreen oak (Cyclobalanopsis gracilis) at the northern limit of its distributional range. Along an elevational/temperature gradient towards its upper limit, we surveyed the variations in non-structural carbohydrate (NSC) concentrations of C. gracilis adults for 3 years. Additionally, a carbon balance manipulation experiment of debudding and defoliation was done to C. gracilis seedlings close to the upper distributional limit, aiming at investigating the changes in NSC concentrations and growth rates in different treatment groups. Our results showed that increasing elevation or decreasing temperature did not affect the trends of NSC concentration in twigs, old branches, or trunks of adults, nor did carbon balance manipulations (debudding or defoliation) of seedlings have a significant effect on the growth, while defoliation decreased NSC concentration in twigs. These results suggest that carbon sink limitation is the key physiological mechanism underlying low temperature in the shaping of this dominant evergreen broadleaved tree species in eastern China. Therefore, the formation of upper limits in evergreen oaks is most likely the result of a direct low-temperature restriction on meristematic activity and tissue formation instead of the result of insufficient carbon supply. More studies with expanded sample sizes are needed on other evergreen broadleaved tree species growing at their upper limits to confirm the carbon sink limitation hypothesis and reveal the detailed mechanisms.

1. Introduction

Low temperature is a critical environmental factor determining the leading edge (i.e., upper limit or poleward limit) of tree species worldwide. Two physiological mechanisms have been proposed to explain how low temperatures limit tree growth at treelines [1]. The first hypothesis is carbon source limitation, which suggests that carbon supply decreases with decreasing temperature due to reduced photosynthetic rates or shortened photosynthetically active season length. Thus, trees occurring beyond the leading edge are not able to gain sufficient carbon to establish and thrive [2,3]. The other mechanism has been called the carbon sink limitation hypothesis (or growth limitation hypothesis). This hypothesis suggests that even if there is sufficient carbon acquisition through photosynthesis, limitations induced by low temperatures on meristematic activity and tissue formation could still shape the treeline [4]. So far, these two competing hypotheses have been widely tested, and most studies support carbon sink limitation at the treeline [1,5,6,7], including three evergreen broadleaved tree species [8,9,10].
In contrast to the formation of treelines, which represent the leading edge of the tree life-form, the physiological processes underlying the formation of leading edges of tree taxa that do not reach the treelines are not yet fully understood [11]. To date, carbon-based physiological mechanisms behind the formation of the elevational upperlimit of eight temperate deciduous tree species have been reported [12], while similar studies on evergreen broadleaved trees and in non-temperate regions are still lacking.
Assessing the trends in non-structural carbohydrates (NSC) concentration in different tree tissues along a temperature or elevational gradient has been the common approach to differentiate between the two competing carbon limitation hypotheses (Figure 1a) [1,8,10]. The basic assumption underlying this approach, however, has been criticized since the allocation of assimilation to storage is not a totally passive process [13,14]. Despite this criticism, most studies still only employ this approach. A multi-faceted approach to distinguishing between these hypotheses is largely lacking, certainly for non-treeline-forming species. Another approach to carbon source-sink manipulation experiments that can be carried out at the leading edge involves enriching the carbon source through CO2 fertilization [15] or depleting the source or sink via defoliation and debudding treatments [16]. Especially, defoliation and debugging experiments are easier to carry out at remote field sites where installing a CO2 fertilization setup is not possible. The defoliation and debudding treatments can break the carbon balance in tree species (Figure 1b), since defoliation decreases carbon supply and debudding increases carbon supply for the remaining meristems. These treatments will impose an imbalanced carbon supply that affects tree growth and NSC concentration. Based on the patterns, we can infer the dominant type of either carbon source or sink limitation (Figure 1b).
In humid eastern Asia, the leading edges of evergreen broadleaved trees show a consistent pattern shaped by temperature indexes, which are usually defined by three thermal conditions: a warmth index (WI) at a threshold of 85 °C·months (the sum of monthly mean temperatures above 5 °C), a coldness index (CI) at a threshold of −10 °C·months (the sum of monthly mean temperatures below 5 °C), and a coldest monthly mean temperature (CMT) of −1 °C [18,19,20,21]. This consistency suggests that low temperatures are a key factor shaping the upper limits of these non-treeline-forming trees in the region. However, the major driving physiological mechanism (i.e., carbon source limitation or carbon sink limitation) behind the cold temperature limitation has not yet been clarified. In this study, we assessed whether carbon sink or source limitation is caused by cold temperatures in Cyclobalanopsis gracilis (Rehder and E. H. Wilson). W. C. Cheng et T. Hong (an evergreen oak) by (1) assessing NSC concentrations along a temperature gradient in each autumn of 3 consecutive years and by (2) conducting a defoliation and debudding experiment, to elucidate the physiological processes underlying the formation of the altitudinal upper limits of C. gracilis.

2. Materials and Methods

2.1. Study Area

The study was conducted in Tianma National Nature Reserve, located at the junction of Anhui, Henan, and Hubei provinces (115°20′~115°50′ E, 30°10′~31°20′ N), in eastern China (Figure 2). The region is characterized by a subtropical, moist monsoon climate. The mean annual temperature is 13.8 °C, with an extreme maximum temperature recorded of 38.1 °C (July) and a minimum of −23 °C (January). The mean annual precipitation is 1489 mm, which mostly falls from May to September. This region consists of mixed evergreen and deciduous broadleaved forests [22] and is a transition area from evergreen broadleaved forests to deciduous broadleaved forests [23,24].

2.2. Woody Tissue Sampling and NSC Measurements

The dominant evergreen broadleaved canopy tree species C. gracilis reaches both its northern [25] and upper distributional limits [26,27] in our study area. According to our monitoring, this upper limit (a.s.l. 1200 m) corresponded to a WI of 85.34 °C·months, a CI of −15.53 °C·months, and a CMT of −2.86 °C in 2018. These climatic indexes were lower than or approximately equal to the three thermal thresholds of the leading edges of evergreen broadleaved trees in humid eastern Asia, suggesting that this upper limit was a truly climatic leading edge. We employed the data of three surveys about variations in NSC concentrations in mature C. gracilis along elevations. The sample sites are located at the elevational transects in two mountain ranges that cover the core area of the nature reserve, namely Tiantangzhai (TTZ) and Mazongling (MZL) (Figure 2; Table 1). The sample sites at elevations of 1016, 1057, 1096, and 1148 m were distributed along a valley that was on the north slope of the Dabie Mountains, and the four sample sites were at the bottom of the slopes. Sample sites at elevations of 1016 and 1057 m had similar aspects facing west, while sample sites at elevations of 1096 and 1148 m had similar aspects facing east. In two out of three surveys, the NSC concentrations of leading twigs (i.e., shoot between the apex of the branch and the first bud scale scar, considered the current-year branch) and old branches (i.e., branch out of the third bud scale scar) were measured in each autumn of 2016 and 2017. To avoid the confounding effects of sunlight, branches from five healthy adults were collected in peripheral parts of the crown at each site. In another survey, only tree cores were collected from three healthy adult individuals at each site, and the last 5 cm of sapwood was used for determining the NSC concentrations of trunks in the autumn of 2018. One tree core was extracted from each tree with a 5.15 mm increment borer (Haglof) at c. 1 m above the ground. Leading twig and old branch samples, as well as bark and tree core samples, were killed in a microwave oven within 12 h after sampling [7] and then dried to constant weight at 65 °C. These dried samples were ground into a fine powder and then processed for NSC measurement following an improved phenol-sulfuric acid method [28]. The detailed procedure for measuring NSC concentrations is described in our previous publication [24].

2.3. Debudding and Defoliation Experiment

We conducted a debudding and defoliation experiment on C. gracilis seedlings close to their upper limit because any changes induced by the debudding and defoliation treatments would affect the carbon balance and subsequent growth and NSC patterns. We acknowledge that the physiology of adult trees may differ from that of seedlings. However, it is the establishment of seedlings that determines the formation of the upper limit. As the upper limit of C. gracilis seedlings and adults is the same, we speculate that the physiological mechanisms behind this limit are the same for both the seedlings and adults. We conducted an in-situ experiment with a balanced sample size (height varied between 0.23 and 0.75 m, Table S1) in early January 2017 at four sites (at the elevations of 948 m, 1016 m, 1092 m, and 1120 m a.s.l.) close to the upper limit. The coldest month mean temperature of the year was −1.9~−2.4 °C across the four sites. Almost all the seedlings with suitable size were used in the experiment since seedlings with larger size (i.e., height > 0.23 m) were rather rare close to the species’ upper limit (approximately 1–10 ind/400 m2). In the debudding treatment, three quarters of the buds on each seedling branch were removed, with at least one of the buds at the apex of each branch remaining. In the defoliation treatment, half of the leaves on each seedling’s branch were removed. Unfortunately, herbivory decreased our sample size to 23 undamaged seedlings. We grouped these undamaged seedlings into 3 categories according to the initial treatment, i.e., control (10 individuals), debudding (8 individuals), and defoliation (5 individuals), since the elevational difference of c. 170 m between them had no significant effects on growth and NSC concentrations of these intact seedlings (Tables S2 and S3). We measured the height and basal diameter of seedlings before imposing the treatments and again after one growing season in October 2017. At the same time, we also measured the length of current-year twigs and the canopy cover above each seedling using the “Gap Light Analysis Mobile” app [29]. At the end of the experiment, we collected samples of stems and current-year twigs to determine the NSC concentration.

2.4. Measurement of Air Temperature

The air temperature was recorded with a HOBO Pro data logger (U23-001 Pro v2; Onset Computer Corporation, Bourne, MA) at each sample site, except for the sites at elevations of 1057 m and 1096 m on the TTZ transect. The HOBO Pro data logger was mounted c. 1.5 m above the ground on an adult C. gracilis to avoid direct sunlight all through the year. The temperature was logged every hour for 1 year (from October 2017 to September 2018). Data were summarized to calculate the CMT (coldest monthly mean temperature) of the year because the upper distributional limits of evergreen broadleaved forests in East Asia corresponded to a CMT of −1 °C according to the previous studies [20,30]. The CMT of the sites at elevations of 1057 m and 1096 m was calculated based on the lapse rate of the TTZ transect.

2.5. Data Analyses

2.5.1. Variations in NSC Concentration along Temperature Gradients

In this study, we are interested in temperature limitation, which is often along an elevational gradient. Our previous study in this region showed the dominant environmental factor along the elevational gradient is temperature [24]. Therefore, we used a direct temperature gradient (CMT) rather than an elevation proxy to analyze the variations in NSC concentration of C. gracilis adults. We used ordinary linear regression to explore the relationship between CMT and NSC concentration. Because the lowest sites had a much warmer CMT than other sites, which may result in a non-robust regression, the effects of temperature gradients on NSC concentrations were also tested by one-way ANOVA. The differences between any two temperature gradients were tested by the LSD test because the variances among elevations were homogeneous. A log transformation was applied to some of the data to comply with the normal distribution assumption. All analyses were performed in R software (version 4.0.2). Ordinary linear regression was performed with the lm function in the base package. One-way ANOVA was done using the ANOVA function in the car package 3.0-3, and the LSD test was done using the LSD.test function in agricolae package 1.3-1.

2.5.2. Responses of Growth and NSC Concentration of Seedlings to Different Treatments

We excluded one control seedling from the analyses as it grew under a very low canopy cover (11%), which may have affected its growth and physiology. All other seedlings had a canopy cover between 68 and 92%. Considering that growth and NSC concentration may be affected by their size before the treatments are imposed [31] and their specific habitat conditions such as elevation [5] and light conditions [32,33], we used univariate linear regression to analyze the relationships between the response variables (i.e., the increment of height and basal diameter, the length of current-year twigs, and NSC concentration) and potential driving factors (i.e., the height and basal diameter before the treatments are imposed, elevational gradients, and canopy cover above seedlings). Considering the significantly positive correlation between the length of current-year twigs and the height before imposing treatments (Table S2), we considered “height + treatment” as the predictive variable to perform an ANOVA (type III sums of squares, ANOVA function in Car package 3.0-3) to test the growth difference among different treatments. The NSC and its components (starch and soluble sugar) concentrations were also compared among different treatment groups by ANOVA (type III sums of squares). Since the variances among treatments were homogeneous, the differences between any two groups were tested with the LSD test (LSD.test function in agricolae package 1.3-1).

3. Results

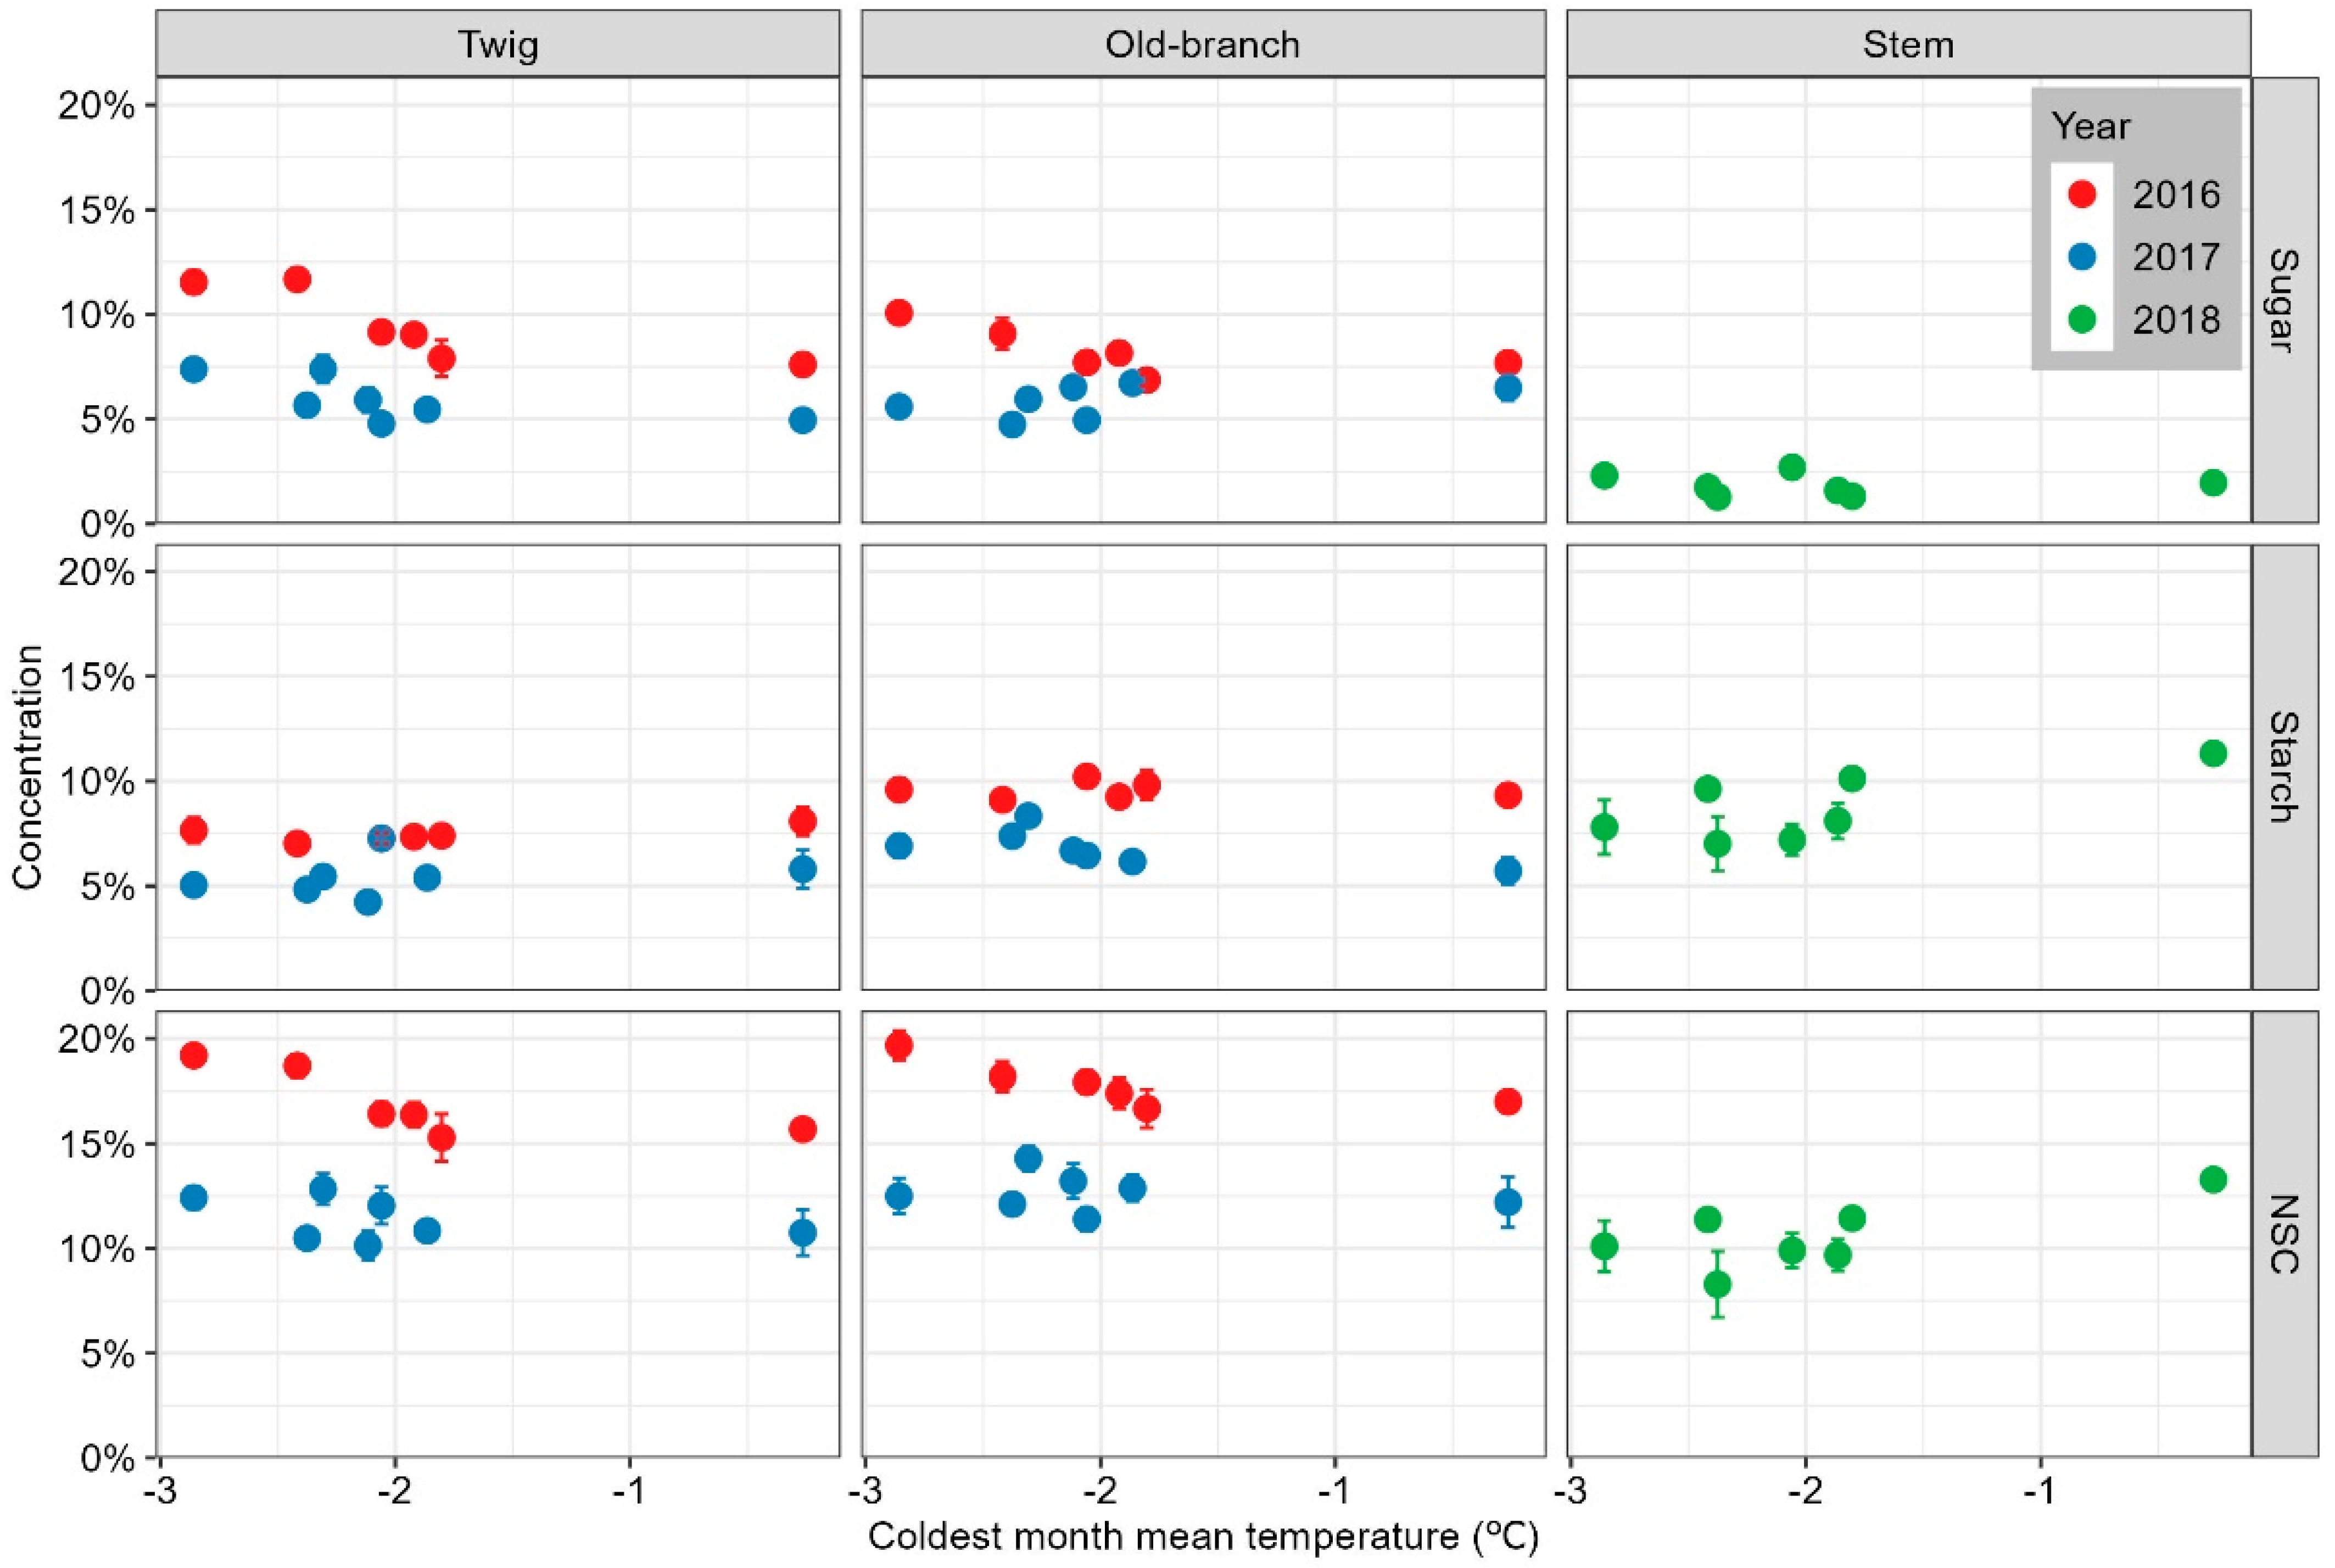
3.1. NSC Variations in Cyclobalanopsis Gracilis Adults along the Temperature Gradient

No significant correlations were found between CMT temperature and NSC or its component (soluble sugar or starch) concentration in old branches, twigs, or trunks sampled in the autumns of 2016, 2017, and 2018 (p > 0.05; Figure 3). In addition to the ordinary linear regression, the ANOVA indicated that, with a few exceptions, for each organ, the NSC or its component concentration at colder sites was no less than that at warmer sites (Table S4). In particular, in 2016, the NSC concentration in twigs at the elevation with a CMT colder than −2.4 °C was significantly higher than the elevation with a CMT warmer than −2.0 °C, and the NSC concentration in old branches at the elevation with the coldest CMT was significantly higher than the elevation with a CMT warmer than −1.9 °C (Table S4).

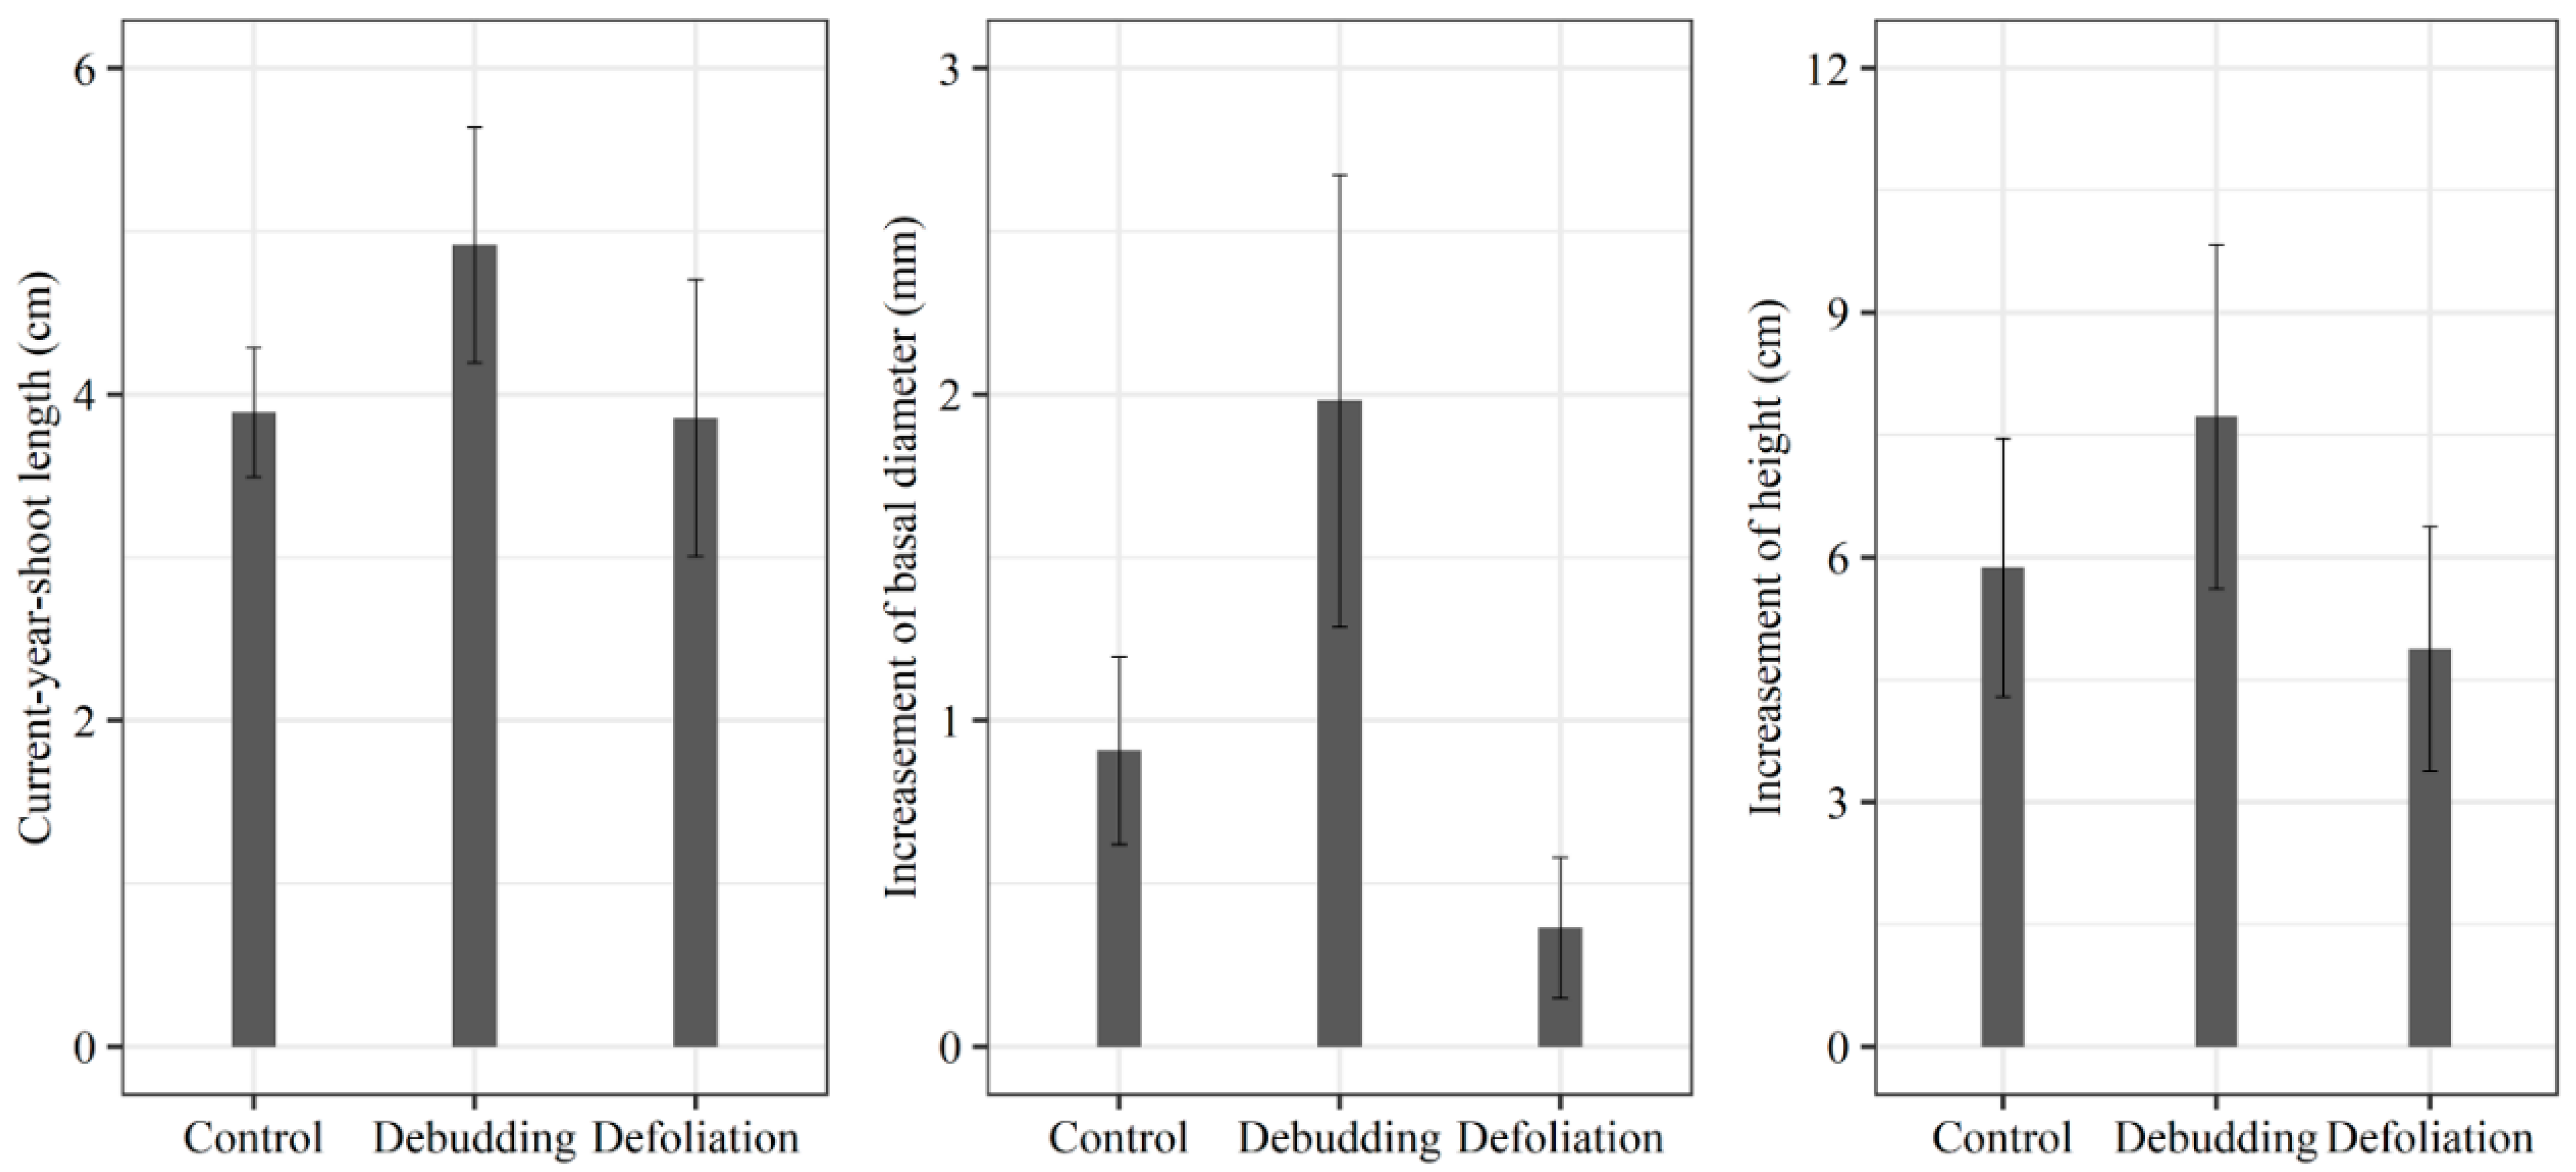
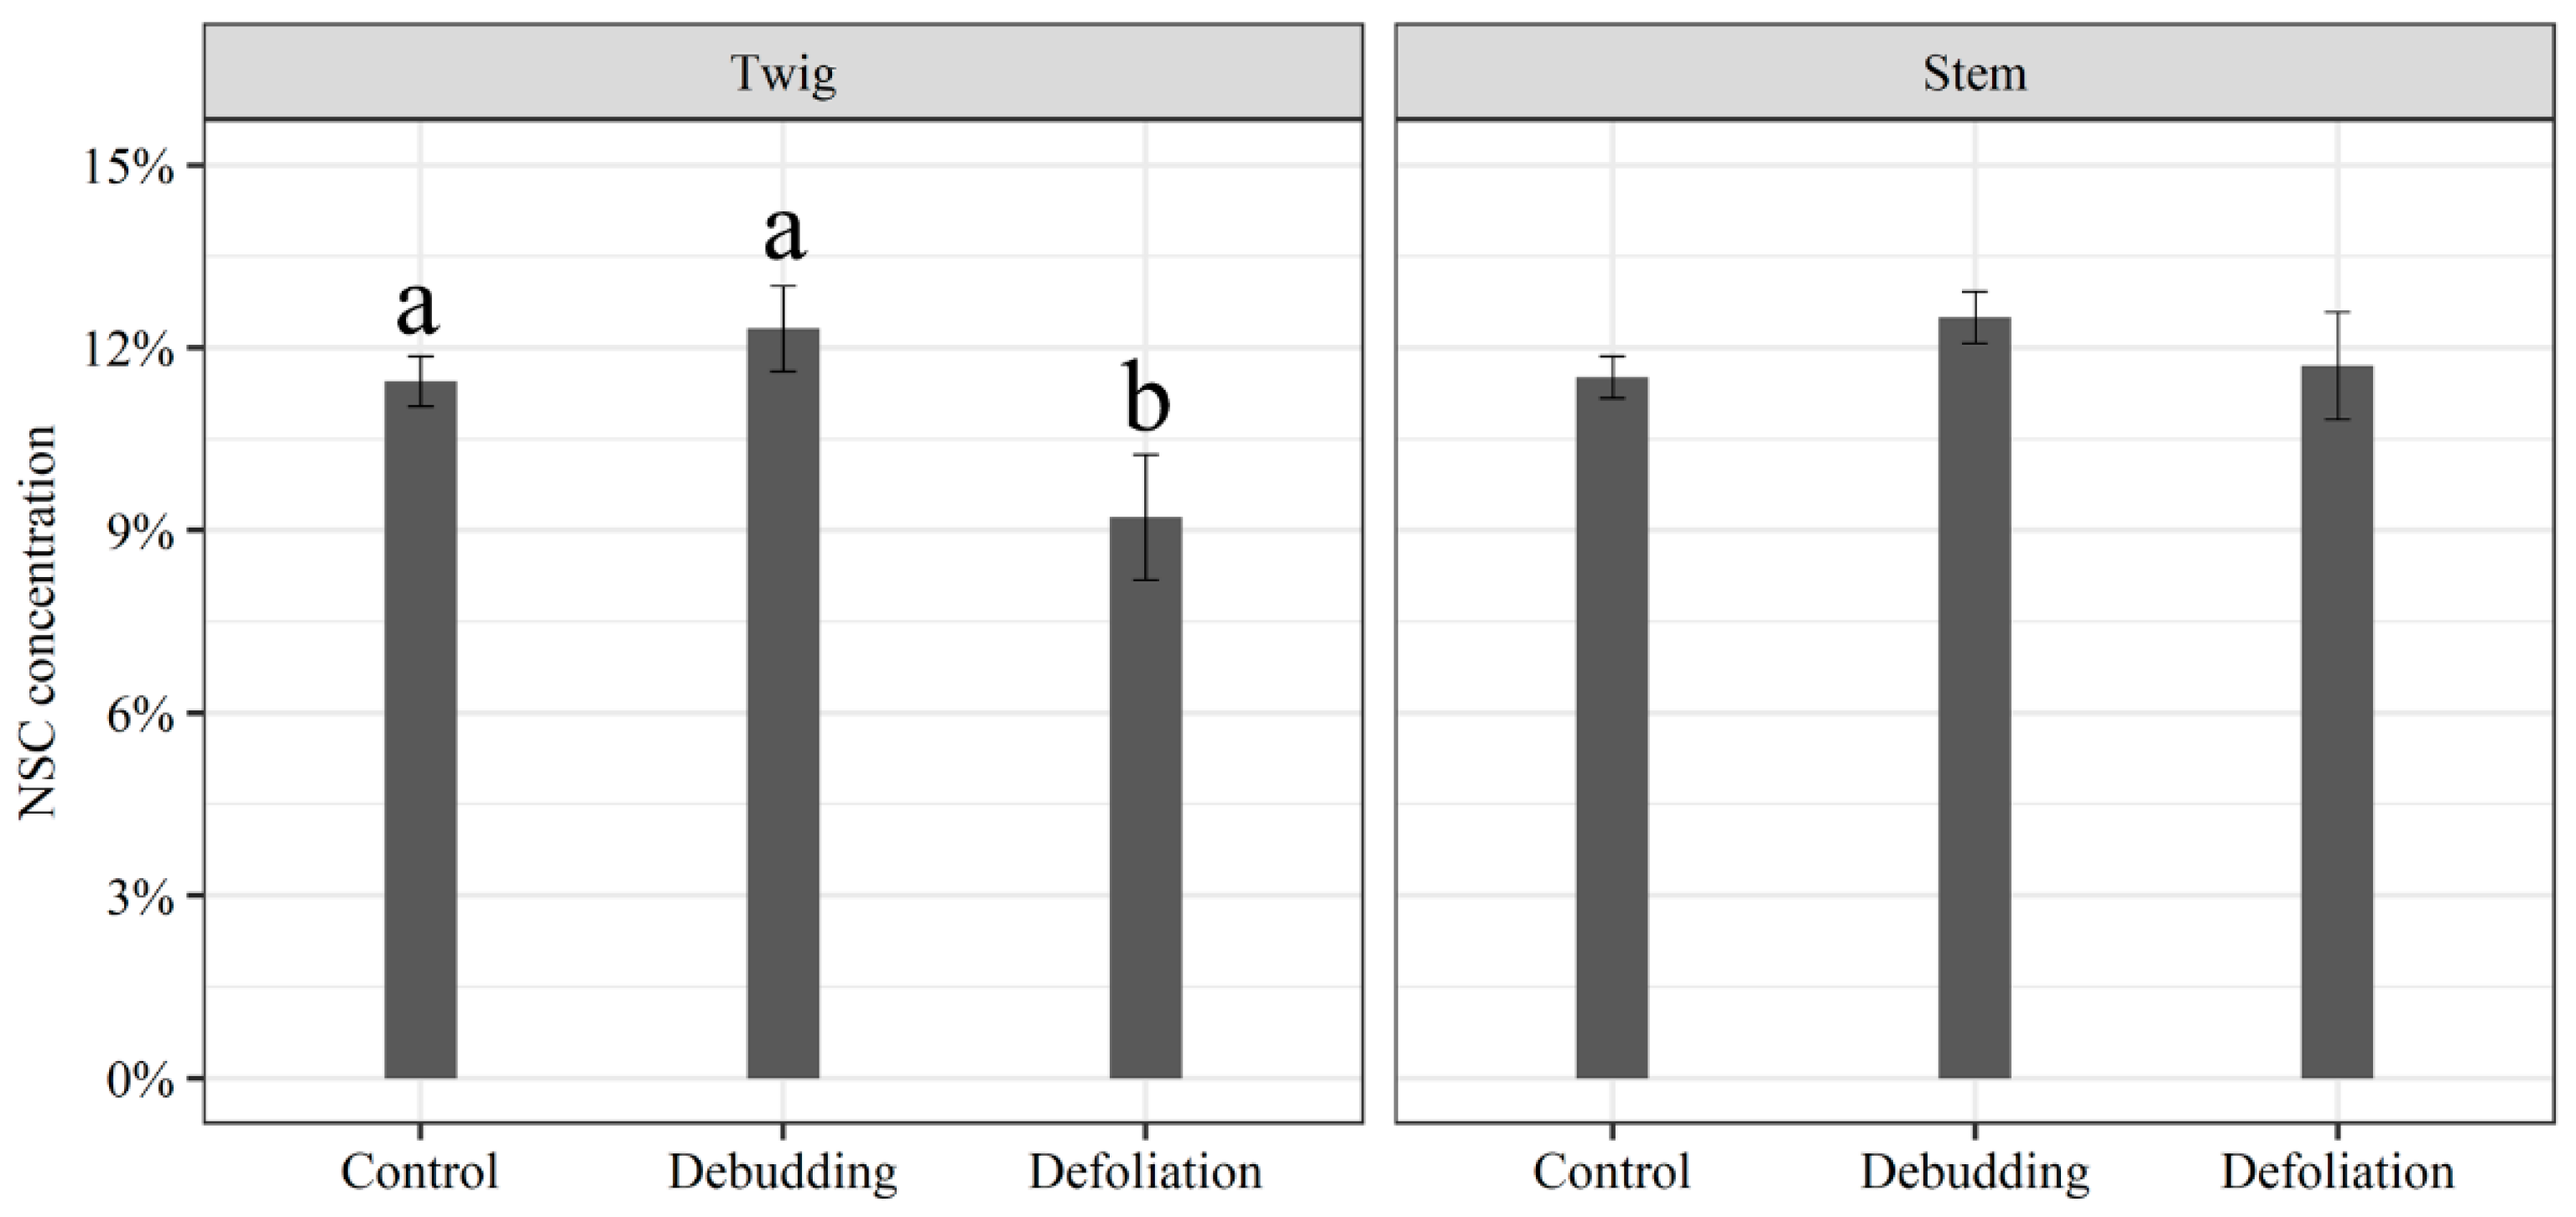
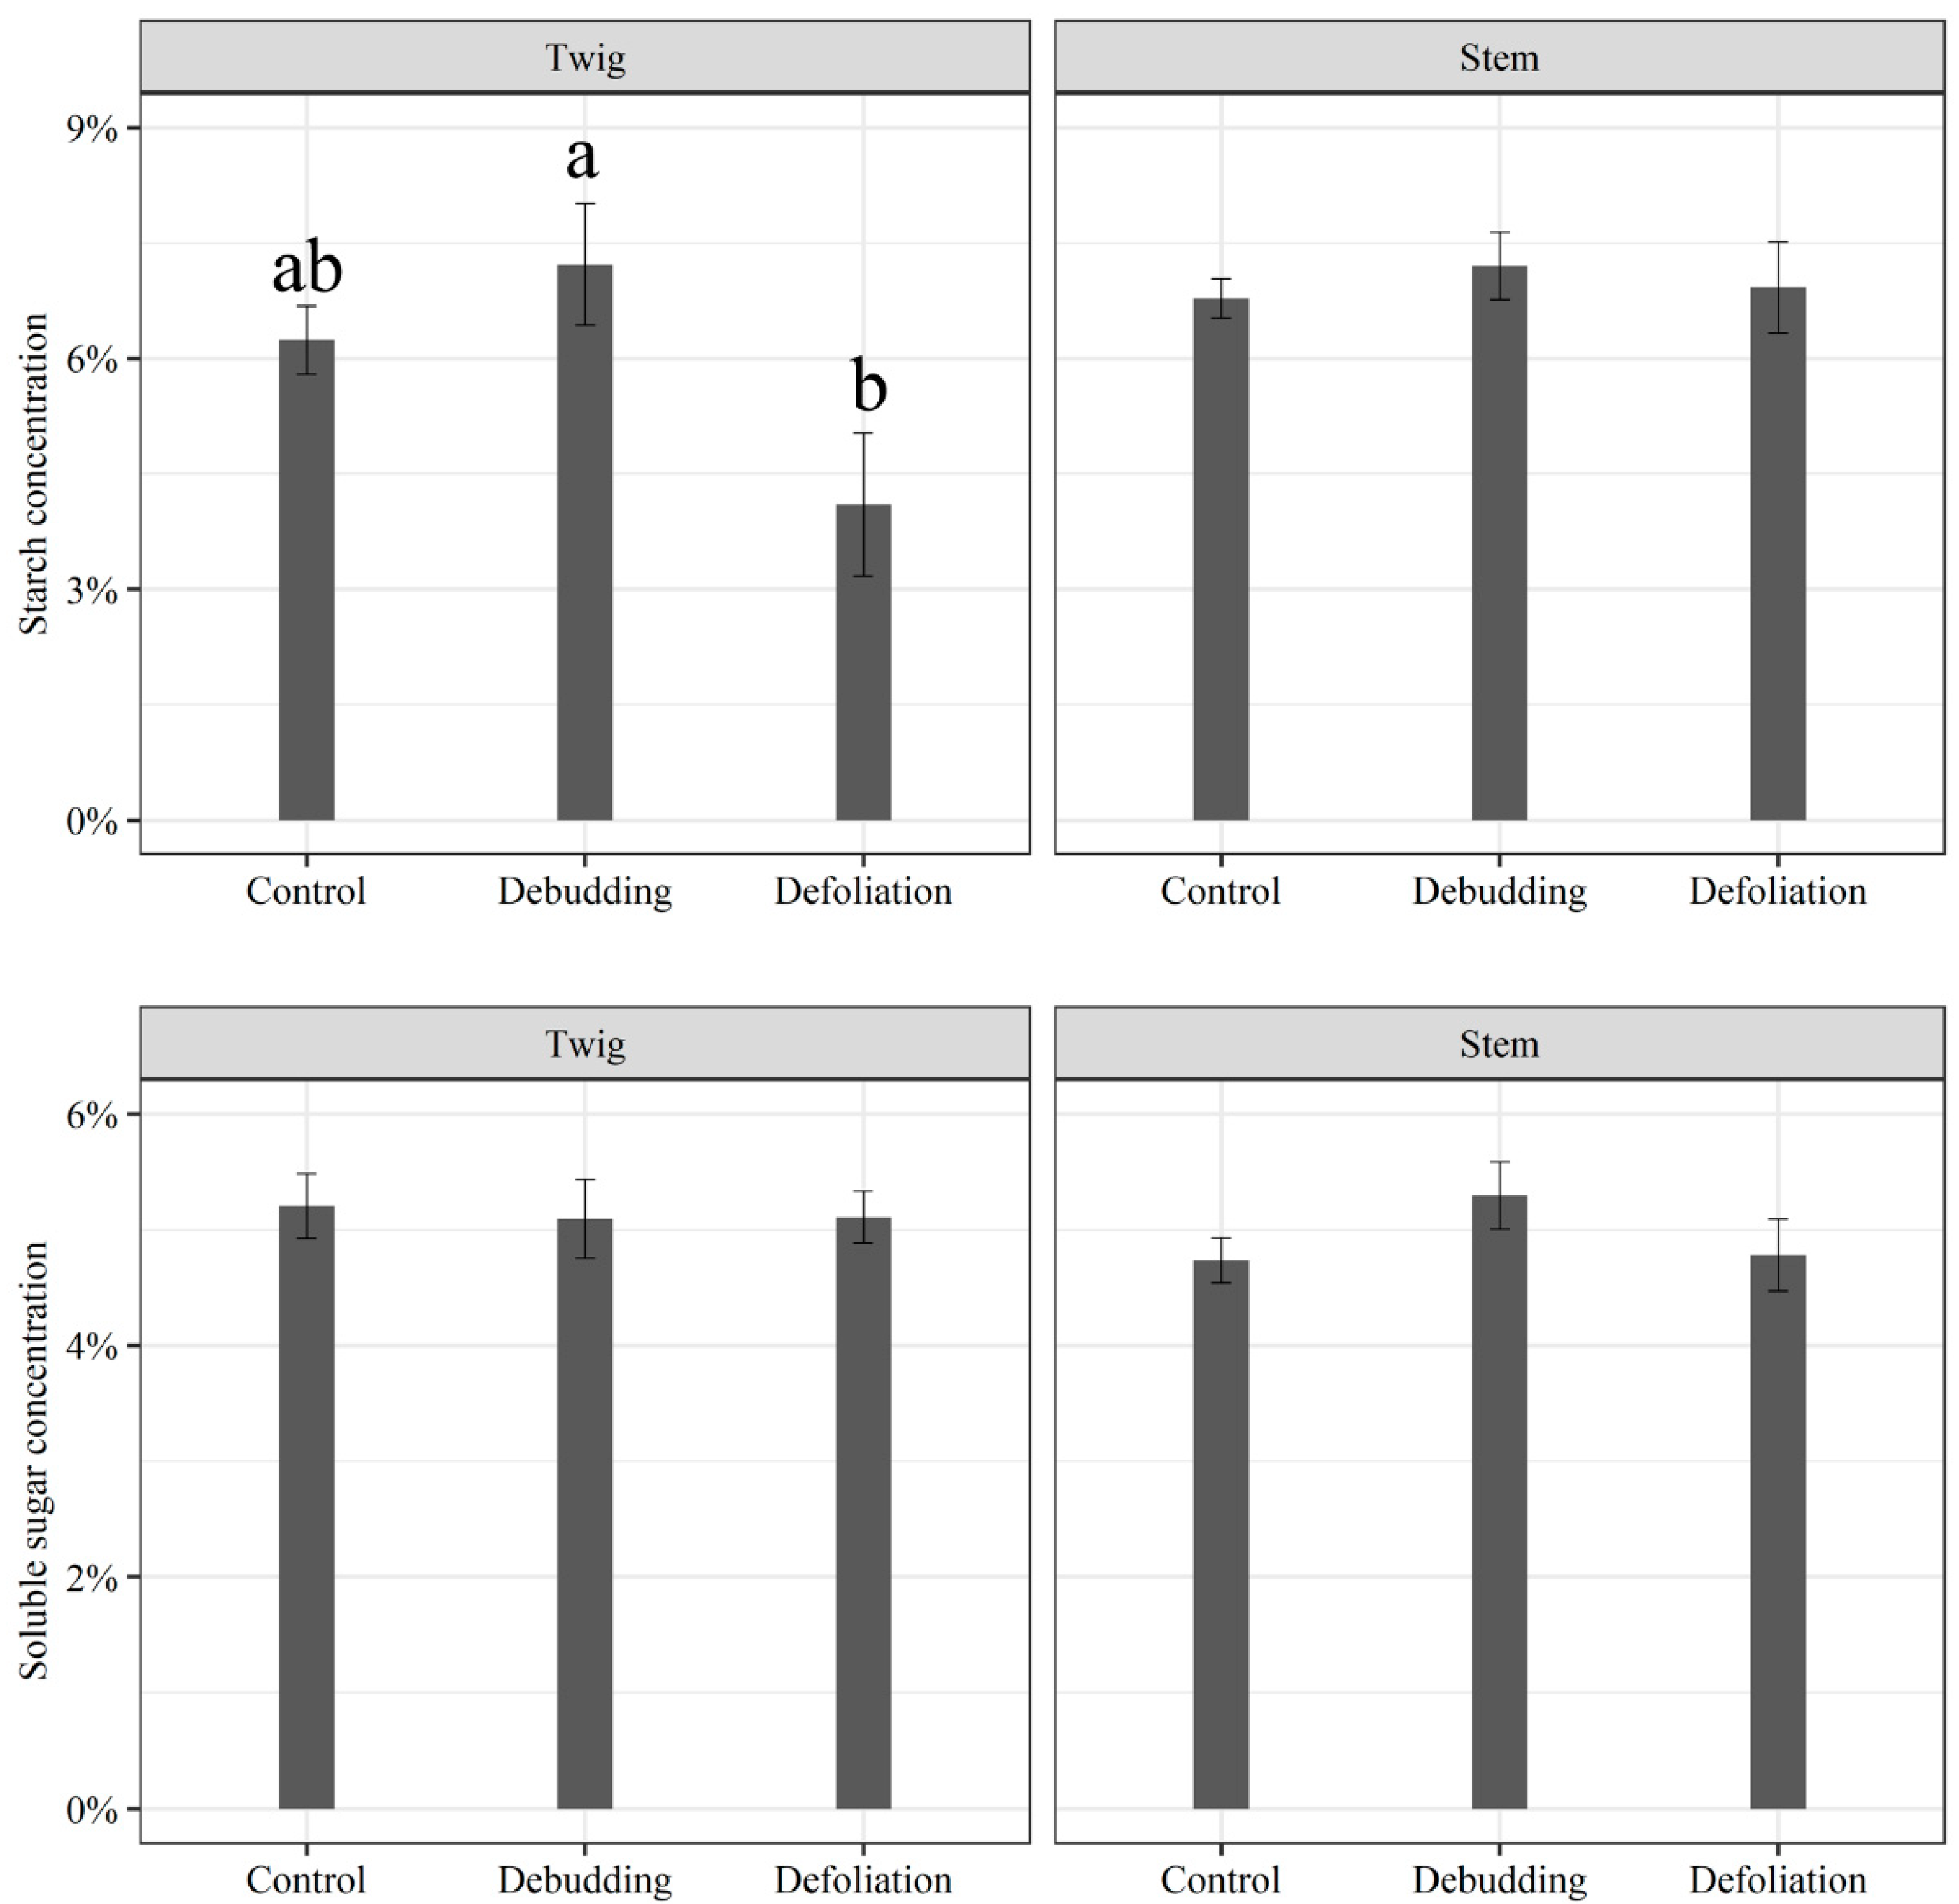
3.2. Responses of Growth and NSC Concentration of Seedlings to Different Treatments

There were no significant differences in seedling growth indicators (i.e., the current-year shoot length, increment of height, and basal diameter) between the defoliation and debudding treatments and the control (p > 0.05; Figure 4). Neither NSC nor its components (i.e., starch and soluble sugar concentration) in seedling stems differed among the three treatments. While the starch and soluble sugar concentration in twigs of seedlings in the defoliation and debudding groups did not differ from that in the control group, the sum of these components (NSC concentration) in twigs in the defoliation treatment was significantly lower than that in the control and debudding groups (p < 0.05; Figure 5).

4. Discussion

The scientific literature that assesses NSC trends in non-treeline trees towards their upper limit so far provides little evidence to reconcile the contrasting carbon limitation hypothesis for the upper limit of evergreen broadleaved tree species. In this study, NSC in the tree tissues of Cyclobalanopsis gracilis showed a marginal trend along a temperature gradient towards their upper limit. This is not supportive of the carbon source limitation hypothesis, which instead should show a decreasing trend (Figure 1a). Our results are consistent with NSC studies in many treeline-forming species on other continents, including evergreen broadleaved trees (Nothofagus betuloides, Polylepis tarapacana, and Erica trimera) [8,9,10]. The photosynthetic capacities (i.e., carbon source) and growth rates (i.e., carbon sink) can be decreased with increasing elevations or decreasing temperature [10,34], along with different sensitivity to low temperature (i.e., photosynthetic capacities are less sensitive to low temperature than growth rates) [1]. Therefore, no obvious change or increasing trend in NSC concentrations with decreasing temperature suggests that the carbon supply and carbon demand for tree growth close to the species’ upper limit are all decreasing and still balanced.
Defoliation and debudding treatments are an approach to carbon source-sink manipulation experiments since defoliation decreases carbon supply and debudding increases carbon supply for the remaining meristems [16,35]. The debudding and defoliation experiments showed no significant effect on growth, while defoliation decreased NSC concentration in twigs (Figure 4 and Figure 5). The effect of defoliation (at 50% intensity) significantly decreased the NSC concentrations in twigs by ca. 11% to 9%, indicating a lower carbon supply in defoliated seedlings. However, the growth of defoliated seedlings did not significantly change. Both lines of evidence suggest that the growth of seedlings close to their species’ upper limit was not affected by a limited carbon supply. Our results are consistent with the carbon sink limitation hypothesis (see details in the legend of Figure 1), except that the debudding treatments did not significantly increase NSC concentrations as expected. There are two explanations that may have caused this exception. First, seedlings at these elevations have a limited number of buds. Therefore, the debudding treatment may only have decreased carbon demand to a limited extent. Another possible explanation for this is that debudding reduces the growth of new leaves. This could lead to a reduction in total leaf area and biomass, and finally to a reduction in photosynthates [16,36]. Even though some previous studies showed that severely pruned trees had larger crowns than the control group after a long-time recovery (e.g., 4 years) [37], this showed a potential capacity to recover the crown if the recovery time was long enough. The recovery time was only 1 year in the present study, which might result in an incomplete crown recovery.
Using NSC as a sole indicator of carbon balance has been criticized since NSC storage may not be purely passive [13,14,38]. Leaves and young branches are major locations of active storage [39,40,41,42], indicating that constant carbon storage levels or minor changes in carbon storage in these organs may occur in carbon-limited trees. Further investigations, including the NSC of trunks and large branches, can provide additional evidence. Furthermore, regardless of the degree of growth-storage tradeoffs, NSC would still theoretically decrease if the negative C balance persists long-term, since plants should at least renew their tissues every year or so to maintain. Finally, the conclusions from the experiment of defoliation and debudding are not affected by whether carbon storage is active or passive, since the theoretical responses are all inferred based on the assumed limiting mechanisms (Figure 1b). Therefore, the consistent results produced by the two methods support our conclusion that carbon sink limitation dominates the main limitation processes.
Low winter temperatures are the main factor that correlates with the leading edges of evergreen broadleaved forests in humid eastern Asia [18,19,20,21]. The common physiological explanations of the formation of the upper limit to date have therefore generally related to the effect of low winter temperatures on the leaf, including decreases in photosynthetic capacity or winter cold-induced photoinhibition [43,44] and freezing damage [45,46,47]. While the net photosynthetic rate of evergreen broad-leaved woody plants in winter may be down-regulated [34,48,49], the carbon balance at the whole-tree level would still be positive. This is supported by previous research into the seasonal dynamics of NSC in an evergreen oak (Quercus aquifolioides), which showed that the NSC concentrations in leaves, branches, stem wood, and roots tended to be higher during winter than during summer [50]. Therefore, cold-induced decreases in photosynthetic capacity are unlikely to be a significant factor limiting the growth of trees at the upper elevational limits. While freezing damage induced by low winter temperatures may exert a limiting constraint on tree growth, the effect of freezing is less important for evergreen tree species. A recent study on another evergreen oak (Q. pannosa) in the south-eastern Himalaya showed that the extremely low air temperature at the crown during winter over the past 65 years didn’t exert any risk for this species at the upper elevational limit, while the extremely low air temperature in the early part of the growing season was likely to play a critical role [51]. If foliar freezing damage to leaves was dominant in driving the formation of the upper limits, the NSC concentration at the upper elevational limits would be decreased, as repairing or renewing the damaged crown would consume carbon storage and the photosynthesis would be inhibited if a lot of leaves were damaged by freezing. This was consistent with diminished NSC concentrations due to severe winter stress in evergreen woody plants [52]. However, this is not supported by the constant NSC concentration with increasing elevation observed in our study. Therefore, we conclude that freezing damage may not be a critical driver of the formation of upper limits for evergreen broadleaved tree taxa. It is more reasonable that low winter temperatures limit the growth of evergreen broadleaved trees grown at the upper limits via carbon sink limitation.
To date, the mechanisms that drive winter cold-induced carbon sink limitation remain poorly understood. Previous studies showed that temperatures from late winter to early spring affect the physiological processes that are involved in the initiation of cambial cell division and xylem differentiation in trees [53]. A recent study also showed that vessel and parenchymal fractions were more strongly associated with CMT than mean annual temperature [54]. These findings suggested that low winter temperatures could indeed influence xylem development. More physiological studies of trees at their upper limits are still needed to reveal the detailed mechanisms underlying the carbon sink limitation hypothesis.

5. Conclusions

Our study combined the observation of NSC trends along a temperature gradient of C. gracilis with a defoliation/debudding experiment on carbon supply and demand to assess the carbon source/sink limitation of this evergreen broadleaved tree species at its upper limit. We found constant NSC concentrations in C. gracilis along the gradient. While defoliation decreased NSC in twigs, neither defoliation nor debudding affected growth. These patterns are consistent with the carbon sink limitation hypothesis, which suggests that temperature directly constrains growth at the upper limit of this subtropical evergreen broadleaved species. To date, while the physiological mechanisms behind the treelines have been well understood, the upper range limits of tree taxa that do not reach the treeline are largely unexplored and unexplained. Our study provides evidence of carbon sink limitation underlying the formation of the upper limit of an evergreen oak, which does not reach the treeline.
Elucidating the physiological mechanisms underlying the low-temperature range limits of tree species will help to predict the trees’ distributions in response to future global climate change. Considering some species behave more conservatively in harsh environmental conditions [52] and the sample size is low in this study, more studies with expanded sample sizes should be conducted on other evergreen broadleaved tree species growing at their upper limit in order to confirm the carbon sink limitation hypothesis and reveal the detailed mechanisms.

Supplementary Materials

The following supporting information can be downloaded at: https://www.mdpi.com/article/10.3390/f14030597/s1, Table S1: Initial design of the defoliation and debudding experiment with balanced sample size; Table S2: The effects of potential driving factors (i.e., the height and basal diameter before treatments imposed, elevational gradients, and canopy cover above them) on the growth of the seedlings; Table S3: The effects of potential driving factors (i.e., the height and basal diameter before treatments imposed, elevational gradients, and canopy cover above seedling) on the NSC concentration of the seedlings; Table S4: The mean concentration of NSC and its compositions of branches and trunks in each site with different coldest month mean temperature (CMT).

Author Contributions

Conceptualization, X.Z. and K.S.; formal analysis, X.Z.; investigation, X.Z.; methodology, K.S.; interpretation, X.Z., K.S. and E.C.; writing—original draft, X.Z.; writing—review & editing, E.C. and K.S. All authors have read and agreed to the published version of the manuscript.

Funding

This study was funded by the National Natural Science Foundation of China [31500355, 31670438].

Data Availability Statement

The data presented in this study are available on request from the corresponding author.

Acknowledgments

We thank Aicui Tu, Lingling Jin, Jiahui Lu, and Zuhua Song for their invaluable help with fieldwork in the Dabie mountains. We also express our gratitude to Lingling Jin and Jiahui Lu for their help in measuring NSC concentrations in the laboratory.

Conflicts of Interest

The authors declare no conflict of interest.

References

  1. Körner, C. Alpine Treelines: Functional Ecology of the Global High Elevation Tree Limits; Springer Science & Business Media: Basel, Switzerland, 2012. [Google Scholar]
  2. Stevens, G.C.; Fox, J.F. The Causes of Treeline. Annu. Rev. Ecol. Evol. Syst. 1991, 22, 177–191. [Google Scholar] [CrossRef]
  3. Wardle, P. Causes of alpine timberline: A review of the hypothesis. In Forest Development in Cold Climates; Plenum Press: New York, NY, USA, 1993; pp. 89–103. [Google Scholar]
  4. Körner, C. A Re-Assessment of High Elevation Treeline Positions and Their Explanation. Oecologia 1998, 115, 445–459. [Google Scholar] [CrossRef] [PubMed] [Green Version]
  5. Fajardo, A.; Piper, F.I.; Pfund, L.; Körner, C.; Hoch, G. Variation of mobile carbon reserves in trees at the alpine treeline ecotone is under environmental control. New Phytol. 2012, 195, 794–802. [Google Scholar] [CrossRef]
  6. Hoch, G.; Popp, M.; Körner, C. Altitudinal increase of mobile carbon pools in Pinus cembra suggests sink limitation of growth at the Swiss treeline. Oikos 2002, 98, 361–374. [Google Scholar] [CrossRef]
  7. Shi, P.; Körner, C.; Hoch, G. A test of the growth-limitation theory for alpine tree line formation in evergreen and deciduous taxa of the eastern Himalayas. Funct. Ecol. 2008, 22, 213–220. [Google Scholar] [CrossRef]
  8. Hoch, G.; Körner, C. Growth, demography and carbon relations of Polylepis trees at the world’s highest treeline. Funct. Ecol. 2005, 19, 941–951. [Google Scholar] [CrossRef]
  9. Hoch, G.; Körner, C. Global patterns of mobile carbon stores in trees at the high-elevation tree line. Global Ecol. Biogeogr. 2012, 21, 861–871. [Google Scholar] [CrossRef]
  10. Fajardo, A.; Piper, F.I.; Hoch, G. Similar variation in carbon storage between deciduous and evergreen treeline species across elevational gradients. Ann. Bot.-Lond. 2013, 112, 623–631. [Google Scholar] [CrossRef] [Green Version]
  11. Körner, C.; Basler, D.; Hoch, G.; Kollas, C.; Lenz, A.; Randin, C.F.; Vitasse, Y.; Zimmermann, N.E. Where, why and how? Explaining the low-temperature range limits of temperate tree species. J. Ecol. 2016, 104, 1076–1088. [Google Scholar] [CrossRef]
  12. Lenz, A.; Vitasse, Y.; Hoch, G.; Körner, C. Growth and carbon relations of temperate deciduous tree species at their upper elevation range limit. J. Ecol. 2014, 102, 1537–1548. [Google Scholar] [CrossRef]
  13. Wiley, E.; Helliker, B. A re-evaluation of carbon storage in trees lends greater support for carbon limitation to growth. New Phytol. 2012, 195, 285–289. [Google Scholar] [CrossRef]
  14. Sala, A.; Woodruff, D.R.; Meinzer, F.C. Carbon dynamics in trees: Feast or famine? Tree Physiol. 2012, 32, 764–775. [Google Scholar] [CrossRef] [PubMed] [Green Version]
  15. Handa, I.T.; Körner, C.; Hättenschwiler, S. A test of the treeline carbon limitation hypothesis by in situ CO2 enrichment and defoliation. Ecology 2005, 86, 1288–1300. [Google Scholar] [CrossRef]
  16. Susiluoto, S.; Hilasvuori, E.; Berninger, F. Testing the growth limitation hypothesis for subarctic Scots pine. J. Ecol. 2010, 98, 1186–1195. [Google Scholar] [CrossRef]
  17. Weber, R.; Gessler, A.; Hoch, G. High carbon storage in carbon-limited trees. New Phytol. 2019, 222, 171–182. [Google Scholar] [CrossRef] [PubMed] [Green Version]
  18. Fang, J.; Ohsawa, M.; Kira, T. Vertical vegetation zones along 30° N latitude in humid East Asia. Vegetatio 1996, 126, 135–149. [Google Scholar] [CrossRef]
  19. Ishizuka, K. The distribution of the evergreen broad-leaved trees in the Tohoku district, Japan and the Korean peninsula. Ecol. Rev. 1947, 10, 98–100. [Google Scholar]
  20. Ohsawa, M. An interpretation of latitudinal patterns of forest limits in south and east Asian mountains. J. Ecol. 1990, 78, 326–339. [Google Scholar] [CrossRef]
  21. Yim, Y.; Kira, T. Distribution of forest vegetation and climate in the Korean peninsula.: I. Distribution of some indices of thermal climate. Jpn. J. Ecol. 1975, 25, 77–88. [Google Scholar] [CrossRef]
  22. Song, K.; Da, L. Evergreen-deciduous broad-leaved forest ecotone in eastern China: Retrospect and new perspectives. In Vegetation Structure and Function at Multiple Spatial, Temporal and Conceptual Scales; Springer: Cham, Switzerland, 2016; pp. 129–147. [Google Scholar]
  23. Song, K.; Kohyama, T.S.; Da, L. Transition patterns across an evergreen—Deciduous broad-leaved forest ecotone: The effect of topographies. J. Veg. Sci. 2014, 25, 1257–1266. [Google Scholar] [CrossRef]
  24. Zhang, X.J.; Song, K.; Pan, Y.J.; Gao, Z.W.; Pu, F.G.; Lu, J.H.; Shang, K.K.; Da, L.J.; Cieraad, E. Responses of leaf traits to low temperature in an evergreen oak at its upper limit. Ecol. Res. 2020, 35, 900–911. [Google Scholar] [CrossRef]
  25. Fang, J.; Wang, Z.; Tang, Z. Atlas of Woody Plants in China: Distribution and Climate; Springer Science & Business Media: Berlin/Heidelberg, Germany, 2011. [Google Scholar]
  26. Shen, X. The study on the vegetation of the Tiantangzhai Mountains of the Dabie Mountains, Anhui Province. J. Wuhan Bot. Res. 1989, 7, 131–139. (In Chinese) [Google Scholar]
  27. Deng, M.; Wei, H.; Yao, G. Evergreen plants and evergreen broad-leaved forests in Huoshan and Jinzhai counties of the Dabie Mountaion region. Acta Phytoecol. Geobot. Sin. 1985, 9, 142–149. (In Chinese) [Google Scholar]
  28. Buysse, J.; Merckx, R. An Improved Colorimetric Method to Quantify Sugar Content of Plant Tissue. J. Exp. Bot. 1993, 44, 1627–1629. [Google Scholar] [CrossRef]
  29. Tichý, L. Field test of canopy cover estimation by hemispherical photographs taken with a smartphone. J. Veg. Sci. 2016, 27, 427–435. [Google Scholar] [CrossRef]
  30. Da, L.; Kang, M.; Song, K.; Shang, K.; Yang, Y.; Xia, A.; Qi, Y. Altitudinal zonation of human-disturbed vegetation on Mt. Tianmu, eastern China. Ecol. Res. 2009, 24, 1287–1299. [Google Scholar] [CrossRef]
  31. Sala, A.; Hoch, G. Height-related growth declines in ponderosa pine are not due to carbon limitation. Plant Cell Environ. 2009, 32, 22–30. [Google Scholar] [CrossRef] [PubMed]
  32. Lacointe, A.; Deleens, E.; Ameglio, T.; Saint-Joanis, B.; Lelarge, C.; Vandame, M.; Song, G.C.; Daudet, F.A. Testing the branch autonomy theory: A 13C/14C double-labelling experiment on differentially shaded branches. Plant Cell Environ. 2004, 27, 1159–1168. [Google Scholar] [CrossRef]
  33. O’Brien, M.J.; Leuzinger, S.; Philipson, C.D.; Tay, J.; Hector, A. Drought survival of tropical tree seedlings enhanced by non-structural carbohydrate levels. Nat. Clim. Chang. 2014, 4, 710–714. [Google Scholar] [CrossRef]
  34. Walter, L. Temperature stress and survival ability of Mediterranean sclerophyllous plants. G. Bot. Ital. 2000, 134, 279–295. [Google Scholar] [CrossRef]
  35. Li, H.; Hoch, G.; Körner, C. Source/sink removal affects mobile carbohydrates in Pinus cembra at the Swiss treeline. Trees 2002, 16, 331–337. [Google Scholar] [CrossRef] [Green Version]
  36. Baraza, E.; Zamora, R.; Hódar, J.A. Species-specific responses of tree saplings to herbivory in contrasting light environments: An experimental approach. Écoscience 2015, 17, 156–165. [Google Scholar] [CrossRef]
  37. Suchocka, M.; Swoczyna, T.; Kosno-Jończy, J.; Kalaji, H.M. Impact of heavy pruning on development and photosynthesis of Tilia cordata Mill. trees. PLoS ONE 2021, 16, e256465. [Google Scholar] [CrossRef] [PubMed]
  38. Palacio, S.; Hoch, G.; Sala, A.; Körner, C.; Millard, P. Does carbon storage limit tree growth? New Phytol. 2014, 201, 1096–1100. [Google Scholar] [CrossRef] [Green Version]
  39. Wiley, E.; Huepenbecker, S.; Casper, B.B.; Helliker, B.R. The effects of defoliation on carbon allocation: Can carbon limitation reduce growth in favour of storage? Tree Physiol. 2013, 33, 1216–1228. [Google Scholar] [CrossRef] [Green Version]
  40. Hartmann, H.; McDowell, N.G.; Trumbore, S. Allocation to carbon storage pools in Norway spruce saplings under drought and low CO2. Tree Physiol. 2015, 35, 243–252. [Google Scholar] [CrossRef]
  41. Huang, J.; Hammerbacher, A.; Weinhold, A.; Reichelt, M.; Gleixner, G.; Behrendt, T.; Dam, N.M.; Sala, A.; Gershenzon, J.; Trumbore, S.; et al. Eyes on the future—Evidence for trade-offs between growth, storage and defense in Norway spruce. New Phytol. 2019, 222, 144–158. [Google Scholar] [CrossRef]
  42. Saffell, B.J.; Meinzer, F.C.; Woodruff, D.R.; Shaw, D.C.; Voelker, S.L.; Lachenbruch, B.; Falk, K. Seasonal carbohydrate dynamics and growth in Douglas-fir trees experiencing chronic, fungal-mediated reduction in functional leaf area. Tree Physiol. 2014, 34, 218–228. [Google Scholar] [CrossRef]
  43. Ball, M.C.; Hodges, V.S.; Laughlin, G.P. Cold-induced photoinhibition limits regeneration of snow gum at tree-line. Funct. Ecol. 1991, 5, 663–668. [Google Scholar] [CrossRef]
  44. Richardson, S.J.; Bonner, K.I.; Bickford, C.P. Cold tolerance of photosynthesis as a determinant of tree species regeneration patterns in an evergreen temperate forest. Plant Ecol. 2013, 214, 787–798. [Google Scholar] [CrossRef]
  45. Sakai, A. Freezing resistance of broad-leaved evergreen trees in the warm-temperate zone. Low Temp. Sci. Ser. B Biol. Sci. 1981, 38, 1–14. [Google Scholar]
  46. Sakai, A. Freezing tolerance of evergreen and deciduous broad-leaved trees in Japan with reference to tree regions. Low Temp. Sci. Ser. B Biol. Sci. 1979, 36, 1–19. [Google Scholar]
  47. Sakai, A. Freezing resistance of evergreen and deciduous broad-leaf trees in Japan with special reference to their distributions. Jpn. J. Ecol. (Jpn.) 1975, 25, 101–111. [Google Scholar]
  48. Wachendorf, M.; Schloz, M.; Küppers, M.; Güney, A.; Veste, M. Wintertime photosynthesis and spring recovery of Ilex aquifolium L. Ifor.—Biogeosci. For. 2019, 12, 389–396. [Google Scholar] [CrossRef] [Green Version]
  49. Zhang, Y.; Cao, K.; Goldstein, G. Winter photosynthesis of evergreen broadleaf trees from a montane cloud forest in subtropical China. In Photosynthesis Research for Food, Fuel and the Future; Springer: Berlin/Heidelberg, Germany, 2013; pp. 812–817. [Google Scholar]
  50. Zhu, W.; Cao, M.; Wang, S.; Xiao, W.; Li, M. Seasonal dynamics of mobile carbon supply in Quercus aquifolioides at the upper elevational limit. PLoS ONE 2012, 7, e34213. [Google Scholar] [CrossRef] [PubMed] [Green Version]
  51. Yang, Y.; Sun, H.; Körner, C. Explaining the exceptional 4,270 m high elevation limit of an evergreen oak in the south-eastern Himalaya. Tree Physiol. 2020, 40, 1327–1342. [Google Scholar] [CrossRef] [PubMed]
  52. Oliveira, G.; Peñuelas, J. Effects of winter cold stress on photosynthesis and photochemical efficiency of PSII of the Mediterranean Cistus albidus L. and Quercus ilex L. Plant Ecol. 2005, 175, 179–191. [Google Scholar] [CrossRef]
  53. Begum, S.; Nakaba, S.; Yamagishi, Y.; Oribe, Y.; Funada, R. Regulation of cambial activity in relation to environmental conditions: Understanding the role of temperature in wood formation of trees. Physiol. Plant. 2013, 147, 46–54. [Google Scholar] [CrossRef]
  54. Zheng, J.; Zhao, X.; Morris, H.; Jansen, S. Phylogeny Best Explains Latitudinal Patterns of Xylem Tissue Fractions for Woody Angiosperm Species across China. Front. Plant Sci. 2019, 10, 556. [Google Scholar] [CrossRef]
Figure 1. The conceptual framework of this research. (a) Possible trends of non-structural carbohydrates (NSC) concentrations along temperature gradients predicted by carbon sink and carbon source limitation hypotheses [10]. (b) Expected responses of growth and NSC concentration to defoliation and debudding in woody plants at their upper limits [16]. In the case of carbon source limitation, the growth rate of defoliated trees is expected to be lower than the control because defoliation decreases carbon supply, while the growth rate of debudded trees is expected to be higher than the control because debudding would increase the carbon supply to the remaining meristems. In this case, the NSC concentration of debudded individuals is expected to remain constant because the acquired carbon will still, to the same extent, be used for growth, while the NSC concentration of defoliated trees would be uncertain (e.g., either decrease or remain unchanged) because the NSC concentration during periods of low carbon supply would decrease in the early stages and then rebuild and recover to the normal level at the expense of structural growth [17]. If trees are carbon sink-limited, the growth rates between defoliated, debudded, and control are expected to be the same, as the growth should be directly limited by low temperatures. In this case, the NSC concentration of defoliated trees would decrease and that of debudded trees would increase compared to the control.
Forests 14 00597 g001
Figure 2. Locations of the study area and two sample sites of mountain ranges. The two sample sites (Tiantangzhai and Mazongling) stretch through the core area of the nature reserve.
Forests 14 00597 g002
Figure 3. Variations in NSC concentration, soluble sugar, and starch in twigs, old branches, and trunks of Cyclobalanopsis gracilis adults in autumn along the temperature gradients. The results are shown as the mean ± standard error. The mean value of each point is the average of 3–5 replications (5 replications for the twig and old branch; 3 replications for the stem). All relationships were non-significant (p > 0.05).
Forests 14 00597 g003
Figure 4. Growth responses of seedlings to control, defoliation, and debudding treatments in one year. The results are shown as the mean ± standard error. The mean values of each treatment are the average of 5–10 replications (5 replications for defoliation, 8 replications for debudding, and 10 replications for control).
Forests 14 00597 g004
Figure 5. Responses of concentrations of NSC, soluble sugar, and starch in stems and twigs of seedlings to defoliation and debudding treatments in one year. The results are shown as the mean ± standard error. The mean values of each treatment are the average of 5–10 replications (5 replications for defoliation, 8 replications for debudding, and 10 replications for control). Significant differences are denoted with different lowercase letters.
Forests 14 00597 g005aForests 14 00597 g005b
Table 1. Three sampling campaigns between October 2016 and October 2018. The branch samples included leading twigs and old branches. The color grey denotes the elevation where sample collections were taken along the two elevational transects in Tiantangzhai (TTZ) and Mazongling (MZL).
Sample
Campaign
DateSample
Organs
Transects/Elevation (m a.s.l.)
TTZ/
740
MZL/
837
TTZ/
922
MZL/
960
TTZ/
1016
TTZ/
1057
TTZ/
1096
MZL/
1120
TTZ/
1148
TTZ/
1200
12016/10branch
22017/10branch
32018/10trunk
Disclaimer/Publisher’s Note: The statements, opinions and data contained in all publications are solely those of the individual author(s) and contributor(s) and not of MDPI and/or the editor(s). MDPI and/or the editor(s) disclaim responsibility for any injury to people or property resulting from any ideas, methods, instructions or products referred to in the content.

