Abstract
Climate change is altering the abundance and distributions of natural communities in mountainous ecosystems, but the variations of soil microbial communities and their driving factors along elevation gradients at high altitudinal mid-subtropical zones have received limited attention. Such information is needed for a comprehensive understanding of the ecosystem’s response to intensifying climate changes. In this study, using Illumina sequencing, we investigated the shift in soil microbial diversity and community composition at eight evergreen broadleaf forest sites, which ranged from a low of 550 to a high of 1038 m above sea level (m a.s.l.) on Wuyi Mountain in Southeast China. Significant (p < 0.05) differences were observed only in the community structure of bacteria and fungi between the low and high elevation levels of forests, but not in their alpha-diversity indices. Soil bacterial diversity was significantly correlated with plant Shannon index. Likewise, plant richness and diversity modified soil bacterial community structures along the two elevations and were the best predictors. Soil pH was the main edaphic factor driving the fungal diversity across elevations, whereas inconsistency in the fungal trophic mode did not allow the identification of a determinant factor for soil fungal community structure. The variations of the predominant fungal trophic guilds, such as the symbiotrophs and pathotrophs, along elevation gradients were due to the plant richness and diversity prevailing at the low and high elevation levels of forest sites. The findings of this study reveal the soil microbial community dynamics and the local regulators across elevations on Wuyi mountain.
1. Introduction
Climate change is altering the abundance and distribution of natural communities, and many montane plant species have already started to shift their geographic range accordingly [1,2]. In various mountainous ecosystems, the upward migration of treeline to higher elevations is gradually occurring [3], which will in turn profoundly affect the stability of soil-vegetation ecosystems. The satellite data in the subtropical regions show that the warming of these regions due to climate change has expedited especially within the past 25 years [4]. This implicates a significant impact on subtropical forest ecosystems, which are biodiversity hotspots of mountainous subtropical regions [4]. Therefore, a comprehensive understanding of the spatiotemporal dynamics of biological communities across elevations at high altitudes in mid-subtropical zones is essential for contemplating and forecasting the influence of climatic change.
As one of the most active and critical components in the soil-vegetation ecosystem, soil microorganisms are important regulators of ecosystem functionality and stability [5]. They operate as decomposers, mutualists, or pathogens and regulate various ecosystem processes of significant importance, such as the transformation and turnover of soil organic matter (SOM) and the cycling of nutrients in the soil matrix [5,6,7]. Despite their close relationship with plants and animals, soil microbes are more sensitive toward environmental changes [8]. Any changes in soil microbial community composition reflects early changes in soil environmental quality and the differences in ecological functionality of different ecosystems [9]. Elucidating the responses of soil microbes across elevation gradients at high altitudinal mid-subtropical zones might better help to predict the consequences of climate change and help model new mitigation strategies to protect these ecologically important hotspots.
Various biotic (e.g., plant diversity) and abiotic (e.g., soil properties) ecological factors were reported to modify the soil microbial community structure [10,11]. Along elevational gradients, the forces shaping macrobial and microbial communities differ [5,12,13,14]. Based on the differences in adaptability and resource requirements, the response of soil bacteria and fungi to the varying soil properties is dissimilar. Bacteria were more readily influenced by the alterations in soil pH as they have a narrower pH tolerance range compared to fungi [15]. Similarly, soil pH was indicated as the key predictor for soil bacterial alpha-diversity and community composition [12,15]. On the other hand, fungi exhibit higher carbon (C) and nitrogen (N) demands [16,17]. Therefore, the shifts in fungal communities and composition were more related to the SOM and nutrient status of the elevation gradient soils [18]. This is because most of the fungi (saprotrophic fungi) derive higher proportions of their energy through the decomposition of SOM [19] than bacteria which have a considerably low nutritional requirement. Nevertheless, most of the previous studies indicated shifts in soil properties (soil organic carbon, total phosphorous, and pH) as key regulators of elevation-related patterns of diversity in soil microbial communities [13,18,20].
However, a large proportion of the microbial communities (such as the mycorrhizal fungi) are plant symbionts in the forest ecosystems [14], meaning that vegetation exerts a strong control and act as a local determinant of soil microbial community composition [21]. The carbon input through plants depend on the type of litter or root exudates of the vegetation [22,23]. Theoretically, a higher plant diversity corresponds to an increased diversity in food resources and niche availability, thus integrating diverse microbial communities in the soil matrix [24]. However, inconsistent relationships (positive, negative, or neutral) between aboveground plant and belowground microbial diversity across different ecosystems have also been reported [24,25,26]. This indicates the complexity in determining the factors driving the characteristics of soil microbial communities and the necessity to investigate the inter-relationship among soil properties, plant diversity, and soil microbial community composition across elevation gradients.
Moreover, studies of elevational patterns of soil microbial diversity were mostly conducted in temperate regions [13,20,27,28] or plateau sections (e.g., Qinghai-Tibet Plateau) [18,29,30,31,32]. Comparatively, less attention has been paid toward microbial diversity in high altitudinal mid-subtropical forests especially in the Wuyi Mountain in Southeast China. Wuyi Mountain harbors the largest and highly preserved vertically distributed evergreen broadleaf forest ecosystem [33]. This region thereby offers a unique location to study the variations in soil microbial diversities at its elevation gradients. Most of the previous studies in relation to Wuyi Mountain focused either on the changes in soil microbial biomass carbon, nitrogen, and phosphorus along elevation gradients [34,35], or studied the seasonal variations in microbial diversity [36] along with changes in vegetation composition [37], whereas investigations considering the elevational patterns of soil microbial diversity [38,39] at Wuyi Mountain are merely adequate. Nevertheless, it is essential to investigate such diversity patterns and the underlying regulators of soil microbial community composition at high altitudinal mid-subtropical regions which are tremendously influenced by the ongoing climate change. Furthermore, the earlier studies determined soil microbial diversity based on phospholipid fatty acids (PLFAs) profiling, which limits the in-depth taxonomic classification of soil microbial communities as this is usually achieved by using next generation sequencing [40] methodology.
In the region of Wuyi Mountain, using Illumina sequencing, we conducted a study to explore the dynamics of soil microbial communities across eight evergreen broadleaf forest sites spanning across low (550 m a.s.l.) to high (1038 m a.s.l.) elevation levels on the Wuyi Mountain, and to investigate their regulating factors. With a strategy of space-for-time substitution, we randomly selected four forests at high elevations to represent the probable forest situation after future upward migration, and four forests at low elevations to represent the current situation and to access and forecast the possible influence of climatic warming on soil microbial community in mid-subtropical regions. We hypothesized that: (1) the different diversity and community structures of soil bacteria and fungi were expected across elevations due to the differentiations (e.g., adaptabilities and resource requirements) between soil bacterial and fungal communities; (2) considering the close above-belowground interactions, plant diversity and soil properties contribute greatly in the formation of soil bacterial and fungal communities across elevations.
2. Materials and Methods
2.1. Study Area
The study area was in Wuyi Mountain National Park of Southeastern China (27°42′38″–27°44′05″ N, 117°44′38″–117°46′26″ E). Located in the mid-subtropical zone, this area is characterized by warm and moist climate, where the mean annual temperature (MAT) ranges between 17 and 19 °C, and the mean annual precipitation (MAP) ranges between 1684 and 1780 mm, with 78%–85% relative humidity and over 100 days of fog annually. The elevation of Wuyi Mountain reaches up to 2158 m above sea level (m a.s.l.).
On Wuyi mountain, eight elevation levels, four of which were considered as low elevations (L1-to-L4 (550–700 m a.s.l.)) and four as high elevations (H1-to-H4 (1020–1038 m a.s.l.)) were chosen, where vegetation comprised evergreen broadleaf secondary forests (Table 1). The soils of these two elevations were classified as Ultisols according to the United States Department of Agriculture Soil Taxonomy Classification, with dark reddish brown color at the surface (layer A: 10–20 cm) and a typical occurrence of desiliconization and aluminization layers at the bottom (layer B). The soil thickness was <50 cm in the plots. The parent material was mainly slope deposits of granite.

Table 1.
General characteristics of forest sites.
2.2. Plant Survey and Soil Sampling
In May 2020, plant survey and soil sampling were carried out in the selected forests. Three plots (20 × 20 m) in each forest were chosen (3 plots × 8 forests; total of 24 plots), with a 50 m distance grid. The species names and abundance of trees were recorded in the 20 × 20 m plot, followed by information of shrubs in four subplots (3 × 3 m) and similarly of herbs in four subplots (1 × 1 m) at four corners of each 20 × 20 m forest plot [41]. The number of plant species and individuals per plot were counted to estimate the diversity of plant species (Table S1).
Subsequently, seven soil cores were taken using sterilized soil corers (Ø8 cm) at the depth of 0–20 cm in each plot, and bulked as one single soil sample per plot for the analysis of soil properties. The bulked soil sample was sieved (>2 mm mesh) and homogenized. Immediately, an aliquot of the freshly sieved and homogenized soil was stored at −20 °C for a microbial analysis, and at 4 °C for soil physiochemical properties analyses.
2.3. Soil Physiochemical Analyses
Soil aliquot was dried at 105 °C for 24 h in an oven for gravimetric soil moisture content (MC) analysis and soil pH was measured from a soil–water mixture (1:2.5, w/v) using the pH meter S400 (Mettler-Toledo Instruments, Shanghai, China). The soil ammonium (NH4+) and nitrate (NO3−) contents were determined by indophenol blue colorimetric and phenol disulfuric acid colorimetric techniques, respectively [42]. The 0.5 M 8.5 pH-adjusted NaHCO3 solution was used to extract and measure the available phosphorous (AP) in soils using molybdenum blue method [43]. The TOC-L analyzer (Shimadzu, Kyoto, Japan) was used to determine the dissolved organic carbon (DOC) content in soils. PerkinElmer 2400II CN-element analyzer (PerkinElmer, Waltham, MA, USA) was used to quantify the soil organic carbon (SOC) contents in the soil samples [44].
2.4. DNA Extraction, Amplification
Genomic DNA for metabarcoding was extracted from 0.2 g of 24 soil samples using a commercial soil DNA isolation kit (Omega Bio-Tek Inc., Norcross, GA, USA) following the instructions of the manufacturer. The extracted e-DNA was stored at −20 °C and used for PCR amplification. The bacterial V4–V5 regions of the 16S rRNA gene was amplified using the primers 515F-907R [45], and fungal ITS1 gene was amplified using specific ITS5F-ITS1R [46] primer set, respectively. Following the PCR reaction mixture and PCR thermal cycling as described in [18], the obtained amplicons were firstly extracted by 2% agarose gels, and purified using a commercial AP-GX-500 DNA gel extraction kit, then quantified on a microplate reader, and was finally sequenced on an Illumina MiSeq platform as [18]. The bacteria and fungi-specific DNA library for Illumina sequencing was prepared with the TruSeq Nano DNA LT Library Prep Kit, generating 300 bp paired-end reads.
2.5. Illumina Sequence Processing
The primer fragment of the sequence was trimmed with Cutadapt (v2.3) [47] and the unassembled sequences were discarded. Then, the sequencing reads were spliced with the fastq_mergepairs module, implemented in Vsearch algorithm (v2.13.4_linux_x86_64) [48], and the quality spliced sequences were filtered using fastq_filter module. The duplicate sequences were removed by the derep_fulllength module. The cluster_size module was used to cluster the de-duplicated sequences at a 98% similarity level, and the uchime_denovo module was used to remove chimeras. The chimeras were further filtered by conducting PERL script (https://github.com/torognes/vsearch/wiki/VSEARCH-pipeline, accessed on 28 January 2022). Finally, the high quality sequences of bacteria and fungi were clustered into operational taxonomic units (OTUs) with 97% similarity through UCLUST and BLAST [49] against the database of SILVA (v132) for bacteria [50] and UNITE (v8.0) for fungi [51], respectively. The corresponding bacterial and fungal sequence projects were deposited in the NCBI Genbank with the accession numbers SRR18688539 to SRR18688562 for soil bacteria and SRR18688636 to SRR18688659 for soil fungi, respectively.
Different trophic modes of soil fungal communities were further assigned in FUNGuild. The confidence scores of “Highly Probable” or “Probable” were selected to analyze the FUNGuild annotations [52]. The fungal OTUs of symbiotroph, saprotroph, and pathotroph were classified from the database on FUNGuild (v1.0) following their taxonomic assignment.
2.6. Statistical Analysis
The normality and homogeneity of the data were checked using Shapiro–Wilk [53] and Levene [54] tests before any statistical analysis. If necessary, data were either log- or square-root-transformed to meet the criteria of normal distribution and homogeneity of variances. The variations in plant diversity, soil properties, soil microbial alpha-diversity indices and the relative abundance of dominant bacteria and fungi (at phylum and genus levels) at the two groups of elevation levels (low vs. high) were tested using independent t-test [55]. The richness (Chao 1) and diversity (Shannon) index values were used to determine soil microbial alpha-diversity. The Pearson’s correlation analysis [56] was employed to study the associations between the soil microbial alpha-diversity and environmental variables as well as the relative abundance of dominant bacterial and fungal taxa. Multivariate linear regression models were conducted to assess the optimal predictors of soil microbial alpha-diversity. The multivariate linear regression models were selected based on the least Akaike’s information criteria (AIC) scores [57].
The differences between microbial community structures at the two elevational groupings (low vs. high) were calculated using the pairwise UniFrac distance matrices in the analysis of similarities (ANOSIM) method [58] and the results were visualized by nonmetric multidimensional scaling (NMDS) ordination plots in the Vegan package [56] of R statistical software. The mantel test [59] of correlation between two matrices of low and high elevations was performed to verify the influences of environmental variables on soil microbial community structures using the Vegan package in R [56]. Canonical correlation analysis (CCA) [60] was conducted to test the influences of plant diversity and soil properties on the community composition of different fungal trophic guilds. All statistical tests were performed using R statistical software version R 4.0.3.
3. Results
3.1. Plant Diversity and Soil Physiochemical Properties at the Low and High Elevation Levels of Forests
A sharp decline was recorded in the richness and diversity of plant species in the studied forests by 29.6 and 8%, respectively (prichness = 0.07, pdiversity = 0.15) (Table 2). Similarly, no significant differences were found in soil physiochemical properties between the low and high elevation forests (p > 0.05) (Table 2). Among these variables, soil pH, the contents of soil nitrate (NO3−), ammonium (NH4+), and dissolved organic carbon (DOC) were slightly higher in the low elevation forests, but with no significant difference (p > 0.05). The contents of soil moisture content (MC), available phosphorous (AP), and soil organic carbon (SOC) were slightly higher in the high-elevation forests, but with no significant difference (p > 0.05) (Table 2).
Table 2.
Cumulative soil physiochemical properties and plant diversity indices at the low and high elevation evergreen broadleaf forests on Wuyi mountain.
3.2. Variations in Soil Microbial Alpha-Diversity along Two Elevations
From the 24 soil samples, a total of 1,376,264 and 1,405,614 high-quality sequences were generated for bacterial and fungal communities. Cleaned reads varied from 41,816 to 78,262 (mean = 57,344) and 39,590 to 64,458 (mean = 58,567) sequences per sample for bacteria and fungi, separately. The read lengths of the 16S rRNA gene and ITS1 gene ranged from 203 to 516 bp (mean = 411 bp) and 140 to 535 bp (mean = 248 bp). The coverage rate of each sample was above 99%, indicating that the sequencing accuracy of bacterial and fungal communities was reliable (Figure S1).
Despite the higher soil bacterial and fungal alpha-diversity indices in the low elevation than in the high elevation forests, the differences were not significant (p > 0.05, Figure 1, Table S2). The bacterial richness (Chao1 index) ranged between 2437.41 and 2381.26 (Figure 1, Table S2), and the bacterial diversity (Shannon index) ranged between 5.61 and 5.39 (Figure 1, Table S2). Pearson’s correlation analysis indicated that the soil bacterial Chao1 index was significantly positively correlated with NO3− (p = 0.042), and the bacterial Shannon index was positively correlated with plant diversity (p = 0.012) (Table 3).
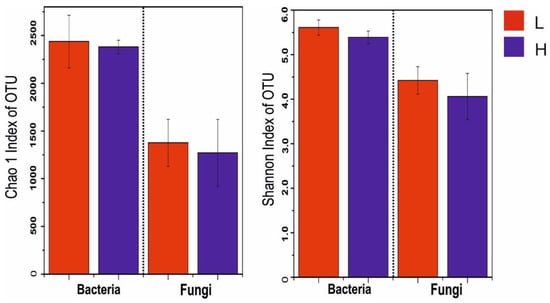
Figure 1.
The OTUs based alpha-diversity (Chao1 (richness) and Shannon (diversity)) indices of soil bacterial and fungal communities at the low (L) and high (H) elevation forests in the study area of Wuyi Mountain.
Table 3.
Pearson’s correlation between microbial alpha-diversity indices and environmental factors of the study area (n = 24).
The ranges of soil fungal Chao1 index and the Shannon diversity index across elevations were 1376.34–1270.14 and 4.42–4.06 (Figure 1, Table S2), respectively. Soil pH (pChao1 = 0.009, pShannon = 0.011) and DOC (pChao1 = 0.013, pShannon = 0.006) were found to be significantly positively correlated with soil fungal Chao1 and Shannon indices (Table 3).
The best AIC-selected linear regression model explained that plant diversity was the optimal indicator to soil bacterial Shannon diversity (Table 4), while soil pH was found to be the best predictor of variability in the Shannon diversity index of the soil fungi (Table 4).
Table 4.
Best AIC-selected linear regression model explaining the microbial alpha-diversity of the study areas (n = 24).
3.3. Variations in Soil Microbial Community Compositions at Low and High Elevation Level Forests
Proteobacteria, acidobacteria, actinobacteria and chloroflexi were the most abundant bacterial phyla (Figure 2, with the mean relative abundance >5%), which together comprised more than 83.8% of the total bacterial sequences (Figure 2, Table S3). Amongst these, the relative abundance of proteobacteria was the highest (with the mean relative abundance >39.5%) (Figure 2, Table S3). While at the genus level, several bacterial genera (norank_Xanthobacteraceae, norank_Subgroup_2, norank_Elsterales, Acidothermus) were abundant (with the mean relative abundance >5%), together accounting for over 34.2% of the total bacterial sequences (Table S4).
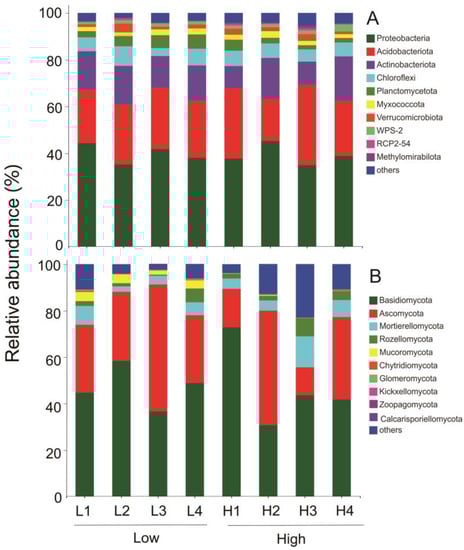
Figure 2.
Relative abundances of top 10 microbial phyla: (A) bacteria and (B) fungi in soils at low and high elevation forests of Wuyi Mountain. L1, L2, L3, and L4 correspond to forests at low elevations and H1, H2, H3, and H4 correspond to forests at high elevation levels, respectively.
Among fungi, Basidiomycota, Ascomycota, and Mortierellomycota phyla were dominant in soils at all elevation levels (Figure 2, with the mean relative abundance >5%). Together, these phyla accounted for more than 89.8% of the total fungal sequences, followed by sequences belonging to Rozellomycota and Mucoromycota phyla (Figure 2, Table S3). Phylum Basidiomycota was the most abundant with more than 47.1% relative abundance (Figure 2, Table S2). At the fungal genus level, Russula, Saitozyma, unclassified_Thelephoraceae, Mortierella, unclassified_Sordariomycetes were abundant (with the mean relative abundance >5%) and they accounted for over 44.7% of the relative abundance in fungal genera (Table S4).
The soil bacterial and fungal community structures were clearly distinguished between those in the low elevation forests and those in the high elevation forests (pbacteria = 0.001, pfungi = 0.001, Figure 3), as seen in the ANOSIM analysis based on NMDS ordination plots of the microbial communities.
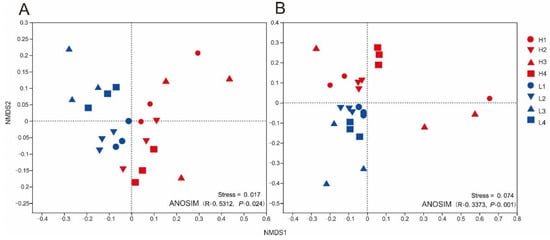
Figure 3.
Non-metric multidimensional scaling (NMDS) of soil microbial communities based on pairwise UniFrac distance matrices. (A) Bacteria and (B) fungi: The consistency of the new model was determined by the stress value with the original data. Non-parametric ANOSIM (analysis of similarities) indicated significant differences between soil microbial community structure across elevations on Wuyi Mountain. L1, L2, L3, and L4 correspond to forests at low elevations and H1, H2, H3, and H4 correspond to forests at high elevation levels, respectively.
3.4. Environmental Determinants of Soil Microbial Community Structures
The plant richness (r = 0.415, p = 0.019) and diversity (r = 0.486, p = 0.004) influenced soil bacterial community structures (based on OTUs) in the forests at the two elevation levels (Figure S2, Table 5). In the Canonical Correlation Analysis (CCA) (Figure 4, Table S5), and plant diversity was found to be the main driver for the bacterial community structures (based on OTUs) in the forests at the two elevation levels. Similarly, soil fungal community structures was also seen to be influenced by plant diversity (plant Shannon diversity index) (Figure 4, Table S5).
Table 5.
Mantel test results for the correlation between microbial community composition and environmental variables of the forests across elevations on Wuyi Mountain. Bold values indicate significant correlations (p < 0.05).
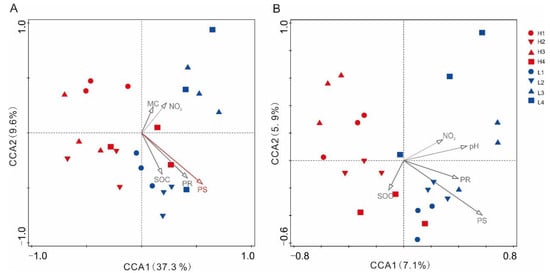
Figure 4.
Canonical correlation analysis (CCA) of soil microbial communities of the forests across elevations on Wuyi Mountain (n = 24). (A) Bacteria and (B) fungi.
In the trophic guild analysis, the compositions of fungal trophic guilds were similar in all forests at all elevation levels (p > 0.05, Table 6 and Table S6). Among these fungal trophic guilds, the symbiotrophs were the most abundant (the average relative abundance: 65.70% in low elevations and 61.98% in high elevations), followed by saprotrophic fungi (29.28% and 30.77%). The abundance of the pathotrophic fungi was the lowest (5.01% and 7.26%) (Table 6 and Table S6).
Table 6.
The trophic mode-based community structure of soil fungal communities in the forests at the low and high elevations on Wuyi mountain.
The symbiotrophic fungal guild was significantly influenced by plant diversity, as indicated by 18.3% of variations among the total variations seen in the CCA analysis (Figure S3, Table 7). Plant richness was observed as the main regulator of the pathotrophic fungal community, which caused 25.0% of the total variation (Figure S3, Table 7). However, no factor could be determined as the predictor of saprotrophic fungi through CCA analysis (Figure S3, Table 7).
Table 7.
Canonical correlation analysis (CCA) between environmental factors and the community structure of different fungal trophic guilds (symbiotroph, saprotroph, pathotroph) (n = 24).
Environmental factors were significantly correlated with the main taxa of soil bacterial and fungal communities (Figure 5, Tables S7 and S8). For bacteria, plant diversity was negatively and positively correlated with Actinobacteriota and Myxococcota (p < 0.05), respectively. Plant richness was positively correlated with Myxococcota (p = 0.036) (Figure 5, Table S7). At genus level, plant diversity was negatively correlated with the relative abundances of several genera (p < 0.05, Table S8), including norank_Subgroup_2, Bryobacter, norank_Micropepsaceae, and was positively correlated with Candidatus_Solibacter, Conexibacter and Edaphobacter (p < 0.05, Table S8). Plant richness was positively correlated with Gemmataceae, and negatively correlated with norank_IMCC26256 and norank_Micropepsaceae (p < 0.05, Table S8). Similarly for fungi, soil pH was negatively correlated with Russula and Tolypocladium, while positively correlated with Entoloma and Apiotrichum (p < 0.05, Table S8).
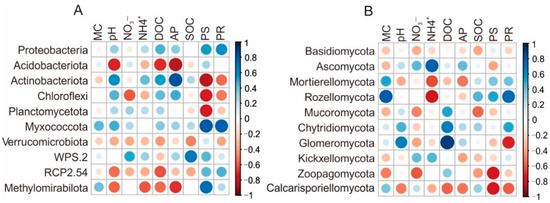
Figure 5.
Pearson’s correlations between the top 10 bacterial (A) and fungal (B) phyla and environmental factors of the study area of Wuyi Mountain. MC, soil moisture content; pH, soil pH; NO3−, nitrate nitrogen; NH4+, ammonia nitrogen; DOC, dissolved organic carbon; AP, available phosphorus; SOC, soil organic carbon; PR, plant richness; PS, plant Shannon diversity.
4. Discussion
4.1. Drivers of Soil Bacterial Diversity and Community Structure across Elevations
Soil microbial diversity and community structure are central in shaping the dynamics of vulnerable ecosystems, such as forests in the events of global climate change [61,62]. Elevation gradients are unique locations to study such vulnerability, along with the response of soil microbial communities over short distances and their interaction with several environmental variables. An unexpected finding which did not match our first hypothesis was that no significant variations (p > 0.05) were seen in bacterial as well as fungal diversity indices, except for a decrease in their values. Similar observations were made by Shen [63] in the Changbai mountain range of Northeastern China (530–2200 m a.s.l.), where soil fungal diversity remained unchanged with increasing elevation levels. While several other studies indicated monotonic increasing soil microbial diversities with increasing elevations [13], the soil microbial diversities of our study firstly decreased and then increased [64] with higher elevations, or otherwise increased to a certain elevation and then decreased with the increase in elevations [18].
The differing responses of the soil microbial community at different elevations in various ecosystems could be attributed to the varying environmental conditions, including vegetation, topography, and edaphic factors [65]. Wang [32] indicated that soil pH contributed the most to the hollow elevational pattern of soil fungal diversity on the Tibetan plateau (3106 to 4479 m a.s.l.), while Bryant [66] found that soil bacterial diversity decreased with the increase in elevations of the Rocky Mountains in Colorado (2406 to 3380 m a.s.l.). This may have been due to the combined influence of soil temperature, pH, and total nitrogen contents in soil on account of variable physiological responses of microbial communities, such as the bacteria and fungi that differ in robustness and recalcitrance mechanisms [67]. Furthermore, in the study of Shen [68], the best predictor for decreased soil bacterial diversity along elevations was the soil C/N ratio and not the particular elemental content in soil along the 2000–2500 m a.s.l. Changbai mountain range. In our study, the main determinants of soil bacterial and fungal diversity were the vegetation factors, such as plant diversity and the soil pH as main soil edaphic factors, which confirmed our second hypothesis. Plant diversity and soil pH were positively correlated with soil bacterial and fungal Shannon diversity index, respectively.
A significant correlation between plant and soil bacterial community was seen (Table 3 and Table 4), which means that plant diversity can be regarded as the best predictor of soil bacterial diversity and community structure (Figure 4, Table 4). These results are in line with the observations of those in the previous studies [13,22,69]. This may be because plant mixtures promote soil microbial diversity by increasing the diversity of resources (e.g., soil exudates and litter), providing physical microhabitats and controlling environmental conditions (e.g., soil pH, nutrient status) [22].
Specific microbial communities are conditioned under certain soil microenvironment [23,70]. There are multiple ways in which plant communities may influence their association with soil microbial communities and their compositions [20,71]. For example, the plant community might directly influence the composition of soil microbial communities through symbiosis, where plant photosynthates are traded in exchange of essential soil nutrients, as seen in the presence of nodule-forming bacteria, while indirect effects may include changes in the edaphic properties, such as substrate availability and alteration in soil pH through root exudates [72,73,74].
4.2. Soil pH Drove Soil Fungal Diversity Patterns across Elevations
In this study, despite the symbiotic nature of fungal communities and plant species, no significant differences in soil fungal diversity and composition along the elevation gradients as a result of plant diversity changes were seen. Such observation can be attributed to the stronger influence of other ecological factors such as the soil pH and C, N, and P dynamics on soil biodiversity in comparison to the singular effects of plant diversity [23]. In a recent study [21], a negative correlation was seen between plant and soil fungal diversity under nitrogen-limited conditions, while plant diversity, soil nutrients (the total phosphorus and soil nitrate), and fungal trophic guild together determined the fungal diversity of the forest ecosystem in the Southern Chinese Himalayas, albeit the vegetation there was dominated by coniferous trees, unlike the evergreen broadleaf trees in the current study. This further agrees with the findings that fungal trophic guilds exhibit a differential response to the shifts in plant diversity [75]. Owing to the contrasting strategies of C and other nutrient acquisition, symbiotrophic fungi may outcompete saprotrophic fungi in nutrient-limited soils [76]. This may further inhibit the abundance of saprotrophic fungi and induce a lower soil fungal diversity.
Likewise, the FUNGuild-based results indicated a significant influence of plant diversity and richness on symbiotroph and pathotroph fungal trophic mode. These results are in line with those of Dickie [77] in boreal forest ecosystems, meaning that due to close interactions between plants and their symbiont fungi, a host preference and/or filtering might be operational in the study area. This is also consistent with the findings of Gao [78] in Chinese subtropical forests where diversity of symbiotic fungi (the Ectomycorrhizal fungi) corresponded with the increased plant diversity. Together, these observations acknowledge close associations between aboveground and belowground biotic communities [22,31,79]. However, no environmental determinants of the saprophytic fungal communities could be explored in this study. All this may perhaps illustrate ambiguity in determining exact driving factors for an overall fungal community.
Nonetheless, the effects of plant diversity on soil microbial communities may be masked by the stronger effects of edaphic properties under acidic conditions represented by a below-six soil pH [80]. Many studies until date have demonstrated soil pH as the most important driving factor of microbial alpha-diversity [15,80]. The elevation pattern of microbial alpha-diversity was generally coupled with that of the soil pH. This was in close accordance with the narrow range in pH tolerance of most microbial taxa [67]. The optimal pH range for fungi is between five and nine [81]. Under lower soil pH, only certain fungi may thrive at the expense of a higher fungal diversity [32]. In relation to this, the growth of microbial communities was decreased by nearly 50% when pH values differed by 1.5 units [15]. In this study, soil pH was relatively low and ranged from 3.88 to 5.03. Such a shift in soil pH may have had compounding effects on soil fungal diversity across the studied elevational range.
The responses of both communities were expected to be variable with the alterations in soil pH [15]. Bacterial networks tend to be more destabilizing than fungal network and are more sensitive to environmental changes such as differences in the optimal pH range [82]. The optimal pH interval for bacterial growth is 4–7, and bacteria tend to be more sensitive to alteration in pH values beyond this range. However, such pH effects on bacterial diversity were not seen in this study. One possible reason could be that most bacterial taxa prefer an acidic environment [15], meaning that they could adapt to the pH alterations in evergreen broadleaf forests of the subtropical zone on Wuyi Mountain where pH ranged between 3.88 and 5.03. Another explanation could be the stronger effects of other environmental factors (e.g., plant diversity) that masked the effects of soil pH on the existing bacterial communities.
5. Conclusions
This study determined how soil microbial diversity and community composition respond to distinct plant diversities and soil physiochemical properties in the evergreen broadleaf forests at the low (550–700 m a.s.l.) and the high (1020–1038 m a.s.l.) elevations of Wuyi Mountain. Despite no significant variations in soil bacterial and fungal alpha-diversities, the microbial community structures shifted significantly when the elevation levels were compared. Plant Shannon index was the key predictor of soil bacterial diversity, and plant diversity (The Chao 1 and Shannon indices) altered soil bacterial community structures across the elevation levels. Soil pH was the driving factor of soil fungal diversity patterns across elevations. However, no exact determinant of variations in soil fungal community structures could be predicted due to the inconsistency in differences among the fungal trophic modes. Nonetheless, plant Chao1 and Shannon indices were the major drivers of symbiotroph and pathotroph fungal community structure across elevations. The findings of this study provide new insights on soil microbial community dynamics and the local regulators across elevations covered by evergreen broadleaf forest vegetation. Our results show high interconnectedness between the plant diversity and microbial community structure. Therefore, as the plant diversity is mainly structured by climatic factors along elevation gradients, the microbial functional and structural patterns will have remarkable implications of microbial responses to climate change, especially in the studied mid-subtropical forest ecosystems in China.
Supplementary Materials
The following supporting information can be downloaded at: https://www.mdpi.com/article/10.3390/f14040769/s1, Figure S1. The coverage curves of soil bacterial and fungal communities in soils at low and high elevation forests of Wuyi mountain. L1, L2, L3, L4 correspond to forests at low elevations and H1, H2, H3, H4 correspond to forests at high elevation levels, respectively. Figure S2. Mantel test of soil bacterial and fungal community structures with environmental variables at the study area of Wuyi mountain. MC, soil moisture content; pH, soil pH; NO3−, nitrate nitrogen; NH4+, ammonia nitrogen; DOC, dissolved organic carbon; AP, available phosphorus; SOC, soil organic carbon; PR, plant richness; PS, plant Shannon diversity. Figure S3. Canonical correlation analysis (CCA) between environmental factors and community structure of different fungal trophic guilds (symbiotroph, saprotroph, pathotroph) (n = 24). PS, plant Shannon diversity; DOC, dissolved organic carbon; NH4+, ammonia nitrogen; NO3−, nitrate nitrogen; MC, soil moisture content; AP, available phosphorus; SOC, soil organic carbon; PR, plant richness; pH, soil pH. Table S1. The main plant species at the low and high elevation evergreen broadleaf forests on Wuyi mountain. L1, L2, L3, L4 correspond to forests at low elevations and H1, H2, H3, H4 correspond to forests at high elevation levels, respectively. Table S2. Alpha-diversity indices of microbial community in soils of the forests at the low and high altitudes on Wuyi mountain. Alpha diversity indices were based on OTUs richness (Chao 1 index) and diversity (Shannon index). Significant differences between the low and high elevation forests are indicated by different letters according to the t-test (p < 0.05). Table S3. Summary of keystone taxa (Top 10 at phylum level) of soil microbial community in the forests at the low and high altitudes on Wuyi mountain. Significant differences between the low and high elevation forests are indicated by different letters according to the t-test (p < 0.05). Table S4. Summary of keystone taxa (Top 50 at genus level) of soil microbial community in the forests at the low and high altitudes on Wuyi mountain. Significant differences between the low and high elevation forests are indicated by different letters according to the t-test (p < 0.05). Table S5. Canonical correlation analysis (CCA) between environmental factors and community structure of soil bacerial and fungal communities (n = 24). Table S6. Classifications of symbiotroph, saprotroph and pathotroph fungi were obtained from the fungal community trophic dataset based on FUNGuild by taxonomic assignments. L1, L2, L3, L4 indicate the forests at low altitudes, and H1, H2, H3, H4 indicate the forests at high altitudes. Table S7. Pearson correlations between main bacterial and fungal phyla and environmental variables. Values indicate means ± SE (n = 24). Bold values indicate significant correlations (p < 0.05). Table S8. The Pearson correlations between main microbial taxa (at the genus level) and environmental factors. Values indicate means ± SE (n = 24). Bold values indicate significant correlations (p < 0.05).
Author Contributions
N.Y.: investigation, conceptualization, visualization, formal analysis, writing—original draft, and writing—review and editing. Y.W., B.L., J.Z. and J.H.: investigation, methodology, visualization, formal analysis. D.L., P.B. and H.R.: writing—review and editing. Y.Z., H.Z. and C.Z.: resources, funding acquisition, validation, and project administration. W.W.: conceptualization, funding acquisition, supervision, and writing—review and editing. All authors contributed to the article and approved the submitted version. All authors have read and agreed to the published version of the manuscript.
Funding
This study was supported by Fujian Forestry Science and Technology Project (2020-29), and the Priority Academic Program Development of Jiangsu Higher Education Institutions (PAPD).
Data Availability Statement
The datasets analysed during the current study are available from the first and corresponding author on reasonable request.
Acknowledgments
The help of Ke Yan, Yue Liu, Menglin Su, and Lu Wang during the field survey and soil sampling is highly appreciated.
Conflicts of Interest
The authors declare that they have no conflict of interest.
References
- Vandvik, V.; Halbritter, A.H.; Yang, Y.; He, H.; Zhang, L.; Brummer, A.B.; Klanderud, K.; Maitner, B.S.; Michaletz, S.T.; Sun, X.; et al. Plant Traits and Vegetation Data from Climate Warming Experiments along an 1100 m Elevation Gradient in Gongga Mountains, China. Sci. Data 2020, 7, 189. [Google Scholar] [CrossRef] [PubMed]
- Bader, M.Y.; Llambí, L.D.; Case, B.S.; Buckley, H.L.; Toivonen, J.M.; Camarero, J.J.; Cairns, D.M.; Brown, C.D.; Wiegand, T.; Resler, L.M. A Global Framework for Linking Alpine-treeline Ecotone Patterns to Underlying Processes. Ecography 2021, 44, 265–292. [Google Scholar] [CrossRef]
- Wang, Y.; Liang, E.; Lu, X.; Camarero, J.J.; Babst, F.; Shen, M.; Peñuelas, J. Warming-induced Shrubline Advance Stalled by Moisture Limitation on the Tibetan Plateau. Ecography 2021, 44, 1631–1641. [Google Scholar] [CrossRef]
- Ma, L.; Liu, L.; Lu, Y.; Chen, L.; Zhang, Z.; Zhang, H.; Wang, X.; Shu, L.; Yang, Q.; Song, Q.; et al. When Microclimates Meet Soil Microbes: Temperature Controls Soil Microbial Diversity along an Elevational Gradient in Subtropical Forests. Soil Biol. Biochem. 2022, 166, 108566. [Google Scholar] [CrossRef]
- van der Heijden, M.G.A.; Bardgett, R.D.; van Straalen, N.M. The Unseen Majority: Soil Microbes as Drivers of Plant Diversity and Productivity in Terrestrial Ecosystems. Ecol. Lett. 2008, 11, 296–310. [Google Scholar] [CrossRef] [PubMed]
- Hazard, C.; Gosling, P.; van der Gast, C.J.; Mitchell, D.T.; Doohan, F.M.; Bending, G.D. The Role of Local Environment and Geographical Distance in Determining Community Composition of Arbuscular Mycorrhizal Fungi at the Landscape Scale. ISME J. 2013, 7, 498–508. [Google Scholar] [CrossRef] [PubMed]
- Tedersoo, L.; Bahram, M.; Põlme, S.; Kõljalg, U.; Yorou, N.S.; Wijesundera, R.; Ruiz, L.V.; Vasco-Palacios, A.M.; Thu, P.Q.; Suija, A.; et al. Global Diversity and Geography of Soil Fungi. Science 2014, 346, 1256688. [Google Scholar] [CrossRef]
- Xu, M.; Li, X.; Cai, X.; Gai, J.; Li, X.; Christie, P.; Zhang, J. Soil Microbial Community Structure and Activity along a Montane Elevational Gradient on the Tibetan Plateau. Eur. J. Soil Biol. 2014, 64, 6–14. [Google Scholar] [CrossRef]
- Shi, L.; Zhang, H.; Liu, T.; Mao, P.; Zhang, W.; Shao, Y.; Fu, S. An Increase in Precipitation Exacerbates Negative Effects of Nitrogen Deposition on Soil Cations and Soil Microbial Communities in a Temperate Forest. Environ. Pollut. 2018, 235, 293–301. [Google Scholar] [CrossRef]
- Fierer, N.; McCain, C.M.; Meir, P.; Zimmermann, M.; Rapp, J.M.; Silman, M.R.; Knight, R. Microbes Do Not Follow the Elevational Diversity Patterns of Plants and Animals. Ecology 2011, 92, 797–804. [Google Scholar] [CrossRef]
- Goldmann, K.; Schöning, I.; Buscot, F.; Wubet, T. Forest Management Type Influences Diversity and Community Composition of Soil Fungi across Temperate Forest Ecosystems. Front. Microbiol. 2015, 6, 1300. [Google Scholar] [CrossRef] [PubMed]
- Liu, D.; Wang, H.; An, S.; Bhople, P.; Davlatbekov, F. Geographic Distance and Soil Microbial Biomass Carbon Drive Biogeographical Distribution of Fungal Communities in Chinese Loess Plateau Soils. Sci. Total Environ. 2019, 660, 1058–1069. [Google Scholar] [CrossRef] [PubMed]
- Zhang, Y.; Cong, J.; Lu, H.; Li, G.; Xue, Y.; Deng, Y.; Li, H.; Zhou, J.; Li, D. Soil Bacterial Diversity Patterns and Drivers along an Elevational Gradient on Shennongjia Mountain, China: Soil Bacterial Elevational Pattern. Microb. Biotechnol. 2015, 8, 739–746. [Google Scholar] [CrossRef]
- Smith, S.E.; Read, D.J. Mycorrhizal Symbiosis, 3rd ed.; Repr.; Elsevier/Acad. Press: Amsterdam, The Netherlands, 2008; ISBN 978-0-12-370526-6. [Google Scholar]
- Rousk, J.; Bååth, E.; Brookes, P.C.; Lauber, C.L.; Lozupone, C.; Caporaso, J.G.; Knight, R.; Fierer, N. Soil Bacterial and Fungal Communities across a pH Gradient in an Arable Soil. ISME J. 2010, 4, 1340–1351. [Google Scholar] [CrossRef] [PubMed]
- Millard, P.; Singh, B.K. Does Grassland Vegetation Drive Soil Microbial Diversity? Nutr. Cycl. Agroecosyst. 2010, 88, 147–158. [Google Scholar] [CrossRef]
- Keiblinger, K.M.; Hall, E.K.; Wanek, W.; Szukics, U.; Hämmerle, I.; Ellersdorfer, G.; Böck, S.; Strauss, J.; Sterflinger, K.; Richter, A.; et al. The Effect of Resource Quantity and Resource Stoichiometry on Microbial Carbon-Use-Efficiency: Resource Quantity/Quality Drives Microbial C-Use-Efficiency. FEMS Microbiol. Ecol. 2010, 73, 430–440. [Google Scholar] [CrossRef] [PubMed]
- Yang, N.; Li, X.; Liu, D.; Zhang, Y.; Chen, Y.; Wang, B.; Hua, J.; Zhang, J.; Peng, S.; Ge, Z.; et al. Diversity Patterns and Drivers of Soil Bacterial and Fungal Communities along Elevational Gradients in the Southern Himalayas, China. Appl. Soil Ecol. 2022, 178, 104563. [Google Scholar] [CrossRef]
- Zhou, Y.; Jia, X.; Han, L.; Liu, Z.; Kang, S.; Zhao, Y. Fungal Community Diversity in Soils along an Elevation Gradient in a Quercus Aliena Var. Acuteserrata Forest in Qinling Mountains, China. Appl. Soil Ecol. 2021, 167, 104104. [Google Scholar] [CrossRef]
- Shen, C.; Xiong, J.; Zhang, H.; Feng, Y.; Lin, X.; Li, X.; Liang, W.; Chu, H. Soil pH Drives the Spatial Distribution of Bacterial Communities along Elevation on Changbai Mountain. Soil Biol. Biochem. 2013, 57, 204–211. [Google Scholar] [CrossRef]
- Yang, N.; Zhang, Y.; Li, J.; Li, X.; Ruan, H.; Bhople, P.; Keiblinger, K.; Mao, L.; Liu, D. Interaction among Soil Nutrients, Plant Diversity and Hypogeal Fungal Trophic Guild Modifies Root-Associated Fungal Diversity in Coniferous Forests of Chinese Southern Himalayas. Plant Soil 2022, 481, 395–408. [Google Scholar] [CrossRef]
- Dedeyn, G.; Vanderputten, W. Linking Aboveground and Belowground Diversity. Trends Ecol. Evol. 2005, 20, 625–633. [Google Scholar] [CrossRef] [PubMed]
- Wardle, D.A. Ecological Linkages between Aboveground and Belowground Biota. Science 2004, 304, 1629–1633. [Google Scholar] [CrossRef] [PubMed]
- Tedersoo, L.; Bahram, M.; Cajthaml, T.; Põlme, S.; Hiiesalu, I.; Anslan, S.; Harend, H.; Buegger, F.; Pritsch, K.; Koricheva, J.; et al. Tree Diversity and Species Identity Effects on Soil Fungi, Protists and Animals Are Context Dependent. ISME J. 2016, 10, 346–362. [Google Scholar] [CrossRef]
- Ampoorter, E.; Baeten, L.; Koricheva, J.; Vanhellemont, M.; Verheyen, K. Do Diverse Overstoreys Induce Diverse Understoreys? Lessons Learnt from an Experimental–Observational Platform in Finland. For. Ecol. Manag. 2014, 318, 206–215. [Google Scholar] [CrossRef]
- Prober, S.M.; Leff, J.W.; Bates, S.T.; Borer, E.T.; Firn, J.; Harpole, W.S.; Lind, E.M.; Seabloom, E.W.; Adler, P.B.; Bakker, J.D.; et al. Plant Diversity Predicts Beta but Not Alpha Diversity of Soil Microbes across Grasslands Worldwide. Ecol. Lett. 2015, 18, 85–95. [Google Scholar] [CrossRef] [PubMed]
- Miyamoto, Y.; Nakano, T.; Hattori, M.; Nara, K. The Mid-Domain Effect in Ectomycorrhizal Fungi: Range Overlap along an Elevation Gradient on Mount Fuji, Japan. ISME J. 2014, 8, 1739–1746. [Google Scholar] [CrossRef]
- Tang, M.; Li, L.; Wang, X.; You, J.; Li, J.; Chen, X. Elevational Is the Main Factor Controlling the Soil Microbial Community Structure in Alpine Tundra of the Changbai Mountain. Sci. Rep. 2020, 10, 12442. [Google Scholar] [CrossRef]
- Gai, J.P.; Tian, H.; Yang, F.Y.; Christie, P.; Li, X.L.; Klironomos, J.N. Arbuscular Mycorrhizal Fungal Diversity along a Tibetan Elevation Gradient. Pedobiologia 2012, 55, 145–151. [Google Scholar] [CrossRef]
- Yang, Y.; Gao, Y.; Wang, S.; Xu, D.; Yu, H.; Wu, L.; Lin, Q.; Hu, Y.; Li, X.; He, Z.; et al. The Microbial Gene Diversity along an Elevation Gradient of the Tibetan Grassland. ISME J. 2014, 8, 430–440. [Google Scholar] [CrossRef]
- Yang, N.; Hua, J.; Zhang, J.; Liu, D.; Bhople, P.; Li, X.; Zhang, Y.; Ruan, H.; Xing, W.; Mao, L. Soil Nutrients and Plant Diversity Affect Ectomycorrhizal Fungal Community Structure and Functional Traits across Three Subalpine Coniferous Forests. Front. Microbiol. 2022, 13, 1016610. [Google Scholar] [CrossRef]
- Wang, J.-T.; Zheng, Y.-M.; Hu, H.-W.; Zhang, L.-M.; Li, J.; He, J.-Z. Soil pH Determines the Alpha Diversity but Not Beta Diversity of Soil Fungal Community along Altitude in a Typical Tibetan Forest Ecosystem. J. Soils Sediments 2015, 15, 1224–1232. [Google Scholar] [CrossRef]
- Wu, Z.-Y.; Lin, W.-X.; Chen, Z.-F.; Fang, C.-X.; Zhang, Z.-X.; Wu, L.-K.; Zhou, M.-M.; Chen, T. Variations of soil microbial community diversity along an elevational gradient in mid-subtropical forest: Variations of soil microbial community diversity along an elevational gradient in mid-subtropical forest. Chin. J. Plant Ecol. 2013, 37, 397–406. [Google Scholar] [CrossRef]
- Nie, Y.; Wang, H.; Li, X.; Ren, Y.; Jin, C.; Xu, Z.; Lyu, M.; Xie, J. Characteristics of Soil Organic Carbon Mineralization in Low Altitude and High Altitude Forests in Wuyi Mountains, southeastern China. Chin. J. Ecol. 2018, 29, 748–756. [Google Scholar] [CrossRef]
- Wang, G.; Jin, Y.; Wang, F.; Wang, J.; Ruan, H. Temporal and Spatial Variations of Soil Microbial Biomass P under Different Vegetations along an Elevation Gradients in Wuyi Mountains in Southeast of China. J. Nanjing For. Univ. Nat. Sci. Ed. 2011, 35, 44–48. [Google Scholar] [CrossRef]
- Li, W.; Liu, Y.; Luo, Q.; Xu, H.; Liu, W.; Luo, T.; Tu, J. Seasonal Dynamics in Soil Microorganisms Diversity of Evergreen Broadleaved Forest in Wuyi Mountains, Southeastern China. J. Trop. Subtrop. Bot. 2017, 25, 115–126. [Google Scholar] [CrossRef]
- Wu, Z.; Lin, W.; Chen, Z.; Fang, C.; Zhang, Z.; Wu, L.; Zhou, M.; Shen, L. Characteristics of Soil Microbial Community under Different Vegetation Types in Wuyishan National Nature Reserve, East China. Chin. J. Appl. Ecol. 2013, 24, 2301–2309. [Google Scholar] [CrossRef]
- Wu, Z.; Lin, W.; Chen, Z.; Lin, J.; Fang, C.; Zhang, Z.; Wu, L.; Chen, T. Phospholipid Fatty Acid Analysis of Soil Microbes at Different Elevation of Wuyi Mountains. Sci. Silvae Sin. 2014, 50, 106–112. [Google Scholar]
- Li, X.; Xie, J.; Zhang, Q.; Lyu, M.; Xiong, X.; Liu, X.; Lin, T.; Yang, Y. Substrate Availability and Soil Microbes Drive Temperature Sensitivity of Soil Organic Carbon Mineralization to Warming along an Elevation Gradient in Subtropical Asia. Geoderma 2020, 364, 114198. [Google Scholar] [CrossRef]
- Frostegård, Å.; Tunlid, A.; Bååth, E. Use and Misuse of PLFA Measurements in Soils. Soil Biol. Biochem. 2011, 43, 1621–1625. [Google Scholar] [CrossRef]
- Dengler, J. A Flexible Multi-Scale Approach for Standardised Recording of Plant Species Richness Patterns. Ecol. Indic. 2009, 9, 1169–1178. [Google Scholar] [CrossRef]
- Bao, S.D. Agricultural Chemical Analysis of Soil, 3rd. ed.; China Agriculture Press: Beijing, China, 2016. [Google Scholar]
- Watanabe, F.S.; Olsen, S.R. Test of an Ascorbic Acid Method for Determining Phosphorus in Water and NaHCO3 Extracts from Soil. Soil Sci. Soc. Am. J. 1965, 29, 677–678. [Google Scholar] [CrossRef]
- Yang, N.; Wang, B.; Liu, D.; Wang, X.; Li, X.; Zhang, Y.; Xu, Y.; Peng, S.; Ge, Z.; Mao, L.; et al. Long-Term Nitrogen Deposition Alters Ectomycorrhizal Community Composition and Function in a Poplar Plantation. J. Fungi 2021, 7, 791. [Google Scholar] [CrossRef]
- Caporaso, J.G.; Lauber, C.L.; Walters, W.A.; Berg-Lyons, D.; Lozupone, C.A.; Turnbaugh, P.J.; Fierer, N.; Knight, R. Global Patterns of 16S RRNA Diversity at a Depth of Millions of Sequences per Sample. Proc. Natl. Acad. Sci. USA 2011, 108, 4516–4522. [Google Scholar] [CrossRef] [PubMed]
- Fujita, S.-I.; Senda, Y.; Nakaguchi, S.; Hashimoto, T. Multiplex PCR Using Internal Transcribed Spacer 1 and 2 Regions for Rapid Detection and Identification of Yeast Strains. J. Clin. Microbiol. 2001, 39, 3617–3622. [Google Scholar] [CrossRef] [PubMed]
- Martin, M. Cutadapt Removes Adapter Sequences from High-Throughput Sequencing Reads. EMBnet. J. 2011, 17, 10. [Google Scholar] [CrossRef]
- Liu, D.; Bhople, P.; Keiblinger, K.M.; Wang, B.; An, S.; Yang, N.; Chater, C.C.C.; Yu, F. Soil Rehabilitation Promotes Resilient Microbiome with Enriched Keystone Taxa than Agricultural Infestation in Barren Soils on the Loess Plateau. Biology 2021, 10, 1261. [Google Scholar] [CrossRef]
- DeSantis, T.Z.; Hugenholtz, P.; Larsen, N.; Rojas, M.; Brodie, E.L.; Keller, K.; Huber, T.; Dalevi, D.; Hu, P.; Andersen, G.L. Greengenes, a Chimera-Checked 16S RRNA Gene Database and Workbench Compatible with ARB. Appl. Environ. Microbiol. 2006, 72, 5069–5072. [Google Scholar] [CrossRef]
- Quast, C.; Pruesse, E.; Yilmaz, P.; Gerken, J.; Schweer, T.; Yarza, P.; Peplies, J.; Glöckner, F.O. The SILVA Ribosomal RNA Gene Database Project: Improved Data Processing and Web-Based Tools. Nucleic Acids Res. 2012, 41, D590–D596. [Google Scholar] [CrossRef]
- Nilsson, R.H.; Larsson, K.-H.; Taylor, A.F.S.; Bengtsson-Palme, J.; Jeppesen, T.S.; Schigel, D.; Kennedy, P.; Picard, K.; Glöckner, F.O.; Tedersoo, L.; et al. The UNITE Database for Molecular Identification of Fungi: Handling Dark Taxa and Parallel Taxonomic Classifications. Nucleic Acids Res. 2019, 47, D259–D264. [Google Scholar] [CrossRef]
- Nguyen, N.H.; Song, Z.; Bates, S.T.; Branco, S.; Tedersoo, L.; Menke, J.; Schilling, J.S.; Kennedy, P.G. FUNGuild: An Open Annotation Tool for Parsing Fungal Community Datasets by Ecological Guild. Fungal Ecol. 2016, 20, 241–248. [Google Scholar] [CrossRef]
- Shapiro, S.S.; Wilk, M.B. An Analysis of Variance Test for Normality (Complete Samples). Biometrika 1965, 52, 591. [Google Scholar] [CrossRef]
- Schultz, B.B. LEVENE’S Test for Relative Variation. Syst. Zool. 1985, 34, 449–456. [Google Scholar] [CrossRef]
- Student The Probable Error of a Mean. In Breakthroughs in Statistics; Springer: New York, NY, USA, 1992; pp. 33–57. ISBN 978-1-4612-4380-9.
- Oksanen, J.; Blanchet, G.; Friendly, M.; Kindt, R.; Legendre, P.; McGlinn, D.; Minchin, P.R.; O’Hara, R.B.; Simpson, G.L.; Solymos, P.; et al. Vegan: Community Ecology Package. R Package Version 2.0-10. Available online: https://CRAN.R-project.org/package=vegan:2013 (accessed on 11 January 2023).
- Akaike, H. A New Look at the Statistical Model Identification. IEEE Trans. Automat. Contr. 1974, 19, 716–723. [Google Scholar] [CrossRef]
- Buttigieg, P.L.; Ramette, A. A Guide to Statistical Analysis in Microbial Ecology: A Community-Focused, Living Review of Multivariate Data Analyses. FEMS Microbiol. Ecol. 2014, 90, 543–550. [Google Scholar] [CrossRef] [PubMed]
- Mantel, N. The Detection of Disease Clustering and a Generalized Regression Approach. Cancer Res. 1967, 27, 209–220. [Google Scholar] [CrossRef] [PubMed]
- Hotelljng, H. Relations between Two Sets of Variates. In Breakthroughs in Statistics; Springer: New York, NY, USA, 1992; pp. 162–190. ISBN 978-1-4612-4380-9. [Google Scholar]
- Strickland, M.S.; Lauber, C.; Fierer, N.; Bradford, M.A. Testing the Functional Significance of Microbial Community Composition. Ecology 2009, 90, 441–451. [Google Scholar] [CrossRef] [PubMed]
- Allison, S.D.; Wallenstein, M.D.; Bradford, M.A. Soil-Carbon Response to Warming Dependent on Microbial Physiology. Nat. Geosci. 2010, 3, 336–340. [Google Scholar] [CrossRef]
- Shen, C.; Liang, W.; Shi, Y.; Lin, X.; Zhang, H.; Wu, X.; Xie, G.; Chain, P.; Grogan, P.; Chu, H. Contrasting Elevational Diversity Patterns between Eukaryotic Soil Microbes and Plants. Ecology 2014, 95, 3190–3202. [Google Scholar] [CrossRef]
- Liu, D.; Wu, X.; Shi, S.; Liu, H.; Liu, G. A Hollow Bacterial Diversity Pattern with Elevation in Wolong Nature Reserve, Western Sichuan Plateau. J. Soils Sediments 2016, 16, 2365–2374. [Google Scholar] [CrossRef]
- Körner, C. The Use of ‘Altitude’ in Ecological Research. Trends Ecol. Evol. 2007, 22, 569–574. [Google Scholar] [CrossRef]
- Bryant, J.A.; Lamanna, C.; Morlon, H.; Kerkhoff, A.J.; Enquist, B.J.; Green, J.L. Microbes on Mountainsides: Contrasting Elevational Patterns of Bacterial and Plant Diversity. Proc. Natl. Acad. Sci. USA 2008, 105, 11505–11511. [Google Scholar] [CrossRef] [PubMed]
- Margesin, R.; Jud, M.; Tscherko, D.; Schinner, F. Microbial Communities and Activities in Alpine and Subalpine Soils: Communities and Activities in Alpine and Subalpine Soils. FEMS Microbiol. 2009, 67, 208–218. [Google Scholar] [CrossRef]
- Shen, C.; Ni, Y.; Liang, W.; Wang, J.; Chu, H. Distinct Soil Bacterial Communities along a Small-Scale Elevational Gradient in Alpine Tundra. Front. Microbiol. 2015, 6, 582. [Google Scholar] [CrossRef] [PubMed]
- Bayranvand, M.; Akbarinia, M.; Salehi Jouzani, G.; Gharechahi, J.; Kooch, Y.; Baldrian, P. Composition of Soil Bacterial and Fungal Communities in Relation to Vegetation Composition and Soil Characteristics along an Altitudinal Gradient. FEMS Microbiol. 2021, 97, fiaa201. [Google Scholar] [CrossRef]
- Tedersoo, L.; Bahram, M.; Toots, M.; DiéDhiou, A.G.; Henkel, T.W.; KjøLler, R.; Morris, M.H.; Nara, K.; Nouhra, E.; Peay, K.G.; et al. Towards Global Patterns in the Diversity and Community Structure of Ectomycorrhizal Fungi: Global Metastudy of Ectomycorrhizal Fungi. Mol. Ecol. 2012, 21, 4160–4170. [Google Scholar] [CrossRef]
- Chu, H.; Neufeld, J.D.; Walker, V.K.; Grogan, P. The Influence of Vegetation Type on the Dominant Soil Bacteria, Archaea, and Fungi in a Low Arctic Tundra Landscape. Soil Sci. Soc. Am. J. 2011, 75, 1756–1765. [Google Scholar] [CrossRef]
- Orwin, K.H.; Buckland, S.M.; Johnson, D.; Turner, B.L.; Smart, S.; Oakley, S.; Bardgett, R.D. Linkages of Plant Traits to Soil Properties and the Functioning of Temperate Grassland: Links of Plant Traits to Soil Properties. J. Ecol. 2010, 98, 1074–1083. [Google Scholar] [CrossRef]
- Pei, Z.; Eichenberg, D.; Bruelheide, H.; Kröber, W.; Kühn, P.; Li, Y.; von Oheimb, G.; Purschke, O.; Scholten, T.; Buscot, F.; et al. Soil and Tree Species Traits Both Shape Soil Microbial Communities during Early Growth of Chinese Subtropical Forests. Soil Biol. Biochem. 2016, 96, 180–190. [Google Scholar] [CrossRef]
- Thoms, C.; Gattinger, A.; Jacob, M.; Thomas, F.M.; Gleixner, G. Direct and Indirect Effects of Tree Diversity Drive Soil Microbial Diversity in Temperate Deciduous Forest. Soil Biol. Biochem. 2010, 42, 1558–1565. [Google Scholar] [CrossRef]
- Milcu, A.; Allan, E.; Roscher, C.; Jenkins, T.; Meyer, S.T.; Flynn, D.; Bessler, H.; Buscot, F.; Engels, C.; Gubsch, M.; et al. Functionally and Phylogenetically Diverse Plant Communities Key to Soil Biota. Ecology 2013, 94, 1878–1885. [Google Scholar] [CrossRef]
- Awad, A.; Majcherczyk, A.; Schall, P.; Schröter, K.; Schöning, I.; Schrumpf, M.; Ehbrecht, M.; Boch, S.; Kahl, T.; Bauhus, J.; et al. Ectomycorrhizal and Saprotrophic Soil Fungal Biomass Are Driven by Different Factors and Vary among Broadleaf and Coniferous Temperate Forests. Soil Biol. Biochem. 2019, 131, 9–18. [Google Scholar] [CrossRef]
- Dickie, I.A. Host Preference, Niches and Fungal Diversity. New Phytol. 2007, 174, 230–233. [Google Scholar] [CrossRef] [PubMed]
- Gao, C.; Shi, N.N.; Liu, Y.X.; Peay, K.G.; Zheng, Y.; Ding, Q.; Mi, X.-C.; Ma, K.-P.; Wubet, T.; Buscot, F.; et al. Host Plant Genus-Level Diversity Is the Best Predictor of Ectomycorrhizal Fungal Diversity in a Chinese Subtropical Forest. Mol. Ecol. 2013, 22, 3403–3414. [Google Scholar] [CrossRef] [PubMed]
- Hooper, D.U.; Bignell, D.E.; Brown, V.K.; Brussard, L.; Mark Dangerfield, J.; Wall, D.H.; Wardle, D.A.; Coleman, D.C.; Giller, K.E.; Lavelle, P.; et al. Interactions between Aboveground and Belowground Biodiversity in Terrestrial Ecosystems: Patterns, Mechanisms, and Feedbacks. BioScience 2000, 50, 1049. [Google Scholar] [CrossRef]
- Li, J.; Shen, Z.; Li, C.; Kou, Y.; Wang, Y.; Tu, B.; Zhang, S.; Li, X. Stair-Step Pattern of Soil Bacterial Diversity Mainly Driven by pH and Vegetation Types along the Elevational Gradients of Gongga Mountain, China. Front. Microbiol. 2018, 9, 569. [Google Scholar] [CrossRef]
- Nevarez, L.; Vasseur, V.; Le Madec, A.; Le Bras, M.A.; Coroller, L.; Leguérinel, I.; Barbier, G. Physiological Traits of Penicillium Glabrum Strain LCP 08.5568, a Filamentous Fungus Isolated from Bottled Aromatised Mineral Water. Int. J. Food Microbiol. 2009, 130, 166–171. [Google Scholar] [CrossRef]
- Beales, N. Adaptation of Microorganisms to Cold Temperatures, Weak Acid Preservatives, Low pH, and Osmotic Stress: A Review. Comp. Rev. Food Sci. Food Saf. 2004, 3, 1–20. [Google Scholar] [CrossRef]
Disclaimer/Publisher’s Note: The statements, opinions and data contained in all publications are solely those of the individual author(s) and contributor(s) and not of MDPI and/or the editor(s). MDPI and/or the editor(s) disclaim responsibility for any injury to people or property resulting from any ideas, methods, instructions or products referred to in the content. |
© 2023 by the authors. Licensee MDPI, Basel, Switzerland. This article is an open access article distributed under the terms and conditions of the Creative Commons Attribution (CC BY) license (https://creativecommons.org/licenses/by/4.0/).