
Spatio-Temporal Variation and Climatic Driving Factors of Vegetation Coverage in the Yellow River Basin from 2001 to 2020 Based on kNDVI

Abstract
:1. Introduction
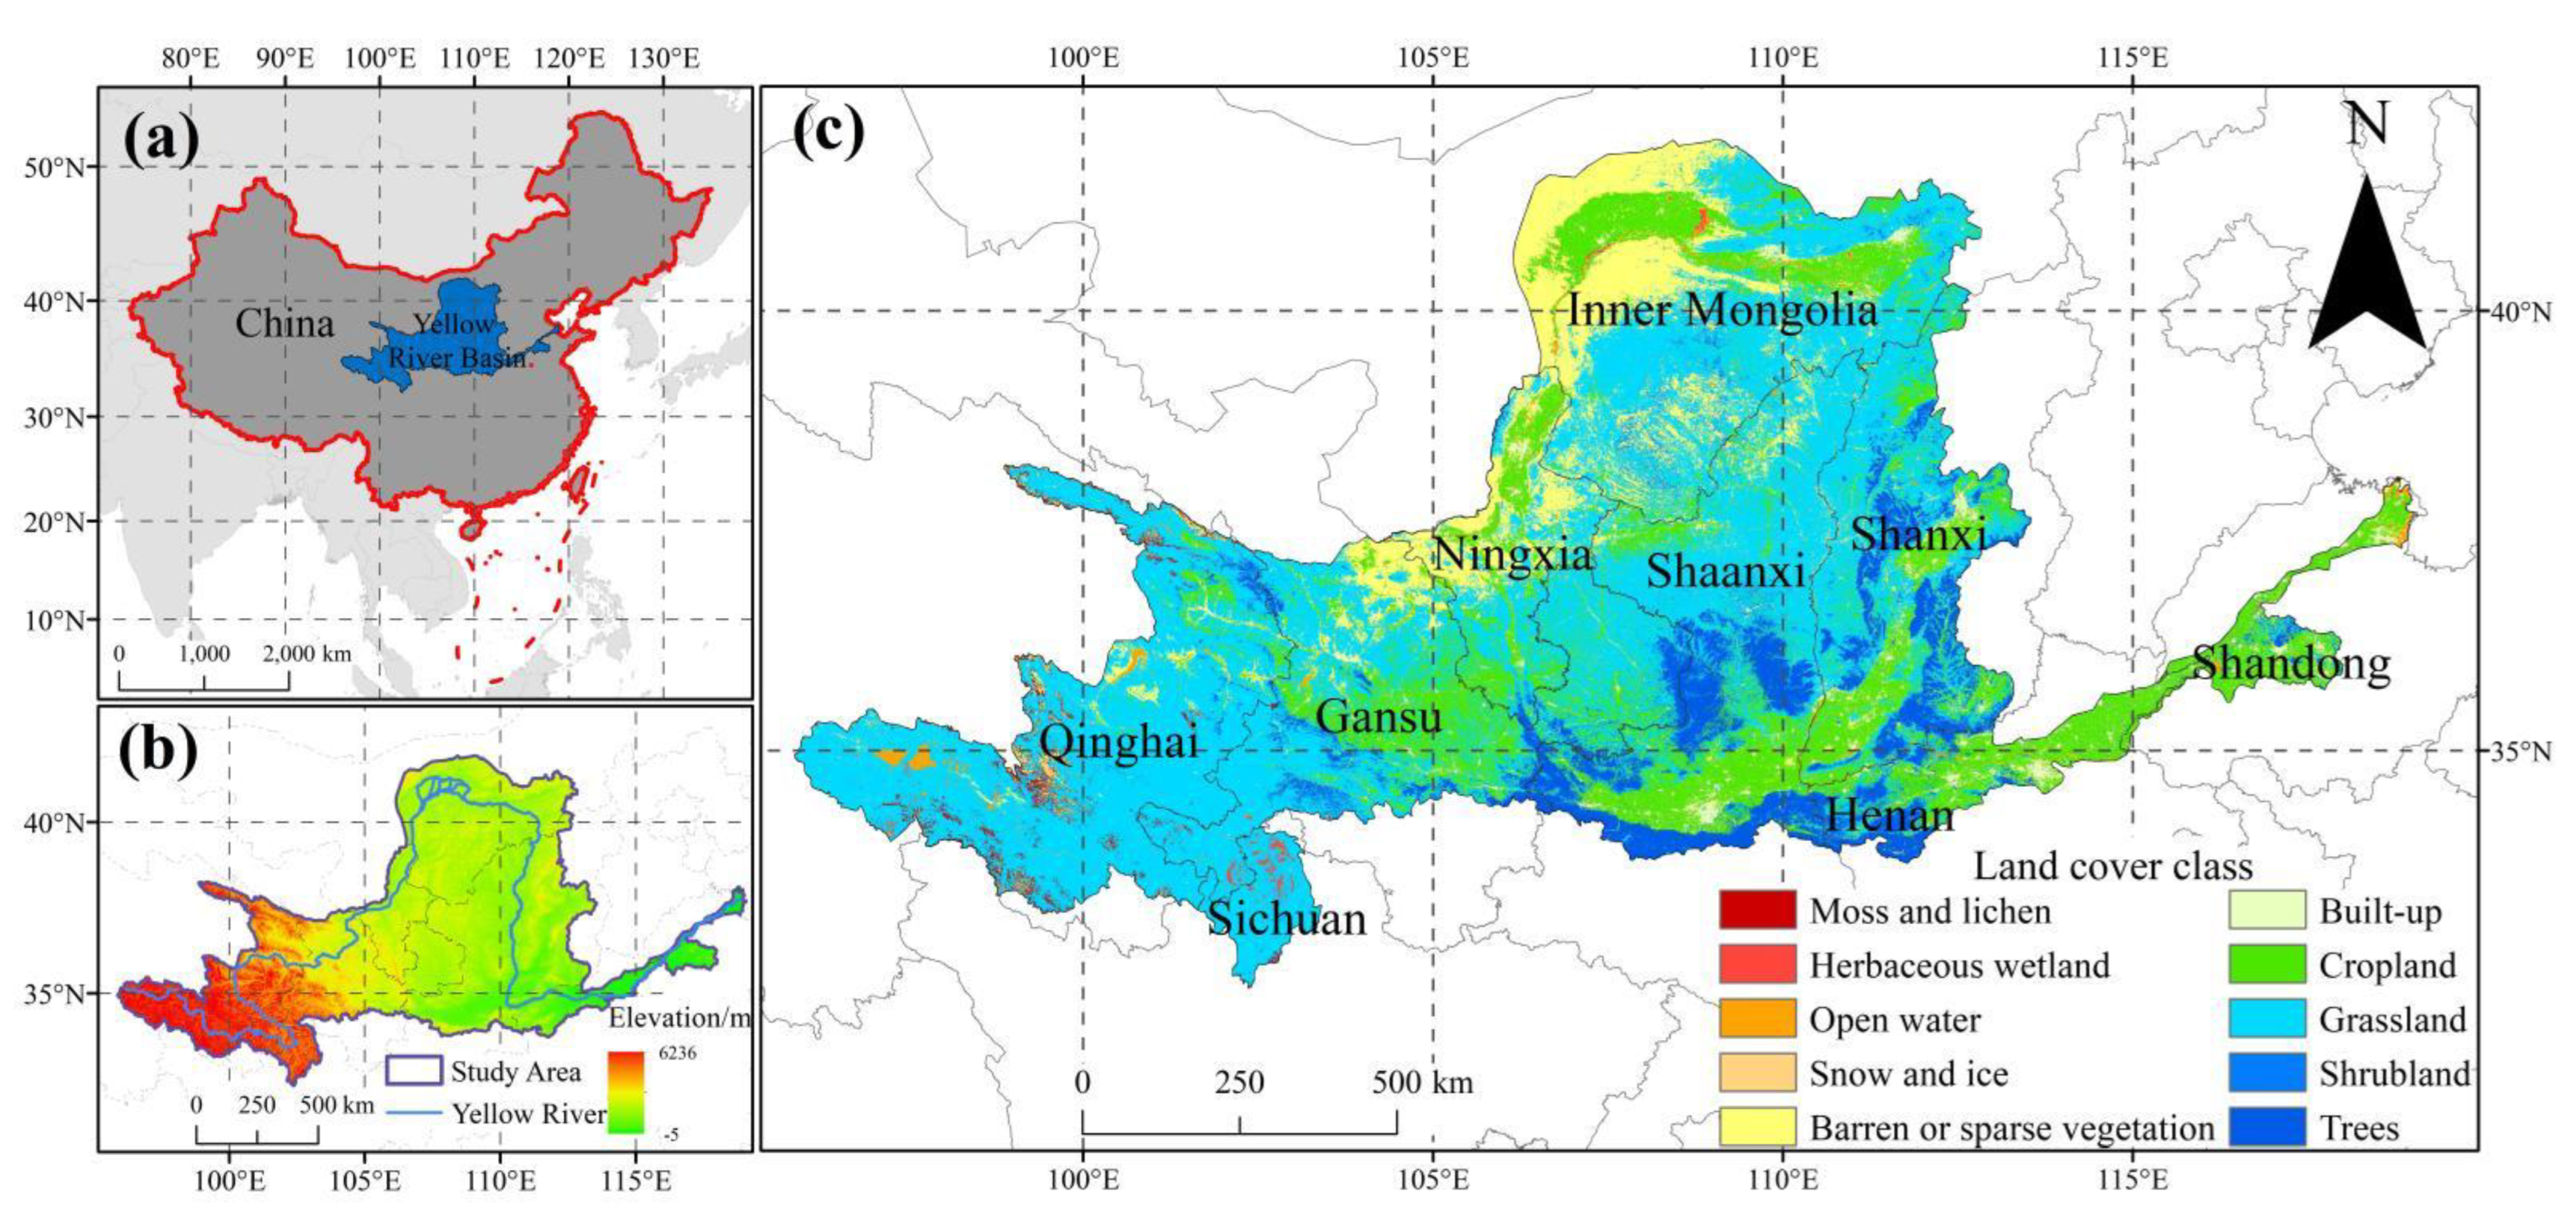
2. Study Area
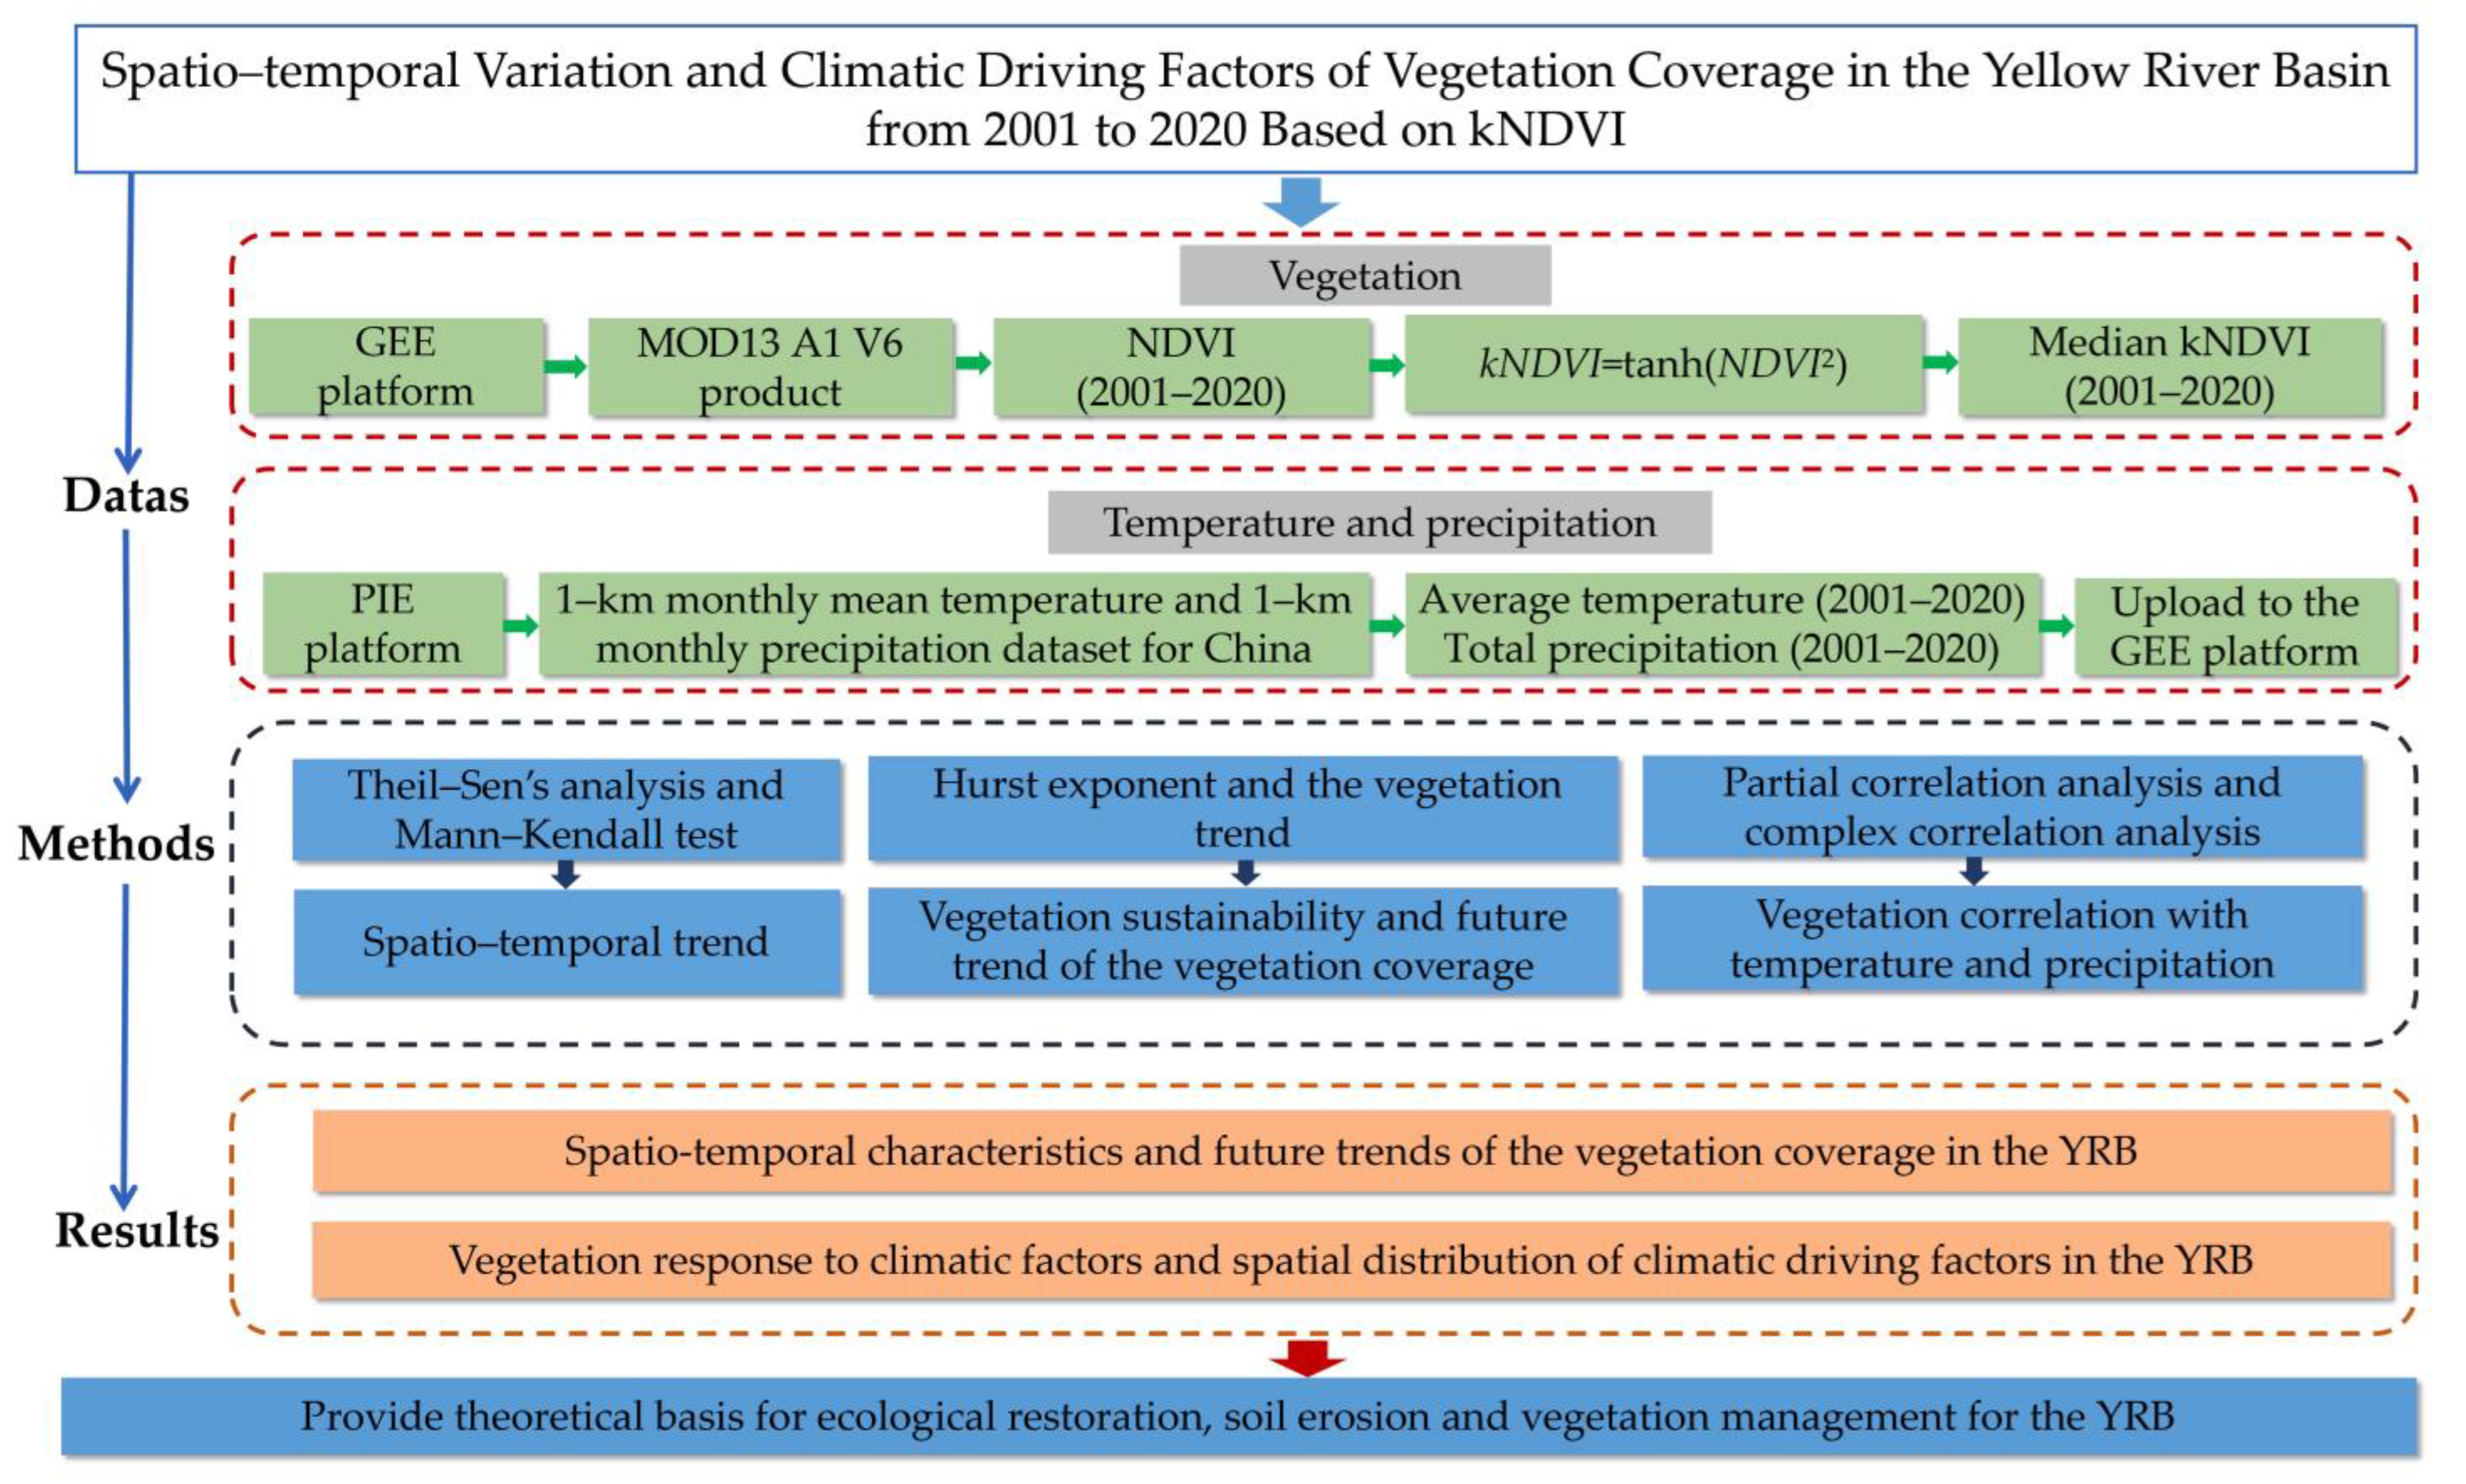
3. Materials and Methods
3.1. Data and Data Collection
3.2. Methods
3.2.1. Spatial–Temporal Variation and Future Trend Analysis
3.2.2. Driving Factor Analysis
4. Results
4.1. Spatio-Temporal Characteristics of the kNDVI
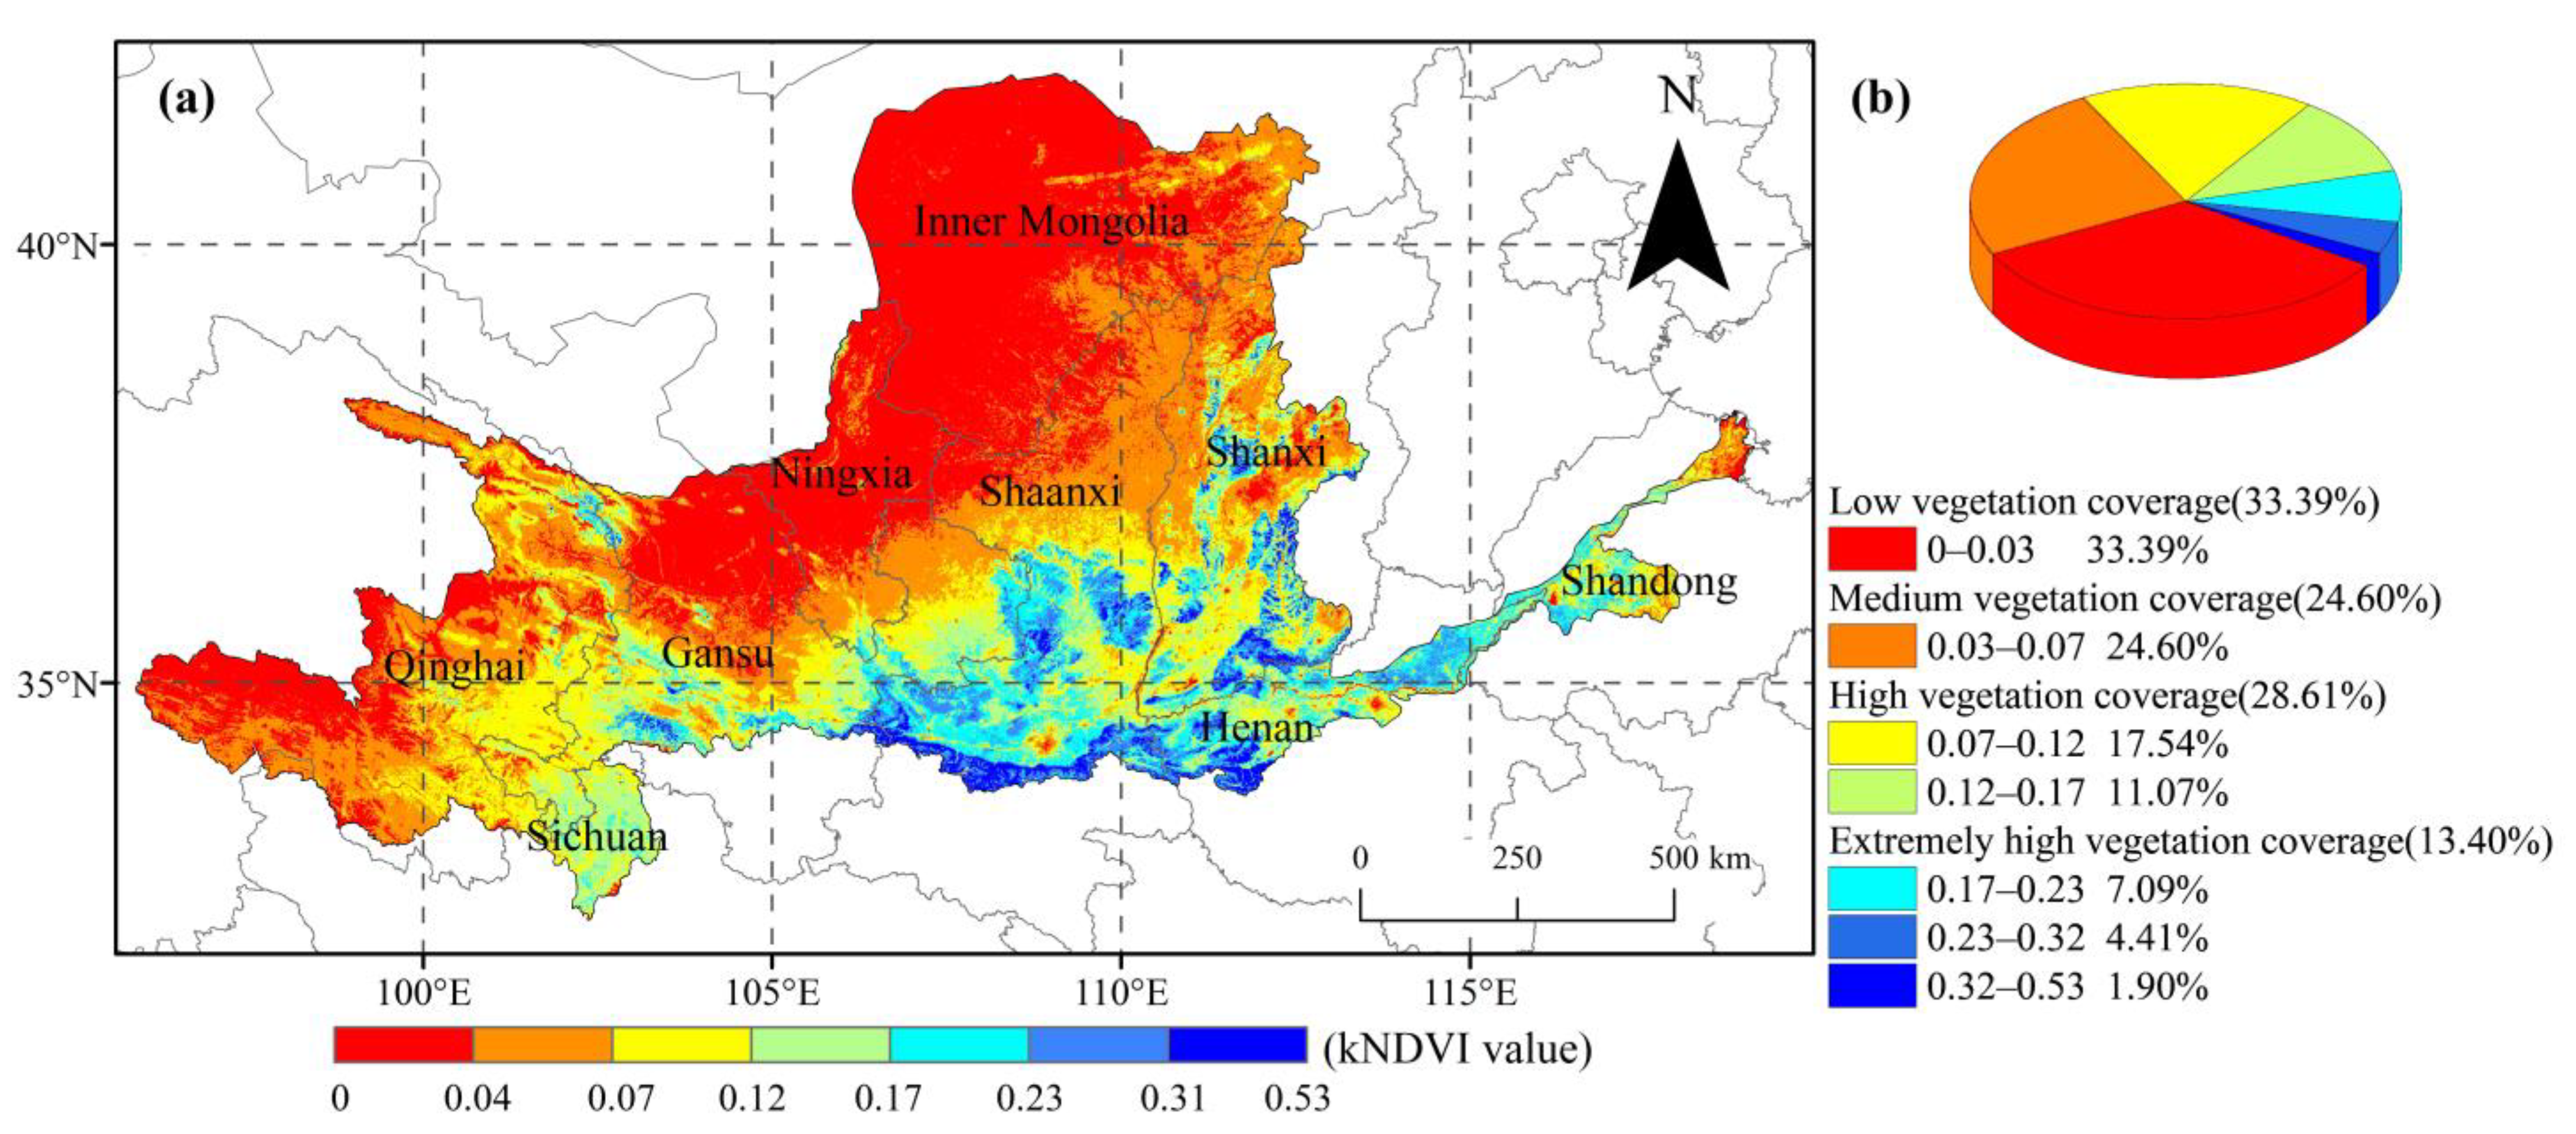
4.1.1. The Spatial Distribution Characteristics of Vegetation Coverage
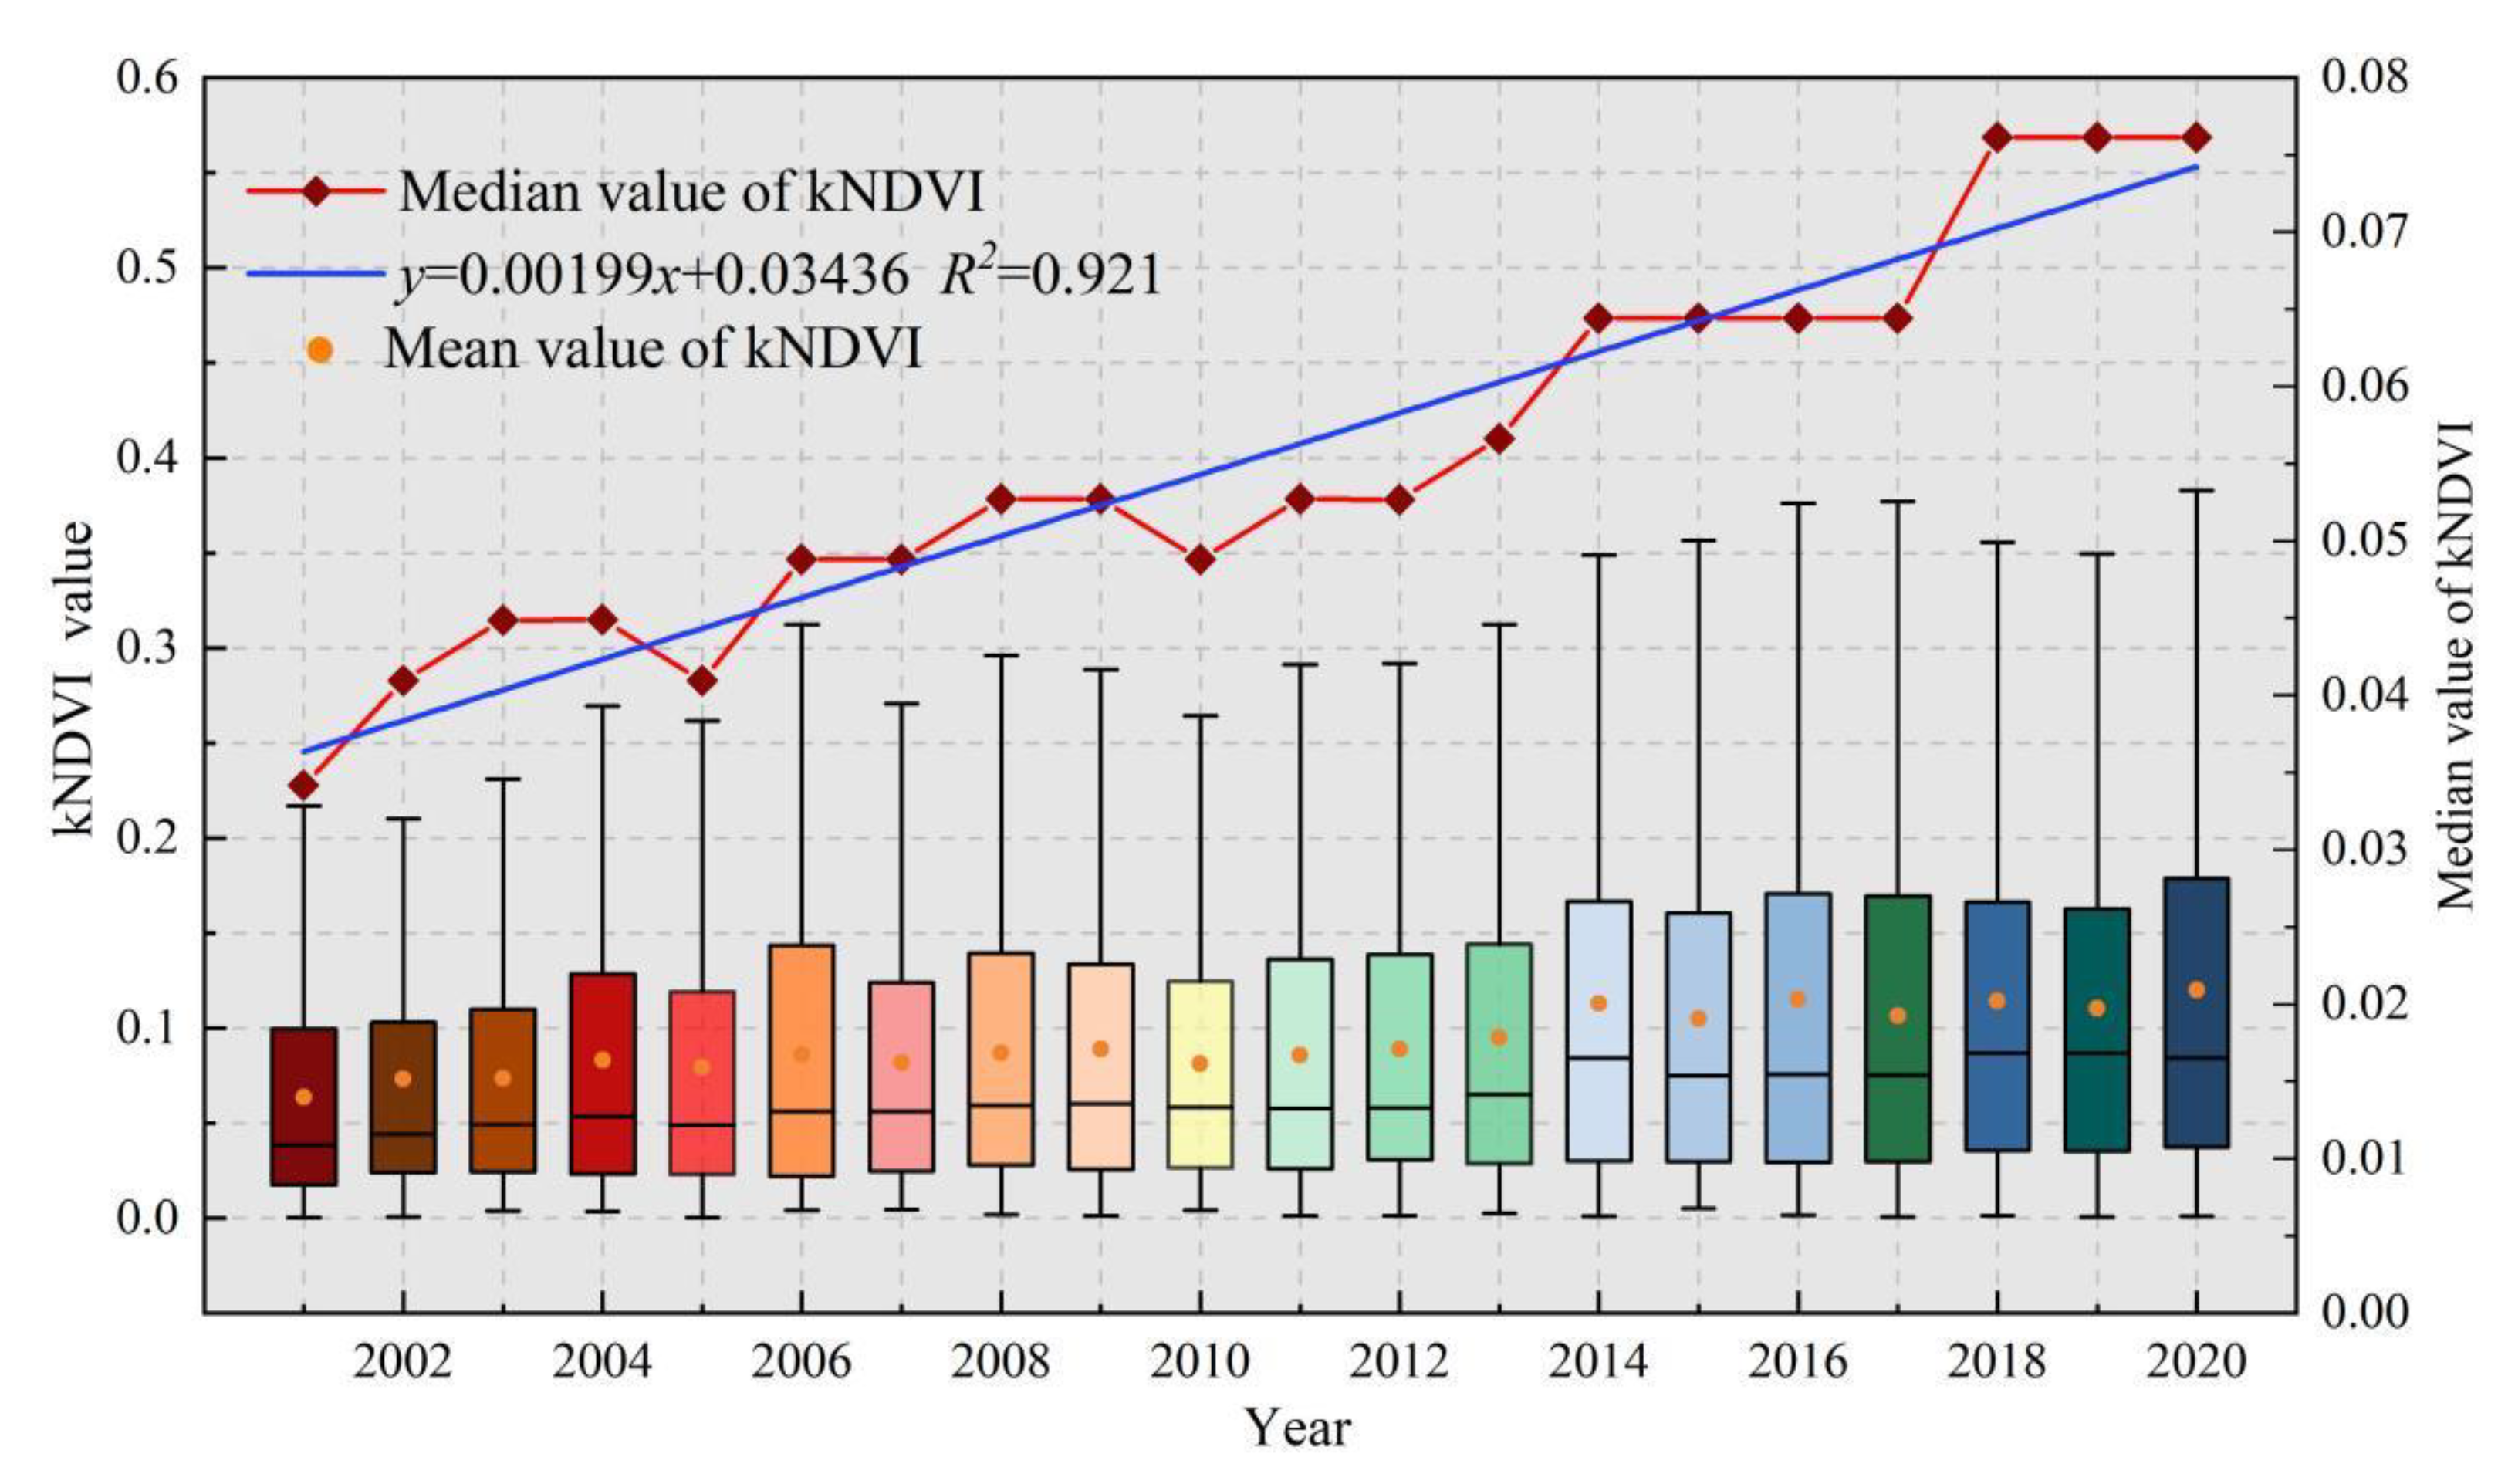
4.1.2. Temporal Variation Characteristics of the Vegetation Coverage
4.1.3. Spatial Variation Characteristics of Vegetation Coverage
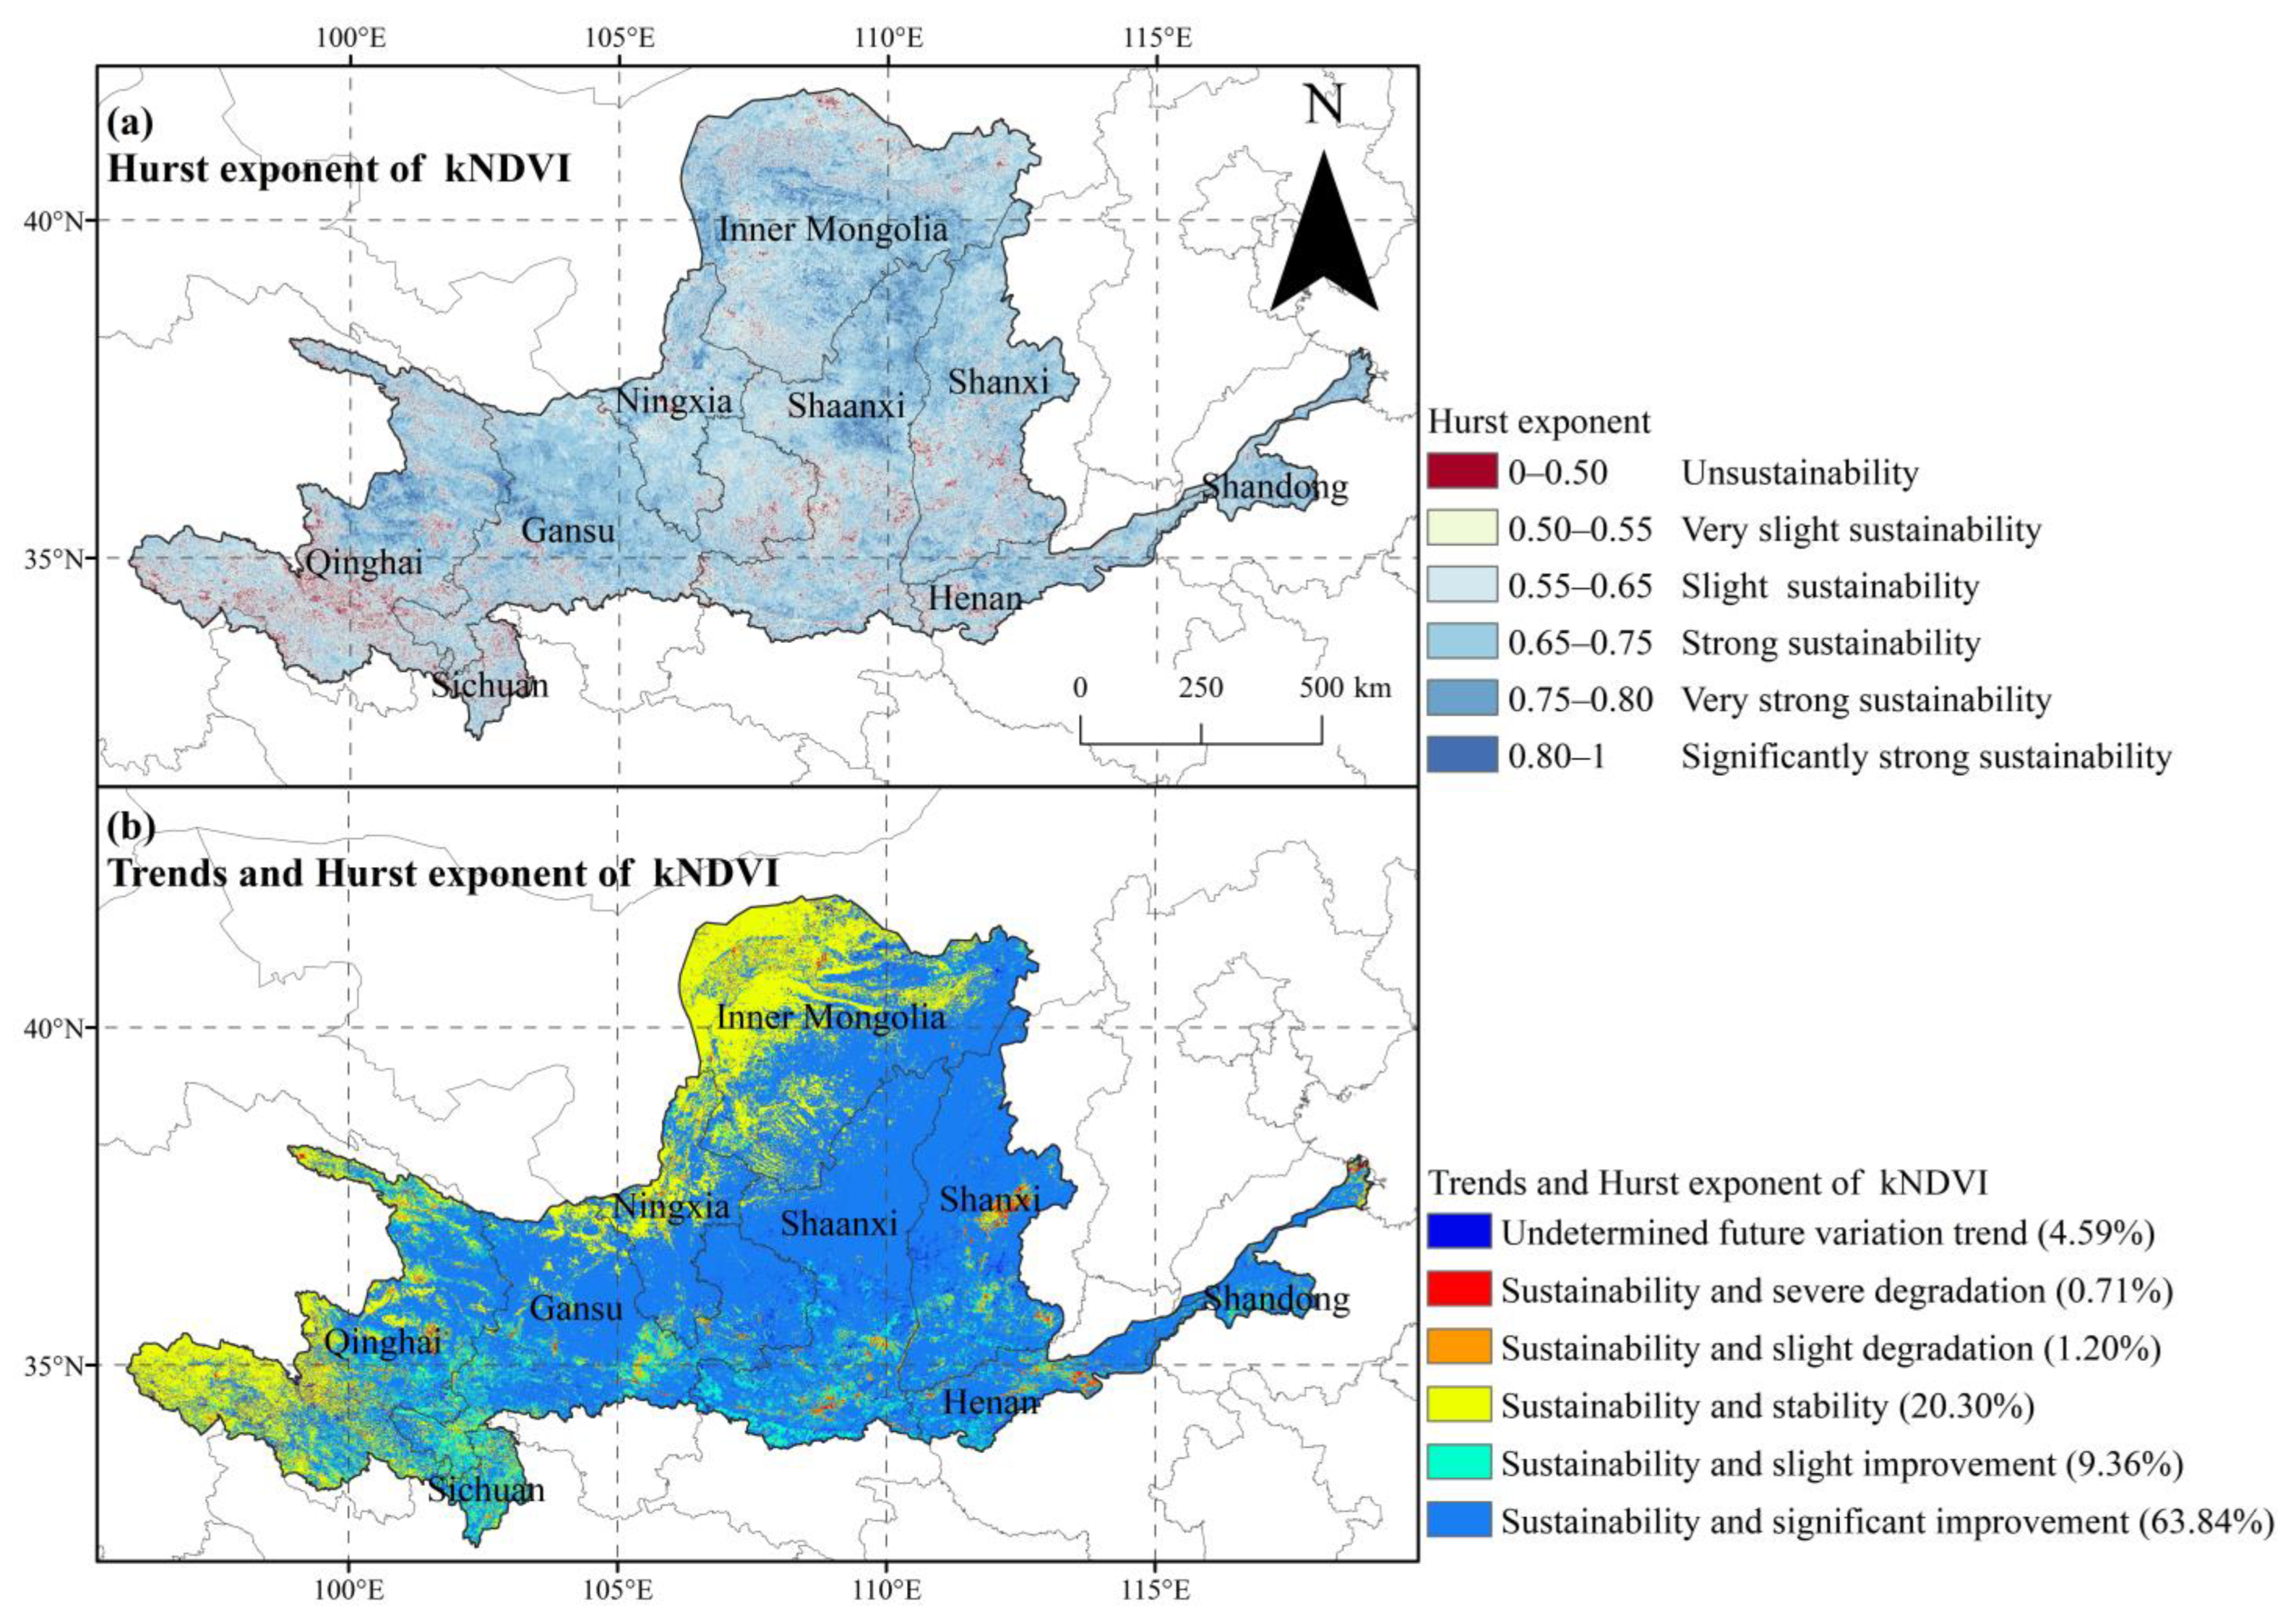
4.1.4. Future Development Trends of the Vegetation Coverage in the YRB
4.2. Driving Factors of Vegetation Coverage
4.2.1. Spatio-Temporal Variation Characteristics of the Meteorological Factors
4.2.2. Partial Correlation Analysis of Relationship between kNDVI and Climatic Factors
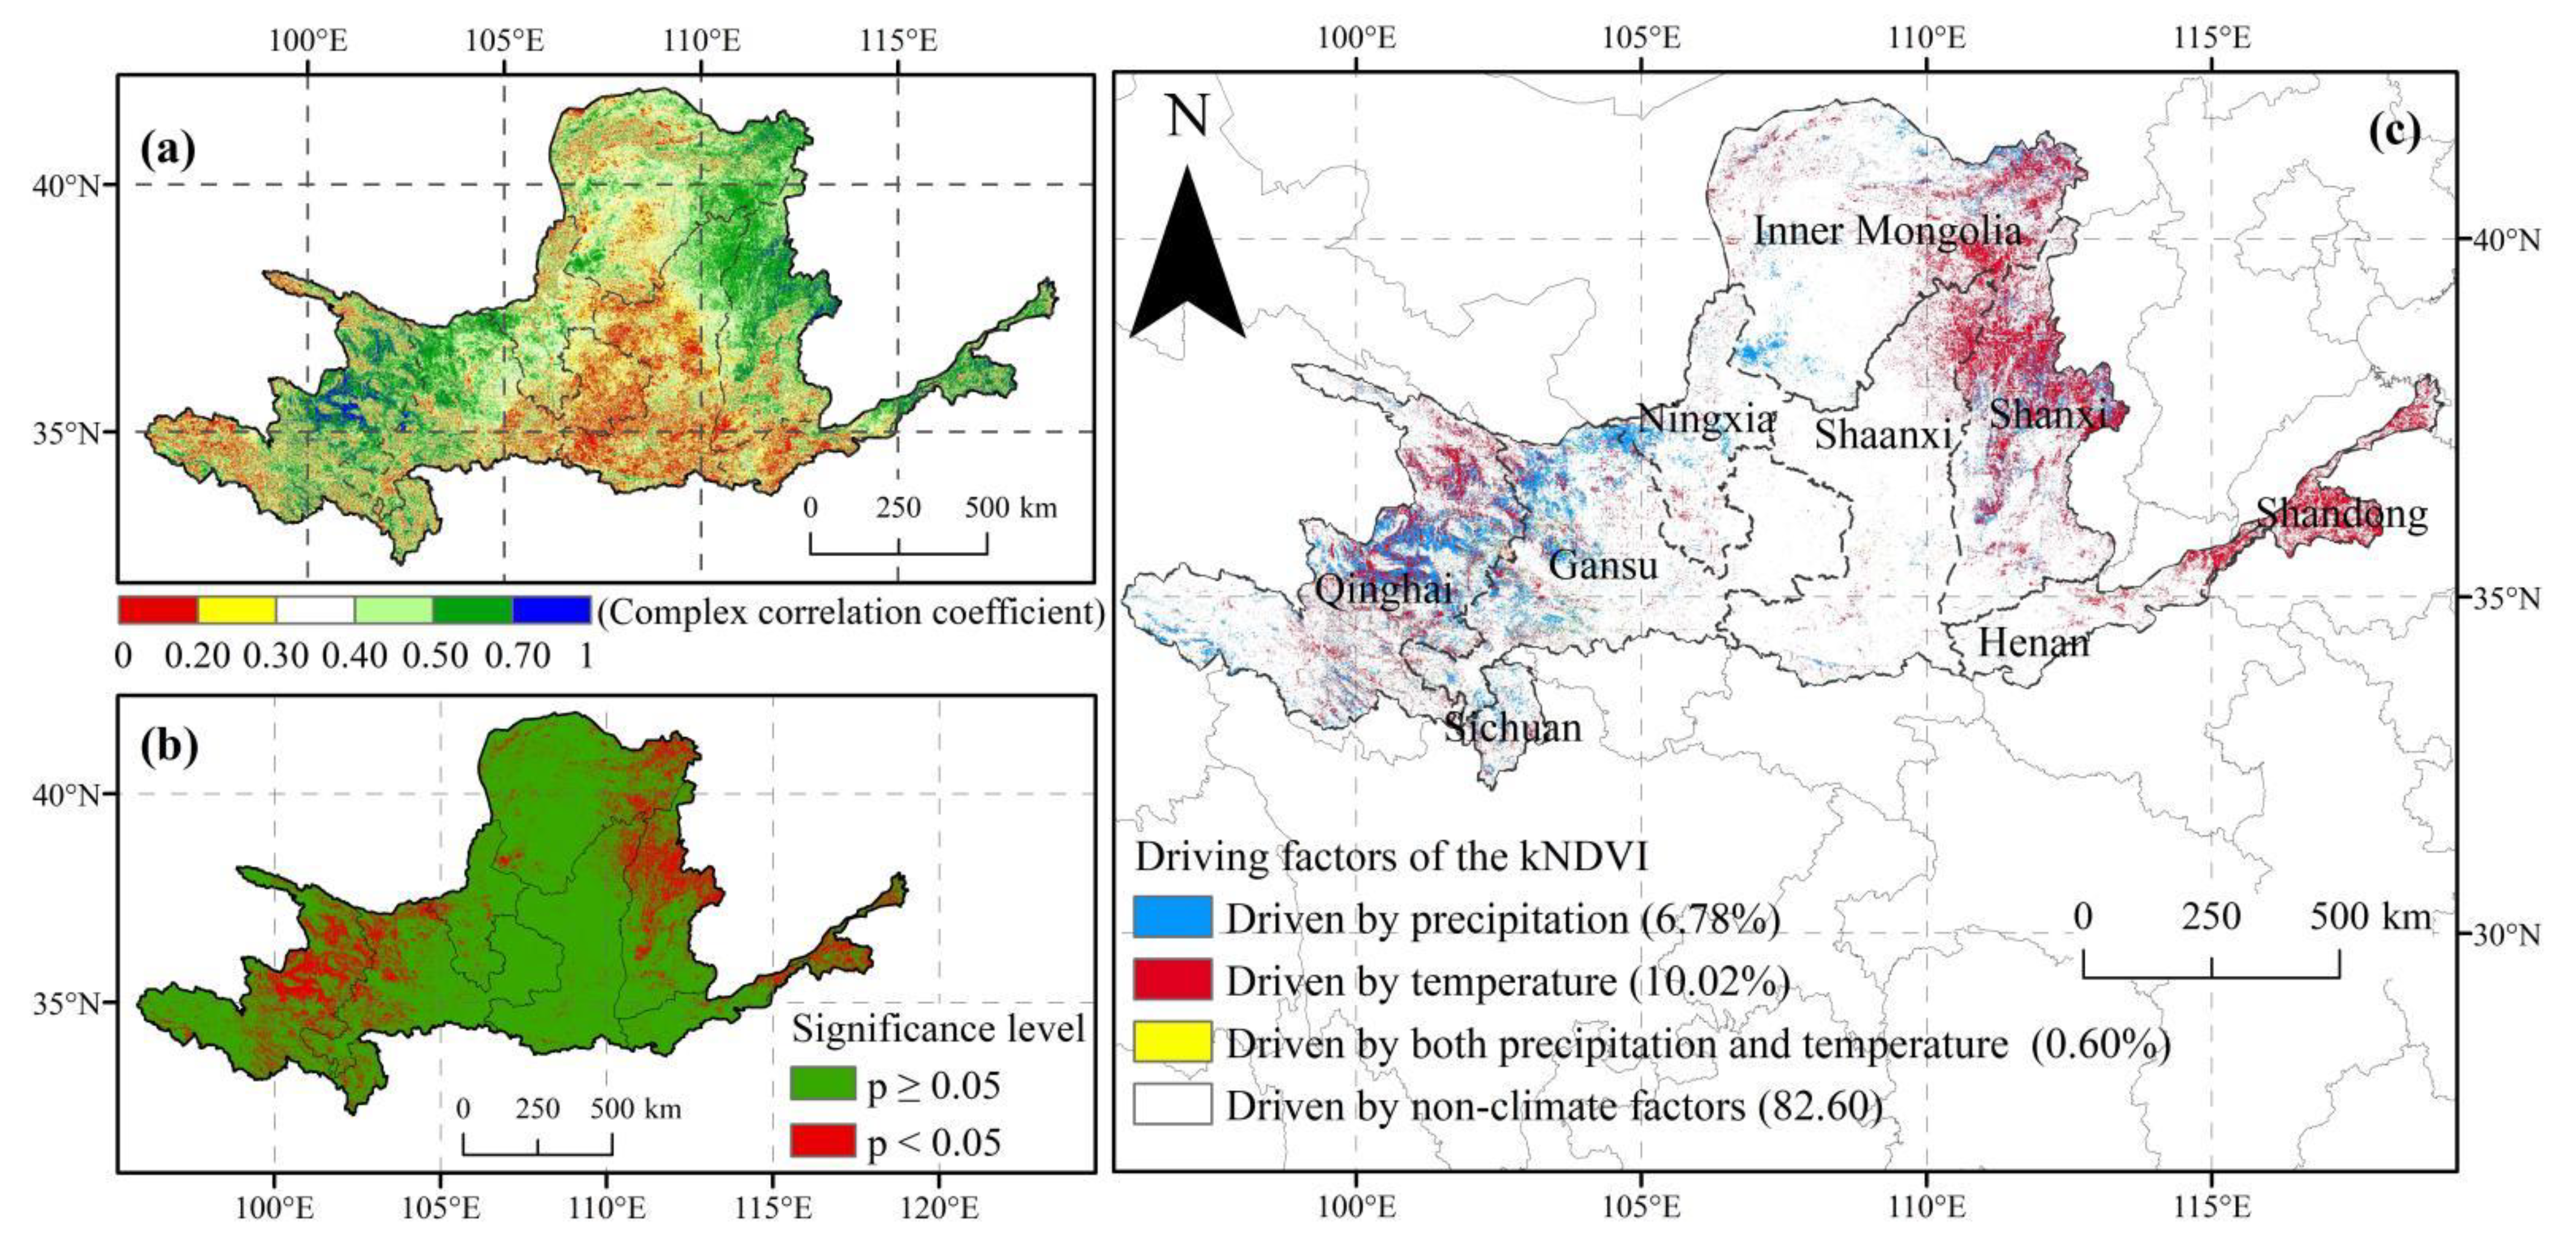
4.2.3. Analysis of Driving Factors of Vegetation Coverage
5. Discussion
5.1. Spatio-Temporal Change in kNDVI
5.2. Driving Factor Analysis of kNDVI
5.3. Limitations and Future Work
6. Conclusions
Author Contributions
Funding
Data Availability Statement
Conflicts of Interest
References
- Chen, G.; Huang, Y.; Chen, J.; Wang, Y. Spatiotemporal Variation of Vegetation Net Primary Productivity and Its Responses to Climate Change in the Huainan Coal Mining Area. J. Indian Soc. Remote Sens. 2019, 47, 1905–1916. [Google Scholar] [CrossRef]
- Zheng, K.; Tan, L.; Sun, Y.; Wu, Y.; Duan, Z.; Xu, Y.; Gao, C. Impacts of climate change and anthropogenic activities on vegetation change: Evidence from typical areas in China. Ecol. Indic. 2021, 126, 107648. [Google Scholar] [CrossRef]
- Zhang, X.; Wang, G.; Xue, B.; Yinglan, A. Changes in vegetation cover and its influencing factors in the inner Mongolia reach of the yellow river basin from 2001 to 2018. Environ. Res. 2022, 215, 114253. [Google Scholar] [CrossRef] [PubMed]
- Zhan, C.; Liang, C.; Zhao, L.; Jiang, S.; Niu, K.; Zhang, Y. Drought-related cumulative and time-lag effects on vegetation dynamics across the Yellow River Basin, China. Ecol. Indic. 2022, 143, 109409. [Google Scholar] [CrossRef]
- Zhang, W.; Wang, L.; Xiang, F.; Qin, W.; Jiang, W. Vegetation dynamics and the relations with climate change at multiple time scales in the Yangtze River and Yellow River Basin, China. Ecol. Indic. 2020, 110, 105892. [Google Scholar] [CrossRef]
- Hua, W.; Chen, H.; Zhou, L.; Xie, Z.; Qin, M.; Li, X.; Ma, H.; Huang, Q.; Sun, S. Observational quantification of climatic and human influences on vegetation greening in China. Remote Sens. 2017, 9, 425. [Google Scholar] [CrossRef] [Green Version]
- Ye, J.; Wang, N.; Sun, M.; Liu, Q.; Ding, N.; Li, M. A New Method for the Rapid Determination of Fire Disturbance Events Using GEE and the VCT Algorithm—A Case Study in Southwestern and Northeastern China. Remote Sens. 2023, 15, 413. [Google Scholar] [CrossRef]
- Stefanidis, S.; Alexandridis, V.; Mallinis, G. A cloud-based mapping approach for assessing spatiotemporal changes in erosion dynamics due to biotic and abiotic disturbances in a Mediterranean Peri-Urban forest. Catena 2022, 218, 106564. [Google Scholar] [CrossRef]
- Ren, Y.; Liu, J.; Liu, S.; Wang, Z.; Liu, T.; Shalamzari, M.J. Effects of climate change on vegetation growth in the Yellow River Basin from 2000 to 2019. Remote Sens. 2022, 14, 687. [Google Scholar] [CrossRef]
- Tangen, B.A.; Bansal, S.; Jones, S.; Dixon, C.S.; Nahlik, A.M.; DeKeyser, E.S.; Hargiss, C.L.; Mushet, D.M. Using a vegetation index to assess wetland condition in the Prairie Pothole Region of North America. Front. Environ. Sci. 2022, 10, 889170. [Google Scholar] [CrossRef]
- Eva, I.; Stephanie, H.; Rasmus, F.; Michael, C. Drought footprint on European ecosystems between 1999 and 2010 assessed by remotely sensed vegetation phenology and productivity. Glob. Chang. Biol. 2014, 20, 581–593. [Google Scholar]
- Hideyuki, N.; Mahito, K.; Sin, M.; Midori, O. Assessing the impact of storm surge flooding on coastal pine forests using a vegetation index. Landsc. Ecol. Eng. 2022, 19, 151–159. [Google Scholar]
- Liao, W.; Nie, X.; Zhang, Z. Interval association of remote sensing ecological index in China based on concept lattice. Environ. Sci. Pollut. Res. Int. 2022, 29, 34194–34208. [Google Scholar] [CrossRef]
- Xia, W.; Xiaojie, Y.; Changzheng, J.; Wei, D. Dynamic monitoring and analysis of factors influencing ecological environment quality in northern Anhui, China, based on the Google Earth Engine. Sci. Rep. 2022, 12, 20307. [Google Scholar]
- Faour, G.; Mhawej, M.; Nasrallah, A. Global trends analysis of the main vegetation types throughout the past four decades. Appl. Geogr. 2018, 97, 184–195. [Google Scholar] [CrossRef]
- Tian, H.; Ji, X.; Zhang, F. Spatiotemporal Variations of Vegetation Net Primary Productivity and Its Response to Meteorological Factors Across the Yellow River Basin During the Period 1981–2020. Front. Environ. Sci. 2022, 10, 1981–2020. [Google Scholar] [CrossRef]
- Alam, S.S.; Qingmin, M. Use time series NDVI and EVI to develop dynamic crop growth metrics for yield modeling. Ecol. Indic. 2020, 121, 107124. [Google Scholar]
- Zhao, W.; Luo, T.; Wei, H.; Alamu; Zhang, L. Relative impact of climate change and grazing on NDVI changes in grassland in the Mt. Qomolangma Nature Reserve and Adjacent Regions during 2000–2018. Diversity 2022, 14, 171. [Google Scholar] [CrossRef]
- Xiong, Y.; Wang, H. Spatial relationships between NDVI and topographic factors at multiple scales in a watershed of the Minjiang River, China. Ecol. Inform. 2022, 69, 101617. [Google Scholar] [CrossRef]
- Jin, H.; Chen, X.; Wang, Y.; Zhong, R.; Zhao, T.; Liu, Z.; Tu, X. Spatio-temporal distribution of NDVI and its influencing factors in China. J. Hydrol. 2021, 603, 127129. [Google Scholar] [CrossRef]
- Alencar, A.; Shimbo, J.Z.; Lenti, F.; Marques, C.B.; Zimbres, B.; Rosa, M.; Arruda, V.; Castro, I.; Ribeiro, J.P.F.M.; Varela, V.; et al. Mapping three decades of changes in the Brazilian Savanna Native Vegetation using Landsat data processed in the Google Earth Engine platform. Remote Sens. 2020, 12, 924. [Google Scholar] [CrossRef] [Green Version]
- Camps-Valls, G.; Campos-Taberner, M.; Moreno-Martínez, Á.; Walther, S.; Duveiller, G.; Cescatti, A.; Mahecha, M.D.; Muñoz-Marí, J.; García-Haro, F.J.; Guanter, L.; et al. A unified vegetation index for quantifying the terrestrial biosphere. Sci. Adv. 2021, 7, eabc7447. [Google Scholar] [CrossRef] [PubMed]
- Luis, R.Á.J.; Manel, M.R.; Jordi, M.M.; Gustau, C.V. Digital Signal Processing with Kernel Methods; John Wiley & Sons, Ltd.: Hoboken, NJ, USA, 2018. [Google Scholar]
- Gustavo, C.V.; Lorenzo, B. Kernel Methods for Remote Sensing Data Analysis; John Wiley & Sons, Ltd.: New York, NY, USA, 2009. [Google Scholar]
- Gensheimer, J.; Turner, A.J.; Köhler, P.; Frankenberg, C.; Chen, J. A convolutional neural network for spatial downscaling of satellite-based solar-induced chlorophyll fluorescence (SIFnet). Biogeosciences 2022, 19, 1777–1793. [Google Scholar] [CrossRef]
- Forzieri, G.; Dakos, V.; McDowell, N.G.; Ramdane, A.; Cescatti, A. Emerging signals of declining forest resilience under climate change. Nature 2022, 608, 534–539. [Google Scholar] [CrossRef] [PubMed]
- Liu, Y.; Zhao, W.; Chen, S.; Ye, T. Mapping crop rotation by using deeply synergistic optical and SAR time series. Remote Sens. 2021, 13, 4160. [Google Scholar] [CrossRef]
- Wang, X.; Biederman, J.A.; Knowles, J.F.; Scott, R.L.; Turner, A.J.; Dannenberg, M.P.; Köhler, P.; Frankenberg, C.; Litvak, M.E.; Flerchinger, G.N.; et al. Satellite solar-induced chlorophyll fluorescence and near-infrared reflectance capture complementary aspects of dryland vegetation productivity dynamics. Remote Sens. Environ. 2022, 270, 112858. [Google Scholar] [CrossRef]
- Jiang, W.; Yuan, L.; Wang, W.; Cao, R.; Zhang, Y.; Shen, W. Spatio-temporal analysis of vegetation variation in the Yellow River Basin. Ecol. Indic. 2015, 51, 117–126. [Google Scholar] [CrossRef]
- Cheng, Y.; Zhang, L.; Zhang, Z.; Li, X.; Wang, H.; Xi, X. Spatiotemporal variation and influence factors of vegetation cover in the Yellow River Basin (1982–2021) based on GIMMS NDVI and MOD13A1. Water-Sui. 2022, 14, 3274. [Google Scholar] [CrossRef]
- Han, Z.; Wu, Q.; Lai, R.; Hyder, S.S.E.; Hou, D.; Hu, C. Spatio-temporal variations of vegetation cover and its influence on surface air temperature change over the Yellow River Basin, China. J. Water Clim. Chang. 2022, 13, 3239–3252. [Google Scholar] [CrossRef]
- Wang, H.; He, L.; Yin, J.; Yu, Z.; Liu, S.; Yan, D. Effects of effective precipitation and accumulated temperature on the terrestrial EVI (Enhanced Vegetation Index) in the Yellow River Basin, China. Atmosphere 2022, 13, 1555. [Google Scholar] [CrossRef]
- Han, J.; Zhang, X.; Wang, J.; Zhai, J. Geographic exploration of the driving forces of the NDVI spatial differentiation in the Upper Yellow River Basin from 2000 to 2020. Sustainability 2023, 15, 1922. [Google Scholar] [CrossRef]
- Zhang, Y.; Ye, A. Spatial and temporal variations in vegetation coverage observed using AVHRR GIMMS and Terra MODIS data in the mainland of China. Int. J. Remote. Sens. 2020, 41, 4238–4268. [Google Scholar] [CrossRef]
- Liu, C.; Zhang, X.; Wang, T.; Chen, G.; Zhu, K.; Wang, Q.; Wang, J. Detection of vegetation coverage changes in the Yellow River Basin from 2003 to 2020. Ecol. Indic. 2022, 138, 108818. [Google Scholar] [CrossRef]
- Zhou, X.; Yang, Y.; Sheng, Z.; Zhang, Y. Reconstructed natural runoff helps to quantify the relationship between upstream water use and downstream water scarcity in China’s river basins. Hydrol. Earth Syst. Sc. 2019, 23, 2491–2505. [Google Scholar] [CrossRef] [Green Version]
- Sun, P. The effect of a small initial distortion of the basic flow on the subcritical transition in plane Poiseuille flow. Q. Appl. Math. 2001, 59, 667–699. [Google Scholar] [CrossRef] [Green Version]
- Wang, X.; Shi, S.; Zhao, X.; Hu, Z.; Hou, M.; Xu, L. Detecting spatially non-stationary between vegetation and related factors in the Yellow River Basin from 1986 to 2021 using multiscale geographically weighted regression based on Landsat. Remote Sens. 2022, 14, 6276. [Google Scholar] [CrossRef]
- Yang, Z.; Tian, J.; Su, W.; Wu, J.; Liu, J.; Liu, W.; Guo, R. Analysis of ecological environmental quality change in the Yellow River Basin using the remote sensing based ecological index. Sustainability 2022, 14, 10726. [Google Scholar] [CrossRef]
- Peng, S. 1-km Monthly Mean Temperature Dataset for China (1901–2020); National Tibetan Plateau Data Center: Beijing, China, 2019. [Google Scholar]
- Peng, S. 1-km Monthly Precipitation Dataset for China (1901–2020); National Tibetan Plateau Data Center: Beijing, China, 2020. [Google Scholar]
- Zhang, X.; Liu, Y.; Chen, X.; Long, L.; Su, Y.; Yu, X.; Zhang, H.; Chen, Y.; An, S. Analysis of spatial and temporal changes of vegetation cover and its driving forces in the Huainan mining area. Environ. Sci. Pollut. Res. 2022, 29, 60117–60132. [Google Scholar] [CrossRef]
- Fensholt, R.; Langanke, T.; Rasmussen, K.; Reenberg, A.; Prince, S.D.; Tucker, C.; Scholes, R.J.; Le, Q.B.; Bondeau, A.; Eastman, R.; et al. Greenness in semi-arid areas across the globe 1981–2007—An Earth Observing Satellite based analysis of trends and drivers. Remote Sens. Environ. 2012, 121, 144–158. [Google Scholar] [CrossRef]
- Liu, Z.; Wang, H.; Li, N.; Zhu, J.; Pan, Z.; Qin, F. Spatial and temporal characteristics and driving forces of vegetation changes in the Huaihe River Basin from 2003 to 2018. Sustainability 2020, 12, 2198. [Google Scholar] [CrossRef] [Green Version]
- Tošić, I. Spatial and temporal variability of winter and summer precipitation over Serbia and Montenegro. Theor. Appl. Climatol. 2004, 77, 47–56. [Google Scholar] [CrossRef]
- Zuo, Y.; Li, Y.; He, K.; Wen, Y. Temporal and spatial variation characteristics of vegetation coverage and quantitative analysis of its potential driving forces in the Qilian Mountains, China, 2000–2020. Ecol. Indic. 2022, 143, 109429. [Google Scholar] [CrossRef]
- Zhu, Y.; Zhang, S.; Luo, P.; Su, F.; Sun, B.; Liang, L.; Guo, J.; Yang, R. Assessing ecohydrological factors variations and their relationships at different spatio-temporal scales in semiarid area, northwestern China. Adv. Space Res. 2021, 67, 2368–2381. [Google Scholar] [CrossRef]
- Li, M.; Yin, L.; Zhang, Y.; Su, X.; Liu, G.; Wang, X.; Au, Y.; Wu, X. Spatio-temporal dynamics of fractional vegetation coverage based on MODIS-EVI and its driving factors in Southwest China. Acta Ecol. Sin. 2021, 41, 1138–1147. [Google Scholar]
- Xu, B.; Li, J.; Luo, Z.; Wu, J.; Liu, Y.; Yang, H.; Pei, X. Analyzing the Spatiotemporal Vegetation Dynamics and Their Responses to Climate Change along the Ya’an–Linzhi Section of the Sichuan–Tibet Railway. Remote Sens. 2022, 14, 3584. [Google Scholar] [CrossRef]
- Wang, J.; Fan, Y.; Yang, Y.; Zhang, L.; Zhang, Y.; Li, S.; Wei, Y. Spatial-temporal evolution characteristics and driving force analysis of NDVI in the Minjiang River Basin, China, from 2001 to 2020. Water 2022, 14, 2923. [Google Scholar] [CrossRef]
- Li, Q.; Cao, Y.; Miao, S. Spatio-temporal variation in vegetation coverage and its response to climate factors in the Yellow River Basin, China. Acta Ecol. Sin. 2022, 42, 4041–4054. [Google Scholar]
- Liu, H.; Song, X.; Wen, W.; Jia, Q.; Zhu, D. Quantitative effects of climate change on vegetation dynamics in alpine grassland of Qinghai-Tibet Plateau in a county. Atmosphere 2022, 13, 324. [Google Scholar] [CrossRef]
- Jian, S.; Zhang, Q.; Wang, H. Spatial–temporal trends in and attribution analysis of vegetation change in the Yellow River Basin, China. Remote Sens. 2022, 14, 4607. [Google Scholar] [CrossRef]
- Li, Z.; Sun, X.; Huang, Z.; Zhang, X.; Wang, Z.; Li, S.; Zheng, W.; Zhai, B. Changes in nutrient balance, environmental effects, and green development after returning farmland to forests: A case study in Ningxia, China. Sci. Total Environ. 2020, 735, 139370. [Google Scholar] [CrossRef]
- Zheng, K.; Wei, J.; Pei, J.; Cheng, H.; Zhang, X.; Huang, F.; Li, F.; Ye, J. Impacts of climate change and human activities on grassland vegetation variation in the Chinese Loess Plateau. Sci. Total Environ. 2019, 660, 236–244. [Google Scholar] [CrossRef] [PubMed]
- Song, C.; Liu, Q.; Song, J.; Jiang, Z.; Lu, Z.; Chen, Y. Land use efficiency in the Yellow River Basin in the background of China’s economic transformation: Spatial-temporal characteristics and influencing factors. Land 2022, 11, 2306. [Google Scholar] [CrossRef]
- Jiang, W.; Niu, Z.; Wang, L.; Yao, R.; Gui, X.; Xiang, F.; Ji, Y. Impacts of drought and climatic factors on vegetation dynamics in the Yellow River Basin and Yangtze River Basin, China. Remote Sens. 2022, 14, 930. [Google Scholar] [CrossRef]
- Chen, K.; Han, Y.; Cao, S.; Ma, J.; Cao, G.; Lu, H. The study of vegetation carbon storage in Qinghai Lake Valley based on remote sensing and CASA Model. Procedia Environ. Sci. 2011, 10, 1568–1574. [Google Scholar]
- Zhao, A.; Zhang, A.; Lu, C.; Wang, D.; Wang, H.; Liu, H. Spatiotemporal variation of vegetation coverage before and after implementation of Grain for Green Program in Loess Plateau, China. Ecol. Eng. 2017, 104, 13–22. [Google Scholar] [CrossRef]
- Li, S.; Liang, W.; Fu, B.; Lü, Y.; Fu, S.; Wang, S.; Su, H. Vegetation changes in recent large-scale ecological restoration projects and subsequent impact on water resources in China’s Loess Plateau. Sci. Total Environ. 2016, 569–570, 1032–1039. [Google Scholar] [CrossRef]
- Liu, C.; Liu, B.; Zhao, W.; Zhu, Z. Temporal and spatial variability of water use efficiency of vegetation and its response to precipitation and temperature in Heihe River Basin. Acta Ecol. Sin. 2020, 40, 1–12. [Google Scholar]
- Wu, M.; He, H.; Zong, S.; Tan, X.; Du, H.; Zhao, D.; Liu, K.; Liang, Y. Topographic Controls on Vegetation Changes in Alpine Tundra of the Changbai Mountains. Forests 2018, 9, 756. [Google Scholar] [CrossRef] [Green Version]
- Deng, X.; Wu, L.; He, C.; Shao, H. Study on Spatiotemporal Variation Pattern of Vegetation Coverage on Qinghai–Tibet Plateau and the Analysis of Its Climate Driving Factors. Int. J. Env. Res. Public Health 2022, 19, 8836. [Google Scholar] [CrossRef]
- Huang, K.; Zhang, Y.; Zhu, J.; Liu, Y.; Zu, J.; Zhang, J. The Influences of Climate Change and Human Activities on Vegetation Dynamics in the Qinghai-Tibet Plateau. Remote Sens. 2016, 8, 876. [Google Scholar] [CrossRef] [Green Version]
- Florinsky, I.V.; Kuryakova, G.A. Influence of topography on some vegetation cover properties. Catena 1996, 27, 123–141. [Google Scholar] [CrossRef]
- Qiu, Y.; Fu, B.; Wang, J.; Chen, L. Spatial variability of soil moisture content and its relation to environmental indices in a semi-arid gully catchment of the Loess Plateau, China. J. Arid Environ. 2001, 49, 723–750. [Google Scholar] [CrossRef] [Green Version]


| Type of Driving Factor | Classification Basis | ||
|---|---|---|---|
| RT·kNDVI-P | RP·kNDVI-T | RkNDVI-T-P | |
| Driven by precipitation | |t| > t0.05 | F > F0.05 | |
| Driven by temperature | |t| > t0.05 | F > F0.05 | |
| Driven by both temperature and precipitation | |t| < t0.05 | |t| < t0.05 | F > F0.05 |
| Driven by non-climate factors | F < F0.05 | ||
| SkNDVI | ZS Value | kNDVI Trends | Area Percentage/% |
|---|---|---|---|
| ≥0.0005 | ≥1.96 | Significantly improved | 65.67 |
| ≥0.0005 | −1.96–1.96 | Slightly improved | 10.22 |
| −0.0005–0.0005 | −1.96–1.96 | Stable | 22.05 |
| ≤−0.0005 | −1.96–1.96 | Slightly degraded | 1.31 |
| ≤−0.0005 | ≤−1.96 | Severely degraded | 0.75 |
Disclaimer/Publisher’s Note: The statements, opinions and data contained in all publications are solely those of the individual author(s) and contributor(s) and not of MDPI and/or the editor(s). MDPI and/or the editor(s) disclaim responsibility for any injury to people or property resulting from any ideas, methods, instructions or products referred to in the content. |
© 2023 by the authors. Licensee MDPI, Basel, Switzerland. This article is an open access article distributed under the terms and conditions of the Creative Commons Attribution (CC BY) license (https://creativecommons.org/licenses/by/4.0/).
Share and Cite
Feng, X.; Tian, J.; Wang, Y.; Wu, J.; Liu, J.; Ya, Q.; Li, Z. Spatio-Temporal Variation and Climatic Driving Factors of Vegetation Coverage in the Yellow River Basin from 2001 to 2020 Based on kNDVI. Forests 2023, 14, 620. https://doi.org/10.3390/f14030620
Feng X, Tian J, Wang Y, Wu J, Liu J, Ya Q, Li Z. Spatio-Temporal Variation and Climatic Driving Factors of Vegetation Coverage in the Yellow River Basin from 2001 to 2020 Based on kNDVI. Forests. 2023; 14(3):620. https://doi.org/10.3390/f14030620
Chicago/Turabian StyleFeng, Xuejuan, Jia Tian, Yingxuan Wang, Jingjing Wu, Jie Liu, Qian Ya, and Zishuo Li. 2023. "Spatio-Temporal Variation and Climatic Driving Factors of Vegetation Coverage in the Yellow River Basin from 2001 to 2020 Based on kNDVI" Forests 14, no. 3: 620. https://doi.org/10.3390/f14030620