Article

Roots, Litter, and Seasonal Drought Together Inhibit Plant Growth in the Herbaceous Layer in a Subtropical Moist Forest of Southwestern China

1
School of Chemistry, Biology and Environment, Yuxi Normal University, Yuxi 653100, China
2
Institute of Biology and Environmental Engineering, Yuxi Normal University, Yuxi 653100, China
3
Departments of Plant Pathology, Odum School of Ecology, University of Georgia, Athens, GA 30601, USA
4
Department of Biology, University of Florida, Gainesville, FL 32605, USA
5
Department of Geological Sciences, University of North Carolina, Chapel Hill, NC 27599, USA
*
Author to whom correspondence should be addressed.
Forests 2023, 14(4), 712; https://doi.org/10.3390/f14040712
Submission received: 21 February 2023 / Revised: 23 March 2023 / Accepted: 28 March 2023 / Published: 30 March 2023
(This article belongs to the Section Forest Meteorology and Climate Change)

Abstract

:
The mechanisms of the maintenance of plant diversity in forests have been extensively studied because of their ecological importance. The study of the regeneration and growth dynamics of herbaceous understory communities in forests is relatively more common than that of woody plant overstory and understory communities. To investigate which environmental factors (plant roots, forest litter, or both) control seedling survival, growth, and production in the herbaceous layer in the context of increasingly severe seasonal drought caused by global climate change, we performed a seedling growth experiment of the herbaceous layer influenced by the interaction of plant roots and forest litter through a manipulative complete block experiment, crossed with an irrigation experiment, in a montane subtropical moist evergreen broad-leaved forest of southwestern China. Within both the control and watered plots, we established four experimental subplots with plant roots and forest litter included (R+L+); plant roots included, but forest litter excluded (R+L−); plant roots excluded, but forest litter included (R−L+); and both plant roots and forest litter excluded (R−L−). After one year, the R+L+ treatment in the control plot had statistically less species richness and plant individuals, shorter mean and maximum seedling heights, and less dry biomass of plant seedlings than those in the other seven experimental treatments. Across all the experimental replicates, the pooled data showed that plant roots, forest litter, and seasonal drought, together, inhibited all the dependent herbaceous growth variables. Our study demonstrates how plant roots, forest litter, and seasonal drought synergistically regulate seedling establishment and the growth of the herbaceous layer in tropical and subtropical forest understory. This synergistic regulation changes plant physiological responses and forest evolution through controlling plant diversity and the individual richness of the herbaceous layer in the context of sustained global climate change.

1. Introduction

The mechanisms that explain plant diversity and coexistence in forests, such as forest successional sequence, environmental heterogeneity, resource limitation, interspecific and intraspecific interactions, phylogenetic community structure, metacommunity dynamics, and recurrent anthropogenic and natural disturbance dynamics, are numerous [1,2,3]. These mechanisms have obvious regionalities and particularities among different forests. For example, extreme cold, frequent drought, selective logging, random periodic fire, and resource availability and heterogeneity are the main factors influencing plant diversity and productivity in boreal forests [4,5,6]. Light availability, large herbivore activity, pollutant deposition fluxes, nutrient availability, climate change, and anthropogenic activities partly explain the differences in plant compositions and local biodiversity in temperate forests [7,8,9]. Nutrient availability, climate change, abundant natural resources, anthropogenic activities, habitat heterogeneity, and the local species pool support high plant diversity and complex structures in tropical and subtropical forests [10,11,12]. Most studies of these mechanisms of plant diversity and species coexistence in forests mainly focus on the canopy dominant trees, climbing lianas, and understory shrub species. There is a smaller number of studies on the mechanisms controlling herbaceous plant diversity and the seedling growth of forest understory compared to the number of similar studies on overstory and understory woody plants. In addition, most previous studies on plant diversity and seedling growth in the herbaceous layer of forests have usually involved interspecific and intraspecific interactions, such as heterotoxic and autotoxic effects, i.e., allelopathy, but few studies have focused on forest litter and plant roots in the context of changed seasonal drought patterns resulting from global climate change. Plant species in the herbaceous layer in forests are affected by light, water, temperature, and nutrients, which are regulated by the aboveground part of dominant tree species, and are simultaneously controlled by soil moisture, nutrient availability, and root exudates [9,10,11]. Plant roots control seedling diversity and individual growth in the herbaceous layer by interacting with the soil microbial population, activating soil mineral nutrients, and secreting various exudates. Forest litter regulates seed germination and seedling establishment by obstructing light, temperature, and water; releasing various nutrients; and secreting various exudates [13,14,15,16]. Which of these mechanisms plays a dominant role in impacting the herbaceous layer in forests? It should depend on the biotic and abiotic conditions in different forest ecosystems. Therefore, the environmental factors that control plant diversity and seedling growth in the herbaceous layer of forests should be studied together instead of separately.
Global climate change is persistently intensifying and will continue to negatively affect various terrestrial ecosystems via severe disturbances such as extreme weather events and natural disasters [17,18,19]. Disturbances driven by global climate change can negatively influence forest structure and ecological function very suddenly, and climate change also simultaneously subjects terrestrial forest ecosystems to unprecedented slower-type pressures (e.g., warming, elevated CO2, drought, pollutant deposition, etc.). Such global change drivers, together with intense anthropogenic disturbances, may seriously alter normal forest development and species evolution, and potentially modify the known mechanisms of plant diversity maintenance and species coexistence. Drought, especially as a frequent press-type disturbance in forest ecosystems, is intensively studied, as severe and frequent drought events become increasingly common, and can result in massive litter deposition (trees defoliate because of severe water stress for reducing water losses through leaf transpiration and surviving the drought event), severe forest fire events, and extensive tree mortality [20,21,22]. Occasionally, and temporarily, severe drought can stimulate plant litter deposition and induce seedling mortality over the short term due to the deficit stress of soil moisture [22,23,24]. Long-term extreme drought likely affects the primary production and successful processes of forest ecosystems, resulting in drastically altered forest structure and plant composition or alternative stable ecosystem states [22,25,26]. While research has sought to measure these long- and short-term apparent consequences of drastic drought events, regular seasonal drought in seasonal forests is often overlooked because of its relative regularity and predictability, as well as its less drastic effect on forest structure and plant composition. However, it is often reported that global climate change could likely increase the severity and magnitude of seasonal drought in seasonal forests, and potentially induce greater seasonality in seasonal forests [27,28,29]. Therefore, it is necessary to explore the impacts of seasonal drought on the structure and function of various forest ecosystems, including canopy dominant trees, climbing lianas, and understory shrub species, as well as plant diversity and seedling growth in the herbaceous layer near the ground.
We expected that plant diversity (measured as species richness) and seedling growth in the forest herbaceous layer would be influenced by the interaction of plant roots, forest litter, and seasonal drought. In this study, we selected a subtropical moist evergreen broad-leaved forest in Yunnan province of southwestern China as our study site, established two 1-ha field moisture research plots (control plot vs. watered plot), and set up four subplots nested within each moisture treatment that comprised all combinations of plant root and forest litter inclusion and exclusion. We hypothesized that the independent variables of plant roots, forest litter, and seasonal drought inhibit plant diversity and seedling growth in the herbaceous layer on the ground surface of the forest because adult woody individuals often have stronger competitive ability than plant seedlings for water and nutrients in the herbaceous layer, and the thick undecomposed forest litter physically isolates plant seeds from soil [13,14,15,16]. Our research objective was to investigate the impact of plant roots, forest litter, and seasonal drought on the dependent variables, including the diversity and abundance of plants, the mean and maximum height of plant seedlings, and the dry biomass of plant seedlings in the herbaceous layer near the ground of the forest.

2. Materials and Methods

2.1. Study Sites

This study was conducted in a montane subtropical moist evergreen broad-leaved forest (24°20′40″ N, 102°33′50″ E; at an elevation of about 1740 m a.s.l.), which was one important part of the Ecological Botanical Garden of central Yuxi City (ECY) in Yunnan province of southwestern China (Figure 1). The ECY was officially established in early 2016 with the main purpose of highlighting local forest characteristics, popularizing the concept of natural scientific education and ecological research of forest ecosystems, and maintaining local ecological landscapes. More importantly, the ECY was also constructed to protect the local large-area moist evergreen broad-leaved forest, which was a relatively diverse natural forest without intense human disturbances in the central area of Yuxi city. Management focused on the strict protection of the existing evergreen broad-leaved forest with the endemic tree species in Yunnan as the dominant species, such as Schima wallichii (DC.) Choisy, Quercus franchetii Skan, Lithocarpus confinis Huang, Quercus acutissima Carruth., Cyclobalanopsis delavayi (Franch.) Schott., Cyclobalanopsis glaucoides Schotky, Castanopsis fleuryi Hick. et A. Camus, Castanopsis delavayi Franch., etc. This forest had already existed as a relatively diverse natural forest since 1978, when the predecessor of the Yuxi Normal University was established. Stable forest structure and plant composition, scattered natural fallen woods, and relatively stable yearly primary production (unpublished data) demonstrate that this is most likely a mature forest.
Yuxi city is located in a high plateau area with a relatively low latitude, and is strongly affected by the south-west monsoon climate [30,31]. The climate spatiotemporally changes, with the regional complex geography and the comprehensive influences of humidity and dry air flow from the Indian Ocean and the Beibu Gulf, result in distinct dry and wet seasons during the year. The wet season mainly occurs in summer and autumn from May to October, and the dry season mainly occurs in winter and spring from November to April. According to the meteorological data from 1971 to 2015, the annual average temperature was 15.4–24.2 °C, with the highest temperature being 32.6 °C in May and the lowest being −5.5 °C in December (from The Meteorological Bureau of Yuxi City). The annual frost-free period was 244–365 d with an annual sunshine duration of 2115–2285 h. Annual and diurnal temperatures both had apparent changes. Annual precipitation was 787.8–1000 mm, mostly concentrated between June and October; annual evaporation was around 1800 mm. The precipitation in 2021 was about 910 mm and evaporation was about 1700 mm. Occasionally, it snowed a small amount in winter. Annual relative humidity was 68%–79%.
The montane subtropical moist evergreen broad-leaved forest in this study was located at the peak of the Longma Hills with a steep slope (32–53°) in the campus of Yuxi Normal University. The forest structure and plant composition are protected very well without intense human disturbances because of the long-term strict protection provided by the Forestry Bureau of Yuxi city and the Logistics Management Department of Yuxi Normal University. After S. wallichii, Q. franchetii, L. confinis, and Q. acutissima, Pinus yunnanensis Franch is also one of the dominant tree species in the forest. Understory shrub species mainly include Photinia serratifolia (Desfontaines) Kalkman, Pyracantha fortuneana (Maxim.) Li, Buddleja officinalis Maxim., and Serissa japonica (Thumb.) Thunb. Herbaceous species mainly include Nephrolepis cordifolia (L.) C. Presl, Cyclosorus interruptus (Willd.) H. Ito, Arthraxon hispidus (Trin.) Makino, and Ageratina adenophora (Spreng.) R.M. King et H.Rob. The soil is typically red sandy loam developed from argillaceous rocks and carbonate rocks with the apparent characteristics of weak acid (pH = 5.3~5.8), low organic matter (53.46~73.25 g/kg), few soil microbes (0.51–0.58 g/kg for soil microbial biomass carbon and 0.08–0.12 g/kg for soil microbial biomass nitrogen), and low soil mineral nutrient contents (0.197%–0.245% for soil total nitrogen, 0.039%~0.048% for soil total phosphorus, 1.74%~2.25% for soil total potassium, 0.173%~0.222% for soil calcium, 0.192%~0.227% for soil magnesium, 0.004%~0.006% for soil sulphur) in soil samples of 0–10 cm depth.

2.2. Experimental Design

From early 2016, when the ECY was officially established, the Logistics Management Department of the Yuxi Normal University started irrigating ground vegetation and thick debris in part of the forest during the dry season every year in an area close to the undergraduates’ dormitory and canteen to prevent forest fire. The other part of the forest without intensive human activities remained in a natural state.
We established a 1-ha (200 m × 50 m) field research plot in the irrigated area, and simultaneously established a control plot of the same scale nearby in the non-irrigated natural area in May 2019. The minimum distance between these two field research plots was >30 m. These two field research plots had similar forest structures and plant compositions.
During this study, the soil moisture in the control and watered plots was not manipulated during the wet season, because soil moisture of >40% could meet the requirement of plant growth. The watered plot was artificially irrigated during the dry season, because all plant individuals in the herbaceous layer of the study plots withered away with <4% moisture. The watered plot was irrigated weekly in the dry season, maintaining gravimetric soil moisture of 0–10 cm depth at >40%.
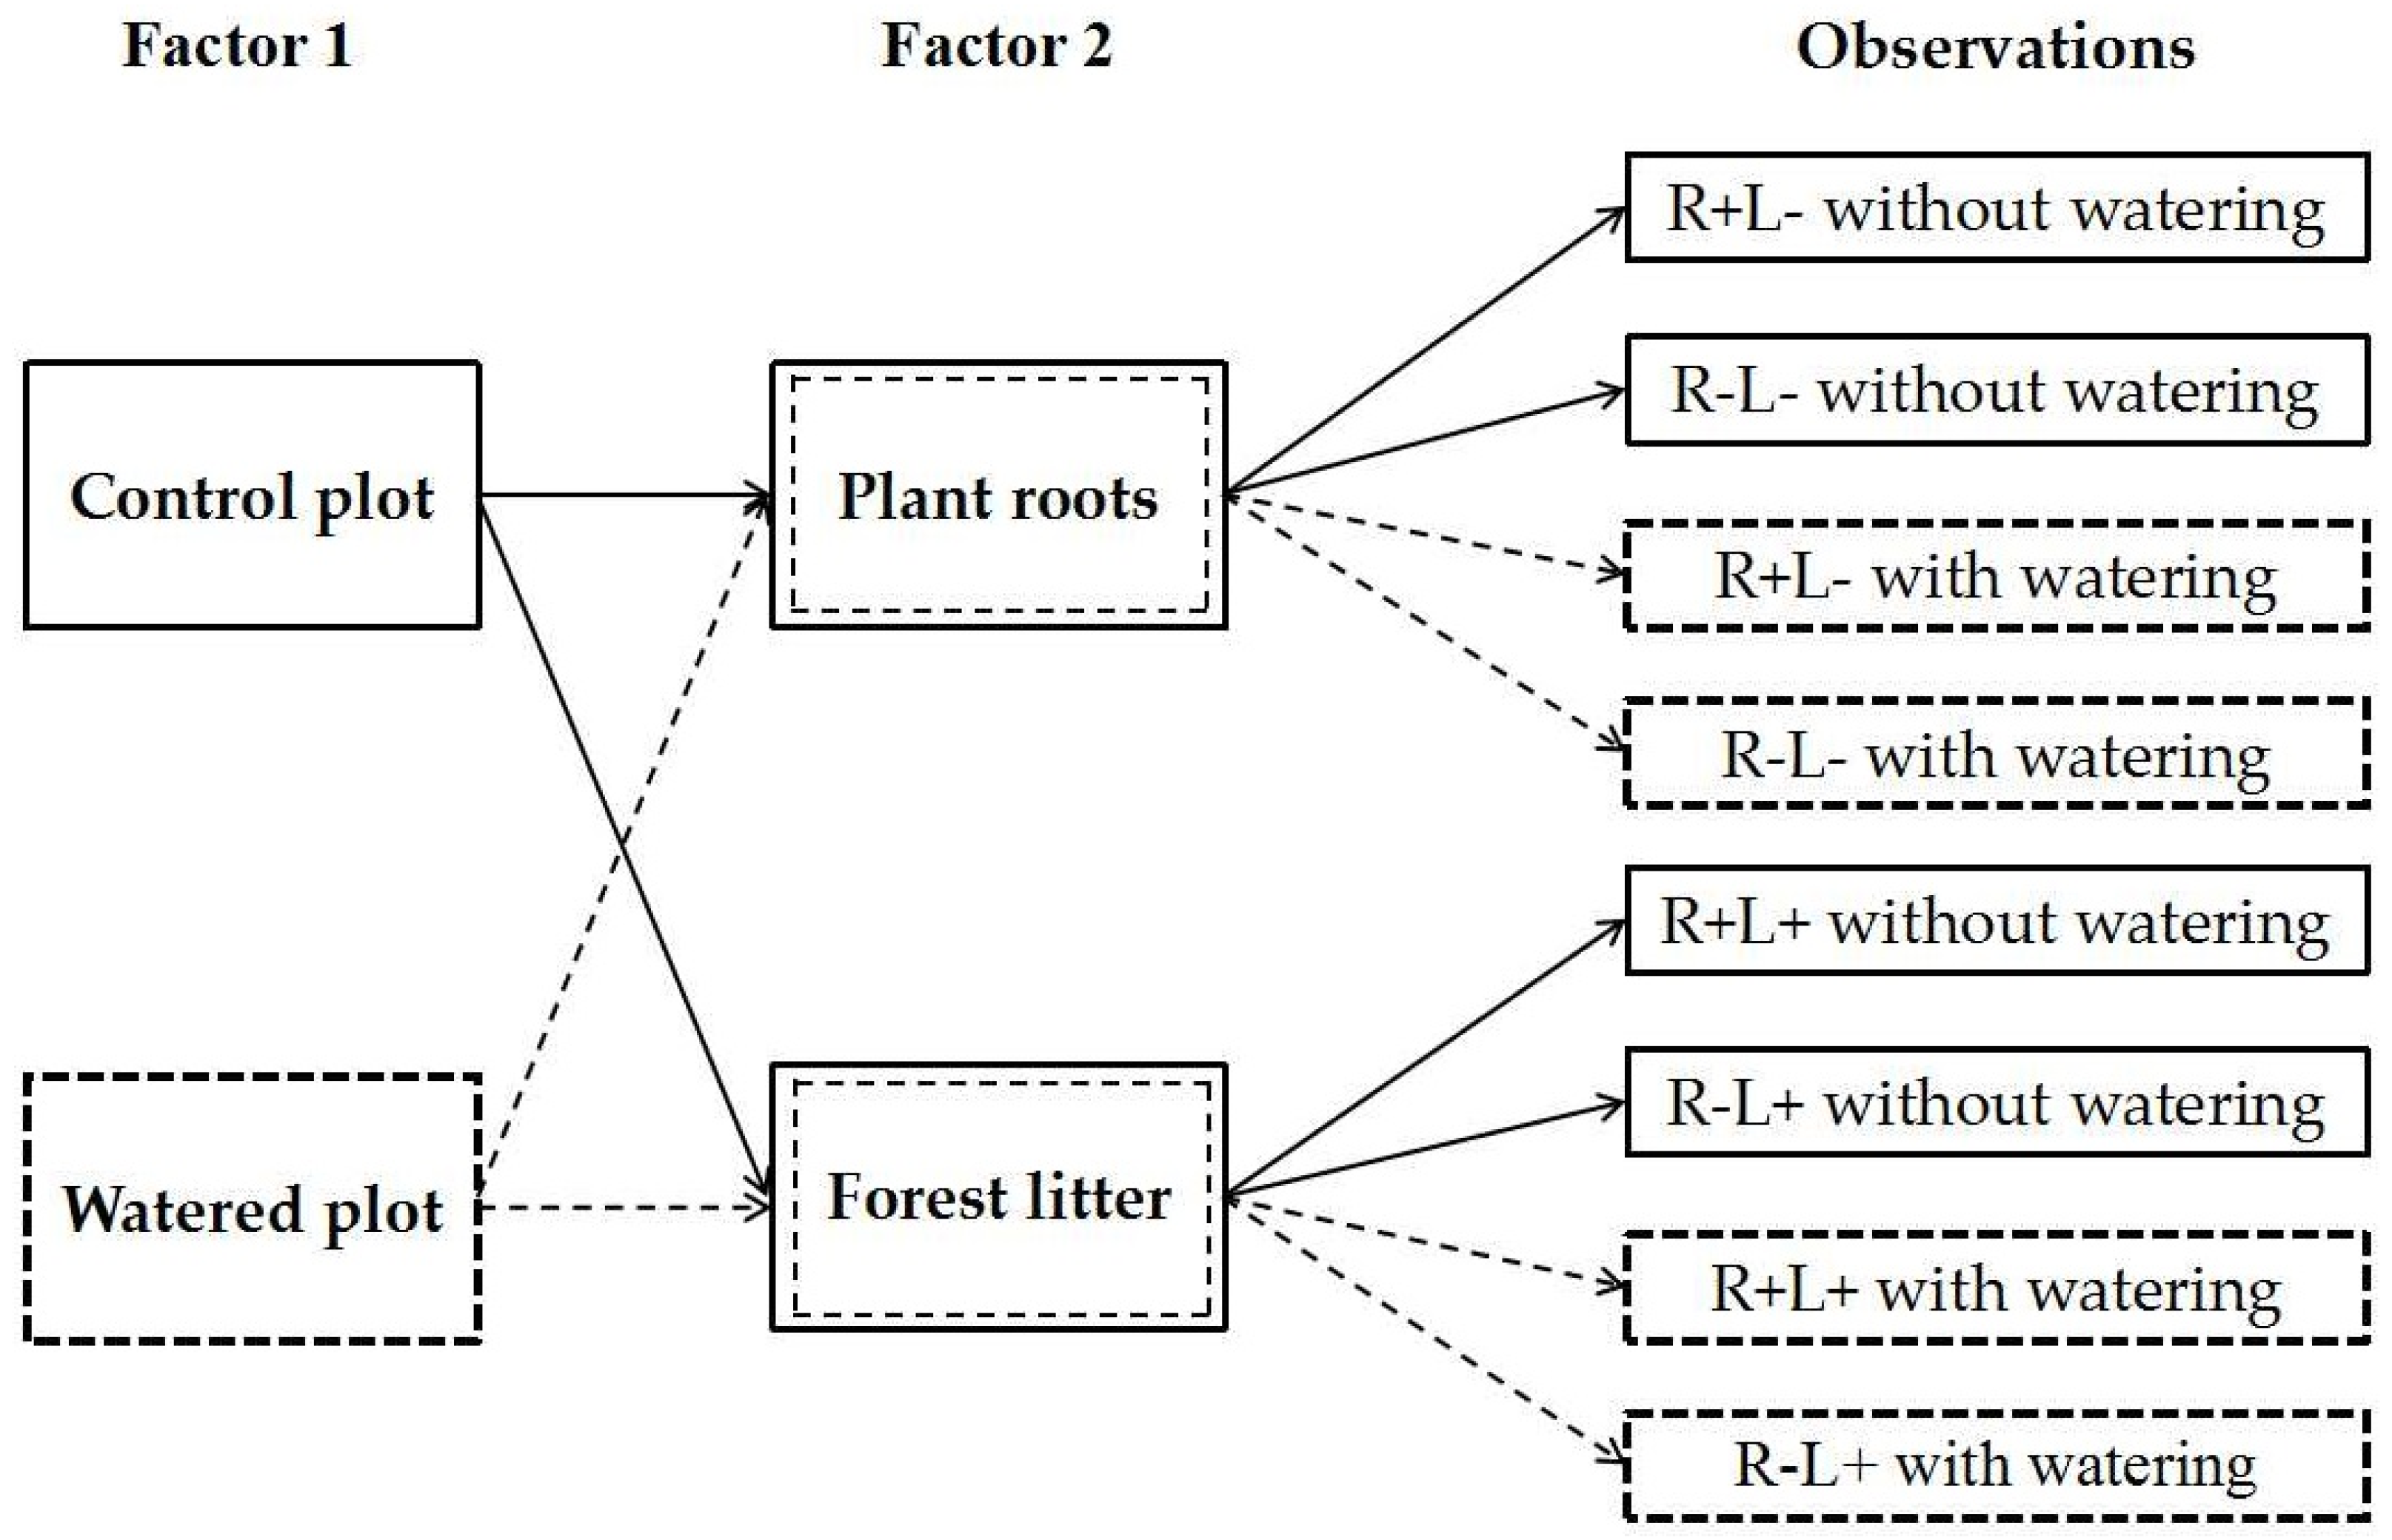
In both the control and watered plots, we established three replicate 20 m × 20 m study blocks within a 200 m × 50 m study area with at least 20 m between every replicate pair (Figure 2). Within each block, we set up four 1 m × 1 m treatment subplots with each of the following four treatments assigned randomly to the subplots: (1) roots and litter inclusion (R+L+; leaving plant roots and forest litter in the subplot in their natural state); (2) roots inclusion and litter exclusion (R+L−; leaving plant roots in the subplot, but sweeping away forest litter); (3) roots exclusion and litter inclusion (R−L+; leaving forest litter in the subplot, but cutting and removing plant roots); and (4) roots and litter exclusion (R−L−; cutting and removing plant roots and sweeping away forest litter in the subplot) (Figure 1 and Figure 3). The field experimental design is a crossed design (Figure 2) [32]. All four treatments were represented in each of the three replicate blocks. The R−L+ and R−L− subplots were vertically excavated down to the soil parent material and insulated subplot soils from outside by galvanized steel sheets that were 1 mm thick. The average thickness of the soil profiles was about 1.5 m. To keep the original state of the soil profiles to the greatest extent, we only removed all the plant roots along the perimeter of the soil profiles with diameters of >1 cm. The R+L− and R−L− subplots were covered by the plastic-framed structures (1 m × 1 m × 1 m), which were constructed of 2 cm diameter PVC tubes with 1 mm mesh fiberglass screens.
In collaboration with the manipulated irrigation performed by the Logistics Management Department of the Yuxi Normal University, we checked and managed our field experimental subplots weekly. We collected and stored rainfall in a reservoir at the peak of the Longma Hills during wet season (from June to November 2020), and irrigated subplots in watered plot when soil moisture in the subplot was less than 40% during dry season. We inserted a soil hygrometer (FC28 Hygrometer) into soil layer with 10 cm depth in watered subplots, checked it every weekend, and applied around 10 L of water to each subplot, keeping soil moisture >40%. Forest litter on the top of fiberglass screens was swept away in time to unblock sunlight and throughfall; all seeds on each fiberglass screen were collected and evenly returned to the corresponding subplot.

2.3. Data Collection

Two field experimental plots (control plot vs. watered plot) were established in May 2019, and the four subplots in each experimental plot were simultaneously set up. All investigations of plant diversity and seedling growth in the subplots were performed from January to December 2021. All seedlings in subplots were removed in time (including overground stems and leaves, as well as underground roots) before January 2021 to eliminate the possible effects of original litter leachates (in the R+L− and R−L− subplots) and root exudates (in the R−L+ and R−L− subplots) on seed germination and plant growth in the two experimental plots.
At the end of December 2021, all fiberglass screens that covered the subplots were removed, and all plant seedlings, except bryophytes, were counted and measured. We counted all individuals for each plant species, and measured plant height for each individual and mean height for each subplot (the height that more than 70% of plant individuals, in bulk, reached in the subplot). Maximum height of plant seedlings was measured using the highest plant individual in each subplot. We harvested all plants in each subplot, put them in paper envelopes, and dried them at 65–75 °C for several days until constant weight was achieved.

2.4. Data Analysis

We statistically compared species richness, the number of plant individuals, mean and maximum height, and the dry biomass of plant seedlings among four subplots in control and watered plots by non-parametric Kruskal–Wallis ANOVA using the software Statistical Package for the Social Sciences 20 (SPSS 20; IBM Corporation, Chicago, IL, USA) [33].
To understand how the four treatments (R+L+, R+L−, R−L+, and R−L−) and two plots (control plot vs. watered plot) were related to the five dependent variables (species richness, the number of plant individuals, mean and maximum height, and dry biomass of plant seedlings), we fitted linear mixed effects models with fixed effects for treatment, plot, and the variables’ interaction, and a nested plot-treatment random intercept term (1|treatments/plot) in R (V 3.0.1, R Development Core Team 2017) [34].
To test the synergistic effect of plant roots, forest litter, and seasonal drought on the five dependent variables, we pooled the data among replicate subplots in the control plot (i.e., plant roots effect in the R+L− treatment, forest litter effect in the R+L− treatment, and no plant roots and forest litter effect in the R−L− treatment), and then pooled the corresponding data among replicate subplots with R+L+ treatment in the watered plot (i.e., plant roots, forest litter, and water effect together), and then compared the data of each corresponding subplot (i.e., correspondingly, plant roots and water effect in the R+L− treatment, forest litter and water effect in the R+L− treatment, and only water effect in the R−L− treatment).

3. Results

3.1. Species Richness and the Number of Plant Individuals

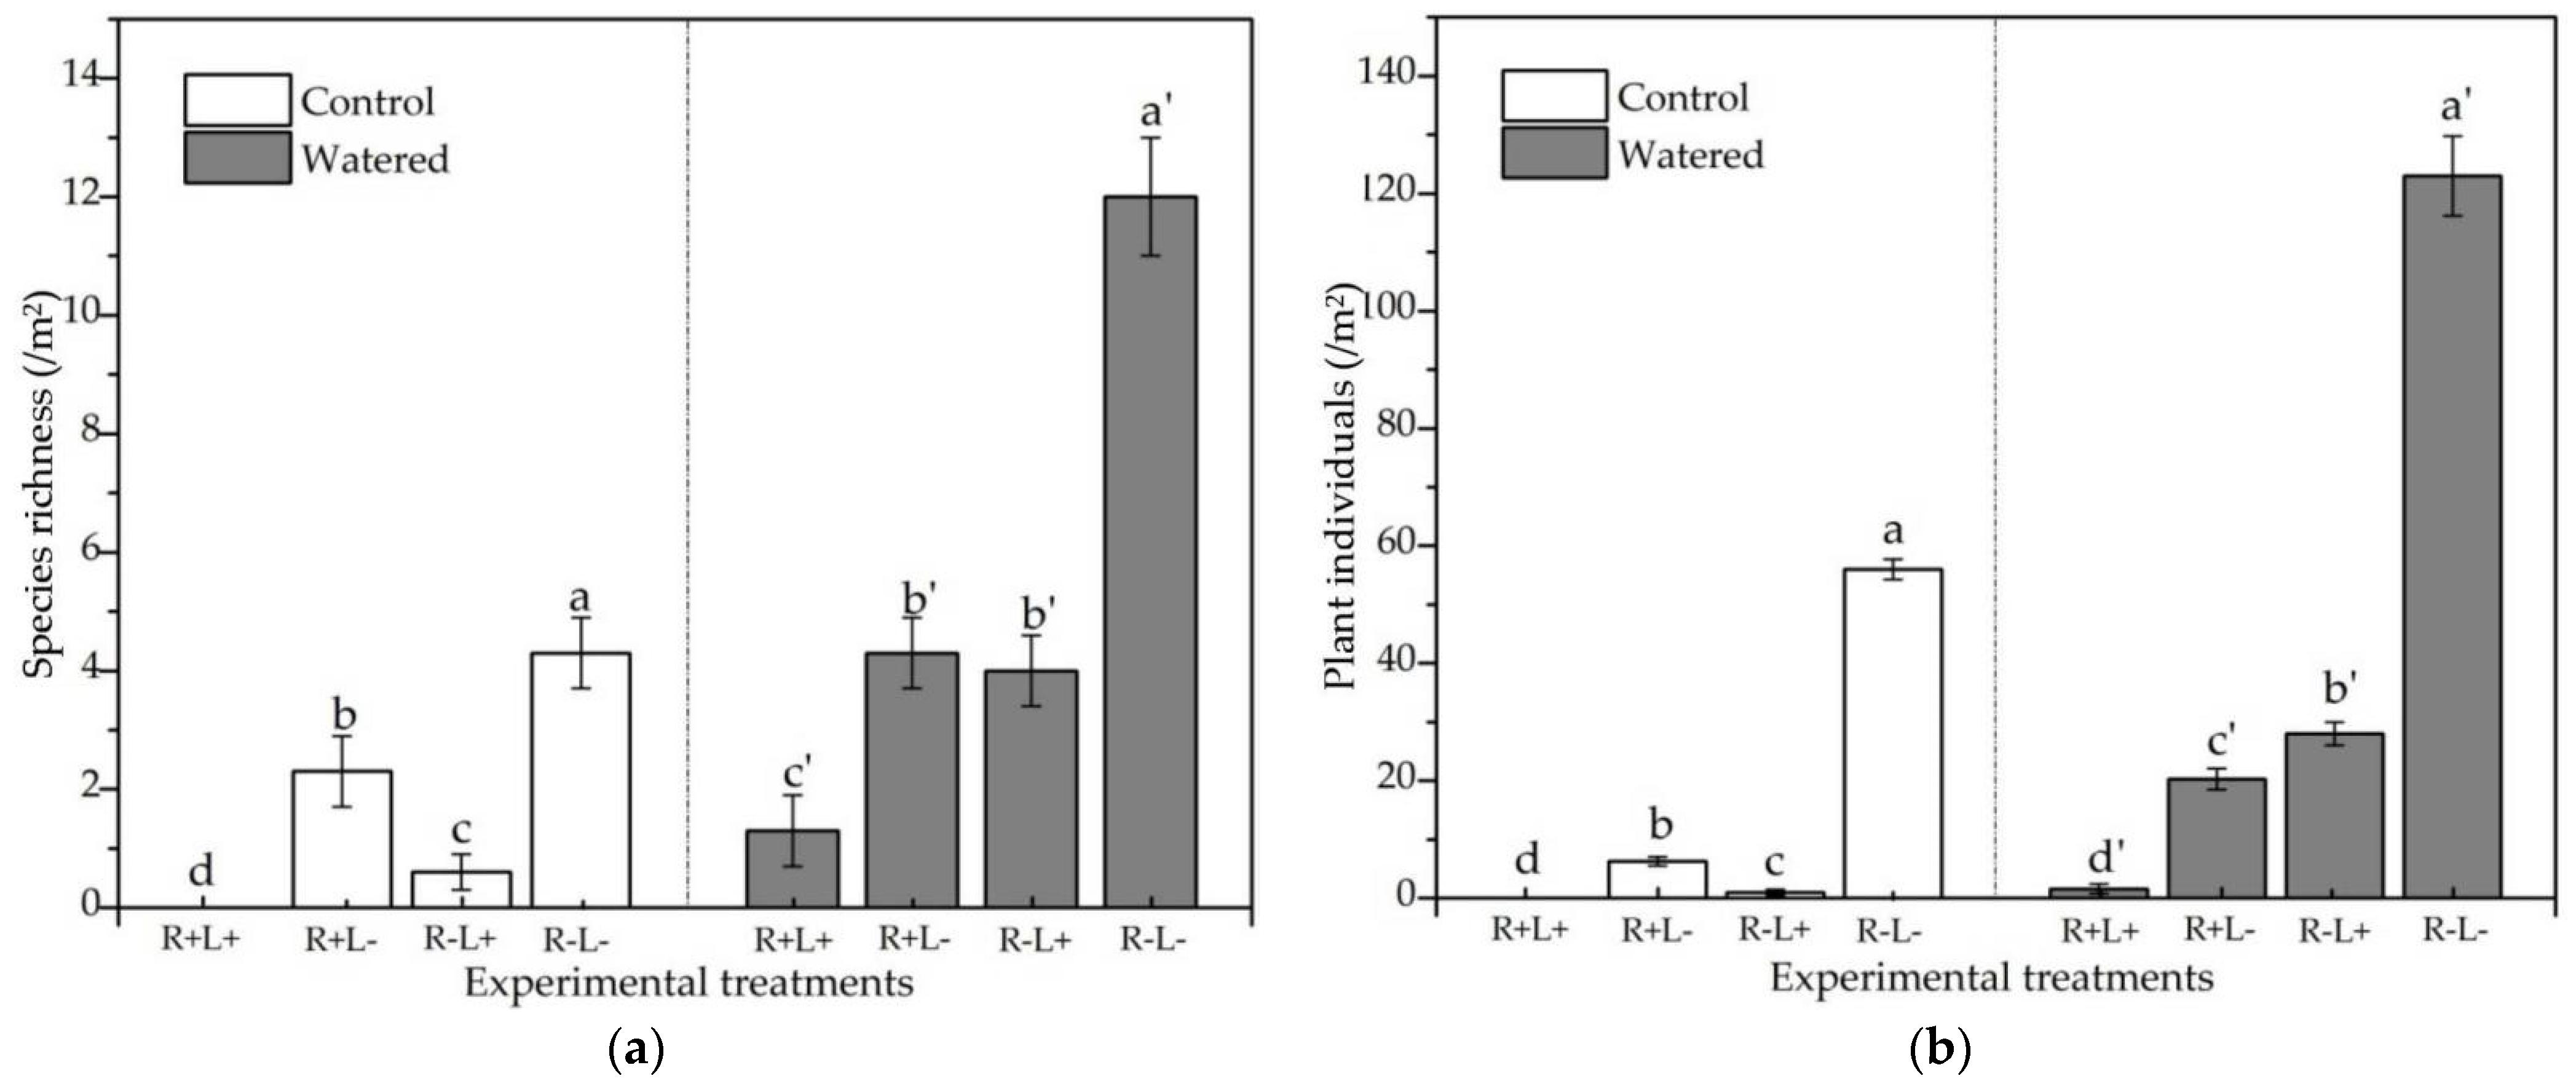
Although plants were absent from the R+L+ subplot in the control plot, numerous plant species were found in the other seven subplots in the control and watered plots (Figure 4a and Table 1). In the control plot, 5 (±1) /m2 plant species were found in the R−L− subplot, which belonged to three different families; 3 (±1) /m2 plant species appeared in the R+L− subplot, which belonged to three different families; and 1 (±1) /m2 plant species was found in the R−L+ subplot. In the watered plot, the most plant species, with 12 (±1) /m2, existed in the R−L− subplot, which belonged to ten different families; the R+L− and R−L+ subplots had the same number of plant species but in different compositions; the R+L+ subplot had the least plant species, with 2 (±1) /m2, which belonged to two different families.
The number of plant individuals varied among different subplots in both the control and watered plots (Figure 4b and Table 1). In the control plot, the R−L− subplot had the most plant individuals with 56 (±2) /m2, the R+L− subplot had the second most plant individuals with 7 (±1) /m2, and the R−L+ (1 ± 1 /m2) and R+L+ (0 /m2) subplots had the third and fourth least plant individuals, respectively. In the watered plot, the most plant individuals also appeared in the R−L− subplot with 123 (±7) /m2, the second most plant individuals occurred in the R−L+ subplot with 28 (±2) /m2, and the R+L− (21 ± 2 /m2) and R+L+ (2 ± 1 /m2) subplots had the third and fourth least plant individuals, respectively.

3.2. Mean and Maximum Plant Heights

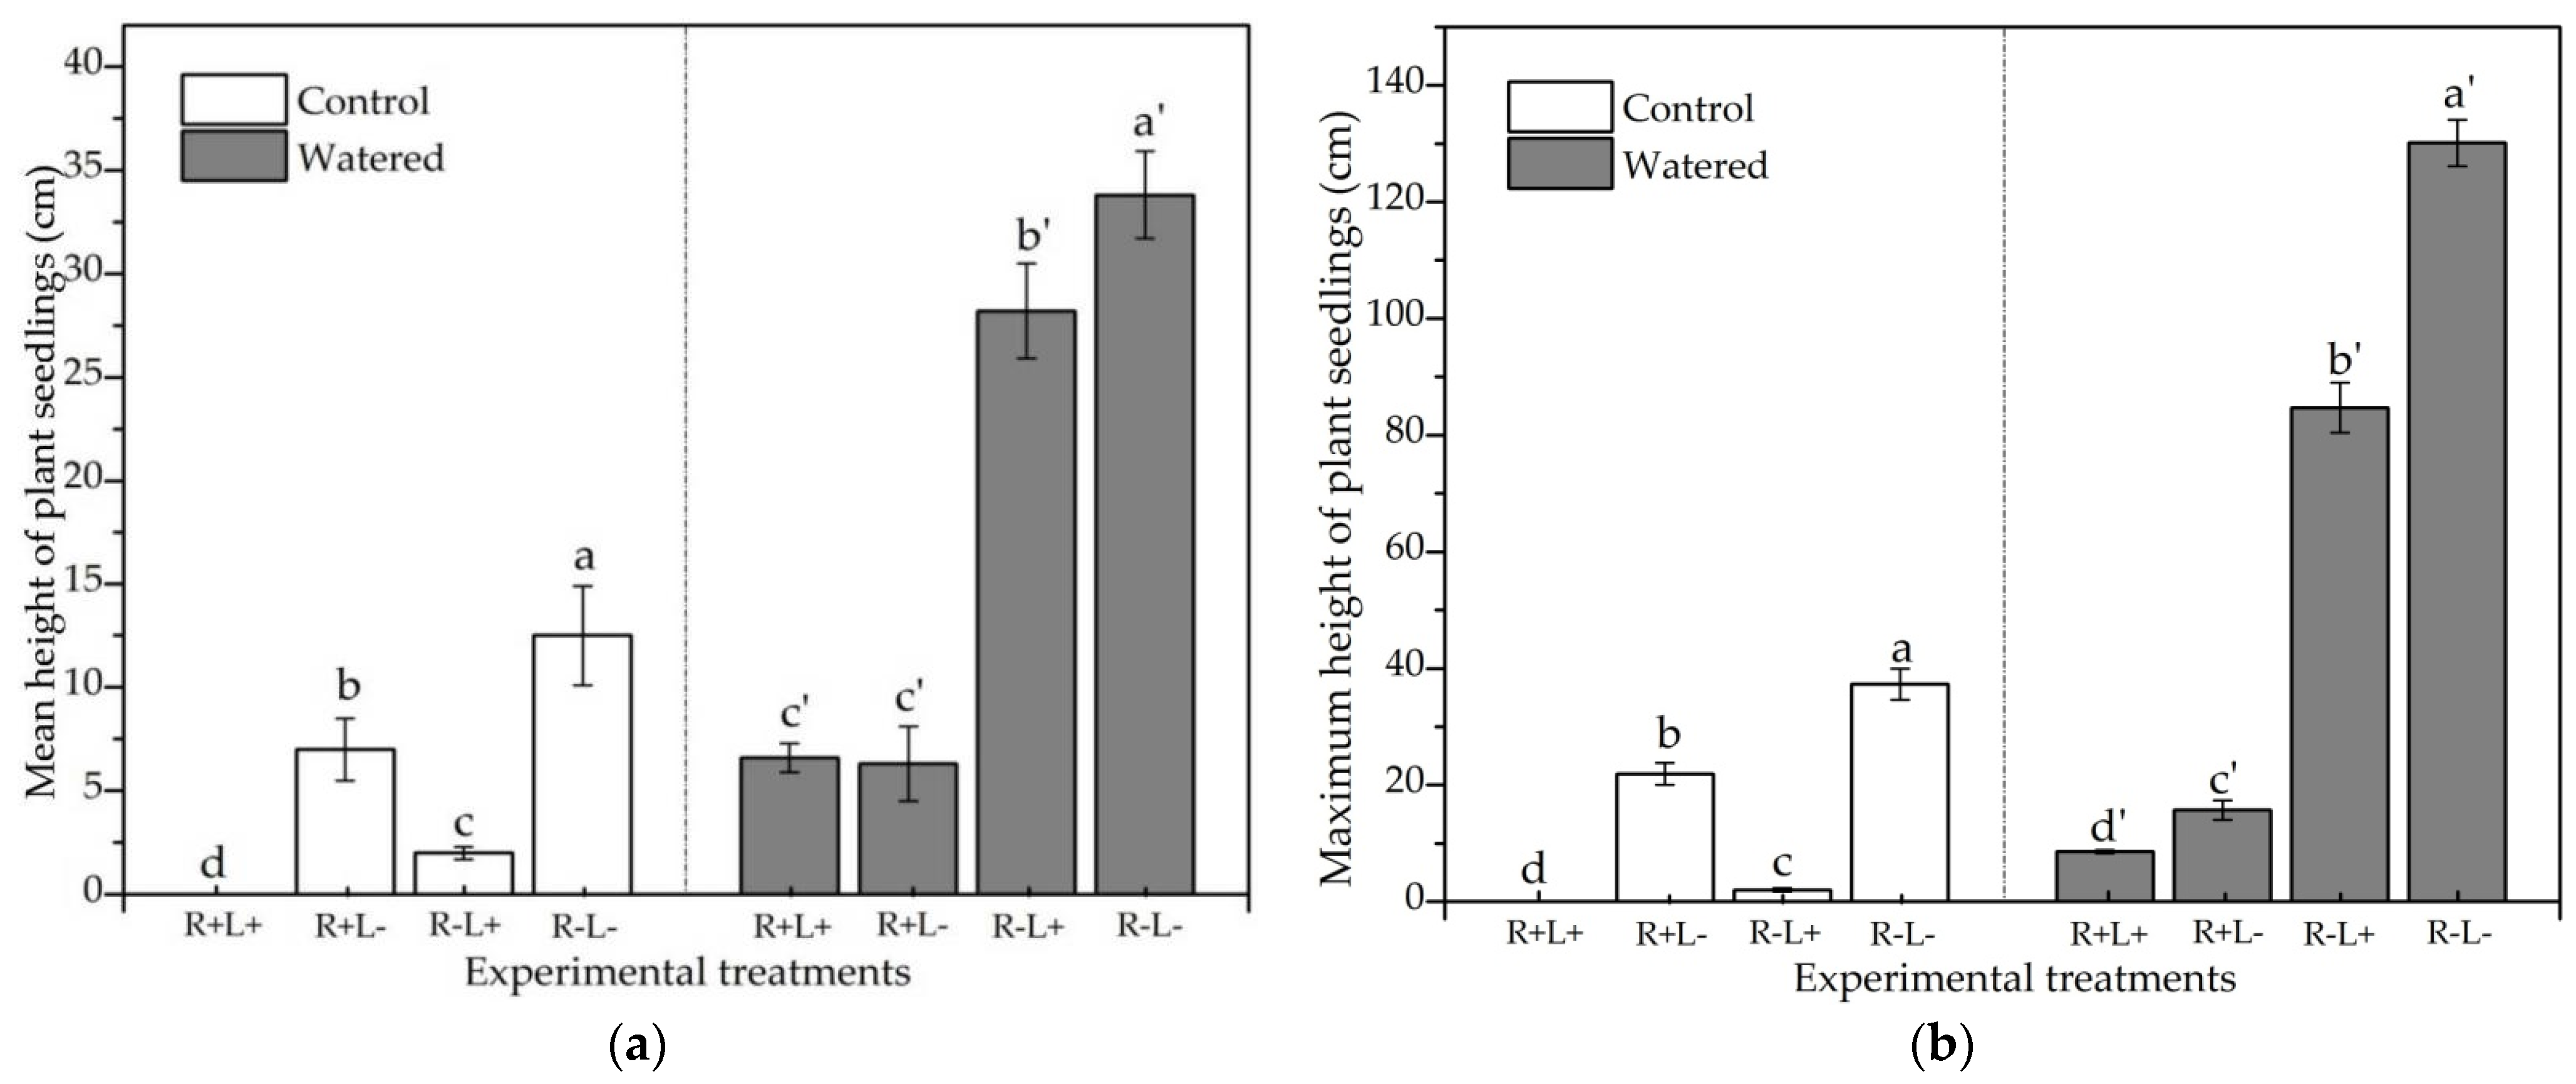
The variation in the mean height of plant seedlings among the four subplots in the control plot was apparently greater than that of the watered plot (Figure 5a). In the control plot, the mean height of plant seedlings in the absence of both roots and litter was 12.5 (±2.4) cm, followed by the R+L− (7.0 ± 1.5 cm) and R−L+ (2.0 ± 0.3 cm) subplots. No plants grew in the R+L+ subplot. In the watered plot, the highest mean height of plant seedlings occurred in the R−L− subplot with 33.8 (±2.1) cm. The mean height of plant seedlings in the R−L+ subplot was the second tallest, measuring 28.2 (±2.3) cm, and the mean height of plant seedlings in the R+L+ and R+L− subplots was about 6.5 cm without statistical differences.
The mean and maximum heights of different plant species in each subplot showed obvious stratification in the control and watered plots (Table 2). S. scandens and N. cordifolia were the tallest plants in the R−L− and R+L− subplots of the control plot, respectively, because S. scandens was a liana and N. cordifolia occupied the most space in the subplot. Plant species that rapidly germinated and sprouted occupied the most space in the subplot and grew fast to reach the highest level. S. nigrum, A. hispidus, and A. adenophora in were the tallest plants in the R−L−, R−L+, and R+L− subplots of the watered plot, respectively.

3.3. Plant Dry Biomass

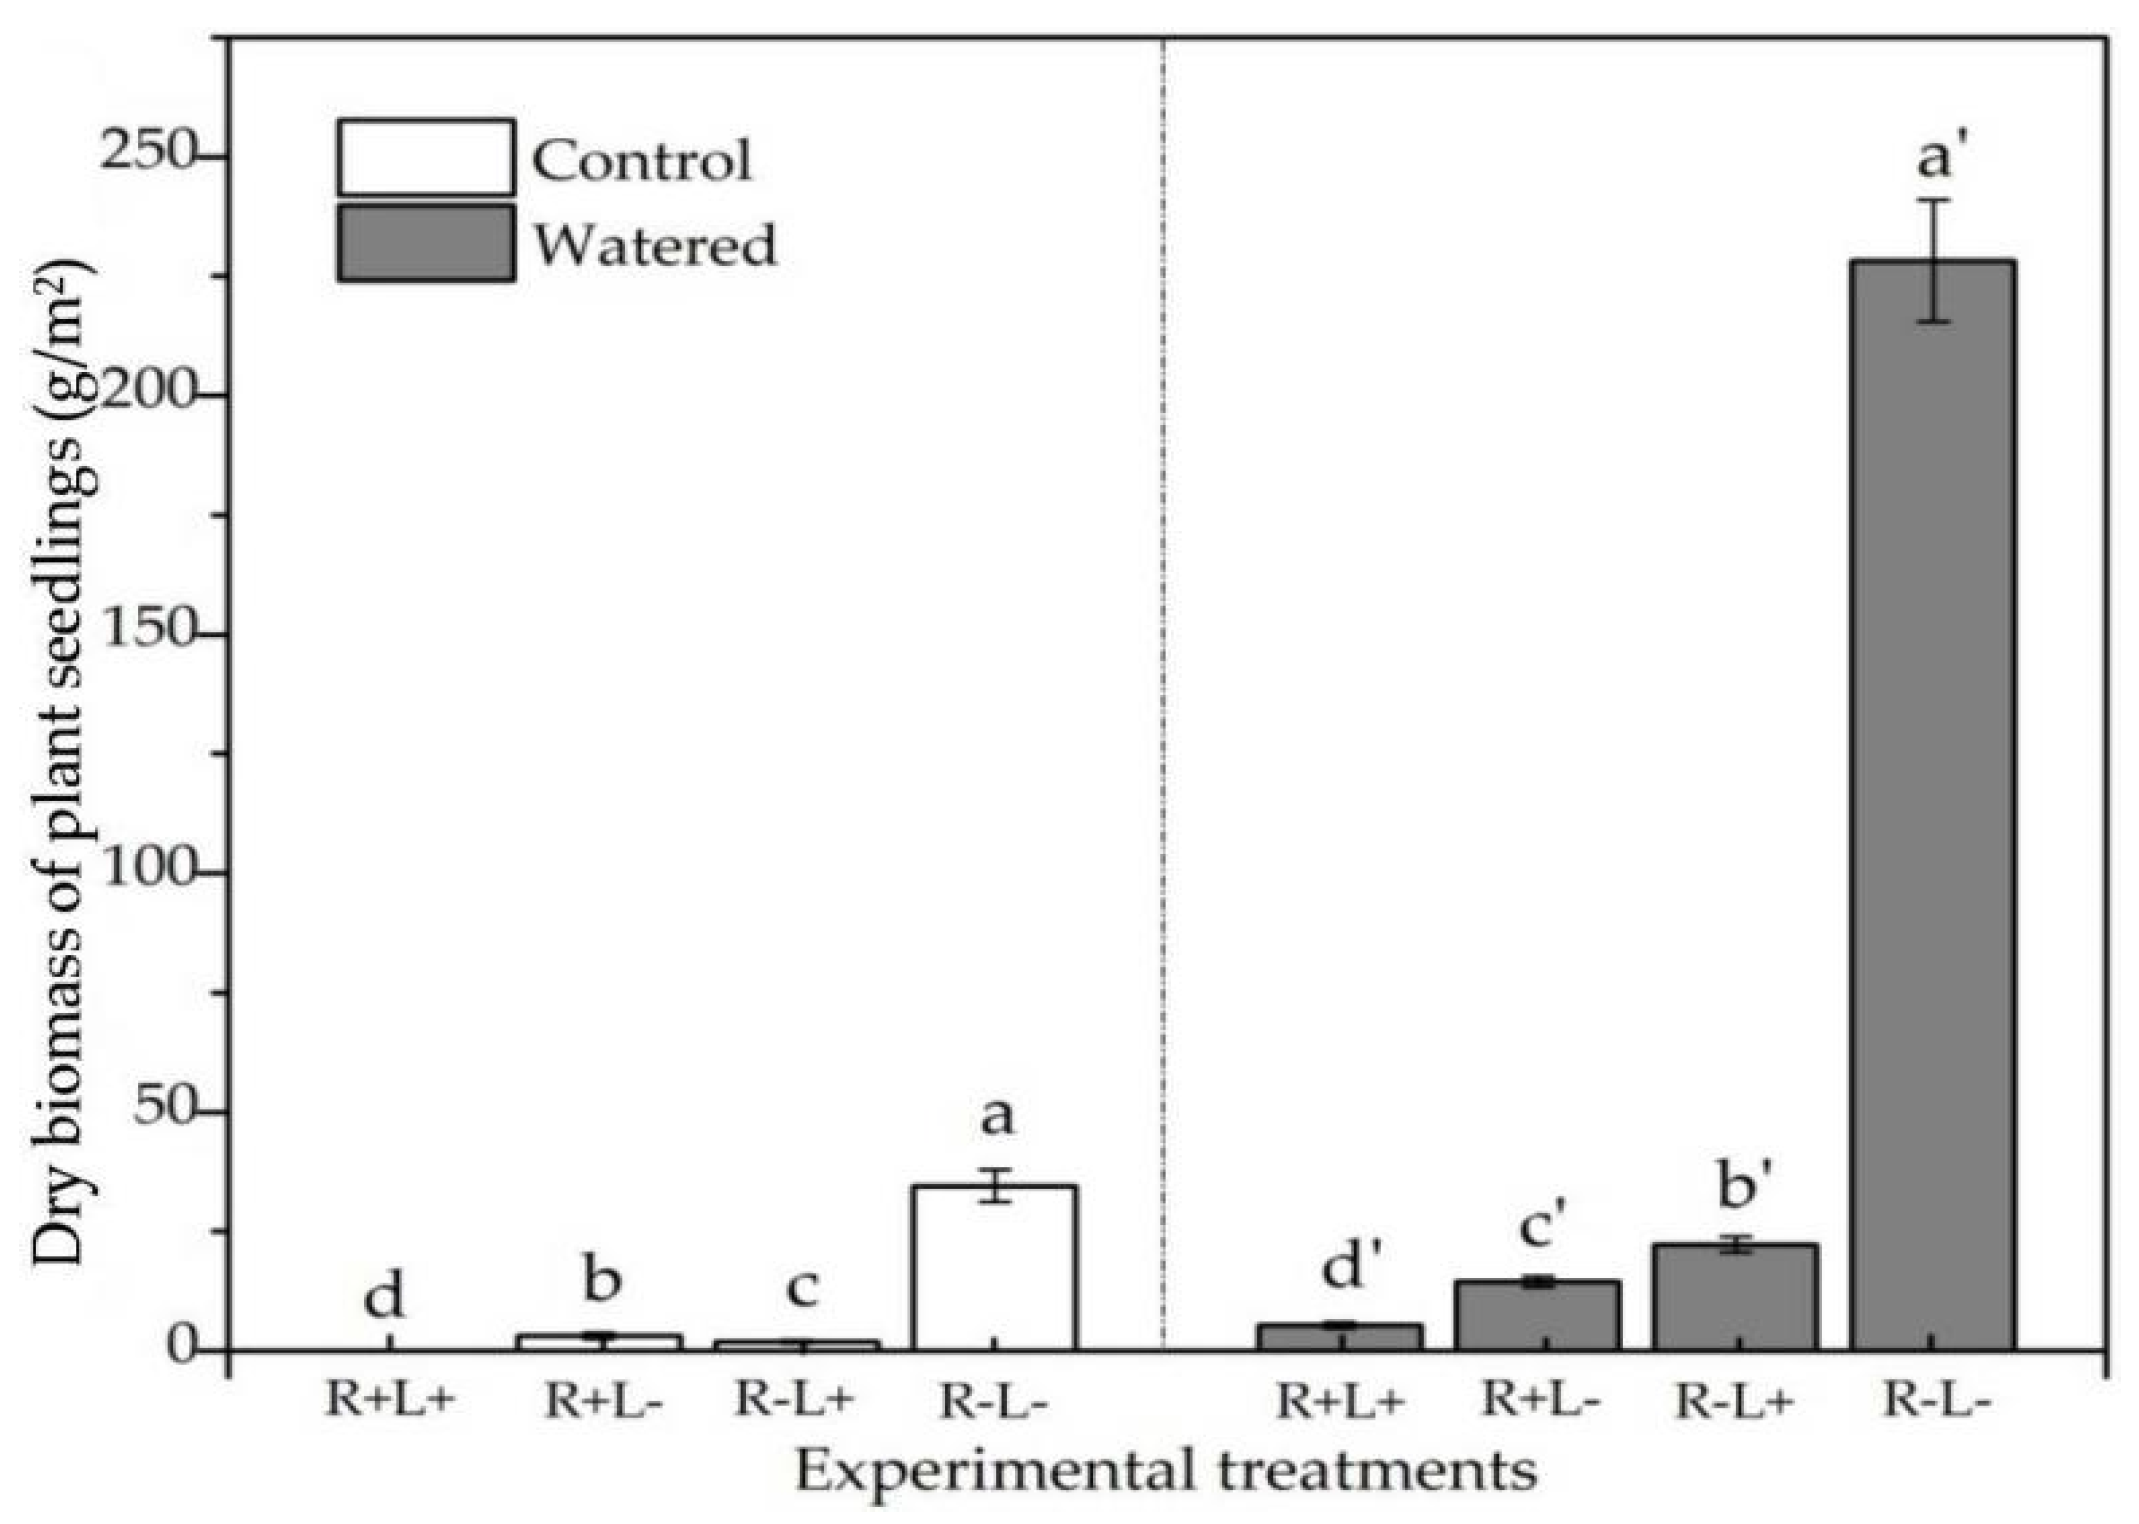
The dry biomass of the plant seedlings varied among the four subplots in the control and watered plots (Figure 6). In the control plot, dry biomass reached the highest value with 34.6 (±3.4) g in the R−L− subplot, followed by the R+L− and R−L+ subplots. In the watered plot, dry biomass reached the highest value with 228.2 (±12.8) g in the R−L− subplot, followed by the R−L+ and R+L− subplots. The R+L+ subplot had the least dry biomass with 5.4 (±0.6) g.

3.4. Analyses of the Controlled Environmental Factors

The individual and combined effects of the variables manipulated in this experiment, i.e., the presence of plant roots, forest litter, seasonal drought, and their interactions, were statistically analyzed to determine their effects on species richness, the number of plant individuals, mean and maximum heights, and the dry biomass of plant seedlings (Table 3). The responses of seedling species numbers, plant density, and height to the presence of forest litter was contingent on whether the plot was watered during the dry season. Seedling density and both mean and maximum seedling height were second highest in the R−L+ treatment combination in the watered plot, but were second lowest in the control plot, while the R+L− treatment showed the opposite pattern. Interactions between plant roots and forest litter, plant roots and manipulated water, and forest litter and manipulated water seem to have influenced these dependent variables.

3.5. Synergistic Analyses

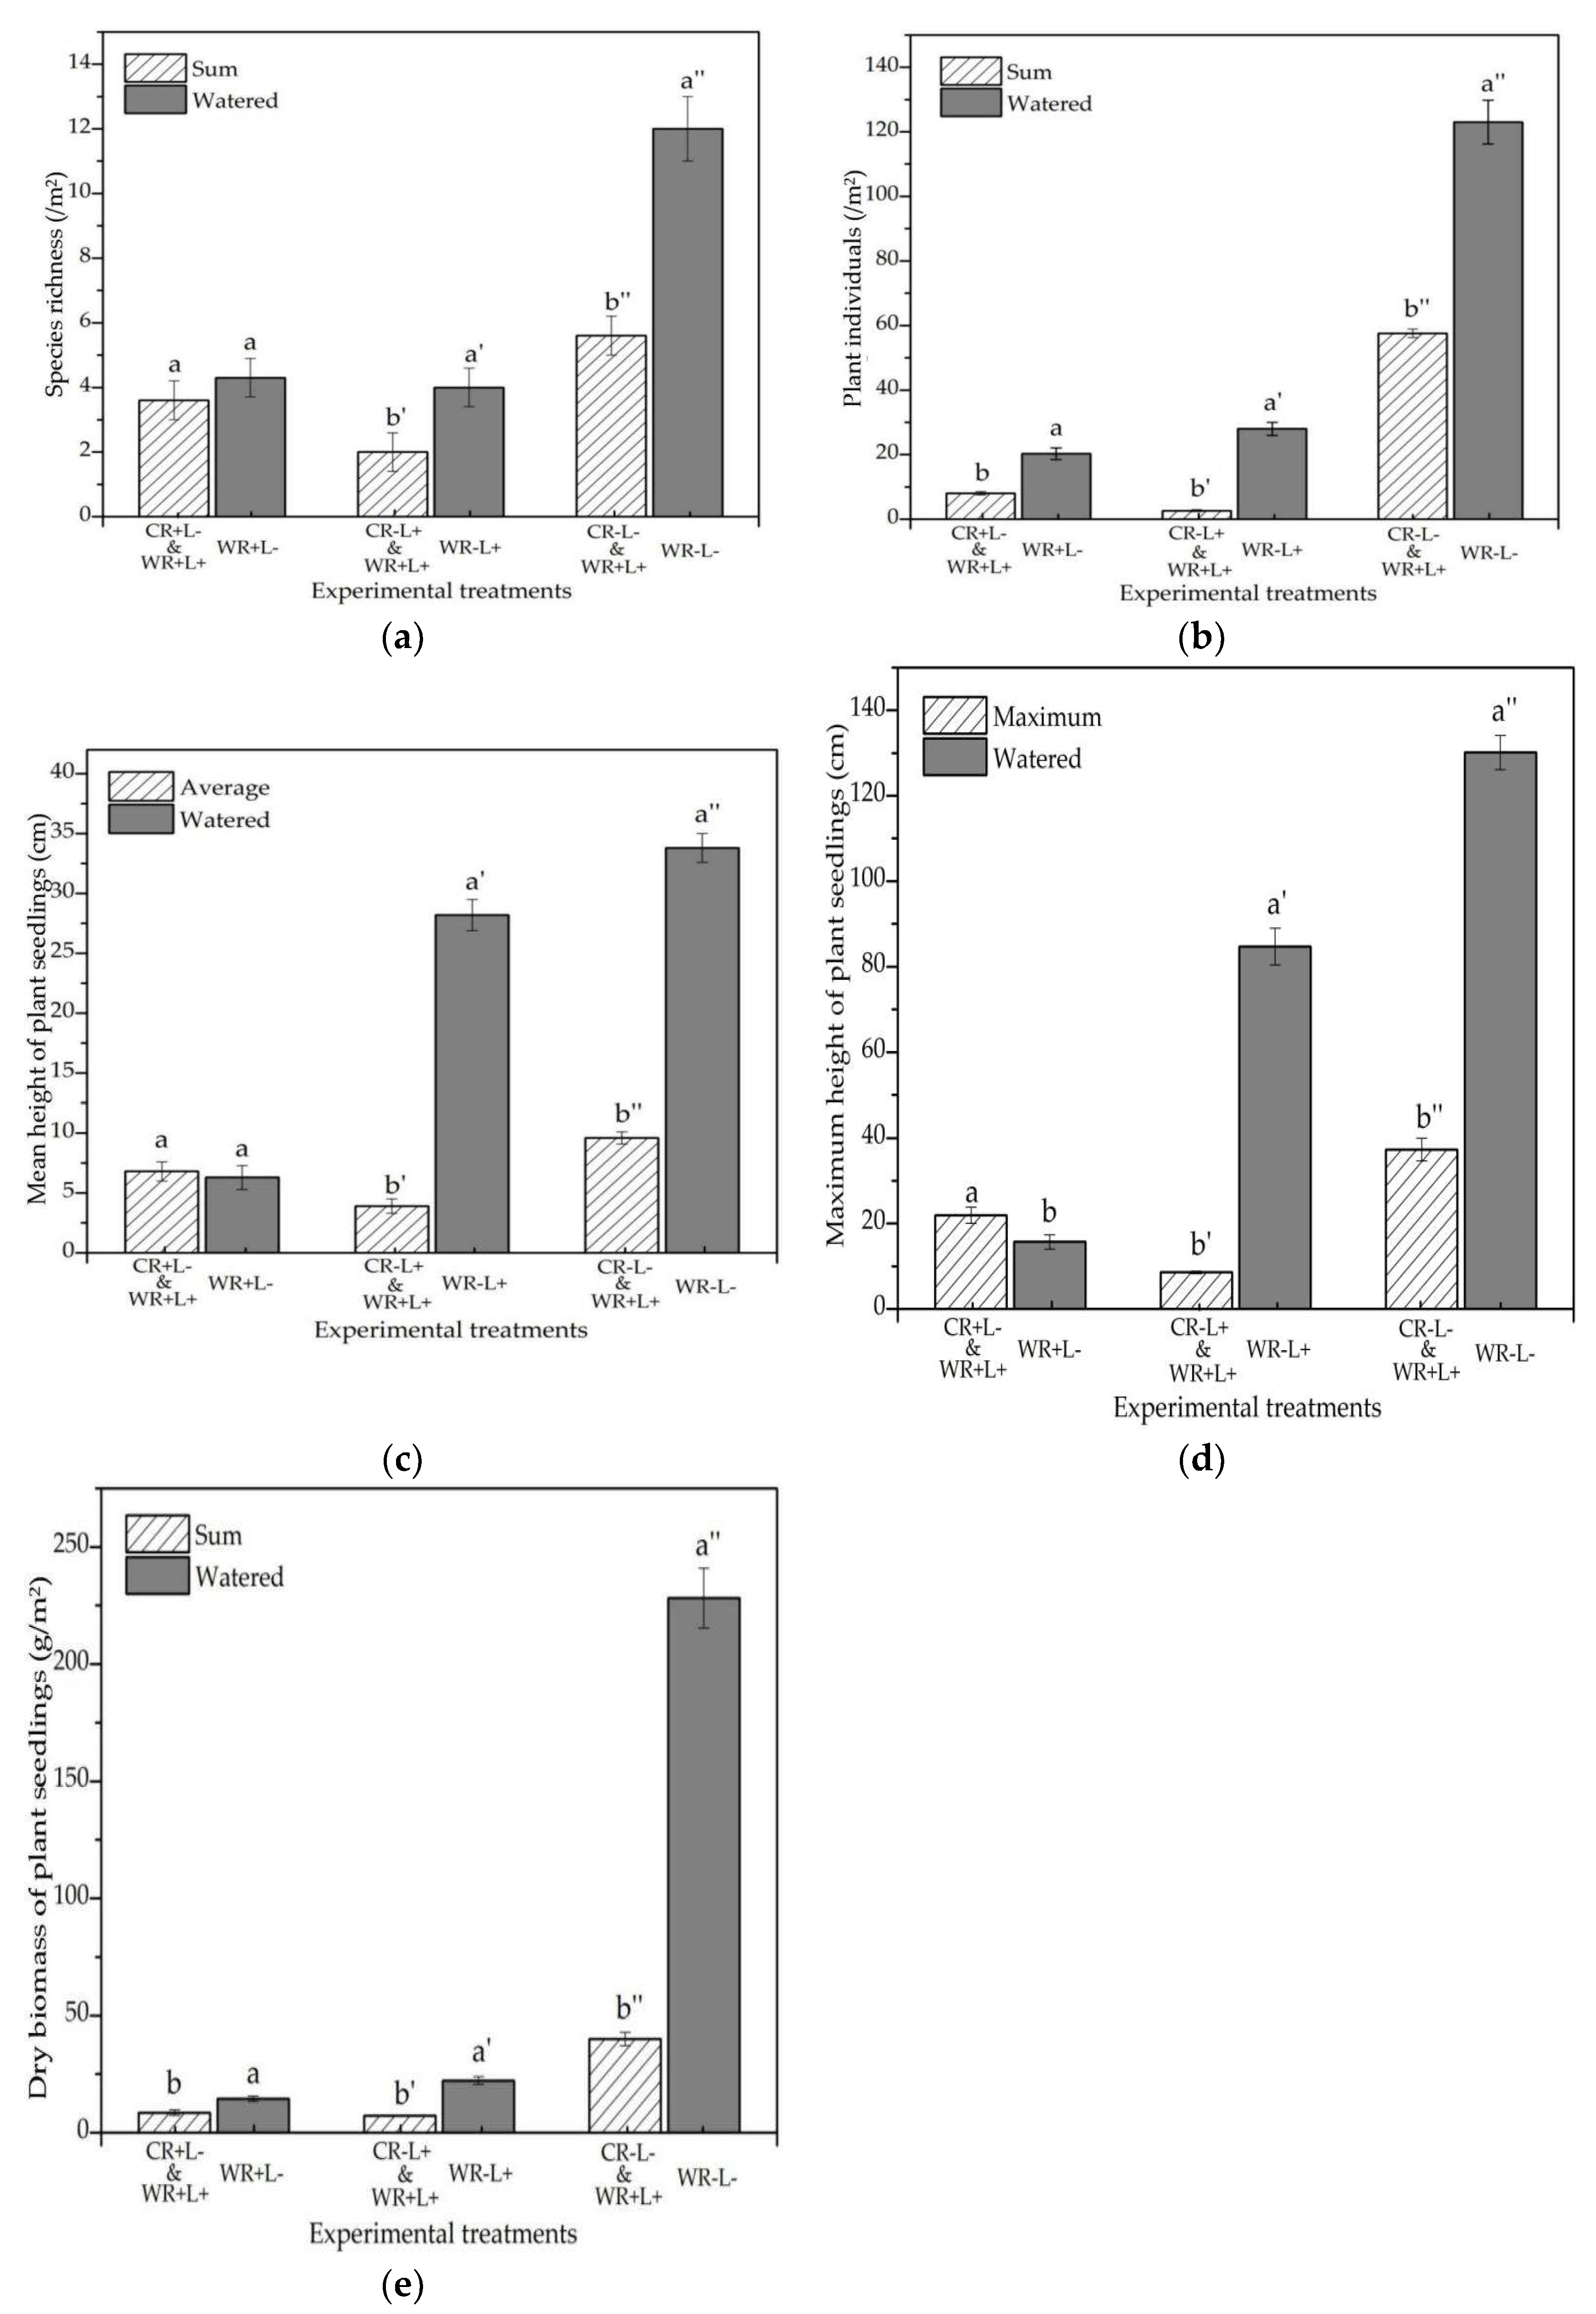
Synergistic effects of treatment combinations occurred in most of the dependent variables (Figure 7). Except for the species richness and the mean and maximum heights of plant seedlings in the R+L− subplot in the watered plot vs. that of the R+L− subplot in the control plot and in the R+L+ subplot in the watered plot, the other determined data, including species richness, the number of plant individuals, the mean and maximum heights of plant seedlings, and the dry biomass, were statistically greater in the subplots in the watered plot than the combined data in the corresponding subplots in the control plot. In addition, the corresponding values in the R+L+ subplot in the watered plot, i.e., synergistic effects of plant roots, forest litter, and seasonal drought, were widely present in the process of controlling plant diversity and seedling growth in the herbaceous later on the ground surface of forest.

4. Discussion

4.1. Impacts of Forest Litter on Plant Diversity and Seedling Growth in the Herbaceous Layer

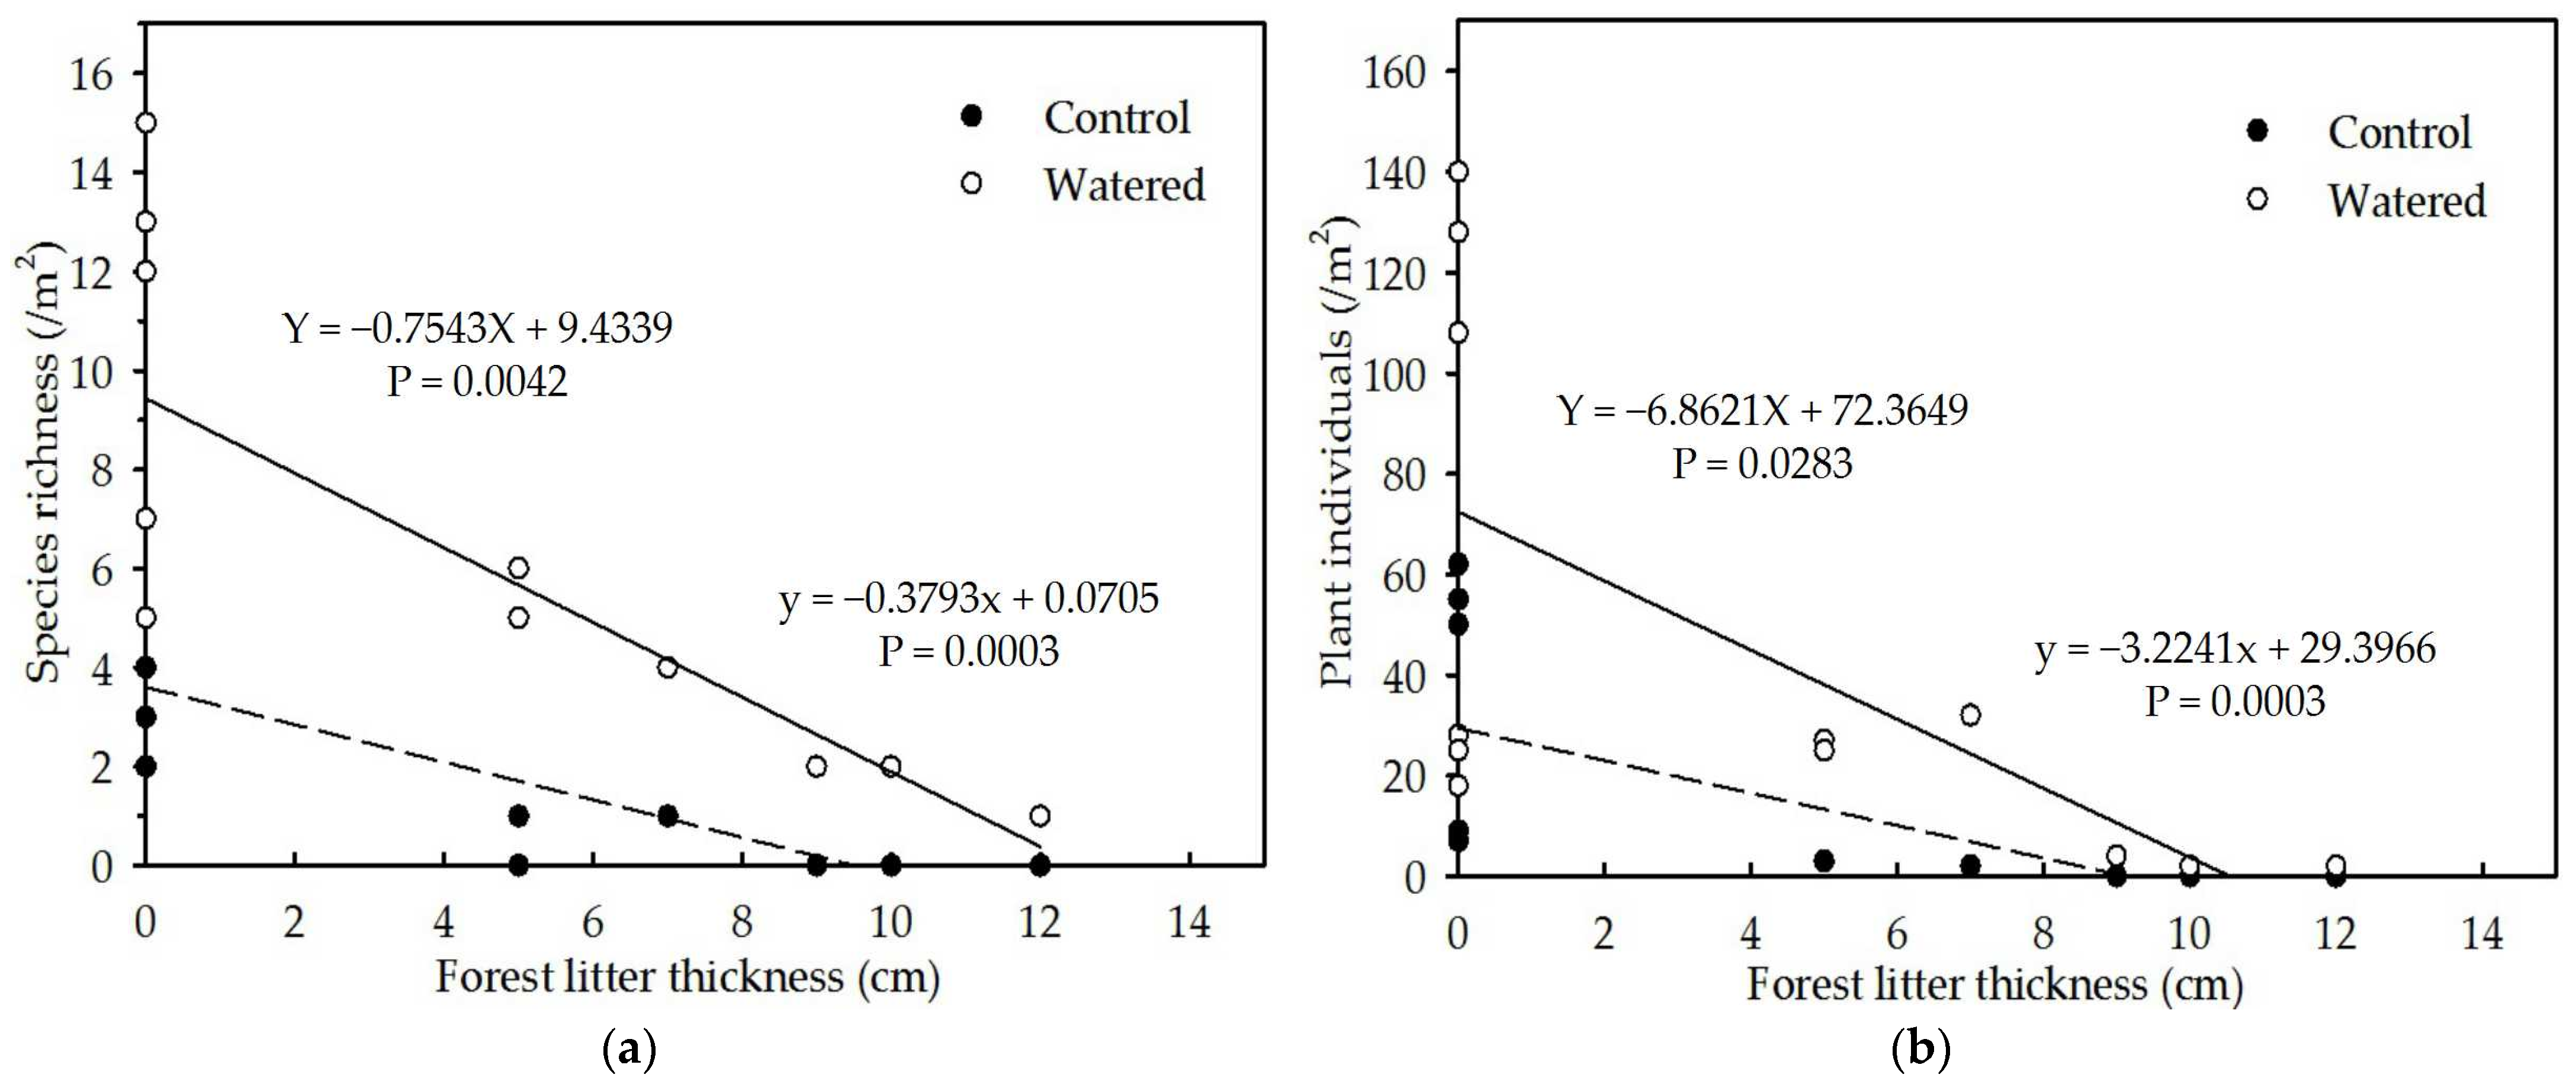
Forest litter regulates plant diversity and seedling growth in four ways: physical impacts, chemical reactions, biological interactions, and biochemical functioning [35,36]. Thick layers of necromass increase coarse organic matter inputs to mineral soil, which can improve soil structure, reduce soil bulk density, and increase soil porosity to benefit plant seed germination and seedling growth [36,37]. Physical damage can arise from massive deposits of coarse necromass and litter and prevent seedling establishment [38,39]. The chemical release of organic carbon and nutrients from forest litter can be used by plant seedlings [40,41,42]. The massive recruitment and rapid growth of seedlings at the beginning of the wet season and after disturbance are primarily functions of sufficient soil moisture, adequate soil nutrients, and abundant light [15,40,43]. Variations in species composition and the elemental stoichiometry of forest leaf litter result in varying plant biomass, decomposition dynamics, soil nutrients, and microbial communities in soil, which can regulate forest microenvironments, species composition, and plant diversity [13,16,44,45]. The biochemical interactions among plants in forests, i.e., allelopathy, can also promote or inhibit seed germination and seedling growth [46,47,48]. In the control plot of our study, forest litter significantly reduced species richness, the number of plant individuals, the mean and maximum heights of plant seedlings, and the dry biomass of plant seedlings. During weekly plot management, we found that many plant seeds in the thick litter layer were isolated from the mineral soil by leaf litter and stored in the thick litter layer during the dry season. Although some plant seeds could germinate during the wet season, their primary roots were unable to pass through the thick litter layer to reach the mineral soil before the next dry season came, which likely resulted in seedling mortality. We fitted the linear relationships between the thickness of forest litter, plant diversity, and the individuals among all the subplots, which showed apparent negative linear relationships (Figure 8). A few plant seedlings buried in the thick litter layer during the next dry season may not survive because they will not be able to compete with the strong root systems of surrounding adult trees for low soil moisture and nutrients. In addition, some seeds of plant species require light to germinate, while some some require dark environments, resulting in different plant compositions between the L− and L+ subplots. We found many bryophyte species (Pogonatum inflexum (Lindb.) Lac., Tortula subulata Hedw., Hypnum plumaeforme Wils., and Funaria hygrometrica Hedw.) and many bryophyte individuals in the R+L− and R−L− subplots in the control and watered plots, which proved that forest litter could inhibit the growth of bryophyte species.

4.2. Impacts of Plant Roots on Plant Diversity and Seedling Growth in the Herbaceous Layer

With the exception of forest litterfall, plants interact with soil and soil microbes mainly through roots [49,50,51]. Existing plant roots in the soil can inhibit root growth and the extension of surrounding plants through competition for soil moisture and nutrients, which are both greatly limited during seasonal drought, regardless of forest type, including boreal, temperate, subtropical, and tropical forests [52,53,54,55]. Adult trees often have much stronger root systems than annual or biennial herbaceous plants and woody seedlings. The strong root systems of adult tree individuals have overwhelming advantages in soil water absorption and nutrient uptake over the small root systems of plant seedlings, especially during the dry season when soil moisture and nutrient availability is greatly limited [56,57,58]. Therefore, seedlings and small trees are more likely threatened by carbon and nutrient starvation than adult trees in forests, especially under drought stress [59,60,61]. Certainly, the withered roots of dead adult trees can decompose and release organic carbon and various nutrients to soil systems, and support seedlings by providing sufficient light resources in forest gaps [62,63,64]. In addition, root exudates can be a promoter or an inhibitor in the process of seed germination and seedling growth of forest understory plants [65,66,67]. In the control plot of our study, strong root systems of adult trees surrounding the subplots depressed all five determined plant variables. At least four reasons could potentially explain this: (1) The strong root systems of adult trees occupied most of the living space in the topsoil, resulting in less living space, or none at all, for plants in the herbaceous layer [68]. (2) There might have been fierce competition for soil moisture and nutrients from surrounding adult trees [68]. (3) The soil microbial population coexisting with the strong root systems of adult trees negatively influenced the normal growth of plants in the herbaceous layer [69]. (4) The plant roots of adult trees in the R+L+ subplots might exude some secondary metabolites that inhibit seed germination and seedling growth [65,66,67]. In the R+L− subplot of the control plot, all five determined plant variables were greater in value than those in the R−L+ subplot, indicating that plant roots had stronger inhibition ability than litterfall. We found more woody roots and less herbaceous roots in the control R+L+ subplot than in the control R+L− subplot, indicating that most of the released organic carbon and nutrients, from litterfall to mineral soil, were absorbed by the woody root systems of adult trees. In the R+L+ and R−L− subplots of the control plot, thick and dry forest litter buried plant seeds and obstructed them from reaching relative wet humus and mineral soil during the dry season, resulting in most seeds being kept in the thick litter, and less seedlings being present in the control subplots than in the corresponding treatments in the watered plot. Meanwhile, some plant seeds that required a dark environment to germinate could absorb enough water and germinate in the thick and wet litter, resulting in different plant composition and richness between the control and watered plots. For example, C. camphora and B. papyrifera were established in the L+ subplots, but do not appear in the L− subplots.

4.3. Impacts of Seasonal Drought on Plant Diversity and Seedling Growth in the Herbaceous Layer

In theory, from seed germination to a strong plant individual that is capable of surviving seasonal drought, the individual requires suitable soil moisture, temperature, light exposure, and soil nutrients to survive its juvenile period [70,71,72]. The reality is that many seeds germinate and continually grow to be small seedlings during the wet season, but most germinated seeds and small seedlings cannot survive the following dry season in most subtropical and tropical seasonal forests. This phenomenon is especially apparent during frequent seasonal drought in the context of global climate change [43,73,74]. Under these circumstances, only plant species that are tolerant of alternate dry and wet seasons through various growth strategies can survive continually and be the dominant species in their local forest ecosystem [43,73,74]. In the R+L+ subplot of the watered plot, the five determined variables of plant seedlings were statistically greater than those in the R+L+ subplot in the control plot, demonstrating that less precipitation and lower soil moisture during the dry season clearly inhibited plant diversity and seedling growth in the herbaceous layer. Many seeds that were buried in thick forest litter could germinate and grow into small seedlings at the beginning of the wet season, including S. wallichii, Q. franchetii, Q. acutissima, and all grass species, but then withered away during the next dry season in the control plot. Many herbaceous plants, and some seedlings of woody plants mentioned above, however, could survive the next dry season in the watered plot. These study results are consistent with previous studies [43,73,74]. In addition, in the R+L+ subplot of the control plot, a small amount of Hypnum plumaeforme Wils. grew in the wet season and withered in the dry season, while there were only two plant species (C. camphora and P. carnosa) in the R+L+ subplot of the watered plot, with one individual for each. This is probably because consistently wet litter can continuously decompose and release nutrients to support adult tree species, and potentially certain seedlings in the herbaceous layer, on the ground surface in the R+L+ subplot in the watered plot, and because adequate soil moisture and released nutrients from forest litter can support adult tree species, and some bryophyte flora, only during the wet season in the R+L+ subplot in the control plot.

4.4. Synergistic Effect of Plant Roots, Forest litter, and Seasonal Drought on Plant Diversity and Seedling Growth in the Herbaceous Layer

Forest development and evolution, as well as forest structure and plant composition, are usually regulated by various environmental factors, such as climate [25], geography [75], soil types and nutrients [76], hydrology [77], wind [78], and fire [79]. In the Caribbean, forest ecosystems are impacted by topography, soil types, dry and wet seasons, and frequent hurricanes [80,81,82,83], while in North America, the main disturbances in various forest ecosystems include droughts, fires, hurricanes, tornadoes, storms, snow avalanches, and landslides [83,84,85,86]. In Europe, most terrestrial ecosystems are severely threatened by various extreme climates in the context of global climate change [14,15,87]. In Yunnan province of China, where this study was performed, most forest ecosystems experience various extreme climate conditions and climate-driven risks resulting from intensive global climate change, such as warming, storms, tornadoes, fires, and extreme droughts [88,89,90]. Simultaneously, intensive global climate change impacts South Asian and Indian monsoons, resulting in the irregularity of annual dry and wet seasons [91,92,93]. The typical characteristics of these changes include drier dry seasons and wetter wet seasons, abrupt temperature rises, rainfall occurring unexpectedly and intensely, and droughts accompanied by an increased risk of severe wild fires [17,94,95,96]. These environmental factors can negatively impact canopy-dominant woody species, as well as seed germination and seedling growth in the herbaceous layer, thereby potentially affecting future forest structure [52,53,54]. In this study, the experimental results not only demonstrate that forest litter, plant roots, and seasonal drought individually affect plant diversity and seedling growth in the herbaceous layer but also that they inhibit plant diversity and seedling growth in the subplots via their interactions. Interaction patterns between plant roots and forest litter are not always consistent, which likely shows synergistic effects for the number of plant individuals, the maximum height of plant seedlings and dry biomass, and the additive effects for species richness and the mean height of plant seedlings because plant roots and forest litter play different roles in controlling various plant variables (i.e., different controlled environmental factors contribute varying forces to various plant variables) [97,98,99]. However, the synergistic effects of the three independent variables of plant roots, forest litter, and seasonal drought is the fact. Frequent and severe seasonal drought resulting from global climate change creates dry environmental conditions in forests, which accumulate thick forest litter (5–12 cm depth) that physically inhibits seed germination and seedling growth, and prevents litter decomposition from releasing organic carbon and nutrients to mineral soil. The limited soil nutrients are mostly absorbed by the stronger roots of adult woody trees, resulting in low plant diversity and weak plant growth. This should be one of the dominant mechanisms to regulate plant diversity and seedling growth in the herbaceous layer of forests, because all three independent variables appeared in the R+L− subplot of the control plot and totally inhibited seed germination and seedling growth. Conversely, in the R−L− subplot of the watered plot, without the inhibition of the three independent variables, all five dependent variables reached their highest levels. In addition, manipulated irrigation in the subplots with forest litter increased leachates that might inhibit seed germination and seedling growth. We investigated plant diversity and seedling growth in the herbaceous layer in different treatments of plant roots and forest litter in combination with seasonal drought. We did not extract litter nutrients and root exudates to investigate their functions on seed germination and seedling growth, which will be part of our next study.

5. Conclusions

The results of this study showed that plant roots, forest litter, and seasonal drought, and their interactions, shape plant diversity, individual density, and understory demographics and performance in the herbaceous layer on the ground surface in a montane subtropical moist evergreen broad-leaved forest of southwestern China. This supports our original hypothesis. More importantly, the synergistic effects of the three independent variables on the five dependent variables of plant seedlings were proven, indicating that the environmental factors that regulate a forest’s structure and plant composition are complex and unpredictable. The results of this study proved the following. Frequent and severe seasonal drought reduces soil moisture and microbial biomass, deposits and accumulates massive dry forest litter, and prevents forest litter decomposition and organic nutrients release, resulting in the physical inhibition of seed germination from thick litter and intense competition of soil moisture and nutrients among plant seedling, adult trees, and soil microbes. Adult trees with stronger root systems than seedlings absorb most of the soil water and nutrients during seasonal drought, and most seedlings in the herbaceous layer wither away because of water stress and nutrient starvation. This should be one of the dominant mechanisms used to control plant diversity and seedling growth in the herbaceous layer of forests.

Author Contributions

Conceptualization, methodology, validation, writing—review and editing, X.L., Y.L., L.K., D.J.L., J.A.H. and C.W.; investigation, X.L., Y.L. and L.K.; formal analysis, data curation, writing—original draft preparation, resources, visualization, supervision, project administration, and funding acquisition, X.L. All authors have read and agreed to the published version of the manuscript.

Funding

This research was funded by the Scientific Research Funding (Yunnan Provincial Department of Education, China; grant number 2019J0739) and two Scientific Research Projects of Yunnan Forestry Technological College (KY(BS)201403 and KY(ZD)201903).

Data Availability Statement

The data used to support the findings of this study are available from the corresponding author upon request.

Acknowledgments

We thank the Forestry Bureau of Yuxi City and the Logistics Management Department of Yuxi Normal University for strictly protecting the experimental forest without intense disturbances of human activity. Yinhua Qiao, working in the Library of Yuxi Normal University, and Yifan Liu, studying in the Eighth Middle School of Yuxi City, helped to manage the experimental plots during summer and winter vocations. Undergraduates in the School of Chemistry, Biology and Environment of Yuxi Normal University, including Shuangmei Zhao, Wencai Dong, Jianping Shen, Jinmei Bao, Mei Lu, Fang Liang, Xianjin Hu, Shoumei Liu, Yanxiang Li, Zhonghui Zuo, and Xingda Wang, helped to manage the experimental plots and collect experimental data.

Conflicts of Interest

The authors declare no conflict of interest.

References

  1. Feng, G.; Mi, X.; Eiserhardt, W.L.; Jin, G.; Sang, W.; Lu, Z.; Wang, X.; Li, X.; Li, B.; Sun, I. Assembly of forest communities across East Asia–insights from phylogenetic community structure and species pool scaling. Sci. Rep. 2015, 5, 9337. [Google Scholar] [CrossRef] [Green Version]
  2. Zavala, M.A.; Zea, E. Mechanisms maintaining biodiversity in Mediterranean pine-oak forests: Insights from a spatial simulation model. Plant Ecol. 2004, 171, 197–207. [Google Scholar] [CrossRef]
  3. Liu, P.; Wang, W.; Bai, Z.; Guo, Z.; Ren, W.; Huang, J.; Xu, Y.; Yao, J.; Ding, Y.; Zang, R. Competition and facilitation co-regulate the spatial patterns of boreal tree species in Kanas of Xinjiang, northwest China. For. Ecol. Manag. 2020, 467, 118167. [Google Scholar] [CrossRef]
  4. Peter, B.R.; Peter, B.; Carlson, D.; Lee, E.F.; K.Friedman, S.; David, F.G. Influence of logging, fire, and forest type on biodiversity and productivity in southern boreal forests. Ecology 2001, 82, 2731–2748. [Google Scholar] [CrossRef]
  5. Reich, P.B.; Frelich, L.E.; Voldseth, R.A.; Bakken, P.; Adair, E.C. Understorey diversity in southern boreal forests is regulated by productivity and its indirect impacts on resource availability and heterogeneity. J. Ecol. 2012, 100, 539–545. [Google Scholar] [CrossRef]
  6. Gao, Y.; Markkanen, T.; Thum, T.; Aurela, M.; Lohila, A.; Mammarella, I.; Kämäräinen, M.; Hagemann, S.; Aalto, T. Assessing various drought indicators in representing summer drought in boreal forests in Finland. Hydrol. Earth Syst. Sci. 2015, 12, 8091–8129. [Google Scholar] [CrossRef] [Green Version]
  7. Bernhardt-Römermann, M.; Baeten, L.; Craven, D.; De Frenne, P.; Hédl, R.; Lenoir, J.; Bert, D.; Brunet, J.; Chudomelová, M.; Decocq, G. Drivers of temporal changes in temperate forest plant diversity vary across spatial scales. Glob. Chang. Biol. 2015, 21, 3726–3737. [Google Scholar] [CrossRef]
  8. Dar, J.A.; Sundarapandian, S. Patterns of plant diversity in seven temperate forest types of Western Himalaya, India. J. Asia-Pac. Biodivers. 2016, 9, 280–292. [Google Scholar] [CrossRef] [Green Version]
  9. Bedford, B.L.; Walbridge, M.R.; Aldous, A. Patterns in nutrient availability and plant diversity of temperate North American wetlands. Ecology 1999, 80, 2151–2169. [Google Scholar] [CrossRef]
  10. Wright, J.S. Plant diversity in tropical forests: A review of mechanisms of species coexistence. Oecologia 2002, 130, 1–14. [Google Scholar] [CrossRef]
  11. Corlett, R.T. Plant diversity in a changing world: Status, trends, and conservation needs. Plant Divers. 2016, 38, 10–16. [Google Scholar] [CrossRef] [PubMed] [Green Version]
  12. Wang, Z.; Fang, J.; Tang, Z.; Lin, X. Patterns, determinants and models of woody plant diversity in China. Proc. R. Soc. B Biol. Sci. 2011, 278, 2122–2132. [Google Scholar] [CrossRef] [PubMed]
  13. Veen, G.; Fry, E.L.; ten Hooven, F.C.; Kardol, P.; Morriën, E.; De Long, J.R. The role of plant litter in driving plant-soil feedbacks. Front. Environ. Sci. 2019, 7, 168. [Google Scholar] [CrossRef]
  14. Esmailzadeh, O.; Hosseini, S.; Tabari, M. Relationship between soil seed bank and above-ground vegetation of a mixed-deciduous temperate forest in northern Iran. J. Agric. Sci. Technol. 2011, 13, 411–424. Available online: https://jast.modares.ac.ir/article-23-9196-en.html (accessed on 27 August 2022).
  15. Cortez, J. Field decomposition of leaf litters: Relationships between decomposition rates and soil moisture, soil temperature and earthworm activity. Soil Biol. Biochem. 1998, 30, 783–793. [Google Scholar] [CrossRef]
  16. Erickson, H.E.; Helmer, E.; Brandeis, T.J.; Lugo, A.E. Controls on fallen leaf chemistry and forest floor element masses in native and novel forests across a tropical island. Ecosphere 2014, 5, 1–28. [Google Scholar] [CrossRef] [Green Version]
  17. Likasiri, C.; Duangdai, E.; Pongvuthithum, R. Mathematical model on the effects of global climate change and decreasing forest cover on seasonal rainfall in Northern Thailand. Ecol. Model. 2014, 272, 388–393. [Google Scholar] [CrossRef]
  18. Schuldt, B.; Buras, A.; Arend, M.; Vitasse, Y.; Beierkuhnlein, C.; Damm, A.; Gharun, M.; Grams, T.E.; Hauck, M.; Hajek, P. A first assessment of the impact of the extreme 2018 summer drought on Central European forests. Basic Appl. Ecol. 2020, 45, 86–103. [Google Scholar] [CrossRef]
  19. Lindner, M.; Maroschek, M.; Netherer, S.; Kremer, A.; Barbati, A.; Garcia-Gonzalo, J.; Seidl, R.; Delzon, S.; Corona, P.; Kolström, M. Climate change impacts, adaptive capacity, and vulnerability of European forest ecosystems. For. Ecol. Manag. 2010, 259, 698–709. [Google Scholar] [CrossRef]
  20. Derose, R.J.; Long, J.N. Drought-driven disturbance history characterizes a southern Rocky Mountain subalpine forest. Can. J. For. Res. 2012, 42, 1649–1660. [Google Scholar] [CrossRef]
  21. Canelles, Q.; Aquilué, N.; James, P.M.A.; Lawler, J.; Brotons, L. Global review on interactions between insect pests and other forest disturbances. Landsc. Ecol. 2021, 36, 945–972. [Google Scholar] [CrossRef]
  22. Rowland, L.; da Costa, A.C.; Oliveira, A.A.; Almeida, S.S.; Ferreira, L.V.; Malhi, Y.; Metcalfe, D.B.; Mencuccini, M.; Grace, J.; Meir, P. Shock and stabilisation following long-term drought in tropical forest from 15 years of litterfall dynamics. J. Ecol. 2018, 106, 1673–1682. [Google Scholar] [CrossRef] [Green Version]
  23. Barba, J.; Lloret, F.; Yuste, J.C. Effects of drought-induced forest die-off on litter decomposition. Plant Soil 2015, 402, 91–101. [Google Scholar] [CrossRef] [Green Version]
  24. Edwards, W.; Krockenberger, A. Seedling mortality due to drought and fire associated with the 2002 El Nino event in a tropical rain forest in north-east Queensland, Australia. Biotropica 2006, 38, 16–26. [Google Scholar] [CrossRef]
  25. Peñuelas, J.; Rico, L.; Ogaya, R.; Jump, A.S.; Terradas, J. Summer season and long-term drought increase the richness of bacteria and fungi in the foliar phyllosphere of Quercus ilex in a mixed Mediterranean forest. Plant Biol. 2012, 14, 565–575. [Google Scholar] [CrossRef]
  26. Peters, M.P.; Iverson, L.R.; Matthews, S.N. Long-term droughtiness and drought tolerance of eastern US forests over five decades. For. Ecol. Manag. 2015, 345, 56–64. [Google Scholar] [CrossRef] [Green Version]
  27. Huang, W.H.; Sui, Y.; Yang, X.G.; Dai, W.S.; Li, M.S. Characteristics and adaptation of seasonal drought in southern China under the background of climate change. III. Spatiotemporal characteristics of seasonal drought in southern China based on the percentage of precipitation anomalies. Chin. J. Appl. Ecol. 2013, 24, 397–406. [Google Scholar]
  28. Ahmed, K.; Shahid, S.; Chung, E.S.; Wang, X.J.; Harun, S.B. Climate change uncertainties in seasonal drought severity-area-frequency curves: Case of arid region of Pakistan. J. Hydrol. 2019, 570, 473–485. [Google Scholar] [CrossRef]
  29. Jain, M.K.; Jain, V.K.; Pandey, R.P. Impact of Climate Change on Extreme Drought Events in Ken River Basin, India. In Proceedings of the Asabe International Meeting Sponsored by Asabe, Dallas, TX, USA, 29 July–1 August 2012; p. 121340846. [Google Scholar] [CrossRef]
  30. Lin, C.; Wang, K.; Chen, R.; Zhang, J.; Zhang, B.; Lu, J.Z. Characteristics of erosive rainfall in Jianshan River Watershed of Yuxi City. Bull. Soil Water Conserv. 2018, 38, 235–240. [Google Scholar] [CrossRef]
  31. Wu, J.; Man, Y.; Sun, G.; Shang, L. Occurrence and health-risk assessment of trace metals in raw and boiled drinking water from rural areas of China. Water 2018, 10, 641. [Google Scholar] [CrossRef] [Green Version]
  32. Schielzeth, H.; Nakagawa, S. Nested by desing: Model fitting and interpretation in a mixed model era. Methods Ecol. Evol. 2013, 4, 14–24. [Google Scholar] [CrossRef]
  33. Cabin, R.J.; Weller, S.G.; Lorence, D.H.; Cordell, S.; Hadway, L.J. Effects of microsite, water, weeding, and direct seeding on the regeneration of native and alien species within a Hawaiian dry forest preserve. Biol. Conserv. 2002, 104, 181–190. [Google Scholar] [CrossRef]
  34. Cola, V.D.; Broennimann, O.; Petipierre, B.; Breiner, F.T.; D’Amen, M.; Randin, C.; Engler, R.; Pottier, J.; Pio, D.; Dubuis, A.; et al. Ecospat: An R package to support spatial analyses and modeling of species niches and distributions. Ecography 2017, 40, 774–787. [Google Scholar] [CrossRef]
  35. Han, A.R.; Kim, H.J.; Jung, J.B.; Park, P.S. Seed germination and initial seedling survival of the subalpine tree species, Picea jezoensis, on different forest floor substrates under elevated temperature. For. Ecol. Manag. 2018, 429, 579–588. [Google Scholar] [CrossRef]
  36. Jourgholami, M.; Fathi, K.; Labelle, E.R. Effects of litter and straw mulch amendments on compacted soil properties and Caucasian alder (Alnus subcordata) growth. New For. 2020, 51, 349–365. [Google Scholar] [CrossRef]
  37. Dickinson, C.H. Decomposition of Litter in Soil. Biology of Plant Litter Decomposition (2); Dickinson, C.H., Pugh, G.J.F., Eds.; Academic Press Inc.: London, UK, 2012; pp. 633–658. [Google Scholar]
  38. Kostel-Hughes, F.; Young, T.P.; Wehr, J.D. Effects of leaf litter depth on the emergence and seedling growth of deciduous forest tree species in relation toseed size1. J. Torrey Bot. Soc. 2005, 132, 50–61. [Google Scholar] [CrossRef]
  39. Seiwa, K.; Watanabe, A.; Saitoh, T.; Kannu, H.; Akasaka, S. Effects of burying depth and seed size on seedling establishment of Japanese chestnuts, Castanea crenata. For. Ecol. Manag. 2002, 164, 149–156. [Google Scholar] [CrossRef]
  40. Lodge, D.J.; Scatena, F.; Asbury, C.; Sanchez, M. Fine litterfall and related nutrient inputs resulting from Hurricane Hugo in subtropical wet and lower montane rain forests of Puerto Rico. Biotropica 1991, 23, 336–342. [Google Scholar] [CrossRef]
  41. Bellingham, P.J.; Morse, C.W.; Buxton, R.P.; Bonner, K.I.; Mason, N.W.; Wardle, D.A. Litterfall, nutrient concentrations and decomposability of litter in a New Zealand temperate montane rain forest. N. Z. J. Ecol. 2013, 37, 162–173. Available online: https://www.jstor.org/stable/24060777 (accessed on 1 May 2013).
  42. Yang, G.L.; Li, J.Q.; Zuo, M.; Sun, K.; Hu, J. Litter production variation and nutrient return of Pinus yunnanensis forest in Mopan Mountains in Central Yunnan Plateau. Ecol. Environ. Sci. 2019, 28, 2158–2164. [Google Scholar] [CrossRef]
  43. Condit, R.; Engelbrecht, B.M.; Pino, D.; Pérez, R.; Turner, B.L. Species distributions in response to individual soil nutrients and seasonal drought across a community of tropical trees. Proc. Natl. Acad. Sci. USA 2013, 110, 5064–5068. [Google Scholar] [CrossRef] [PubMed] [Green Version]
  44. Zhang, Y.; Zou, J.; Meng, D.; Dang, S.; Zhou, J.; Osborne, B.; Ren, Y.; Liang, T.; Yu, K. Effect of soil microorganisms and labile C availability on soil respiration in response to litter inputs in forest ecosystems: A meta-analysis. Ecol. Evol. 2020, 10, 13602–13612. [Google Scholar] [CrossRef]
  45. Wu, B.; Guo, Y.; He, M.; Han, X.; Zang, L.; Liu, Q.; Chen, D.; Xia, T.; Shen, K.; Kang, L.; et al. AM fungi endow greater plant biomass and soil nutrients under interspecific competition rather than nutrient releases for litter. Forests 2021, 12, 1704. [Google Scholar] [CrossRef]
  46. Huo, X.; Wang, D.; Bing, D.; Li, Y.; Kang, H.; Yang, H.; Wei, G.; Chao, Z. Appropriate removal of forest litter is beneficial to Pinus tabuliformis Carr. regeneration in a pine and oak mixed forest in the Qinling Mountains, China. Forests 2019, 10, 735. [Google Scholar] [CrossRef] [Green Version]
  47. Jin, M.; Wang, Z.; He, Z.; Jiang, L.; Liu, J.; Lan, Y.; Shi, Y.; Shen, C. Allelopathic effect of castanopsis kawakamii forest litter on seed germination of small Philippine acacia (Acacia confusa). Appl. Ecol. Environ. Res. 2019, 17, 15103–15116. [Google Scholar] [CrossRef]
  48. Wu, C.; Chen, Y.; Grenier-Héon, D. Effects of allelopathy and availability of nutrients and water resources on the survival and growth of plant species in a natural Dacrydium forest. Can. J. For. Res. 2022, 52, 100–108. [Google Scholar] [CrossRef]
  49. Ruan, H.H.; Zou, X.M.; Scatena, F.N.; Zimmerman, J.K. Asynchronous fluctuation of soil microbial biomass and plant litterfall in a tropical wet forest. Plant Soil 2004, 260, 147–154. [Google Scholar] [CrossRef]
  50. Sayer, E.J.; Heard, M.S.; Grant, H.K.; Marthews, T.R.; Tanner, E.V. Soil carbon release enhanced by increased tropical forest litterfall. Nat. Clim. Chang. 2011, 1, 304–307. [Google Scholar] [CrossRef]
  51. Jia, S.X.; Liu, S.F.; Lin, W.S.; Li, X.J.; Yang, L.M.; Sun, S.Y.; Hui, D.F.; Guo, J.F.; Zou, X.M.; Yang, Y.S. Tree roots exert greater influence on soil microbial necromass carbon than above-ground litter in subtropical natural and plantation forests. Soil Biol. Biochem. 2022, 173, 108811. [Google Scholar] [CrossRef]
  52. Allison, S.D.; Treseder, K.K. Warming and drying suppress microbial activity and carbon cycling in boreal forest soils. Glob. Chang. Biol. 2008, 14, 2898–2909. [Google Scholar] [CrossRef] [Green Version]
  53. Zhou, Z.; Wang, C.; Jin, Y. Stoichiometric responses of soil microflora to nutrient additions for two temperate forest soils. Biol. Fertil. Soils 2017, 53, 397–406. [Google Scholar] [CrossRef]
  54. Wang, Q.; Wang, S.; He, T.; Liu, L.; Wu, J. Response of organic carbon mineralization and microbial community to leaf litter and nutrient additions in subtropical forest soils. Soil Biol. Biochem. 2014, 71, 13–20. [Google Scholar] [CrossRef]
  55. Peña-Claros, M.; Poorter, L.; Alarcón, A.; Blate, G.; Choque, U.; Fredericksen, T.S.; Justiniano, M.J.; Leaño, C.; Licona, J.C.; Pariona, W. Soil effects on forest structure and diversity in a moist and a dry tropical forest. Biotropica 2012, 44, 276–283. [Google Scholar] [CrossRef]
  56. Niinemets, Ü. Responses of forest trees to single and multiple environmental stresses from seedlings to mature plants: Past stress history, stress interactions, tolerance and acclimation. For. Ecol. Manag. 2010, 260, 1623–1639. [Google Scholar] [CrossRef]
  57. Bever, J.D.; Dickie, I.A.; Facelli, E.; Facelli, J.M.; Klironomos, J.; Moora, M.; Rillig, M.C.; Stock, W.D.; Tibbett, M.; Zobel, M. Rooting theories of plant community ecology in microbial interactions. Trends Ecol. Evol. 2010, 25, 468–478. [Google Scholar] [CrossRef] [Green Version]
  58. Hartmann, H.; Adams, H.D.; Hammond, W.M.; Hoch, G.; Landhäusser, S.M.; Wiley, E.; Zaehle, S. Identifying differences in carbohydrate dynamics of seedlings and mature trees to improve carbon allocation in models for trees and forests. Environ. Exp. Bot. 2018, 152, 7–18. [Google Scholar] [CrossRef]
  59. Landhäusser, S.M.; Lieffers, V.J. Defoliation increases risk of carbon starvation in root systems of mature aspen. Trees 2012, 26, 653–661. [Google Scholar] [CrossRef]
  60. Yan, T.; Zhu, J.; Song, H.; Yang, K. Resorption-related nitrogen changes in the leaves and roots of Larix kaempferi seedlings under nutrient-sufficient and nutrient-starvation conditions. J. Plant Ecol. 2019, 12, 615–623. [Google Scholar] [CrossRef]
  61. Wiley, E.; Hoch, G.; Landhäusser, S.M. Dying piece by piece: Carbohydrate dynamics in aspen (Populus tremuloides) seedlings under severe carbon stress. J. Exp. Bot. 2017, 68, 5221–5232. [Google Scholar] [CrossRef] [Green Version]
  62. Lu, D.; Wang, G.G.; Yan, Q.; Gao, T.; Zhu, J. Effects of gap size and within-gap position on seedling growth and biomass allocation: Is the gap partitioning hypothesis applicable to the temperate secondary forest ecosystems in Northeast China? For. Ecol. Manag. 2018, 429, 351–362. [Google Scholar] [CrossRef]
  63. Bentos, T.V.; Nascimento, H.E.; Williamson, G.B. Tree seedling recruitment in Amazon secondary forest: Importance of topography and gap micro-site conditions. For. Ecol. Manag. 2013, 287, 140–146. [Google Scholar] [CrossRef]
  64. Eichhorn, M.P.; Nilus, R.; Compton, S.G.; Hartley, S.E.; Burslem, D.F. Herbivory of tropical rain forest tree seedlings correlates with future mortality. Ecology 2010, 91, 1092–1101. [Google Scholar] [CrossRef] [PubMed]
  65. Badri, D.V.; Vivanco, J.M. Regulation and function of root exudates. Plant Cell Environ. 2009, 32, 666–681. [Google Scholar] [CrossRef]
  66. Wang, N.; Kong, C.; Wang, P.; Meiners, S.J. Root exudate signals in plant–plant interactions. Plant Cell Environ. 2021, 44, 1044–1058. [Google Scholar] [CrossRef]
  67. Nakayama, M.; Tateno, R. Solar radiation strongly influences the quantity of forest tree root exudates. Trees 2018, 32, 871–879. [Google Scholar] [CrossRef]
  68. Coomes, D.A.; Grubb, P.J. Impacts of root competition in forests and woodlands: A theorectical framework and review of experiments. Ecol. Monogr. 2000, 70, 171–207. [Google Scholar] [CrossRef]
  69. Rudgers, J.A.; Orr, S. Non-native grass alters growth of native tree species via leaf and soil microbes. J. Ecol. 2009, 97, 247–255. [Google Scholar] [CrossRef]
  70. Su, X.; Wang, M.; Huang, Z.; Fu, S.; Chen, H.Y. Forest understorey vegetation: Colonization and the availability and heterogeneity of resources. Forests 2019, 10, 944. [Google Scholar] [CrossRef] [Green Version]
  71. Onwuka, B.; Mang, B. Effects of soil temperature on some soil properties and plant growth. Adv. Plants Agric. Res. 2018, 8, 34–37. [Google Scholar] [CrossRef]
  72. Smith, L.M.; Reynolds, H.L. Plant–soil feedbacks shift from negative to positive with decreasing light in forest understory species. Ecology 2015, 96, 2523–2532. [Google Scholar] [CrossRef]
  73. Stella, J.C.; Battles, J.J. How do riparian woody seedlings survive seasonal drought? Oecologia 2010, 164, 579–590. [Google Scholar] [CrossRef]
  74. Esquivel-Muelbert, A.; Baker, T.R.; Dexter, K.G.; Lewis, S.L.; Ter Steege, H.; Lopez-Gonzalez, G.; Monteagudo Mendoza, A.; Brienen, R.; Feldpausch, T.R.; Pitman, N. Seasonal drought limits tree species across the Neotropics. Ecography 2017, 40, 618–629. [Google Scholar] [CrossRef] [Green Version]
  75. Jucker, T.; Bongalov, B.; Burslem, D.F.; Nilus, R.; Dalponte, M.; Lewis, S.L.; Phillips, O.L.; Qie, L.; Coomes, D.A. Topography shapes the structure, composition and function of tropical forest landscapes. Ecol. Lett. 2018, 21, 989–1000. [Google Scholar] [CrossRef] [PubMed] [Green Version]
  76. Rivera, L.W.; Aide, T.M. Forest recovery in the karst region of Puerto Rico. For. Ecol. Manag. 1998, 108, 63–75. [Google Scholar] [CrossRef]
  77. Tsai, C.J.; Lin, T.C.; Hwong, J.L.; Lin, N.H.; Wang, C.P.; Hamburg, S. Typhoon impacts on stream water chemistry in a plantation and an adjacent natural forest in central Taiwan. J. Hydrol. 2009, 378, 290–298. [Google Scholar] [CrossRef]
  78. Dale, V.H.; Joyce, L.A.; McNulty, S.; Neilson, R.P.; Ayres, M.P.; Flannigan, M.D.; Hanson, P.J.; Irland, L.C.; Lugo, A.E.; Peterson, C.J. Climate change and forest disturbances: Climate change can affect forests by altering the frequency, intensity, duration, and timing of fire, drought, introduced species, insect and pathogen outbreaks, hurricanes, windstorms, ice storms, or landslides. Bioscience 2001, 51, 723–734. [Google Scholar] [CrossRef] [Green Version]
  79. Vara-Vela, A.L.; Herdies, D.L.; Alvim, D.S.; Vendrasco, D.P.; Fernandez, J.P.R. A new predictive framework for Amazon forest fire smoke dispersion over South America. Bull. Am. Meteorol. Soc. 2021, 102, 1700–1713. [Google Scholar] [CrossRef]
  80. Frizano, J.; Johnson, A.H.; Vann, D.R.; Scatena, F.N. Soil phosphorus fractionation during forest development on landslide scars in the Luquillo Mountains, Puerto Rico. Biotropica 2002, 34, 17–26. [Google Scholar] [CrossRef]
  81. Boose, E.R.; Serrano, M.I.; Foster, D.R. Landscape and regional impacts of hurricanes in Puerto Rico. Ecol. Monogr. 2004, 74, 335–352. [Google Scholar] [CrossRef]
  82. Helmer, E.H. Forest conservation and land development in Puerto Rico. Landsc. Ecol. 2004, 19, 29–40. [Google Scholar] [CrossRef]
  83. Mage, S.M.; Porder, S. Parent material and topography determine soil phosphorus status in the Luquillo Mountains of Puerto Rico. Ecosystems 2013, 16, 284–294. [Google Scholar] [CrossRef]
  84. Hyndman, D.; Hyndman, D. Natural Hazards and Disasters; Cengage Learning: Stanford, CA, USA, 2016; pp. 247–317. [Google Scholar]
  85. Clague, J.; Bobrowsky, P. International year of planet earth 8. natural hazards in Canada. Geosci. Can. 2010, 37, 17–37. Available online: https://id.erudit.org/iderudit/geocan37_1ser01 (accessed on 1 January 2010).
  86. Agrawal, N. Natural Disasters and Risk Management in Canada; Springer: Berlin/Heidelberg, Germany, 2018; pp. 81–191. [Google Scholar]
  87. Babst, F.; Carrer, M.; Poulter, B.; Urbinati, C.; Neuwirth, B.; Frank, D. 500 years of regional forest growth variability and links to climatic extreme events in Europe. Environ. Res. Lett. 2012, 7, 045705. [Google Scholar] [CrossRef]
  88. Abbas, S.; Nichol, J.; Qamer, F.; Xu, J. Characterization of drought development through remote sensing: A case study in central Yunnan, China. Remote Sens. 2014, 6, 4998–5018. [Google Scholar] [CrossRef] [Green Version]
  89. Wang, J.; Meng, Y. An analysis of the drought in Yunnan, China, from a perspective of society drought severity. Nat. Hazards 2013, 67, 431–458. [Google Scholar] [CrossRef]
  90. Liu, B.X.; Lund, J.R.; Liu, L.J.; Liao, S.L.; Li, G.; Cheng, C.T. Climate change impacts on hydropower in Yunnan, China. Water 2020, 12, 197. [Google Scholar] [CrossRef] [Green Version]
  91. Turner, A.G.; Annamalai, H. Climate change and the south Asian summer monsoon. Nat. Clim. Chang. 2012, 2, 587–595. [Google Scholar] [CrossRef]
  92. Syed, F.S.; Iqbal, W.; Syed, A.; Rasul, G. Uncertainties in the regional climate models simulations of South-Asian summer monsoon and climate change. Clim. Dyn. 2014, 42, 2079–2097. [Google Scholar] [CrossRef]
  93. Yang, B.; Qin, C.; Bruning, A.; Osborn, T.J.; Stenseth, N.C. Long-term decrease in Asian monsoon rainfall and abrupt climate change events over the past 6,700 years. Proc. Natl. Acad. Sci. USA 2021, 118, e2102007118. [Google Scholar] [CrossRef]
  94. Padrón, R.S.; Gudmundsson, L.; Decharme, B.; Ducharne, A.; Seneviratne, S.I. Observed changes in dry-season water availability attributed to human-induced climate change. Nat. Geosci. 2020, 13, 477–481. [Google Scholar] [CrossRef]
  95. Chang, H.I.; Castro, C.L.; Carrillo, C.M.; Dominguez, F. The more extreme nature of U.S. warm season climate in the recent observational record and two “well-performing” dynamically downscaled CMIP3 models. J. Geophys. Res. Atmos. 2015, 120, 8244–8263. [Google Scholar] [CrossRef]
  96. Mitchell, R.J.; Liu, Y.Q.; O’Brien, J.J.; Elliott, K.J.; Starr, G.; Miniat, C.F.; Hiers, J.K. Future climate and fire interactions in the southeastern region of the United States. For. Ecol. Manag. 2014, 327, 316–326. [Google Scholar] [CrossRef]
  97. Jactel, H.; Koricheva, J.; Castagneyrol, B. Responses of forest insect pests to climate change: Not so simple. Curr. Opin. Insect Sci. 2019, 35, 103–108. [Google Scholar] [CrossRef]
  98. Kane, J.M.; Varner, J.M.; Metz, M.R.; Van Mantgem, P.J. Characterizing interactions between fire and other disturbances and their impacts on tree mortality in western U.S. Forests. For. Ecol. Manag. 2017, 405, 188–199. [Google Scholar] [CrossRef]
  99. Mahon, C.L.; Holloway, G.L.; Bayne, E.M.; Toms, J.D. Additive and interactive cumulative effects on boreal landbirds: Winners and losers in a multi-stressor landscape. Ecol. Appl. 2019, 29, e01895. [Google Scholar] [CrossRef] [PubMed]
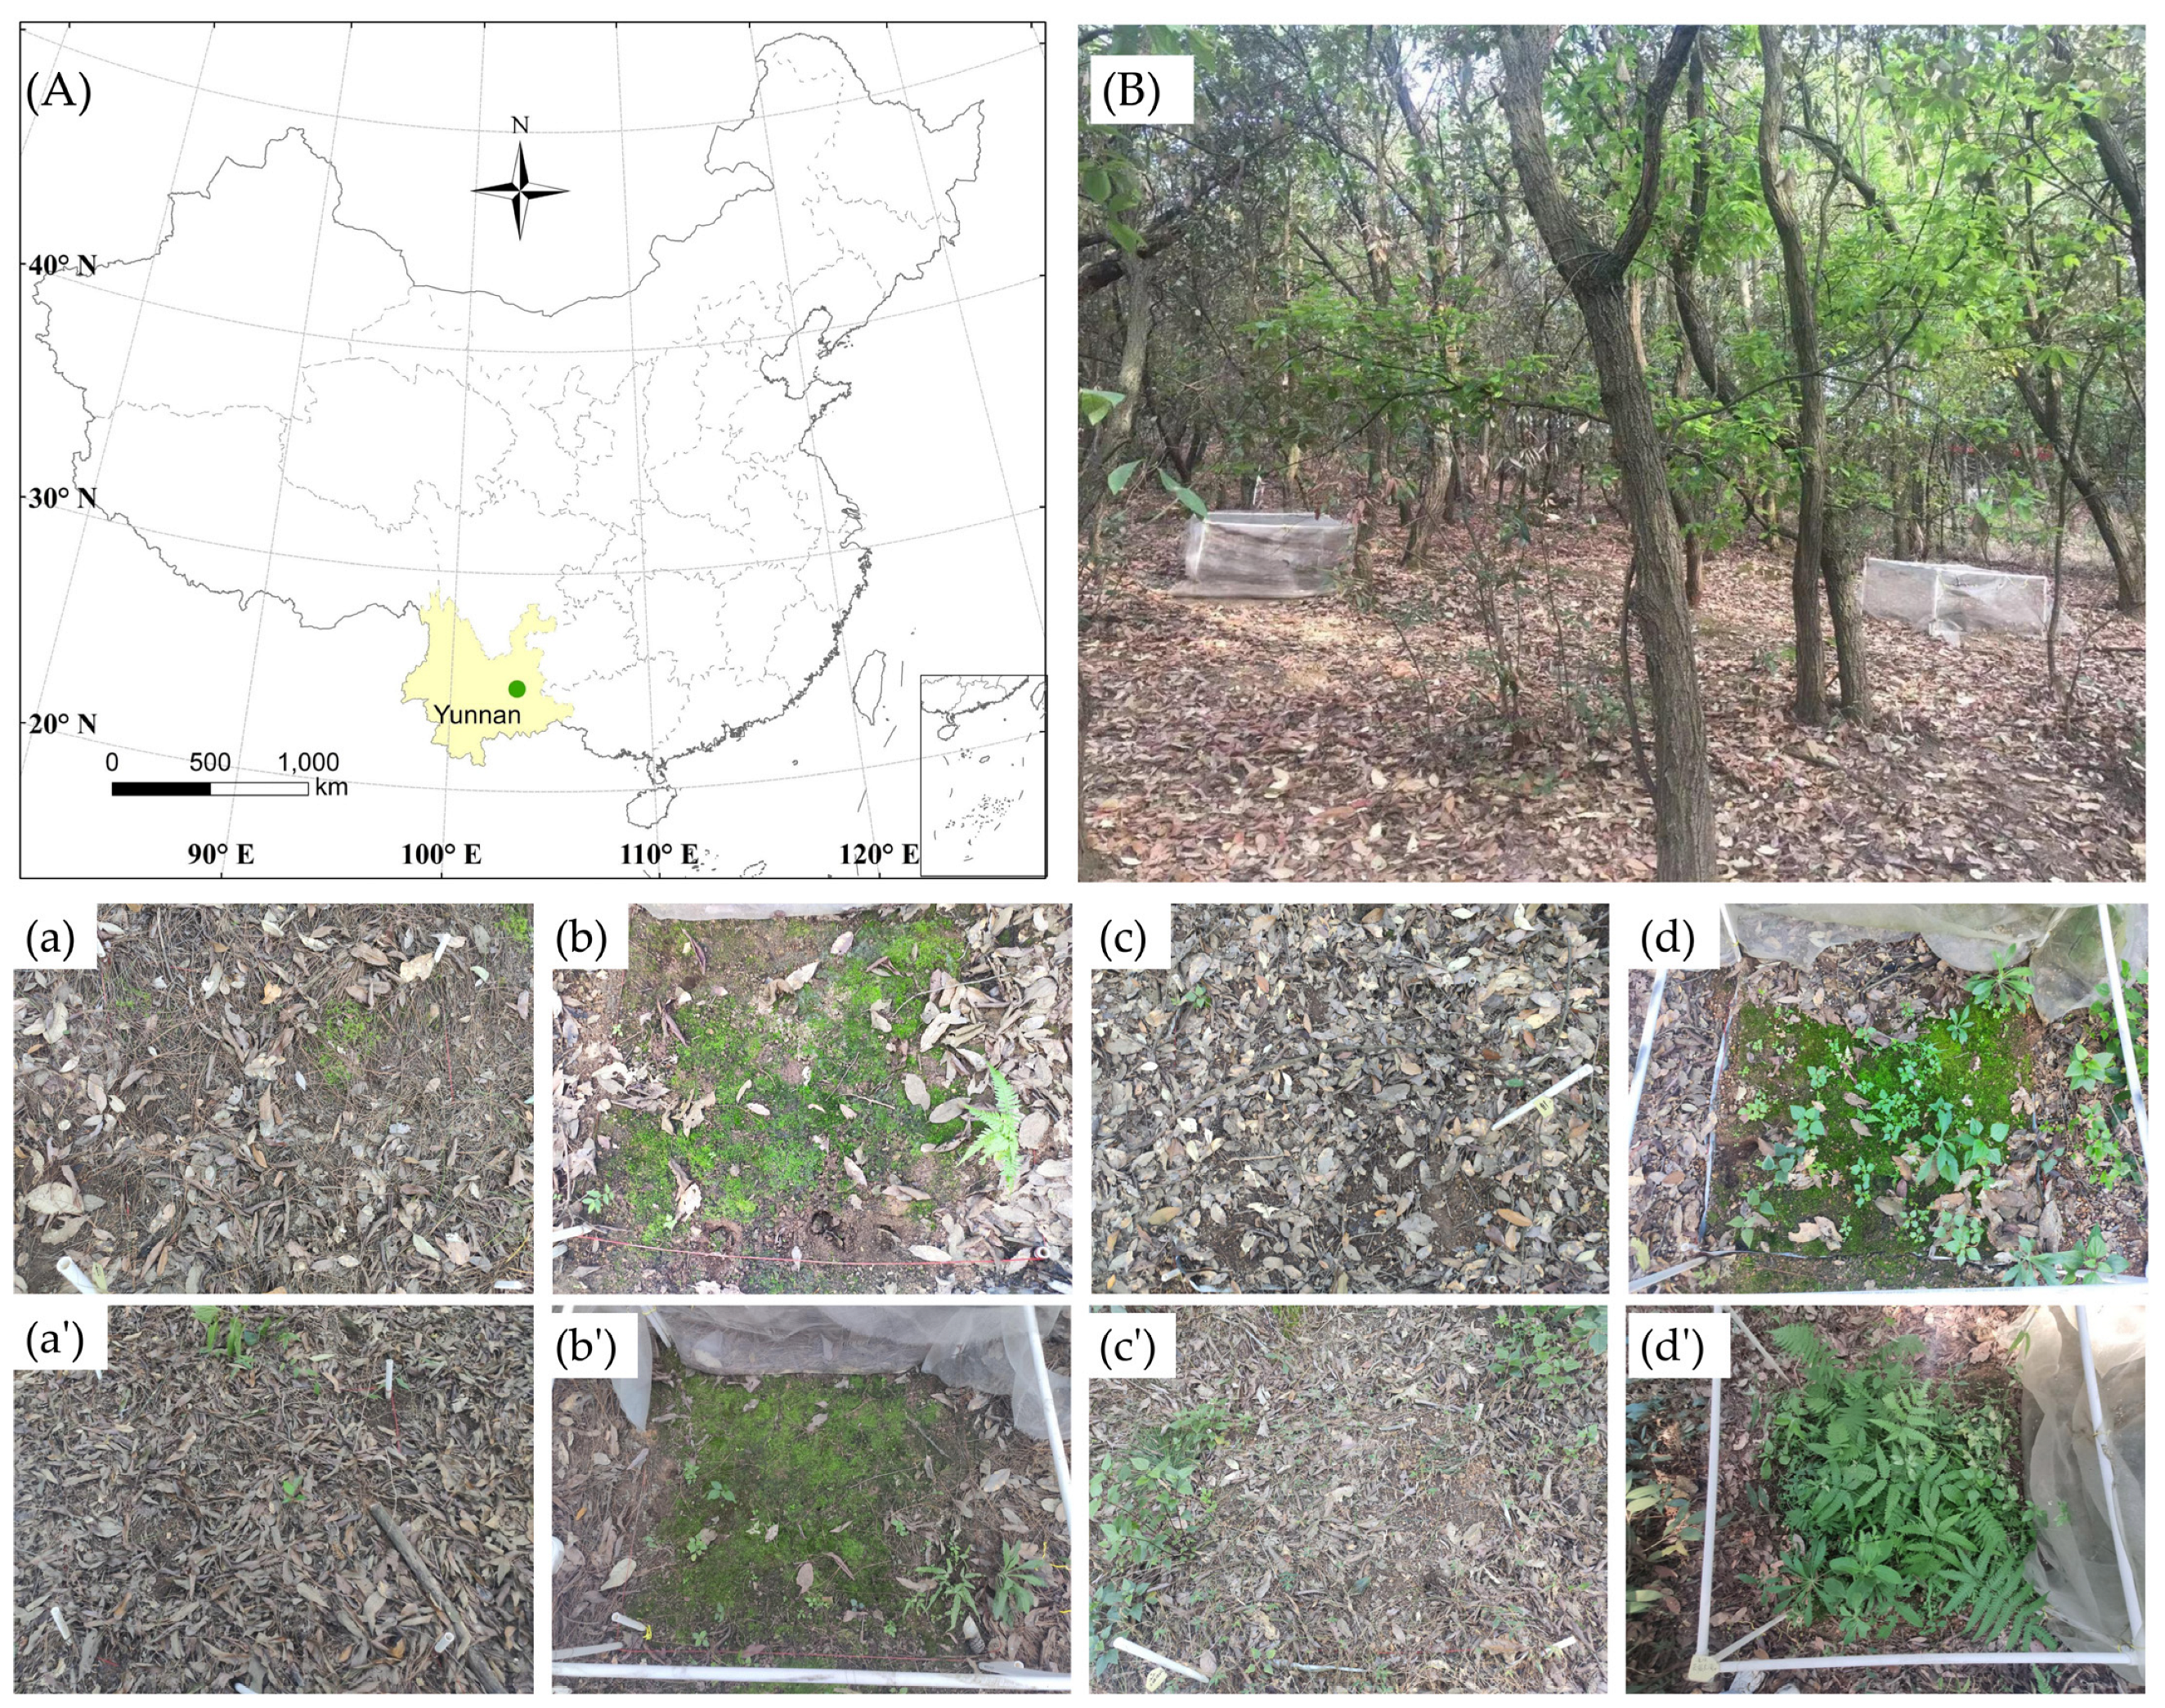
Figure 1. (A) Study site in Yunnan province of southwestern China (the area in light yellow is Yunnan province and the blue solid circle denotes the study site). (B) Photo of the forest in this study. Control subplots: (a) the subplot with plant roots and forest litter inclusion; (b) the subplot with plant roots inclusion, but forest litter exclusion; (c) the subplot with plant roots exclusion, but forest litter inclusion; (d) the subplot with plant roots and forest litter exclusion. Watered subplots: (a′) the subplot with plant roots and forest litter inclusion; (b′) the subplot with plant roots inclusion, but forest litter exclusion; (c′) the subplot with plant roots exclusion, but forest litter inclusion; (d′) the subplot with plant roots and forest litter exclusion in watered plot.
Forests 14 00712 g001
Figure 2. Layout of the three replicates and four subplots within each replicate in control and watered plots. Each replicate was randomly established in the field experimental plot. The order and treatment of the four subplots in each replicate were assigned randomly. The scale of the field experimental plot was 200 m × 50 m, the scale of each replicate was 20 m × 20 m, and the scale of each treatment subplot was 1 m × 1 m.
Forests 14 00712 g002
Figure 3. The crossed design of this study. Factor 1, factor 2, and observations with solid line frame represent subplots in control plot, and the dotted line frame represent subplots in watered plot.
Forests 14 00712 g003
Figure 4. (a) Species richness and (b) the number of plant individuals (/m2; ±SE) in each experimental treatment (R+L+: the treatment with plant roots and forest litter inclusion; R+L−: the treatment with plant roots inclusion, but forest litter exclusion; R−L+: the treatment with plant roots exclusion, but forest litter inclusion; and R−L−: the treatment with plant roots and forest litter exclusion) in control and watered plots. Note: the different lowercase letters, a, b, c, and d (or a′, b′, c′, and d′), indicate statistical differences among the four experimental treatments in control plot (or in watered plot) at α = 0.05.
Forests 14 00712 g004
Figure 5. (a) Mean and (b) maximum heights (cm; ±SE) of plant seedlings in each experimental treatment in control and watered plots. Note: the different lowercase letters, a, b, c, and d (or a′, b′, c′, and d′), indicate statistical differences among the four experimental treatments in control plot (or in watered plot) at α = 0.05.
Forests 14 00712 g005
Figure 6. Dry biomass (g/m2; ±SE) of plant seedlings in each experimental treatment in control and watered plots. Note: the different lowercase letters, a, b, c, and d (or a′, b′, c′, and d′), indicate statistical differences among the four experimental treatments in control plot (or in watered plot) at α = 0.05.
Forests 14 00712 g006
Figure 7. Comparisons of (a) species richness, (b) the number of plant individuals, (c) mean height of plant seedlings, (d) maximum height of plant seedlings, and (e) the dry biomass of plant seedlings, for the corresponding separate subplots in the control plot, for the subplot with R+L+ treatment in the watered plot, and the corresponding values in the watered subplots. Values are beside the sum of values (for species richness, number of plant individuals, and dry biomass), the average value (for mean height of plant seedlings), and the maximum value (for maximum height of plant seedlings). Note: C in the front of each treatment means “control plot”; W in the front of each treatment means “watered plot”. Note: the different lowercase letters, a and b (or a′ and b′, or a″ and b″), indicate statistical differences among the four experimental treatments in control plot (or in watered plot) at α = 0.05.
Forests 14 00712 g007
Figure 8. The linear relationships of species richness (a) and (b) plant individuals with forest litter thickness in control plot (blank circle and dotted line) and watered plot (solid circle and line).
Forests 14 00712 g008
Table 1. Species richness and the number of plant individuals (/m2; ±SE) in each experimental treatment in control and watered plots.
Experimental
Plot
TreatmentScientific NameFamilyIndividuals
(/m2; ±SE)
Control plotR+L+---------
R+L−Nephrolepis cordifolia (L.) C. PreslNephrolepidaceae5 (2)
Ageratina denophora (Spreng.) R.M. King et H.Rob.Asteraceae1 (1)
Arthraxon hispidus (Trin.) MakinoGramineae1 (1)
R−L+A. adenophoraAsteraceae1 (1)
R−L−A. adenophoraAsteraceae29 (2)
N. cordifoliaNephrolepidaceae17 (3)
Erigeron acris L.Asteraceae8 (3)
Hedyotis diffusa WilldRubiaceae2 (1)
Senecio scandens Buch.-Ham. Ex D. DonAsteraceae1 (1)
Watered plotR+L+Cinnamomum camphora (L.) PreslLauraceae1 (1)
Peracarpa carnosa (Wall.) Hook. F. et Thoms.Campanulaceae1 (1)
R+L−A. adenophoraAsteraceae13 (2)
Cibotium barometz (L.) J. Sm.Dicksoniaceae3 (1)
Pteris ensiformis Burm.Pteridaceae2 (1)
Crassocephalum crepidioides (Benth.) S. MooreAsteraceae2 (1)
E. acrisAsteraceae2 (1)
R−L+A. hispidusGramineae10 (2)
A. adenophoraAsteraceae9 (1)
Youngia japonica (L.) DCAsteraceae8 (1)
P. carnosaCampanulaceae1 (1)
Broussonetia papyrifera (Linnaeus) L’Heritier ex VentenatMoraceae1 (1)
R−L−N. cordifoliaNephrolepidaceae40 (3)
Cyclosorus interruptus (Willd.) H. ItoThelypteridaceae21 (3)
A. adenophoraAsteraceae13 (2)
A. hispidusGramineae12 (3)
P. ensiformisPteridaceae10 (2)
Lespedeza bicolor Turcz.Fabaceae9 (2)
E. acrisAsteraceae6 (2)
C. barometzDicksoniaceae4 (1)
Laggera pterodonta (DC.) Benth.Asteraceae3 (1)
Y. japonicaAsteraceae3 (1)
Buddleja asiatica Lour.Scrophulariaceae3 (2)
Solanum nigrum L.Solanaceae3 (2)
Phytolacca americana L.Phytolaccaceae2 (1)
Table 2. Mean and maximum heights of plant species (cm; ±SE) in each experimental treatment in control and watered plots.
Experimental PlotTreatmentScientific NameMean Height (cm; ±SE)Maximum Height (cm; ±SE)
Control plotR+L+---------
R+L−---10.5 (1.0)22.0 (1.9)
Nephrolepis cordifolia (L.) C. Presl7.9 (0.4)7.9 (0.4)
Ageratina denophora (Spreng.) R.M. King et H.Rob.4.6 (0.6)4.6 (0.6)
R−L+Arthraxon hispidus (Trin.) Makino2.0 (0.3)2.0 (0.3)
R−L−A. adenophora7.6 (0.7)37.3 (2.8)
A. adenophora5.6 (0.3)8.7 (0.9)
N. cordifolia10.8 (0.9)27.6 (3.1)
Erigeron acris L.25.5 (2.9)29.3 (2.0)
Hedyotis diffusa Willd34.6 (1.2)34.6 (1.2)
Watered plotR+L+Senecio scandens Buch.-Ham. Ex D. Don8.7 (0.3)8.7 (0.3)
Cinnamomum camphora (L.) Presl5.9 (0.2)5.9 (0.2)
R+L−Peracarpa carnosa (Wall.) Hook. F. et Thoms.9.4 (1.6)15.8 (1.8)
A. adenophora2.5 (0.4)4.6 (0.7)
Cibotium barometz (L.) J. Sm.4.7 (0.3)6.6 (0.6)
Pteris ensiformis Burm.5.8 (0.9)12.2 (0.8)
Crassocephalum crepidioides (Benth.) S. Moore1.7 (0.6)3.2 (0.2)
R−L+E. acris64.9 (7.2)84.7 (4.4)
A. hispidus36.9 (2.8)41.3 (3.1)
A. adenophora1.7 (0.4)3.6 (0.4)
8.6 (0.8)8.6 (0.8)
P. carnosa9.6 (0.4)9.6 (0.4)
R−L−Broussonetia papyrifera (Linnaeus) L’Heritier ex Ventenat6.6 (0.2)14.8 (3.0)
N. cordifolia31.2 (3.0)73.8 (6.0)
Cyclosorus interruptus (Willd.) H. Ito30.4 (2.8)47.5 (2.6)
A. adenophora43.6 (5.3)89.6 (3.9)
A. hispidus11.7 (2.0)31.0 (3.5)
P. ensiformis5.1 (0.7)6.6 (1.9)
Lespedeza bicolor Turcz.18.7 (2.4)83.8 (5.7)
E. acris32.77 (2.9)73.9 (4.0)
C. barometz3.6 (0.6)10.5 (1.2)
Laggera pterodonta (DC.) Benth.20.6 (2.7)66.4 (4.1)
33.6 (3.2)51.7 (5.4)
Buddleja asiatica Lour.102.2 (20.5)130.2 (4.1)
Solanum nigrum L.10.2 (1.9)22.8 (1.6)
Table 3. Results of the mixed linear model in R (V 3.0.1) that tested how the four experimental treatments in control and watered plots affect the five groups of dependent variables (species richness, the number of plant individuals, mean and maximum heights, and the dry biomass of plant seedlings).
TreatmentSpecies RichnessThe Number of Plant IndividualsMean Height of Plant SeedlingsMaximum Height of Plant SeedlingsDry Biomass of Plant Seedlings
Water6.06 *82.93 *15.26 *35.00 *9.03 *
Roots−4.33 **−5.13 *−8.83 **−11.66 **−1.77 **
Litter5.00 **20.20 *7.82 *24.19 *2.07 *
Water + Roots−5.53 ***−1.72 ***−5.19 ***−12.54 ***−14.87 ***
Water + Litter6.67 ***35.57 ***15.21 ***40.43 ***20.30 ***
Roots + Litter−8.07 ***−75.92 ***−27.16 ***−64.33 ***−32.53 ***
Water + Roots + Litter−11.33 ***−89.13 ***−39.77 ***−94.67 ***−173.30 ***
Note: “*”, “**” and “***” are for significant values at <0.05, <0.01, and <0.001, respectively.
Disclaimer/Publisher’s Note: The statements, opinions and data contained in all publications are solely those of the individual author(s) and contributor(s) and not of MDPI and/or the editor(s). MDPI and/or the editor(s) disclaim responsibility for any injury to people or property resulting from any ideas, methods, instructions or products referred to in the content.