Article

Monitoring the Severity of Rubber Tree Infected with Powdery Mildew Based on UAV Multispectral Remote Sensing

1
School of Information and Communication Engineering, Hainan University, Haikou 570228, China
2
Mechanical and Electrical Engineering College, Hainan University, Haikou 570228, China
3
Institute of Scientific and Technical Information, Chinese Academy of Tropical Agricultural Sciences, Haikou 571000, China
4
Key Laboratory of Practical Research on Tropical Crops Information Technology in Hainan, Haikou 571000, China
*
Author to whom correspondence should be addressed.
These authors contributed equally to this work.
Forests 2023, 14(4), 717; https://doi.org/10.3390/f14040717
Submission received: 18 February 2023 / Revised: 8 March 2023 / Accepted: 29 March 2023 / Published: 31 March 2023
(This article belongs to the Special Issue Prevention and Control of Forest Diseases)

Abstract

:
Rubber tree powdery mildew (PM) is one of the most devastating leaf diseases in rubber forest plantations. To prevent and control PM, timely and accurate detection is essential. In recent years, unmanned Aerial Vehicle (UAV) remote sensing technology has been widely used in the field of agriculture and forestry, but it has not been widely used to detect forest diseases. In this study, we propose a method to detect the severity of PM based on UAV low-altitude remote sensing and multispectral imaging technology. The method uses UAVs to collect multispectral images of rubber forest canopies that are naturally infected, and then extracts 19 spectral features (five spectral bands + 14 vegetation indices), eight texture features, and 10 color features. Meanwhile, Pearson correlation analysis and sequential backward selection (SBS) algorithm were used to eliminate redundant features and discover sensitive feature combinations. The feature combinations include spectral, texture, and color features and their combinations. The combinations of these features were used as inputs to the RF, BPNN, and SVM algorithms to construct PM severity models and identify different PM stages (Asymptomatic, Healthy, Early, Middle and Serious). The results showed that the SVM model with fused spectral, texture, and color features had the best performance (OA = 95.88%, Kappa = 0.94), as well as the highest recognition rate of 93.2% for PM in early stages.

1. Introduction

The rubber tree is a cash crop grown in tropical and subtropical regions. The milky latex extracted from the tree is the main source of natural rubber, an essential raw material for industrial products. Rubber tree powdery mildew (PM) is one of the most important diseases of rubber trees, and is caused by Oidium hevea Steinmann (OHS) [1,2,3]. This fungus mainly attacks the young leaves, shoots and inflorescence tissues of rubber trees without attacking the old leaves, which has a significant deleterious effect on the growth and yield of rubber trees and reduces rubber latex yield by 45% [4]. The prevalence of the disease is closely related to the amount of overwintering bacteria, the weather conditions of the rubber tree during leaf-extraction period, and the climate from winter to spring [5], which is a typical climate-based disease. In the early stage of young leaves, radial silvery white mycelium appears on the leaf surface or back. With the development of the disease, the disease spots appear as a layer of white powdery material, forming white powder spots of varying sizes. When the condition is serious, both the front and back of the diseased leaves are covered with white powder, resulting in leaf crinkling deformation, yellowing, and ease of falling off; in serious stages, the new young leaves fall off in large numbers. PM is currently distributed in all rubber-growing countries around the world. It can happen all year round, but mainly occurs in the spring during the rubber tree leaf-extraction period. Traditional PM diagnosis currently relies on the regular manual visual diagnosis. However, the occurrence of PM is affected by various factors, making it difficult to acquire comprehensive and accurate disease information with traditional methods. Due to the lack of effective strategies for early diagnosis of PM, once the infected rubber trees are found, the disease has often progressed to a serious stage and has been widely infected. Therefore, it is essential to develop a large-scale detection method of PM for the control and management of rubber forest pests and diseases.
In recent decades, remote sensing has become an important tool for crop pest and disease monitoring [6,7]. Remote sensing has the advantage of non-contact, long-range monitoring and a large monitoring range that allows low-cost assessment of the spatial distribution of crop diseases [8]. Chemura et al. [9] used Sentinel-2 multispectral images to detect coffee leaf rust infection levels (healthy, moderate, and severe), and the results demonstrated that vegetation indices calculated based on spectral information of red-edge band positions had better performance in coffee leaf rust diagnosis. Zhang et al. [10] used multi-temporal HJ-CCD satellite images for mapping powdery mildew in winter wheat areas, and the results demonstrated that multi-temporal images were superior to single-temporal images for winter wheat disease monitoring, with an overall accuracy of 78%. Compared with satellite remote sensing platforms, UAV platforms have the advantages of mobility and flexibility, short-term cycle time, and low cost [11], and can be used to rapidly obtain information and implement dynamic monitoring so that disease can be better controlled. Heidarian et al. [12] acquired image data of infected wheat leaf rust and stripe rust using a UAV platform and developed a diagnostic model by analyzing the changes in typical reflectance spectra of infested leaves. Lan et al. [13] evaluated the feasibility of using drones to identify citrus yellow dragon disease over a large area. The experimental results showed that the classification accuracy of AdaBoost reached 100%, and the neural network was 97.28%. Zhang et al. [14] used hyperspectral imagery (HI) collected by an unmanned airship and hyperspectral imaging spectrometer to detect pine wilt disease at different stages of infection, and used genetic algorithms (GA) to select six sensitive spectral features to construct a pine wilt disease classification model. UAV remote sensing technology has the advantages of low cost, operational flexibility, and imaging with high spatial resolution, and can quickly complete the task of field image acquisition according to the planned route, making it ideal for forest disease detection, especially for PM (OHS general 3–7 days from infestation to spore production, new spores mature, and then spread and infestation by airflow again, the disease continues to spread and widen).
Combining texture features and vegetation indices is an effective solution for improving the accuracy of crop monitoring [15]. Texture features describe information related to pixels and their surrounding spatial distribution. They have been widely used in the field of image classification [16]. Ma et al. [17] combined multispectral vegetation indices (VIs) and texture features (TFs) to identify Erannis jacobsoni Djak severity, and used the successive projection algorithm (SPA) and analysis of variance (ANOVA) to extract sensitive features. The experimental results showed that the texture features could more easily distinguish between healthy and severely damaged categories, with an accuracy of 89.5%. Gao et al. [18] used sensitive spectral and texture features as input features to construct a wheat Fusarium head blight (FHB) monitoring model, and the experimental results showed that the fusion of spectral and texture features could improve the accuracy of the model with an accuracy of 93.63%. Liu et al. [19] also obtained similar results based on UAV multispectral data. Meanwhile, color features have successfully been used to identify crop pests and disease monitoring [20]. Dang et al. [21] proposed an automatic disease detection and classification method for radish field diseases, which first extracts sensitive color and texture features, and then uses k-means clustering to filter radish regions and feed them into a fine-tuned GoogLeNet to detect Fusarium wilt, and the model accuracy reached over 90%. These studies confirm the effectiveness of spectral, textural, and color features and their combinations in crop disease monitoring.
Current research in the detection and monitoring of PM in rubber trees is limited. In this study, we used UAV multispectral images and accurate ground truth data as the data sources and correlation analysis and sequential backward selection (SBS) to select sensitive spectral, texture and color features. Combined RF, BPNN, and SVM to construct a PM severity model to identify different PM stages. Our research goals were to (1) evaluate the performance of SF, TF and CF and their combinations based on UAV multispectral image extraction for monitoring rubber tree powdery mildew; (2) explore the best classification method for UAV images; and (3) develop a diagnosis model for asymptomatic, healthy, early, middle and serious stages of rubber tree powdery mildew using the optimal feature combinations and classification methods.

2. Materials and Methods
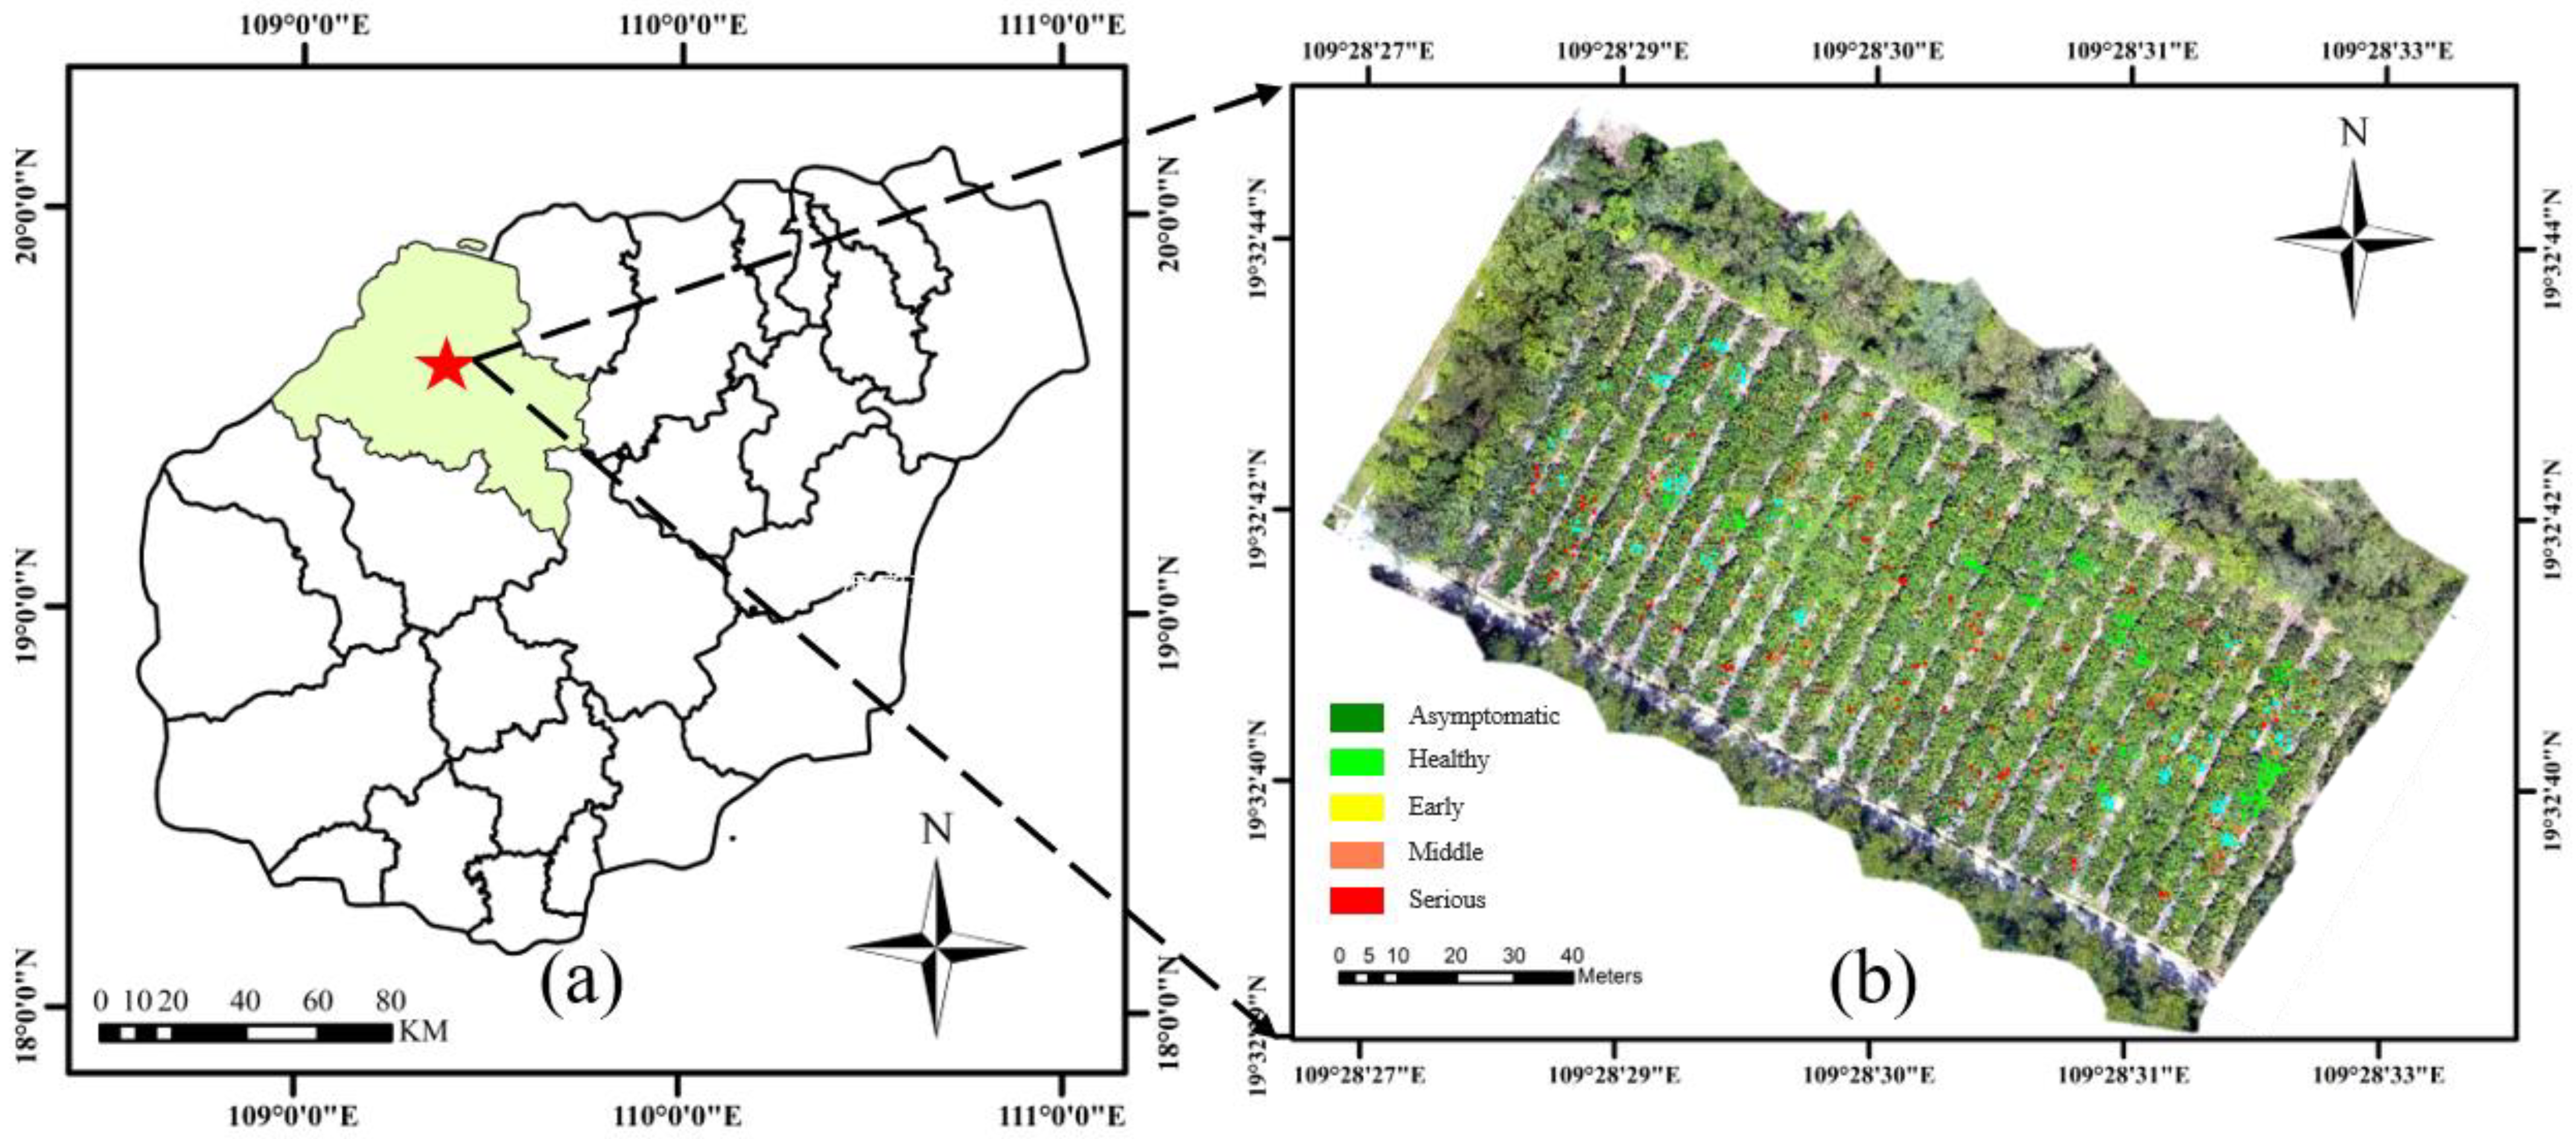
2.1. Study Area

The study area is located in the rubber forest research area of the China Academy of Tropical Agriculture, Danzhou City, Hainan Province (Figure 1). The geographical coordinates are 109°28′30″ E, 19°32′40″ N, with an elevation of 109 m. The area has a tropical marine monsoon climate with abundant sunshine and rainfall, an average annual temperature of 23.1 °C, and an average annual rainfall of 1823 mm, and the climate and soil conditions are suitable for the growth of rubber plantations. Since this area is frequently infested by PM, which seriously affects the growth of rubber trees and the production of natural rubber, this area was chosen for the experiment. This study was conducted from 24–27 April 2022, a time at which most of the rubber trees in the study area were in the leaf-extraction period, which is the epidemic period of powdery mildew of rubber trees.

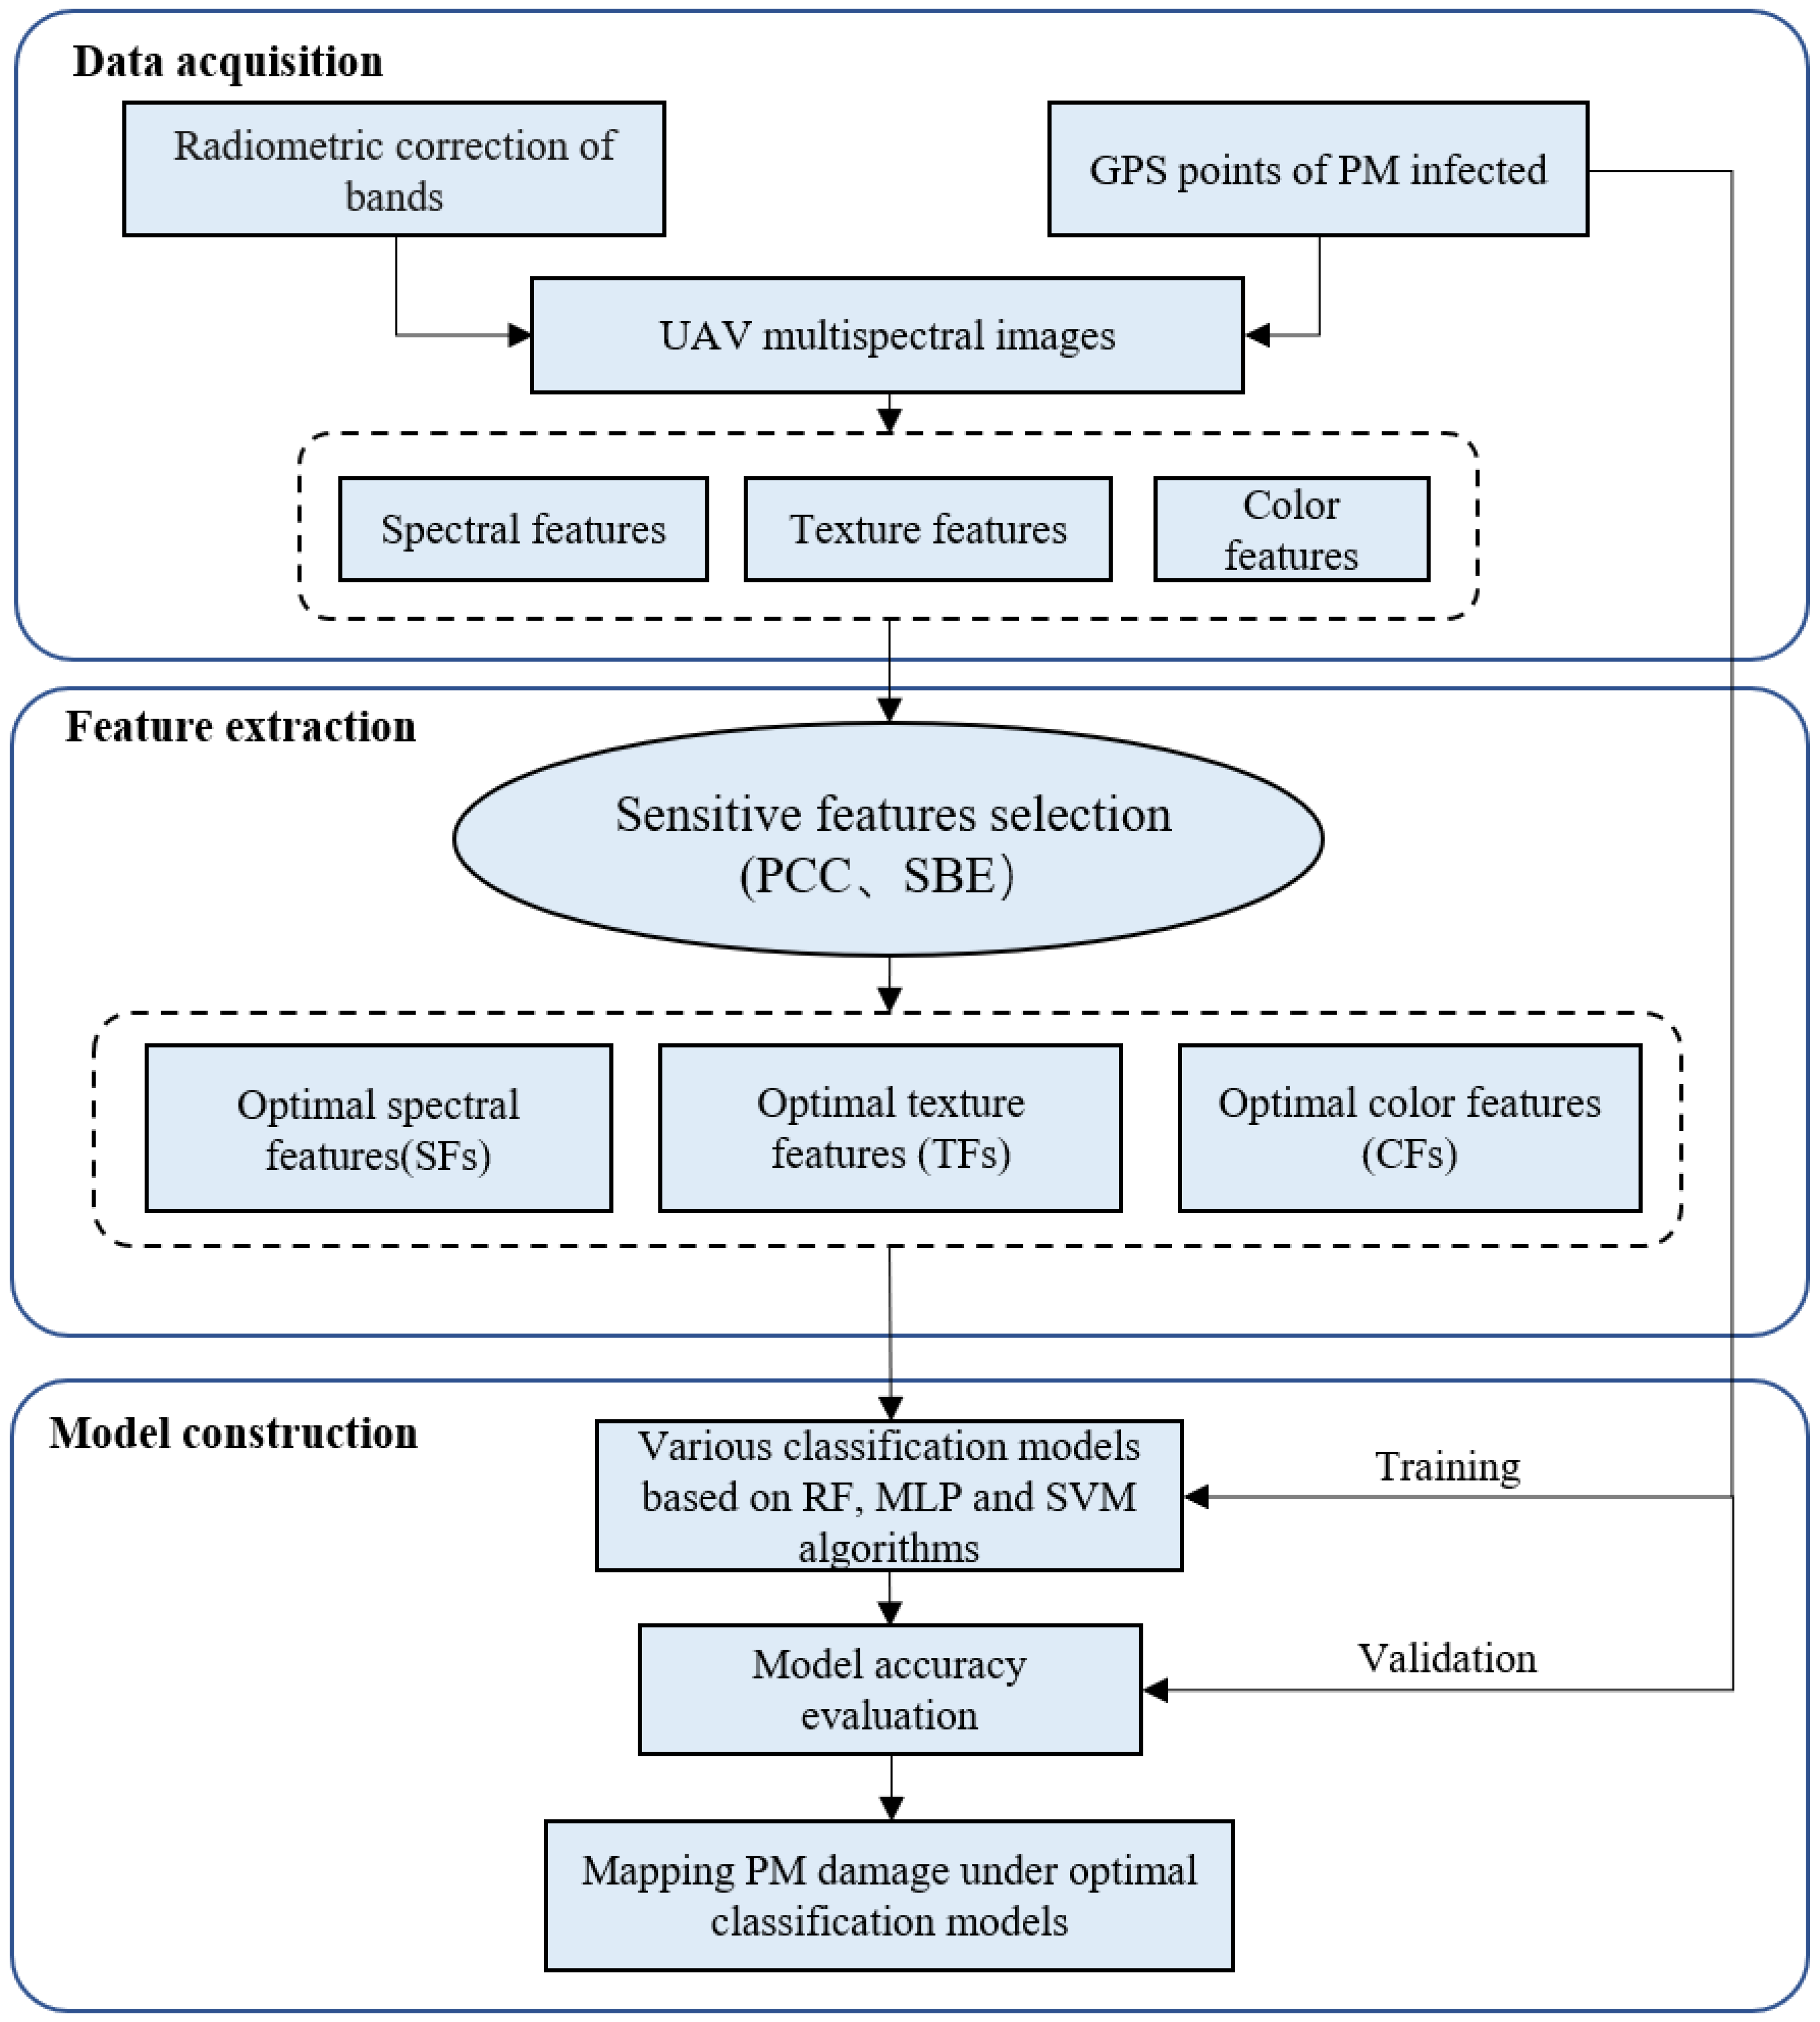
2.2. Study Framework

Figure 2 shows the framework of this study with the process of data acquisition, feature extraction and selection, and model construction. It includes the following steps: (1) UAV-based multispectral image data and ground data acquisition; (2) Extraction of spectral, texture, and color features to represent PM information; (3) Selection of the optimal combination of features of three types by using correlation analysis and the sequential backward elimination (SBE); and (4) Based on the selected three type features, we construct RF, BPNN and SVM models for accuracy evaluation and result comparison to determine the optimal feature combinations and models. Overall, we developed a new method for PM detection based on UAV images, laying the foundation for PM monitoring and early diagnosis.

2.3. Data Acquisition

2.3.1. Field Data Acquisition

The School of Mechanical and Electrical Engineering of Hainan University and the Institute of Information Research of the Chinese Academy of Tropical Sciences graded rubber tree canopies with different infection degrees with reference to the Chinese industry standard NYT 1089–2006 Technical Regulations for Rubber Tree Powdery Mildew Detection and Reporting. We conducted field data collection on 25–26 April 2022, and labeled the infection degree using a combination of leaf collection by high branch shears and photographic observation by a high-precision UAV at a low altitude of 30 m. We recorded 153 sample tree locations using a handheld D-RTK2 high-precision GNSS mobile station with a positioning accuracy of 0.01 m. Figure 3 shows the development of the rubber tree canopy at different infection stages. The infection level of PM in the rubber tree canopy was divided according to the different characteristics of the appearance of the canopy and the area of the leaf spots. For the asymptomatic stage, the canopy is characterized by abundant and mostly old leaves with a dark green color, and the percentage of infected leaves with PM is 0%. During the healthy stage, the canopy is rich and mostly consists of fresh young leaves, and the percentage of leaves infected with PM is 0%. The early stage is characterized by the beginning of leaf discoloration and the existence of a small number of spots, and the percentage of leaves infected with PM is 0%–25%. In the middle stage, the leaf turns light yellow, and most leaves have more spots; the percentage of leaves infected with PM is 25%–50%. During the serious stage, the canopy leaves are sparse, and the percentage of leaves infected with PM is >50%. The specific grading standards are shown in Table 1.

2.3.2. UAV Multispectral Image Acquisition and Pre-Processing

UAV multispectral images were acquired on 25 April 2022 under clear weather conditions using a DJI Phantom 4 multispectral (P4M) UAV equipped with a multispectral imaging system. The weather on the day of the experiment was sunny, with temperatures ranging from 24 °C to 35 °C. There had been 2 days of light rain in the previous 10 days, and the rest were sunny conditions. The multispectral system of the P4M consists of blue (450 ± 16 nm), green (560 ± 16 nm), red (650 ± 16 nm), red-edge (730 ± 16 nm), and near-infrared (840 ± 26 nm) bands. The UAV flight plan parameters were set to a flight height of 60 m, a flight speed of 4.2 M/s, a frontal overlap rate of 80%, a side overlap rate of 60%, and an image resolution of 3.2 cm/pixel. Then, 2D multispectral reconstruction was performed in DJI Terra software. Two standard reflectance panels of 0.25 and 0.5 were used to radiometrically correct the DN value of each multispectral image during the reconstruction process. Finally, digital orthophoto maps (DOM), digital elevation models (DEM), and digital surface models (DSM) were generated.

2.4. Feature Extraction and Analysis

The internal physiological changes in leaves of rubber trees infested with PM showed pathological phenomena such as reduced content of various components of chlorophyll, protein, and water. The external morphological changes showed the appearance of silvery-white radial mycelium on the leaf surface or leaf back, wrinkled deformation, and yellowing and wilting of the leaves. These changes generate different spectral, textural, and color properties. Therefore, we chose to reflect the internal physiological and external morphological changes in PM using these three types (i.e., spectral, textural, and color) of features.
According to previous studies [13,20,22], we calculated 14 vegetation indices (as shown in Table 2) in addition to the five original band data for spectral features. These vegetation indices can reflect general parameters such as pigmentation, photosynthetic efficiency, and crop leaf area index, representing PM from multiple perspectives. For texture features, we compressed the multispectral images using principal component analysis (PCA) to reduce data redundancy, and found the cumulative variance of the first principal component image (PC1) and the second principal component image (PC2) exceeded 99.5%, so it was used to extract texture features. The texture features were extracted using the gray-level co-generation matrix (GLCM) method [23], and 8 texture features were selected, including Mean (Mea), Variance (Var), Homogeneity (Hom), Contrast (Con), Dissimilarity (DIS), Entropy (Ent), Second Moment (Sem), and Correlation (Cor). In this study, PCA and texture feature extraction were completed using the PCA calculation tool and the GLCM extraction tool in ENVI 5.3 software. For color features, we calculated color features by combining multispectral bands (Red, Green, Blue). Then, we selected 10 color features (ExB, ExG, ExR, GLA, IKAW, MGRVI, NGRDI, RGBVI, VARI, WI) from other crop disease monitoring literature [20,24], as shown in Table 3.
The above three feature types do not all contribute to the detection of PM, and the redundant features can negatively affect the performance and stability of the classification model. Therefore, selecting the sensitive feature combinations for PM is necessary to eliminate those features that are irrelevant and redundant.
PCCfs is used to measure the correlation between two feature variables and output the covariance and the entropy of standard deviation between two variables as the correlation coefficient r .
r = i = 1 n X i X ¯ Y i Y ¯ i = 1 n X i X ¯ 2 i 1 n Y i Y ¯ 2
Stepwise selection (ST) includes sequential forward selection (SFS) and sequential backward selection (SBS) [40]. The SFS algorithm starts with an empty subset of features and adds features step by step until the classification performance is no longer improved. On the other hand, the SBS algorithm starts with a subset of all available features and then gradually deletes features from that set. In this study, SBS is chosen for feature selection, while the maximum and minimum p-values of the retained or removed features are set to 0.1 and 0.15, respectively.

2.5. Modeling Methods

Random forest (RF) [41], back propagation neural network (BPNN) [42], and support vector machine (SVM) [43] were used to construct a PM diagnosis model with three types of remote sensing features as independent variables and PM infection degree samples as dependent variables.
The RF algorithm model is an ensemble learning method whose output category is determined by the plurality of the output categories of each decision tree. The essence of the decision tree is the classification of the data structure as a tree structure. Its input is a feature vector X consisting of multiple features of the sample and the corresponding resultant value vector Y, and the prediction of the input. The RF algorithm can avoid overfitting and has better tolerance to noise and outliers. There are four important parameters in RF: max_depth, min_samples_leaf, min_samples_split, and n_estimators. max_depth indicates the maximum depth of the decision tree. Min_samples_leaf indicates the minimum number of samples limiting the number of leaf nodes. Min_samples_split indicates the minimum number of samples required for internal node subdivision. N_estimators indicates the maximum number of weak learners.
The BPNN algorithm model Is based on back propagation of error to train the data set for error minimization, which is the most widely used neural network. It has the advantages of self-learning and being self-adaptive. The structure of a typical BP neural network includes three parts: input layer, hidden layer and output layer, and each layer is connected by weights. The basic idea is based on the gradient descent method to minimize the mean square error between the actual output value and the expected output value. There are five important parameters in BPNN: activation, alpha, hidden_layer_sizes, learning_rate, and solver. The activation function is designed to help the network learn complex patterns in the data. Alpha is the L2 penalty parameter. hidden_layer_sizes is the number of control neurons. learning_rate is used for weight update. Solver is used to optimizing the weights, commonly used are lbfgs, sgd, adam.
The SVM algorithm model is a widely used classification model. It separates samples of different classes with minimum error using an optimal hyperplane constructed in a high-dimensional space. There are three important parameters in SVM: kernel function, penalty factor (C), and gamma. The kernel function projects the feature vectors into a higher dimensional space, making the data linearly separable after projection. Gamma is the coefficient of the kernel function that determines the distribution of the data after the projection in the higher dimensional space. The penalty factor (C) is used to control the penalty factor of the loss function. The larger the C, the greater the penalty for misclassification, but the easier it is to cause over-fitting, and vice versa.

2.6. Accuracy Assessment

In this experiment, 645 canopy samples were selected from 153 trees, including 93 asymptomatic samples, 171 healthy samples, 126 early samples, 132 intermediate samples, and 123 severe samples, and finally all sample data were divided into training and validation sets in a ratio of 7:3. Meanwhile, in order to perform a comprehensive evaluation of the performance of the model, we used the descriptors of true positive (TP), false positive (FP), true negative (TN) and false negative (FN) to form a confusion matrix, and thus calculated the evaluation parameters of the model, including four indicators of recall, f1-score, overall accuracy (OA) and kappa coefficient to evaluate the effectiveness of detecting PM infection levels. The model construction and data analysis in this work was conducted with Python (anaconda 4.14.0), machine learning library scikit-learn 0.21.0 within the Windows 10 operating system.

3. Results

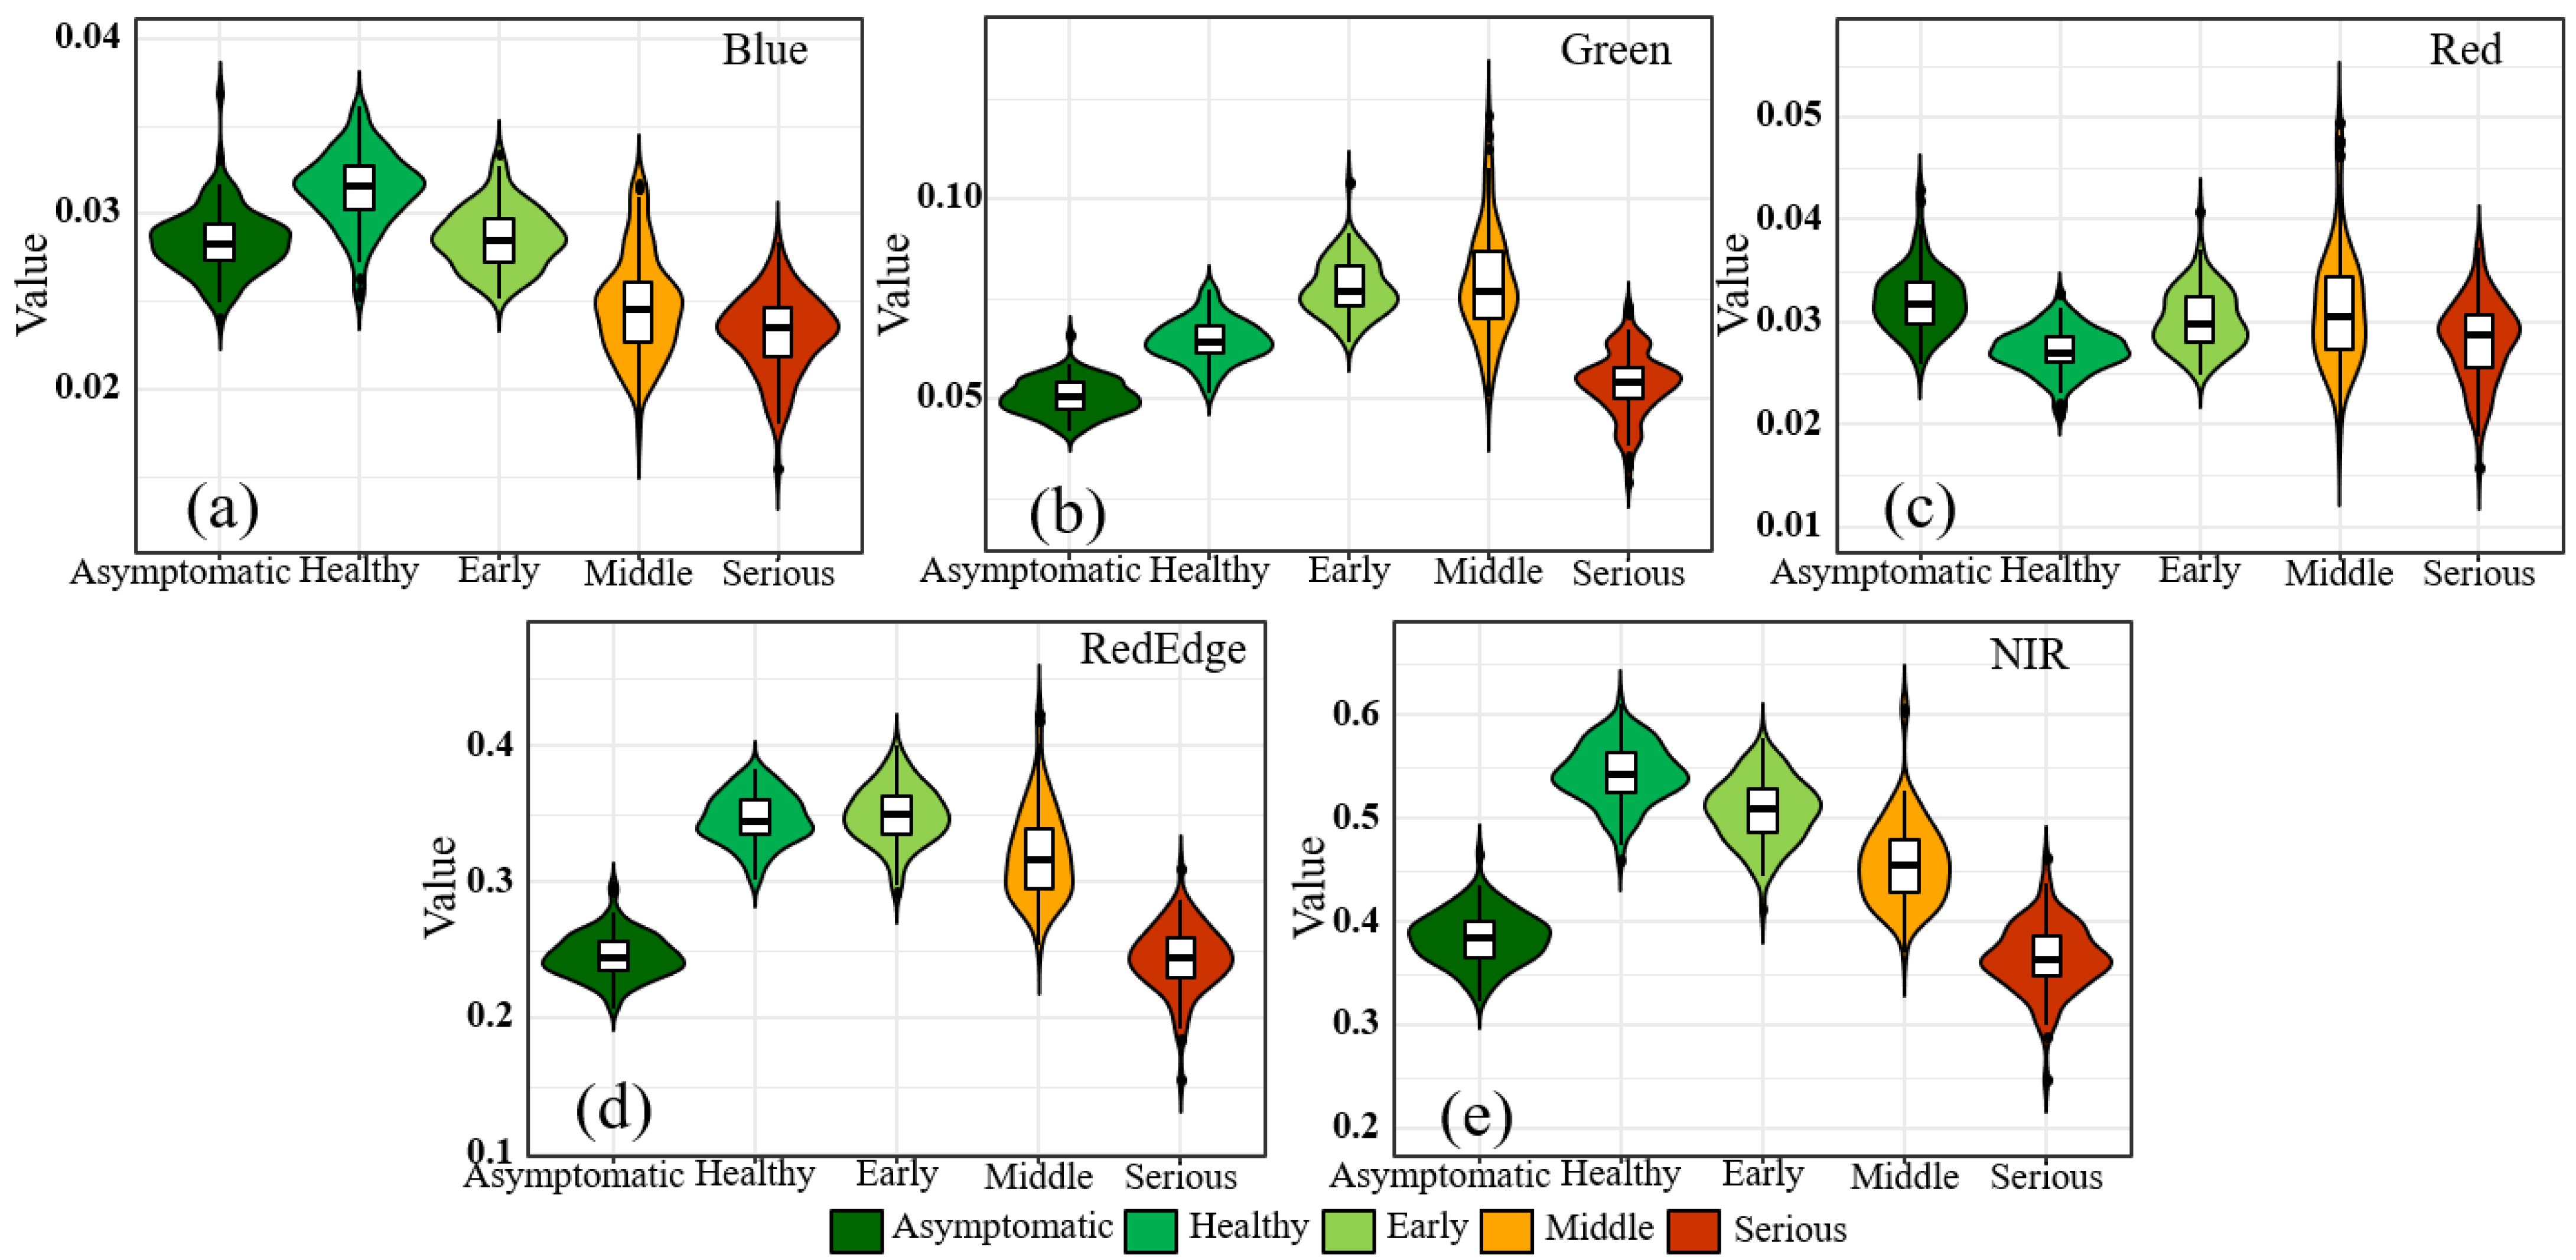
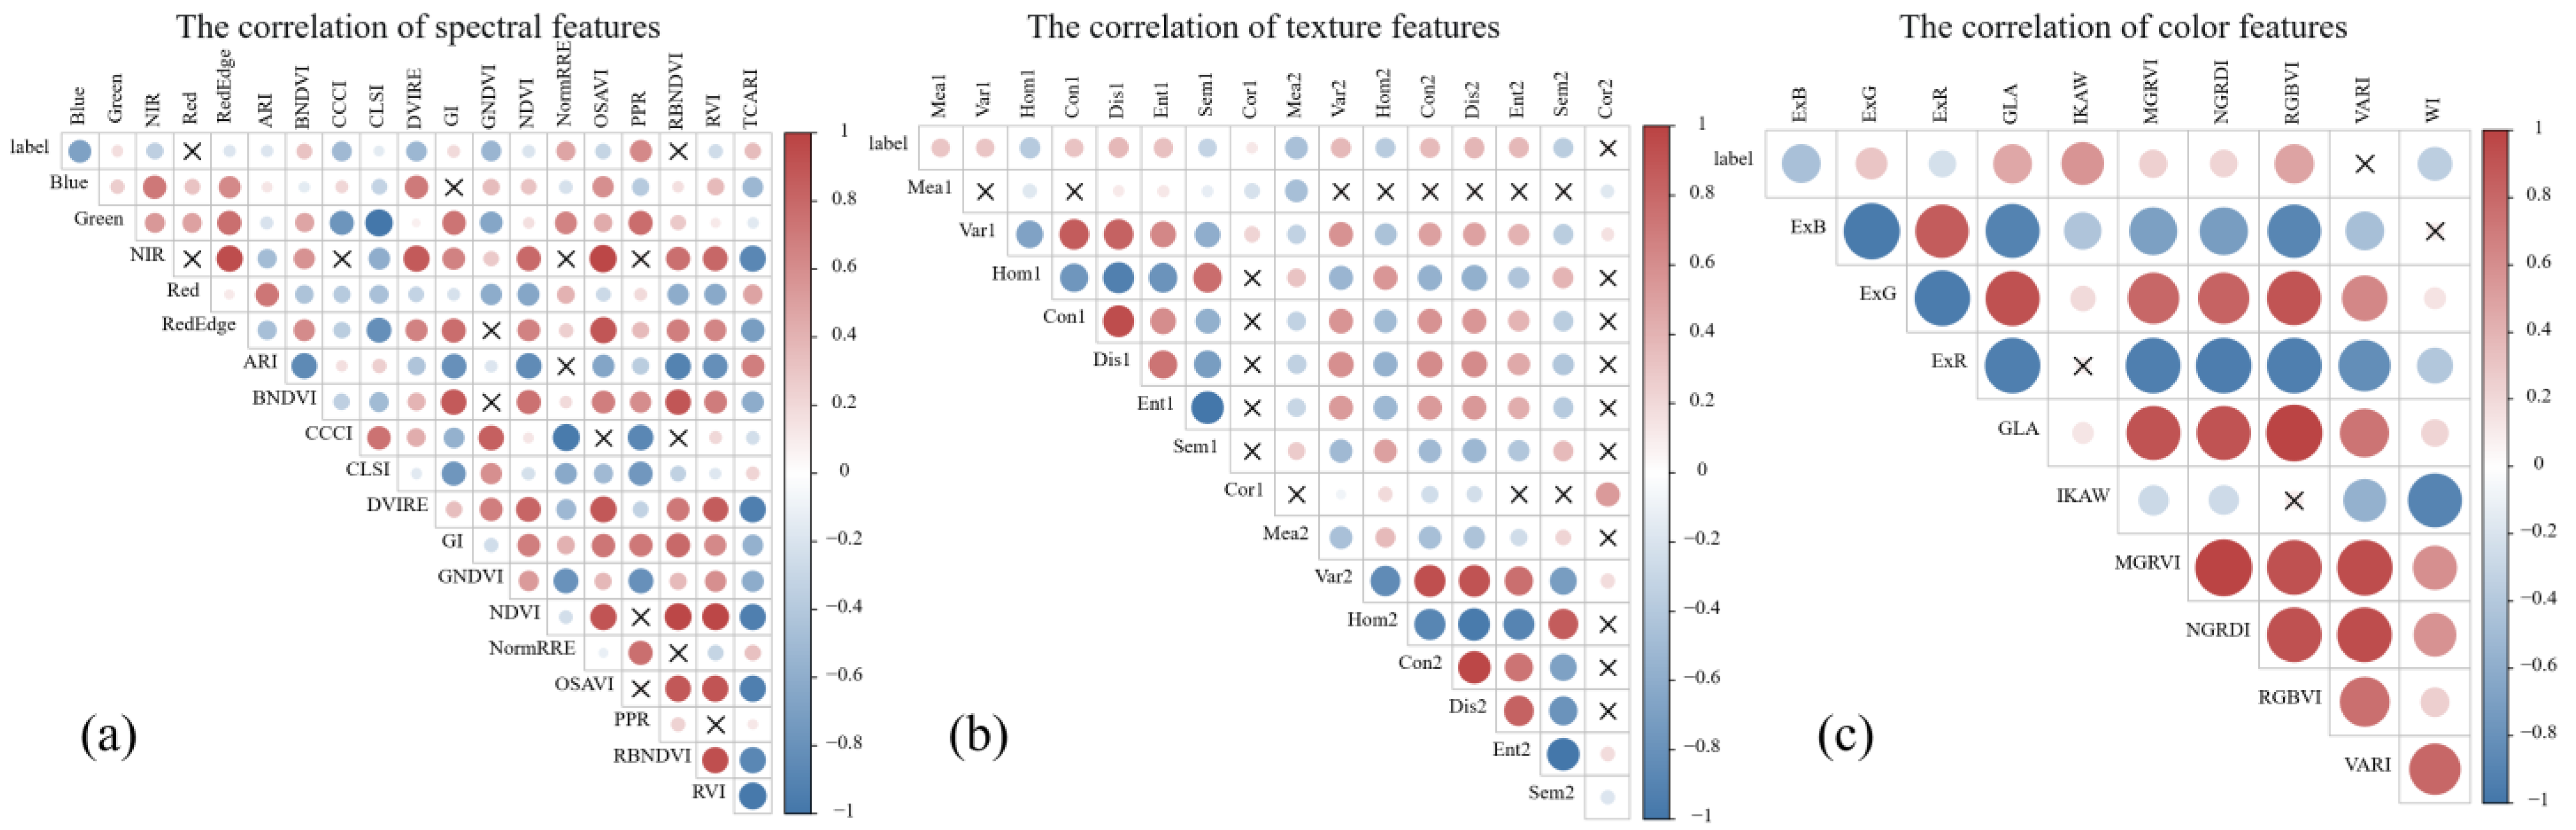
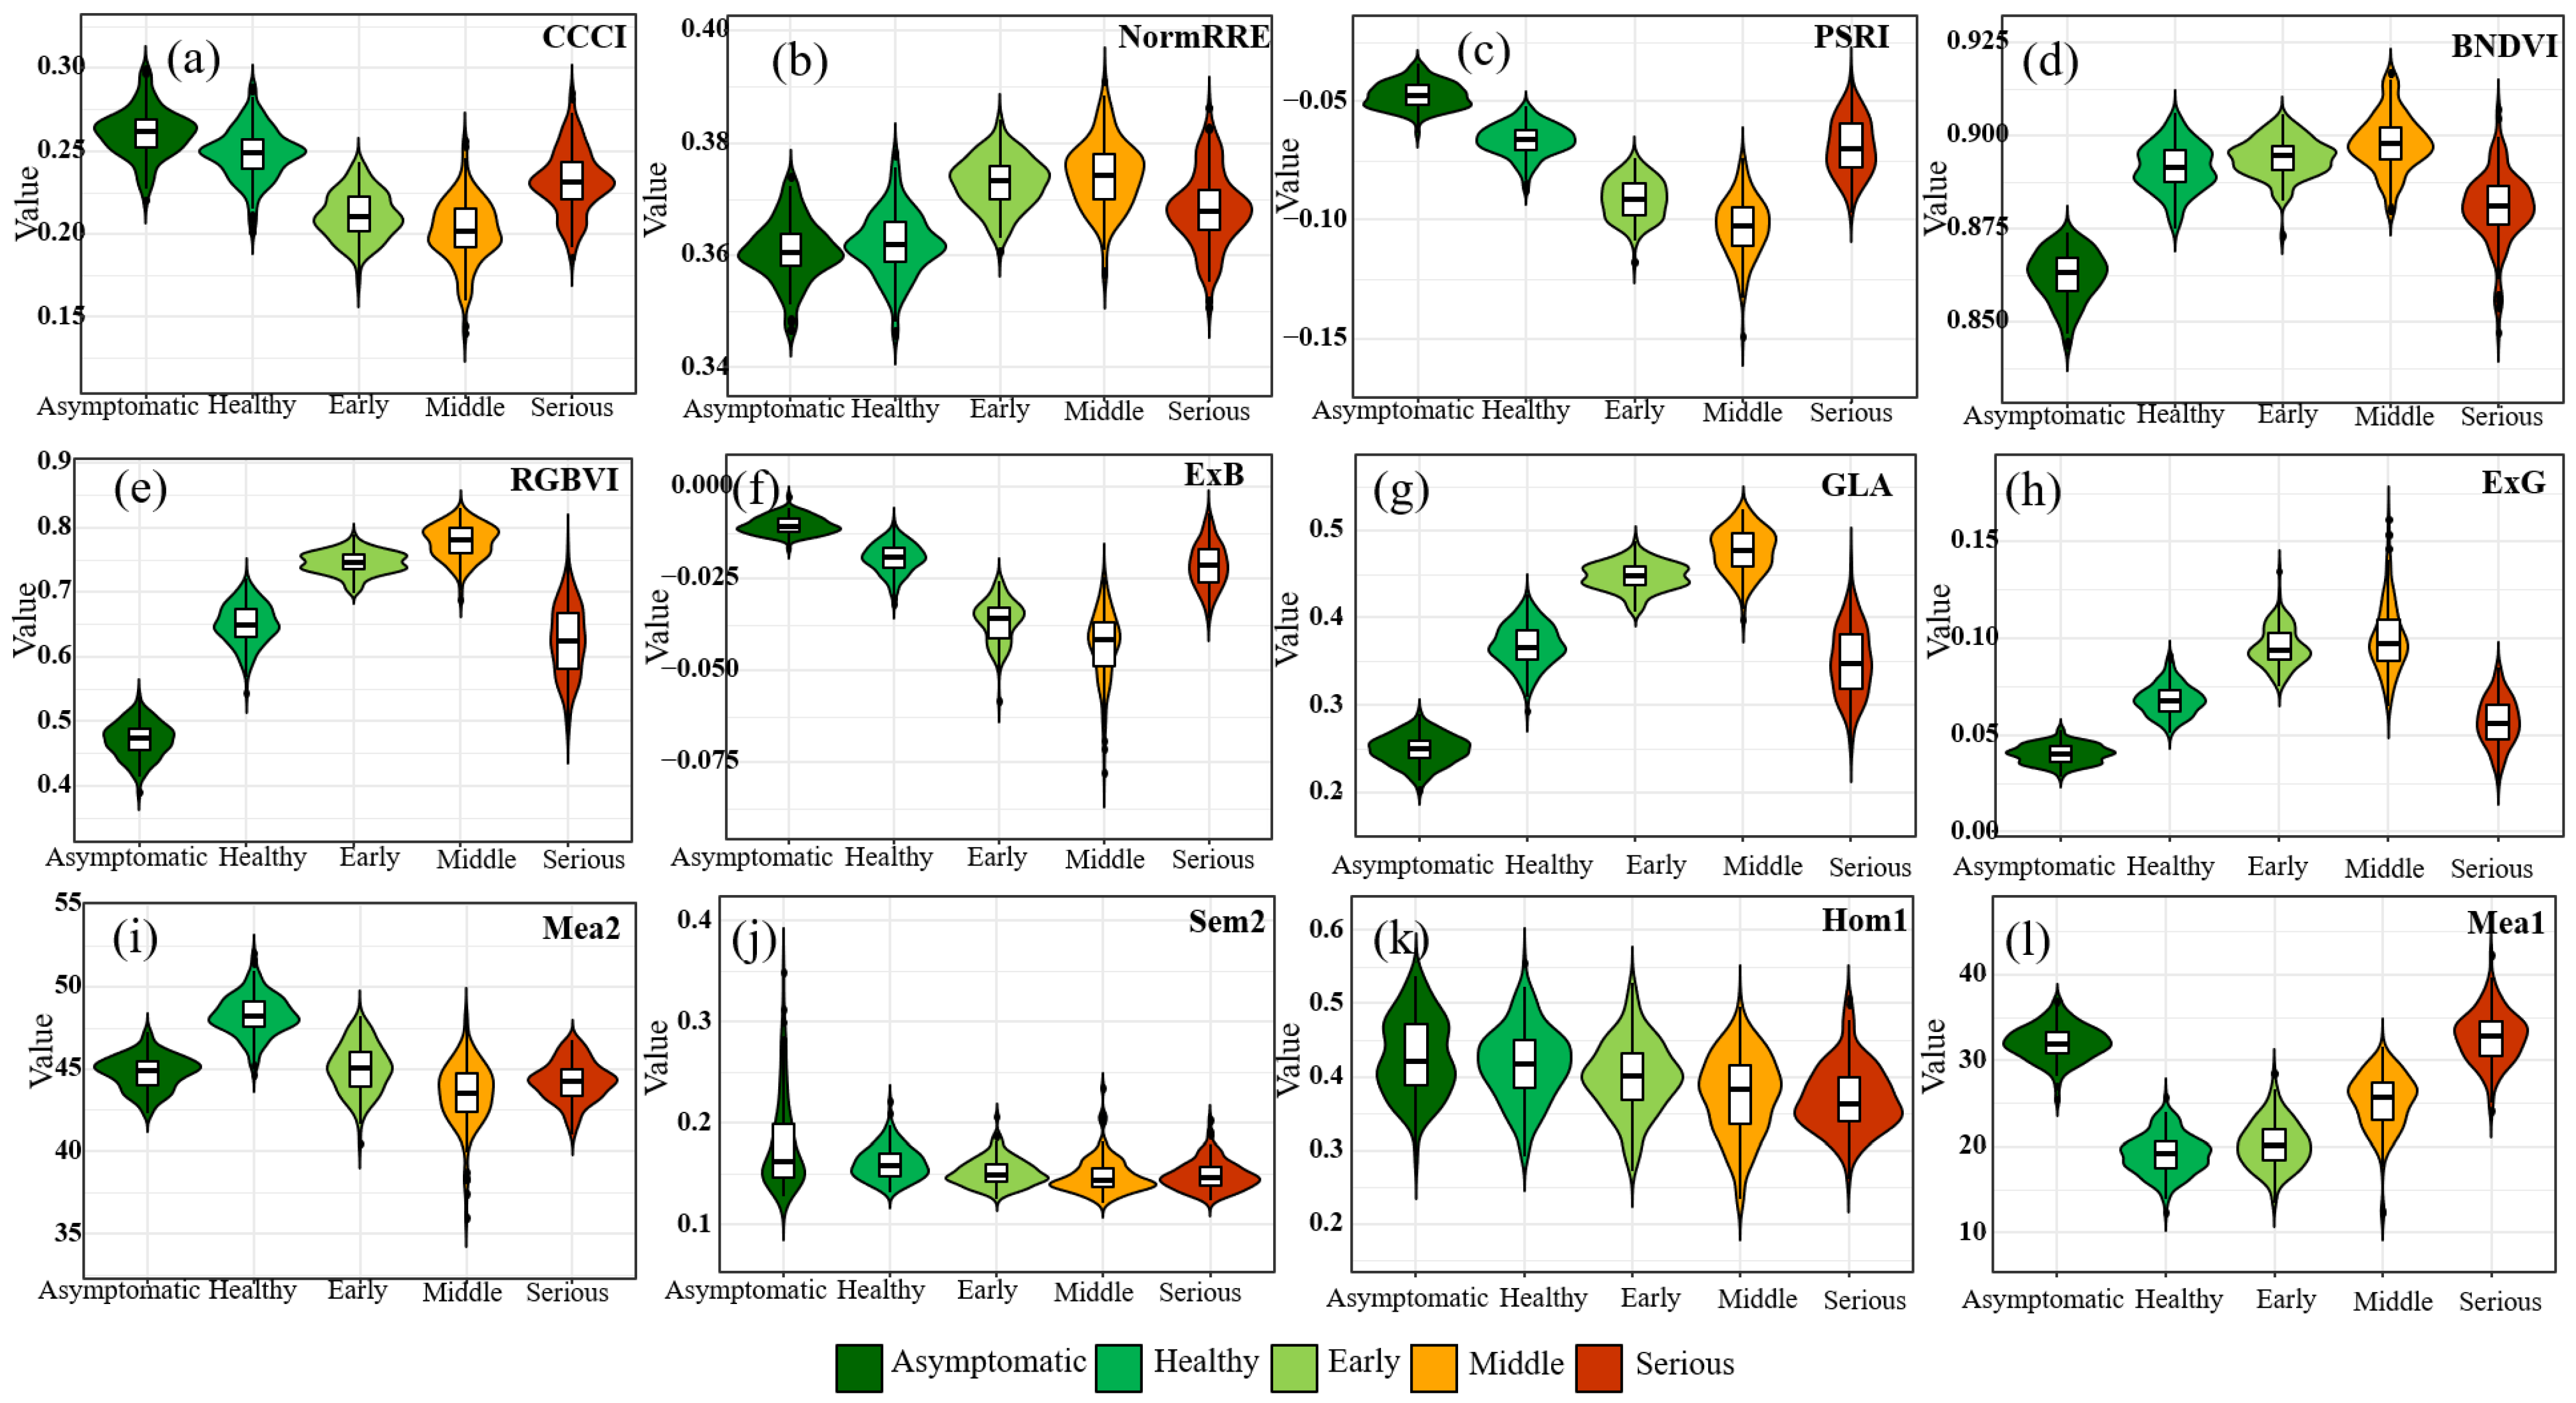
3.1. Spectral Analysis of Rubber Tree Infected with Powdery Mildew

Rubber tree infection with PM resulted in changes in the biochemical composition and physiological structure of the canopy, and Figure 4 shows the differences in spectral reflectance of rubber tree canopies at different infection stages where the horizontal coordinates are asymptomatic, healthy, early, middle and severe stages, and the vertical coordinates are reflectance. As can be seen in Figure 4, compared to healthy canopies, the spectral reflectance of the canopy is lower in the blue, green, red-edge, and near-infrared bands at the asymptomatic stage, while it is higher in the red band. When healthy canopies were infected with PM, the canopy spectral reflectance in the green and red bands increased with the degree of infection, and conversely, the canopy spectral reflectance in the blue, red-edge, and NIR bands decreased with the degree of infection. In addition, while the disease developed to a severe level, the reflectance in the blue, green, red-edge, and near-infrared bands was lower than that of early and middle infections, which may be due to the sparser canopy at the serious stage, resulting in a decrease in spectral reflectance due to inter-canopy gaps, shadows or ground parts segmented into the canopy. The spectral reflectance of each waveband varied with the degree of infection. The analysis of the spectral reflectance of rubber tree canopy can increase our understanding of the changes in the PM disease degree of severity and provide a modeling basis for conducting large-area PM monitoring.

3.2. Feature Sensitivity Analysis

Figure 5 shows the correlations between VIs, SFs, CFs, and PMs, with red and blue representing positive and negative correlations, the size of the circles representing the correlation coefficients, and the fork sign representing irrelevant features. Table 4 shows the specific values and significance levels of the correlation coefficients of SFs, TFs, and CFs. From Figure 5 and Table 4, it can be seen that most SFs, TFs, and CFs have a high correlation with PM (|R|: 0.3–0.68) and reach the significance level of 0.01. For instance, SFs: |R|Blue = 0.68, |R|MSR = 0.627, |R|GNDVI = 0.627; TFs: |R|Mea2 = 0.454, |R|Hom1 = 0.385, |R|Dis2 = 0.381; CFs: |R|IKAW = 0.563, |R|RGBVI = 0.484, |R|GLA = 0.465. Meanwhile, it can be seen from Figure 5a that some features of the same type have high linear correlation with each other, such as CCCI and Clrededge having a high positive correlation, and MSR and TCARI having a high negative correlation. Building a classification model with too many feature variables can result in data redundancy and processing difficulties, so it is necessary to select features that are sensitive to PM. Based on the correlation analysis between SFs, TFs, CFs, and PM, we removed irrelevant feature variables and selected feature variables of all categories with absolute values of correlation coefficients greater than 0.2. On the other hand, we eliminated redundant features using SBS to test the multicollinearity between features. Finally, we selected five SFs (Blue, CCCI, NormRRE, PSRI, BNDVI), four TFs (Mea2, Sem2, Hom1, Mea1), and four CFs (RGBVI, ExB, GLA, ExG), as shown in Table 5. After that, violin plots were drawn for the selected SFs, TFs, and CFs, as shown in Figure 6. For VIs and CFs, there were significant differences in feature parameters at different degrees, which indicated that the selected features had a strong separation ability to identify infected samples.

3.3. Classification Model Performance of Rubber Tree Powdery Mildew

To effectively identify PM infection of rubber trees, we constructed SVM, RF, and KNN classification models based on the 13 selected features, divided into four groups (VIs, TFs, CFs, VIs + TFs + CFs), with asymptomatic stage, healthy stage, early stage, moderate stage and severe stage as dependent variables. Meanwhile, to ensure the stability of the models, grid search and five-fold cross-validation were used to select hyperparameters, and the results are shown in Table 6.
Table 7 shows the accuracy evaluation of different feature combinations and classification models. In the comparison of the modeling algorithms, the RF, BPNN and SVM algorithms showed SF-based OA of 91.75%, 71.13% and 88.14%, respectively, TF-based OA of 75.26%, 58.25% and 72.68%, respectively, CF-based OA of 87.11%, 72.68% and 80.93%, respectively, and fusion feature-based (SF + TF + CF) OA of 91.75%, 84.02%, and 95.88%, respectively. This indicates that the RF algorithm has the best model prediction ability relative to a single type of features, and SVM is the second best. In addition, the SVM algorithm has the best model prediction ability for fusing all types of features, and the RF algorithm has the second best.
In the comparison of different types of features, using the SVM model as a benchmark, the SF-based model has the best classification (OA = 88.14%, Kappa = 0.85). Compared with the TF-based model (OA = 72.68%, Kappa = 0.65) and the CF-based model (OA = 80.93%, Kappa = 0.75), the accuracy is improved by 15.46% and 7.21%, respectively. This shows the advantage of using spectral features in PM prediction. Meanwhile, the classification accuracy of TF-based models was found to be generally lower than that of SFs and CFs models, with OA values less than 76%, indicating the deficiency of the TF-based models in PM classification performance. Compared with single type of features (SFs, TFs, CFs), the fused features (SFs + TFs + CFs) had the highest accuracy (OA = 95.88%, Kappa = 0.94) with improvements in accuracy of 7.74%, 23.2% and 14.95%, respectively. This shows that the model based on fused features has good predictive capability.
As shown in Figure 7, which shows the confusion matrix for different combinations of features based on the SVM model, we found that the recognition rate of fused features (SF + TF + CF) achieves an accuracy of 93.2% for the early stages of PM, which is an improvement of 13.7%, 40.9% and 18.2% compared to SF, TF and CF.

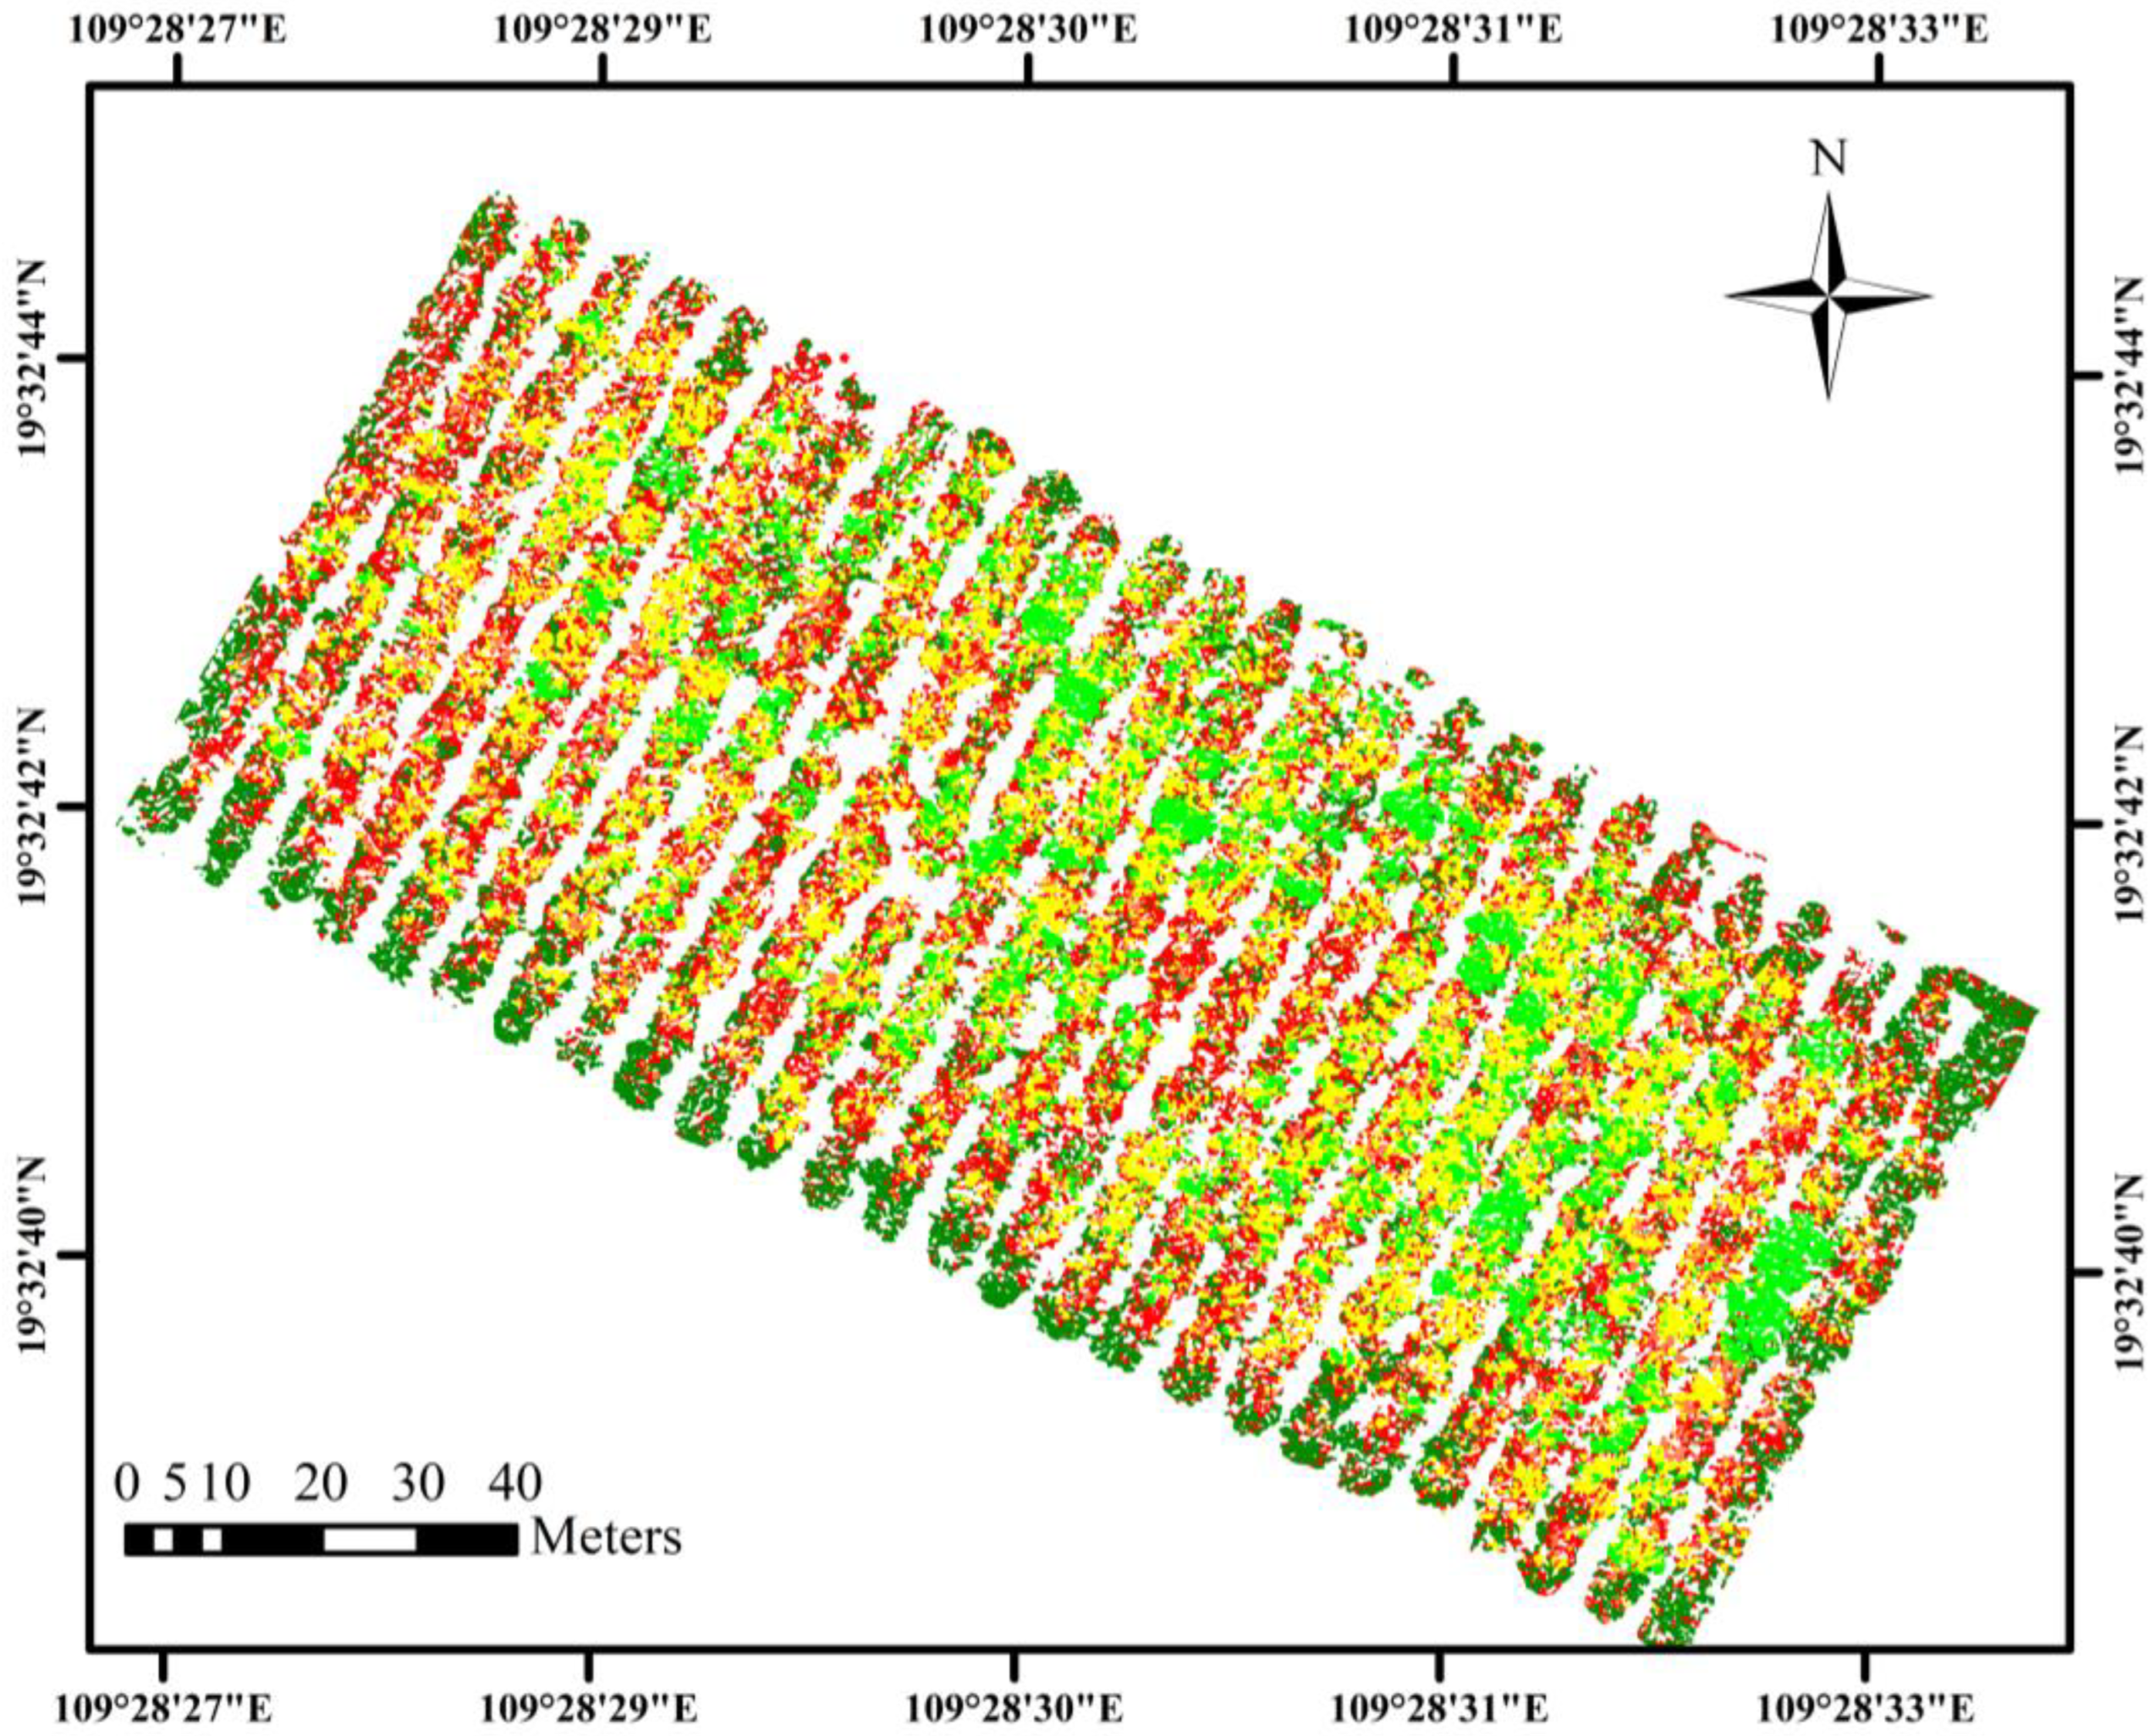
3.4. Identifying the Severity of the Rubber Tree Study Area

To understand the spatial distribution of rubber trees infected with PM in the study area, we constructed SVM models based on selected features (spectrum, texture, color). Figure 8 shows the final classification results. It can be seen from the figure that the distribution of PM in the study area is relatively scattered. Most rubber trees are in the diseased stage (early, medium, and severe), and a few are in the healthy stage, where the asymptomatic canopy is mainly distributed around the edge of the study area region. The rubber trees in the northwest direction are more seriously infected. Table 8 summarizes the total pixel area and the percentage of each category. It can be seen that rubber trees in the study area were mostly in the asymptomatic (20.9%), healthy (16.6%), and early diseased (31.9%) stages, while the middle-serious degree level also accounted for a large proportion (30.6%). The reason for this may be the excessive rainfall in March and April and in the middle of the PM outbreak. Hence, it is necessary to take urgent measures to control the spread of PM.

4. Discussion

Natural rubber production from rubber tree latex is an important industrial raw material. However, the increasing frequency of PM in recent decades has caused huge losses to the production of natural rubber [44]. Since rubber tree powdery mildew disease was first recorded in Java in 1918 [1], this disease has been prevalent worldwide for 105 years. At present, it can only be controlled in its spread, and not completely eradicated. However, if early diagnosis can be achieved before the occurrence of a powdery mildew epidemic, then targeted treatment can be applied, and the disease will be very much alleviated.
Infection with PM can alter the pigmentation, water content, and cell structure of rubber tree leaves, reducing photosynthesis and further affecting plant respiration and transpiration, resulting in stunted growth of rubber trees [2,3]. These changes result in different spectral, textural, and structural changes in properties. The changes in the visible bands (blue, green, and red) are mainly caused by changes in leaf chlorophyll, while the changes in the red-edge and near-infrared bands are mainly due to multiple reflections and scattering from the internal tissue structure of the plant leaves [45]. By analyzing the spectral feature data, as shown in Figure 4, above, we found that the canopy of the infected disease had significant spectral changes in the blue (434–466 nm), green (544–576 nm), red-edge (714–746 nm) and NIR bands (814–876 nm) that were consistent with the results of other crops infected with PM [24,46,47]. Additionally, by analyzing the texture and color feature data, as shown in Figure 6, we found that the texture features (Mean, Homogeneity) and color features (RGBVI, ExB, GLA, ExG) also changed significantly. The changes in these features indicate that fusing spectral features, which represent physiological changes, texture features, which represent external morphological changes, and color features, which represent external color changes, can effectively detect rubber tree PM. The results of the PM detection models based on different feature combinations showed that the SFs model performed better than the TFs and CFs models, which were close to the accuracy of the model with all features fused. This indicates that the spectral features, based on reflecting internal physiological changes caused by PM disease, had high sensitivity, while GLCM-based texture features and color features can be used as complementary features to detect PM, but these features are not effective alone. The critical issue of remote sensing monitoring of PM of rubber trees is the early monitoring of disease occurrence (healthy, early). As shown in Figure 7, we found that the use of a single type of feature alone was not appropriate for the detection of the early stages of infection (spectral-early = 79.5%, texture-early = 52.3%, color-early = 75.0%). However, fusing all features for early monitoring showed excellent performance, with a recognition rate of 93.2%, which provides some help for early monitoring of PM occurrence and effective control of the spread of PM. Meanwhile, we found that the RF algorithm had the best model classification performance when using a single feature type, while the SVM was the second best. However, the SVM algorithm had the best classification performance for fused features, and the RF algorithm was the second best. This is due to the insensitivity of the RF algorithm to outliers, which makes it better with low-dimensional features; however, with increasing feature dimensions, the RF algorithm can easily lead to overfitting. The kernel function of the SVM algorithm is sensitive to outliers at low dimensions of features, which makes it generally effective with low numbers of feature dimensions, and the advantage of the generalization ability of the SVM algorithm is gradually reflected as with increasing feature dimensions.
The process of constructing monitoring models using spectral bands and spectral indices in spectral analysis produces a large amount of redundant information [20,22], and the selection of spectral feature variables is particularly important for improving the monitoring efficiency and classification accuracy of the models. In this study, we used the Pearson correlation coefficient (PCC) method and SBS to select sensitive features. Most of the selected feature variables were found to be correlated with blue and near-infrared bands, which is consistent with the spectral changes in canopy infected with PM, while this is important in reflecting the health status of rubber trees. The SBS can retain the more important feature variables and remove the minor or replaceable ones. These selected feature variables were used to build a diagnostic model for the degree of PM infection, and most of the models had OA higher than 0.8, verifying the effectiveness of this method.
Although the classification model of PM infection degree proposed in this study achieved good detection results, there are still some problems. For example, due to the high and dense canopy of rubber trees, shadows are easily generated by overlapping between tree canopies [48]. This leads to a mismatch between the results of detection and the actual ground investigation of PM infection levels. PM mostly occurs in the spring leaf extraction period of rubber trees, and the infestation mostly occurs in the upper part of the canopy first [1,49]. Still, for some areas in wet valleys, the lower canopy tends to be infected first, which leads to less pronounced differences in drone display between healthy and early-stage canopies and between early- and middle-stage trees, resulting in errors in the model’s ability to identify disease. Meanwhile, due to the limited band information in multispectral images, the deeper level of feature variation is unlikely to be represented. Therefore, many studies have typically used more suitable hyperspectral images or combine multi-sensors such as RGB, multispectral, hyperspectral, thermal infrared, and LiDAR sensors to detect various forest diseases, as these methods can be used to more deeply explore spectral information, canopy structure information, texture information, and ground information of rubber trees, effectively improving the accuracy of PM identification and early identification monitoring.

5. Conclusions

In this study, a UAV was used to acquire multispectral image data of PM and field survey results as the dataset. Then, the sensitive spectral, texture, and color features were selected by using correlation analysis and sequential backward selection (SBS) algorithm. Finally, we constructed a diagnosis model of PM disease using RF, BPNN, and SVM algorithms. The following conclusions were drawn:
(1)
The sensitive spectral bands of PM were the blue (434–466 nm), green (544–576 nm), red-edge (714–746 nm), and near-infrared bands (814–876 nm). Meanwhile, vegetation index features (CCCI, NormRRE, PSRI, BNDVI), texture features (Mean, Homogeneity), and color features (RGBVI, ExB, GLA, ExG) were the most sensitive combinations of features for monitoring rubber trees.
(2)
Compared with single feature types (SF, TF, CF), fused features (SF + TF + CF) had higher accuracy (OA = 95.88%, Kappa = 0.94) with improvement in accuracy of 7.74%, 23.2% and 14.95%, respectively. Meanwhile, a single feaure type has a limited effect on early-stage infection detection, and the fusion of all features for early monitoring has better classification accuracy, with a recognition rate of 93.2%, which provides options for early monitoring of PM occurrence in rubber trees.
(3)
The SVM and RF models provide higher monitoring accuracy than the BPNN model. For TFs and CFs, the RF model has better prediction results. For fusion features (SF + TF + CF), the SVM model has a better prediction.
This study demonstrates a practical method for detecting PM by combining the spectral, textural, and color features of UAS-based multispectral images. In subsequent studies, we will focus on applying multi-temporal and multi-sensor information in the early monitoring of PM to develop a more complete and comprehensive monitoring model.

Author Contributions

Conceptualization, T.Z., H.Z. and W.F.; Data curation, W.F.; Formal analysis, H.Z.; Funding acquisition, W.F. and X.Z.; Investigation, Y.L., C.Y., Q.L. and J.F.; Methodology, T.Z.; Project administration, W.F., J.W. and X.Z.; Resources, Y.L., J.F., W.F. and J.W.; Software, T.Z.; Supervision, W.F., J.W. and X.Z.; Validation, T.Z., C.Y. and Q.L.; Writing—original draft, T.Z.; Writing—review and editing, T.Z., H.Z. and W.F. All authors have read and agreed to the published version of the manuscript.

Funding

This work was supported by the Key R&D projects in Hainan Province (Grant No. ZDYF2020042), the National Natural Science Foundation of China (Grant No.32160424), the Natural Science Foundation of Hainan Province (Grant No.521RC1036), the Key R&D Projects in Hainan Province (Grant No. ZDYF2020195), the Academician Lan Yubin Innovation Platform of Hainan Province, the Key R&D projects in Hainan Province (Grant No.ZDYF2021GXJS036), the Innovative research projects for graduate students in Hainan Province (Grant No.Qhyb2021-11), the Hainan Province Academician Innovation Platform (Grant No.YSPTZX202008).

Data Availability Statement

Not applicable.

Acknowledgments

The authors would like to thank Jihua Fang, Chenghai Yin, Qifu Liang and Yuan Li for acquiring data in the field experiments of this study.

Conflicts of Interest

The authors declare no conflict of interest.

References

  1. Liyanage, K.K.; Khan, S.; Mortimer, P.E.; Hyde, K.D.; Xu, J.; Brooks, S.; Ming, Z. Powdery Mildew Disease of Rubber Tree. For. Pathol. 2016, 46, 90–103. [Google Scholar] [CrossRef]
  2. Limkaisang, S.; Kom-un, S.; Furtado, E.L.; Liew, K.W.; Salleh, B.; Sato, Y.; Takamatsu, S. Molecular Phylogenetic and Morphological Analyses of Oidium Heveae, a Powdery Mildew of Rubber Tree. Mycoscience 2005, 46, 220–226. [Google Scholar] [CrossRef]
  3. Wang, L.-F.; Wang, M.; Zhang, Y. Effects of Powdery Mildew Infection on Chloroplast and Mitochondrial Functions in Rubber Tree. Trop. Plant Pathol. 2014, 39, 242–250. [Google Scholar] [CrossRef] [Green Version]
  4. Wu, H.; Pan, Y.; Di, R.; He, Q.; Rajaofera, M.J.N.; Liu, W.; Zheng, F.; Miao, W. Molecular Identification of the Powdery Mildew Fungus Infecting Rubber Trees in China. For. Pathol. 2019, 49, e12519. [Google Scholar] [CrossRef]
  5. Cao, X.; Xu, X.; Che, H.; West, J.S.; Luo, D. Effects of Temperature and Leaf Age on Conidial Germination and Disease Development of Powdery Mildew on Rubber Tree. Plant Pathol. 2021, 70, 484–491. [Google Scholar] [CrossRef]
  6. Gogoi, N.K.; Deka, B.; Bora, L.C. Remote Sensing and Its Use in Detection and Monitoring Plant Diseases: A Review. Agric. Rev. 2018, 39, 307–313. [Google Scholar] [CrossRef]
  7. Abd El-Ghany, N.M.; Abd El-Aziz, S.E.; Marei, S.S. A Review: Application of Remote Sensing as a Promising Strategy for Insect Pests and Diseases Management. Environ. Sci. Pollut. Res. 2020, 27, 33503–33515. [Google Scholar] [CrossRef]
  8. Zhang, J.; Yuan, L.; Wang, J.; Luo, J.; Du, S.; Huang, W. Research Progress of Crop Diseases and Pests Monitoring Based on Remote Sensing. Trans. Chin. Soc. Agric. Eng. 2012, 28, 1–11. [Google Scholar]
  9. Chemura, A.; Mutanga, O.; Dube, T. Separability of Coffee Leaf Rust Infection Levels with Machine Learning Methods at Sentinel-2 MSI Spectral Resolutions. Precis. Agric. 2017, 18, 859–881. [Google Scholar] [CrossRef]
  10. Zhang, J.; Pu, R.; Yuan, L.; Wang, J.; Huang, W.; Yang, G. Monitoring Powdery Mildew of Winter Wheat by Using Moderate Resolution Multi-Temporal Satellite Imagery. PLoS ONE 2014, 9, e93107. [Google Scholar] [CrossRef] [Green Version]
  11. Ecke, S.; Dempewolf, J.; Frey, J.; Schwaller, A.; Endres, E.; Klemmt, H.-J.; Tiede, D.; Seifert, T. UAV-Based Forest Health Monitoring: A Systematic Review. Remote Sens. 2022, 14, 3205. [Google Scholar] [CrossRef]
  12. Heidarian Dehkordi, R.; El Jarroudi, M.; Kouadio, L.; Meersmans, J.; Beyer, M. Monitoring Wheat Leaf Rust and Stripe Rust in Winter Wheat Using High-Resolution UAV-Based Red-Green-Blue Imagery. Remote Sens. 2020, 12, 3696. [Google Scholar] [CrossRef]
  13. Lan, Y.; Huang, Z.; Deng, X.; Zhu, Z.; Huang, H.; Zheng, Z.; Lian, B.; Zeng, G.; Tong, Z. Comparison of Machine Learning Methods for Citrus Greening Detection on UAV Multispectral Images. Comput. Electron. Agric. 2020, 171, 105234. [Google Scholar] [CrossRef]
  14. Zhang, S.; Huang, H.; Huang, Y.; Cheng, D.; Huang, J. A GA and SVM Classification Model for Pine Wilt Disease Detection Using UAV-Based Hyperspectral Imagery. Appl. Sci. 2022, 12, 6676. [Google Scholar] [CrossRef]
  15. Li, S.; Yuan, F.; Ata-UI-Karim, S.T.; Zheng, H.; Cheng, T.; Liu, X.; Tian, Y.; Zhu, Y.; Cao, W.; Cao, Q. Combining Color Indices and Textures of UAV-Based Digital Imagery for Rice LAI Estimation. Remote Sens. 2019, 11, 1763. [Google Scholar] [CrossRef] [Green Version]
  16. Zheng, H.; Cheng, T.; Zhou, M.; Li, D.; Yao, X.; Tian, Y.; Cao, W.; Zhu, Y. Improved Estimation of Rice Aboveground Biomass Combining Textural and Spectral Analysis of UAV Imagery. Precis. Agric. 2019, 20, 611–629. [Google Scholar] [CrossRef]
  17. Ma, L.; Huang, X.; Hai, Q.; Gang, B.; Tong, S.; Bao, Y.; Dashzebeg, G.; Nanzad, T.; Dorjsuren, A.; Enkhnasan, D. Model-Based Identification of Larix Sibirica Ledeb. Damage Caused by Erannis Jacobsoni Djak. Based on UAV Multispectral Features and Machine Learning. Forests 2022, 13, 2104. [Google Scholar] [CrossRef]
  18. Gao, C.; Ji, X.; He, Q.; Gong, Z.; Sun, H.; Wen, T.; Guo, W. Monitoring of Wheat Fusarium Head Blight on Spectral and Textural Analysis of UAV Multispectral Imagery. Agriculture 2023, 13, 293. [Google Scholar] [CrossRef]
  19. Liu, L.; Dong, Y.; Huang, W.; Du, X.; Ma, H. Monitoring Wheat Fusarium Head Blight Using Unmanned Aerial Vehicle Hyperspectral Imagery. Remote Sens. 2020, 12, 3811. [Google Scholar] [CrossRef]
  20. Zhang, H.; Huang, L.; Huang, W.; Dong, Y.; Weng, S.; Zhao, J.; Ma, H.; Liu, L. Detection of Wheat Fusarium Head Blight Using UAV-Based Spectral and Image Feature Fusion. Front. Plant Sci. 2022, 13, 1004427. [Google Scholar] [CrossRef]
  21. Dang, L.M.; Hassan, S.I.; Suhyeon, I.; kumar Sangaiah, A.; Mehmood, I.; Rho, S.; Seo, S.; Moon, H. UAV Based Wilt Detection System via Convolutional Neural Networks. Sustain. Comput. Inform. Syst. 2020, 28, 100250. [Google Scholar] [CrossRef] [Green Version]
  22. Xu, Z.; Zhang, Q.; Xiang, S.; Li, Y.; Huang, X.; Zhang, Y.; Zhou, X.; Li, Z.; Yao, X.; Li, Q. Monitoring the Severity of Pantana Phyllostachysae Chao Infestation in Moso Bamboo Forests Based on UAV Multi-Spectral Remote Sensing Feature Selection. Forests 2022, 13, 418. [Google Scholar] [CrossRef]
  23. Liang, Y.; Kou, W.; Lai, H.; Wang, J.; Wang, Q.; Xu, W.; Wang, H.; Lu, N. Improved Estimation of Aboveground Biomass in Rubber Plantations by Fusing Spectral and Textural Information from UAV-Based RGB Imagery. Ecol. Indic. 2022, 142, 109286. [Google Scholar] [CrossRef]
  24. Chandel, A.K.; Khot, L.R.; Sallato, B. Apple Powdery Mildew Infestation Detection and Mapping Using High-Resolution Visible and Multispectral Aerial Imaging Technique. Sci. Hortic. 2021, 287, 110228. [Google Scholar] [CrossRef]
  25. Wang, F.-M.; Huang, J.-F.; Tang, Y.-L.; Wang, X.-Z. New Vegetation Index and Its Application in Estimating Leaf Area Index of Rice. Rice Sci. 2007, 14, 195–203. [Google Scholar] [CrossRef]
  26. Zhou, J.; Yungbluth, D.; Vong, C.N.; Scaboo, A.; Zhou, J. Estimation of the Maturity Date of Soybean Breeding Lines Using UAV-Based Multispectral Imagery. Remote Sens. 2019, 11, 2075. [Google Scholar] [CrossRef] [Green Version]
  27. Chivasa, W.; Mutanga, O.; Burgueño, J. UAV-Based High-Throughput Phenotyping to Increase Prediction and Selection Accuracy in Maize Varieties under Artificial MSV Inoculation. Comput. Electron. Agric. 2021, 184, 106128. [Google Scholar] [CrossRef]
  28. Patrick, A.; Pelham, S.; Culbreath, A.; Holbrook, C.C.; de Godoy, I.J.; Li, C. High Throughput Phenotyping of Tomato Spot Wilt Disease in Peanuts Using Unmanned Aerial Systems and Multispectral Imaging. IEEE Instrum. Meas. Mag. 2017, 20, 4–12. [Google Scholar] [CrossRef]
  29. Zarco-Tejada, P.J.; Miller, J.R.; Morales, A.; Berjón, A.; Agüera, J. Hyperspectral Indices and Model Simulation for Chlorophyll Estimation in Open-Canopy Tree Crops. Remote Sens. Environ. 2004, 90, 463–476. [Google Scholar] [CrossRef]
  30. Merzlyak, M.N.; Gitelson, A.A.; Chivkunova, O.B.; Rakitin, V.Y.U. Non-destructive Optical Detection of Pigment Changes during Leaf Senescence and Fruit Ripening. Physiol. Plant 1999, 106, 135–141. [Google Scholar] [CrossRef] [Green Version]
  31. Xue, L.; Cao, W.; Luo, W.; Dai, T.; Zhu, Y. Monitoring Leaf Nitrogen Status in Rice with Canopy Spectral Reflectance. Agron. J. 2004, 96, 135–142. [Google Scholar] [CrossRef]
  32. Haboudane, D.; Miller, J.R.; Tremblay, N.; Zarco-Tejada, P.J.; Dextraze, L. Integrated Narrow-Band Vegetation Indices for Prediction of Crop Chlorophyll Content for Application to Precision Agriculture. Remote Sens. Environ. 2002, 81, 416–426. [Google Scholar] [CrossRef]
  33. Meyer, G.E.; Neto, J.C. Verification of Color Vegetation Indices for Automated Crop Imaging Applications. Comput. Electron. Agric. 2008, 63, 282–293. [Google Scholar] [CrossRef]
  34. Louhaichi, M.; Borman, M.M.; Johnson, D.E. Spatially Located Platform and Aerial Photography for Documentation of Grazing Impacts on Wheat. Geocart. Int. 2001, 16, 65–70. [Google Scholar] [CrossRef]
  35. Kawashima, S.; Nakatani, M. An Algorithm for Estimating Chlorophyll Content in Leaves Using a Video Camera. Ann. Bot. 1998, 81, 49–54. [Google Scholar] [CrossRef] [Green Version]
  36. Tucker, C.J. Red and Photographic Infrared Linear Combinations for Monitoring Vegetation. Remote Sens. Environ. 1979, 8, 127–150. [Google Scholar] [CrossRef] [Green Version]
  37. Bendig, J.; Yu, K.; Aasen, H.; Bolten, A.; Bennertz, S.; Broscheit, J.; Gnyp, M.L.; Bareth, G. Combining UAV-Based Plant Height from Crop Surface Models, Visible, and near Infrared Vegetation Indices for Biomass Monitoring in Barley. Int. J. Appl. Earth Obs. Geoinf. 2015, 39, 79–87. [Google Scholar] [CrossRef]
  38. Gitelson, A.A.; Kaufman, Y.J.; Stark, R.; Rundquist, D. Novel Algorithms for Remote Estimation of Vegetation Fraction. Remote Sens. Environ. 2002, 80, 76–87. [Google Scholar] [CrossRef] [Green Version]
  39. Woebbecke, D.M.; Meyer, G.E.; von Bargen, K.; Mortensen, D.A. Color Indices for Weed Identification under Various Soil, Residue, and Lighting Conditions. Trans. ASAE 1995, 38, 259–269. [Google Scholar] [CrossRef]
  40. Du, M.; Noguchi, N. Monitoring of Wheat Growth Status and Mapping of Wheat Yield’s within-Field Spatial Variations Using Color Images Acquired from UAV-Camera System. Remote Sens. 2017, 9, 289. [Google Scholar] [CrossRef] [Green Version]
  41. Xiao, D.; Pan, Y.; Feng, J.; Yin, J.; Liu, Y.; He, L. Remote Sensing Detection Algorithm for Apple Fire Blight Based on UAV Multispectral Image. Comput. Electron. Agric. 2022, 199, 107137. [Google Scholar] [CrossRef]
  42. Zhang, Y.; Hu, Q.; Li, H.; Li, J.; Liu, T.; Chen, Y.; Ai, M.; Dong, J. A Back Propagation Neural Network-Based Radiometric Correction Method (BPNNRCM) for UAV Multispectral Image. IEEE J. Sel. Top. Appl. Earth Obs. Remote Sens. 2022, 16, 112–125. [Google Scholar] [CrossRef]
  43. Lee, H.; Wang, J.; Leblon, B. Using Linear Regression, Random Forests, and Support Vector Machine with Unmanned Aerial Vehicle Multispectral Images to Predict Canopy Nitrogen Weight in Corn. Remote Sens. 2020, 12, 2071. [Google Scholar] [CrossRef]
  44. Bai, R.; Wang, J.; Li, N. Climate Change Increases the Suitable Area and Suitability Degree of Rubber Tree Powdery Mildew in China. Ind. Crops Prod. 2022, 189, 115888. [Google Scholar] [CrossRef]
  45. Nebiker, S.; Lack, N.; Abächerli, M.; Läderach, S. Light-Weight Multispectral UAV Sensors and Their Capabilities for Predicting Grain Yield and Detecting Plant Diseases. In Proceedings of the International Archives of the Photogrammetry, Remote Sensing and Spatial Information Sciences, Prague, Czech Republic, 12–19 July 2016; Volume 41. [Google Scholar]
  46. Abdulridha, J.; Ampatzidis, Y.; Roberts, P.; Kakarla, S.C. Detecting Powdery Mildew Disease in Squash at Different Stages Using UAV-Based Hyperspectral Imaging and Artificial Intelligence. Biosyst. Eng. 2020, 197, 135–148. [Google Scholar] [CrossRef]
  47. Knauer, U.; Matros, A.; Petrovic, T.; Zanker, T.; Scott, E.S.; Seiffert, U. Improved Classification Accuracy of Powdery Mildew Infection Levels of Wine Grapes by Spatial-Spectral Analysis of Hyperspectral Images. Plant Methods 2017, 13, 47. [Google Scholar] [CrossRef] [Green Version]
  48. Chen, B.; Li, X.; Xiao, X.; Zhao, B.; Dong, J.; Kou, W.; Qin, Y.; Yang, C.; Wu, Z.; Sun, R. Mapping Tropical Forests and Deciduous Rubber Plantations in Hainan Island, China by Integrating PALSAR 25-m and Multi-Temporal Landsat Images. Int. J. Appl. Earth Obs. Geoinf. 2016, 50, 117–130. [Google Scholar] [CrossRef]
  49. Mazlan, S.; JAAFAR, N.M.; Wahab, A.; Rajandas, H.; Zulperi, D. Major Diseases of Rubber (Hevea Brasiliensis) in Malaysia. Pertanika J. Sch. Res. Rev. 2019, 5, 10–21. [Google Scholar]
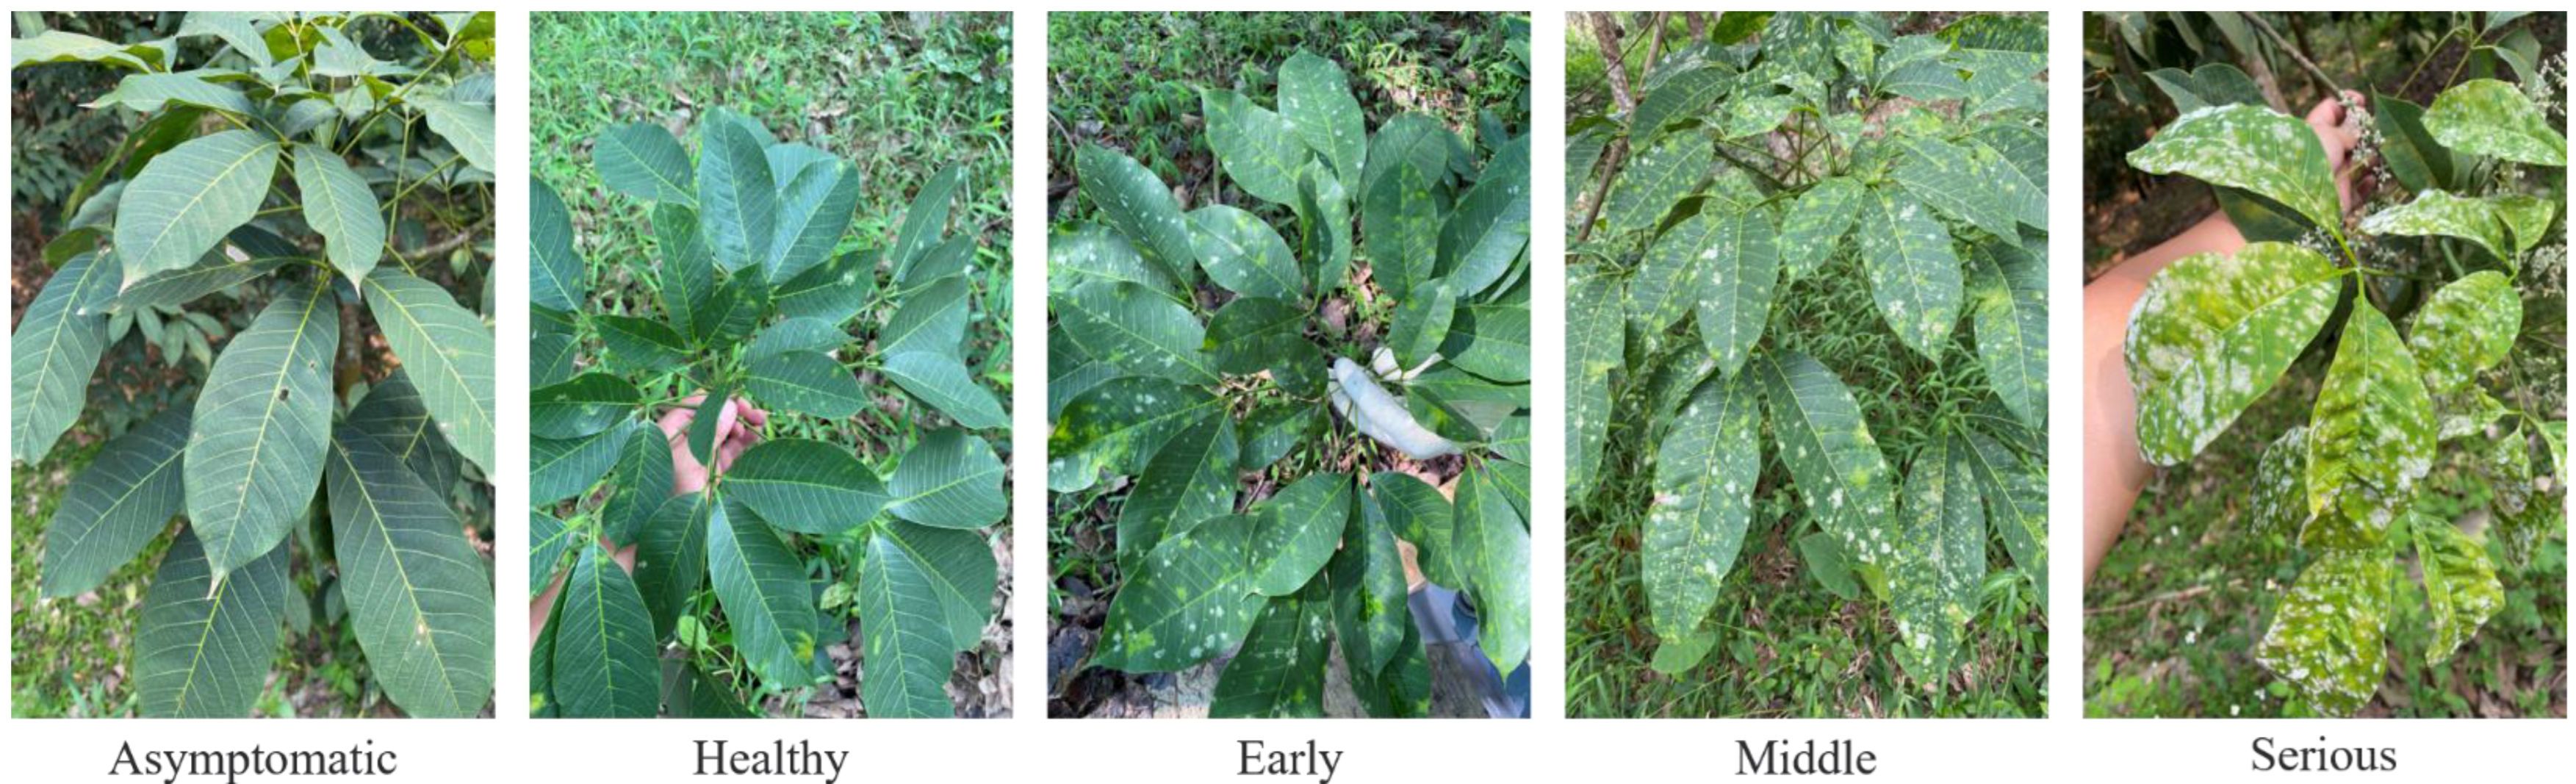
Figure 1. Location of the study area. (a) Rubber forest research area of China Academy of Tropical Agriculture, Danzhou City, Hainan Province, China; (b) UAV multispectral image.
Forests 14 00717 g001
Figure 2. The framework of rubber tree powdery mildew detection based on UAV multispectral data.
Forests 14 00717 g002
Figure 3. Examples of powdery mildew development at different infection periods.
Forests 14 00717 g003
Figure 4. UAV multispectral spectral reflectance of rubber tree canopy infected with different degrees of powdery mildew disease: (a) blue band; (b) green band; (c) red band; (d) red-edge band (RE); (e) near infrared band (NIR).
Forests 14 00717 g004
Figure 5. Correlation between VIs, TFs, CFs, and PM. (a) The correlation of spectral features, (b) The correlation of texture features, (c) The correlation of color features.
Forests 14 00717 g005
Figure 6. Change features of selected VIs, TFs, and CFs at different severity levels. (a) CCCI, (b) NormRRE, (c) PSRI, (d) BNDVI, (i) Mea2, (j) Sem2, (k) Hom1, (l) Mea1, (e) RGBVI, (f) ExB. (g) GLA (h) ExG.
Forests 14 00717 g006
Figure 7. Confusion matrix of rubber tree powdery mildew with different feature combinations based on the SVM model. (a) Spectral features, (b) texture features, (c) color features, (d) spectral + texture + color.
Forests 14 00717 g007
Figure 8. Spatial distribution of rubber trees infected with powdery mildew based on selected features (spectrum, texture, color) and SVM model.
Forests 14 00717 g008
Table 1. Different stages of powdery mildew infection in rubber tree canopies.
LevelAsymptomaticHealthyEarlyMiddleSerious
Leaf spot area000%~25%25%~50%50%~100%
Canopy appearance characteristicsCanopy leaves abundant; old leaves; not infected with powdery mildew; dark green.Canopy leaves abundant; fresh young leaves; not infected with powdery mildew; light green.Canopy leaves abundant; leaves with a few powdery mild spots, lightly crinkled; leaves starting to turn yellow.Canopy leaves begin to drop; most leaves have more spots and moderate crinkling; leaves are light yellow.Canopy leaves are sparse; leaf spots are accumulated and severely crinkled; leaves are yellow.
Table 2. Spectral features for monitoring powdery mildew of rubber trees in this study.
Vegetation IndexAbbreviationFormulaReference
Blue-Normalized Difference Vegetation IndexBNDVI(nir − b)/(nir + b)[25]
Canopy Chlorophyll Contents IndexCCCI((nir − re)/(nir + re))/((nir − r)/(nir + r))[26]
Clgreennir/g-1 [27]
Cercospora Leaf Spot IndexCLSI(re − g)/(re + g) − re[26]
Difference Vegetation Index-RedEdgeDVIREnir − re[28]
Green Normalized Difference Vegetation IndexGNDVI(nir − g)/(nir + g)[28]
Modified Simple RatioMSR(nir/r − 1)/( n i r / r + 1 [24]
Normalized Difference Vegetation IndexNDVI(nir − r)/(nir + r)[28]
Normalized Red -RENormRREre/(nir + re + g)[28]
Optimal Soil-Adjusted Vegetation IndexOSAVI(nir − r)/(nir + r + 0.16)[29]
Plant Senescence Reflectance IndexPSRI(r − g)/nir[30]
Red-blue normalized difference vegetation indexRBNDVI(nir − (r + b)]/(nir + (r + b))[25]
Ratio Vegetation IndexRVInir/r[31]
Transformed Chlorophyll Absorption Reflectance IndexTCARI3 × ((nir − r) − 0.2 × (nir − g) × (nir/r))[32]
Table 3. Color features used for monitoring powdery mildew of rubber trees in this study.
Color FeatureAbbreviationFormulaReference
Excess Blue Vegetation Index ExB 1.4b − g[15]
Excess Green Vegetation Index ExG 2g − r − b[33]
Excess Red Vegetation Index ExR 1.4r − g[33]
Green Leaf Algorithm GLA (2g − r − b)/(2g  +  r  +  b)[34]
Kawashima Index IKAW (r − b)/(r  +  b)[35]
Modified Green Red Vegetation Index MGRVI (g2 − r2)/(g2 + r2)[36]
Normalized Green-Red Difference Index NGRDI (g − r)/(g  +  r)[36]
Red Green Blue Vegetation Index RGBVI (g2 − b ×  r)/(g2 + b ×  r)[37]
Visible Atmospherically Resistant Index VARI (g − r)/(g  +  r − b)[38]
Woebbecke Index WI (g − b)/(r − g)[39]
Table 4. Specific values and significance levels of the correlation coefficients of VIs, TFs, and CFs.
Spectral Parameter
FeatureCoefficient of Correlation (R)FeatureCoefficient of Correlation (R)
Blue−0.680 **GNDVI−0.536 **
Green0.173 **MSR0.627 **
NIR−0.350 **NDVI−0.196 **
Red−0.051NormRRE0.474 **
RedEdge−0.188 **PSRI−0.541 **
BNDVI0.314 **OSAVI−0.310 **
CCCI−0.509 **RBNDVI−0.024
Clrededge−0.196 **RVI−0.259 **
CLSI−0.148 **TCARI0.355 **
DVIRE−0.523 **
Texture parameter
FeatureCoefficient of Correlation (R)FeatureCoefficient of Correlation (R)
Mea1 0.300 ** Mea2 −0.454 **
Var1 0.308 ** Var2 0.375 **
Hom1 −0.385 ** Hom2 −0.373 **
Con1 0.314 ** Con2 0.363 **
Dis1 0.376 ** Dis2 0.381 **
Ent1 0.332 ** Ent2 0.379 **
Sem1 −0.311 ** Sem2 −0.368 **
Cor1 0.121 ** Cor2 0.081 *
Color parameter
FeatureCoefficient of Correlation (R)FeatureCoefficient of Correlation (R)
ExB −0.455 ** MGRVI 0.244 **
ExG 0.304 ** NGRDI 0.225 **
ExR −0.223 ** RGBVI 0.484 **
GLA 0.465 ** VARI 0.019
IKAW 0.563 ** WI −0.357 **
Note: * and ** indicate reaching the significance level of 0.05 and 0.01, respectively.
Table 5. Selected spectral, textural and color features.
TypeVariable NumberSelected Features
Spectral parameter 5 Blue, CCCI, NormRRE, PSRI, BNDVI
Texture parameter 4 Mea2, Sem2, Hom1, Mea1
Color parameter 4 RGBVI, ExB, GLA, ExG
Table 6. Parameters of the SVM, RF, and BPNN models.
TypeSVMRFBPNN
SpectralC = 100,
gamma = 1, kernel = ‘rbf’
max_depth = 8, min_samples_leaf = 4, min_samples_split = 4, n_estimators = 600activation = ‘tanh’,
alpha = 0.05,
hidden_layer_sizes = (50, 100, 50), learning_rate = ‘constant’,
solver = ‘adam’
TextureC = 100, gamma = 1, kernel = ‘linear’max_depth = 8, min_samples_leaf = 4, min_samples_split = 4, n_estimators = 600activation = ‘tanh’,
alpha = 0.05,
hidden_layer_sizes = (50, 100, 50),
learning_rate = ‘adaptive’,
solver= ‘adam’
ColorC = 100, gamma = 1, kernel = ‘rbf’max_depth = 12, min_samples_leaf = 4, min_samples_split = 4, n_estimators = 600activation = ‘tanh’,
alpha = 0.05,
hidden_layer_sizes = (50, 50, 50), learning_rate = ‘adaptive’,
solver = ‘adam’
Spectral  +  texture  +  colorC = 1,
degree = 2, gamma = 1, kernel = ‘poly’
max_depth = 10, min_samples_leaf = 4, min_samples_split = 4, n_estimators = 800activation = ‘tanh’,
alpha = 0.0001,
hidden_layer_sizes = (50, 100, 50), learning_rate = ‘constant’,
solver = ‘adam’
Table 7. The accuracy evaluation of different feature combinations and classification models.
FeatureModelOA (%)Recall (%)f1-Score (%)Kappa
SpectralRF91.7591.7591.670.89
BPNN71.1371.1366.650.63
SVM88.1488.1487.980.85
TextureRF75.2675.2674.920.68
BPNN58.2558.2555.300.47
SVM72.6872.6872.010.65
ColorRF87.1187.1186.960.83
BPNN72.6872.6870.960.65
SVM80.9380.9380.270.75
Spectral  +  texture  +  colorRF91.7591.7591.710.89
BPNN84.0284.0283.960.79
SVM95.8895.8895.870.94
Table 8. Pixel area and percentage of infected areas in rubber trees.
Tree Health ConditionArea (Pixels)Percentage (%)
Asymptomatic Stage1,494,07620.9
Healthy Stage1,184,54316.6
Early Stage2,292,02031.9
Middle Stage332,0304.6
Serious Stage1,866,92226
Total7,169,591100
Disclaimer/Publisher’s Note: The statements, opinions and data contained in all publications are solely those of the individual author(s) and contributor(s) and not of MDPI and/or the editor(s). MDPI and/or the editor(s) disclaim responsibility for any injury to people or property resulting from any ideas, methods, instructions or products referred to in the content.

