Article

Evaluation of Moisture Performance of Tall Wood Building Envelope under Climate Change in Different Canadian Climatic Regions

National Research Council Canada, Construction Research Centre, Ottawa, ON K1A 0R6, Canada
*
Author to whom correspondence should be addressed.
Forests 2023, 14(4), 718; https://doi.org/10.3390/f14040718
Submission received: 16 February 2023 / Revised: 20 March 2023 / Accepted: 29 March 2023 / Published: 31 March 2023

Abstract

:
A study was realized to assess the effects of historical and projected future climates on the hygrothermal performance of cross-laminated timber wall assemblies in 12 Canadian cities belonging to several climate regions and zones and for two cladding and ventilation types. Water ingress in the wall assembly was supposed to be 1% wind-driven rain (WDR), and the airflow rate in the drainage cavity was calculated using local climate data. The hygrothermal simulation results showed that under the assumption of no deficiencies allowing wind-driven rain to enter into the wall (perfect wall), there is no risk of mold growth in the future for both claddings, either vented or ventilated. Under the assumption of high moisture loads (1% WDR), the mold growth risk could increase significantly in all climate regions and cities considered. However, in those cities located in the Cordillera and Prairie regions, the increase was not found to be problematic as the maximum mold growth remained under the acceptable level, whereas for cities located in coastal and southeastern regions, the increase in mold growth risk could be considerable. The impacts of cladding and ventilation types on the relative performance of the walls varied with city location.

1. Introduction

Evidence is mounting that the climates of Canada, as for the rest of the world, are changing and will continue to change significantly into the future [1]. These changes to the climate will cause more frequent, intense, and extreme climate events such as heat waves, floods, droughts, wildfires, wind and hailstorms [1], as well as wind-driven rain.
The changes in climate patterns will have significant impacts on building infrastructure and communities, especially on the durability of building envelope materials, as well as the comfort and health of building inhabitants [2]. High-rise buildings are exposed to increased wind and rain loads, given the increase in building height compared with low-rise constructions. This extends the exposure of the building envelope to more wind loads and wind-driven rain and may lead to increased moisture accumulation in the building envelope. This, in turn, could result in a decrease in the service life of wood-based wall and roof components, inducing the formation of mold and thereby compromising indoor air quality. It is therefore important to consider the impacts of climate change when designing the building envelope in general, and in particular, those for use in tall wood buildings, in order to anticipate their effects and find suitable mitigation solutions.
Experts have since begun to investigate the impacts of climate change on the hygrothermal performance of the building envelope, including the durability of assemblies with respect to the presence of moisture and the risk of mold growth [3,4,5,6,7,8]. Nijland et al. [3] evaluated possible risks arising from changes to climate parameters in the future on the durability of building envelope materials in the Netherlands, using four climate change scenarios. They pointed out that the actions of individual climate parameters may strengthen each other, such as a higher temperature combined with higher precipitation, or may result in effects contrary to what might be expected, such as the combination of higher precipitation combined with only a slight decrease in the number of freeze-thaw cycles. However, they concluded that damage processes affecting building materials, such as salt damage, rising dampness, and bio-deterioration, will intensify in the future. Nick et al. [4] evaluated the climate change on WDR loads and the moisture performance of walls in Sweden using hygrothermal simulations. The results showed that higher amounts of moisture might accumulate in the walls in the future. The effects of climate change on the durability of typical Canadian residential walls retrofitted to PassiveHaus configuration were evaluated by Sehizadeh and Ge [5]. It was observed that in the future, the risk of frost damage to bricks would not increase, whereas the mold growth risk would increase. Melin et al. [6] used a simplified hygrothermal model and WUFI Pro to simulate climate-induced damage to heritage objects. Both methods showed that the mean relative humidity inside wood was rather constant, but the minimum and maximum relative humidity varied with the predicted scenario and the type of building used for the simulation. Hayles et al. [7], using a stressor-response methodology, showed that there would be a modest decrease in the service life of materials of the building envelope as a consequence of the rise in and modification of patterns of precipitations and subsequent moisture intrusion in Wales, UK, but with significant financial impacts. Vandemeulebroucke et al. [8] reported a non-uniform change in the risk of degradation of wall components of masonry walls across Europe and the Mediterranean.
For massive timber buildings, Chang et al. [9,10] reported on a study related to the impact of climate and material properties on cross-laminated (CLT) wall assemblies in various climate zones of South Korea. They concluded that to ensure the moisture stability of the building envelope, it should be designed in consideration of the material (insulation) properties and the local climate conditions. However, their study was limited to observed climate and, as such, cannot be used when considering climate changes over a longer term. Chang et al. [11] evaluated the hygrothermal performance of CLT walls considering modular construction in future climatic conditions in South Korea. They found that the risk of mold growth in all regions and for all insulation types considered increased under climate change. Defo et al. [12] assessed the impacts of global warming on the risk to mold growth on CLT in wall assemblies of tall wood buildings in five cities across Canada, assuming a water penetration rate of 1% wind-driven rain. They found that the risk to mold growth could increase in all the cities studied, but with relative change varying from city to city depending on their local climates.
All the reported studies suggested that assessments of the effect on wall component performance when exposed to anticipated climatic loads as may occur in the future can be established, provided suitable local climate data sets have been developed. The objective of this study is to extend the study by Defo et al. [12] by considering more cities and climate regions with the intent of (1) investigating how wall performance might vary by geographical location and (2) investigating the effects of selected hygrothermal parameters on the response of wall assemblies.

2. Methods

2.1. Regions and Cities Considered for the Study

Twelve (12) Canadian cities from several climate regions were selected for this study: Whitehorse, Yukon (YT), Vancouver, British Columbia (BC), Calgary, Alberta (AB), Saskatoon, Saskatchewan (SK), Winnipeg, Manitoba (MB), Toronto, Ontario (ON), Ottawa, Ontario (ON), Montreal, Quebec (QC), Moncton, New Brunswick (NB), Charlottetown, Prince Edward Island (PE), Halifax, Nova Scotia (NS) and St. John’s, Newfoundland and Labrador (NL). Their location and current climatic design data, as found in the 2020 National Energy Code for Buildings [13] with respect to the climatic zone and in the 2020 National Building Code [14] for values of moisture index (MI), heating-degree-days below 18 °C (HDD), rain and driving rain wind pressure (DRWP) are given in Table 1. Climate zones 4, 5, 6, 7A and 7B correspond to zones with heating degree-days ranging from 2000 to 2999, 3000 to 3999, 4000 to 4999, 5000 to 5999, and 6000 to 6999, respectively. The definition of MI can be found in [15]. Latitude and longitude indicated for each city are that of the nearby airport station except in Toronto, where the weather station considered is located in the city center. The selected cities are located in the far north of Canada (Whitehorse, YT), as well as from the West to the East coast, and cover a wide range of climate regions, MI and HDD.

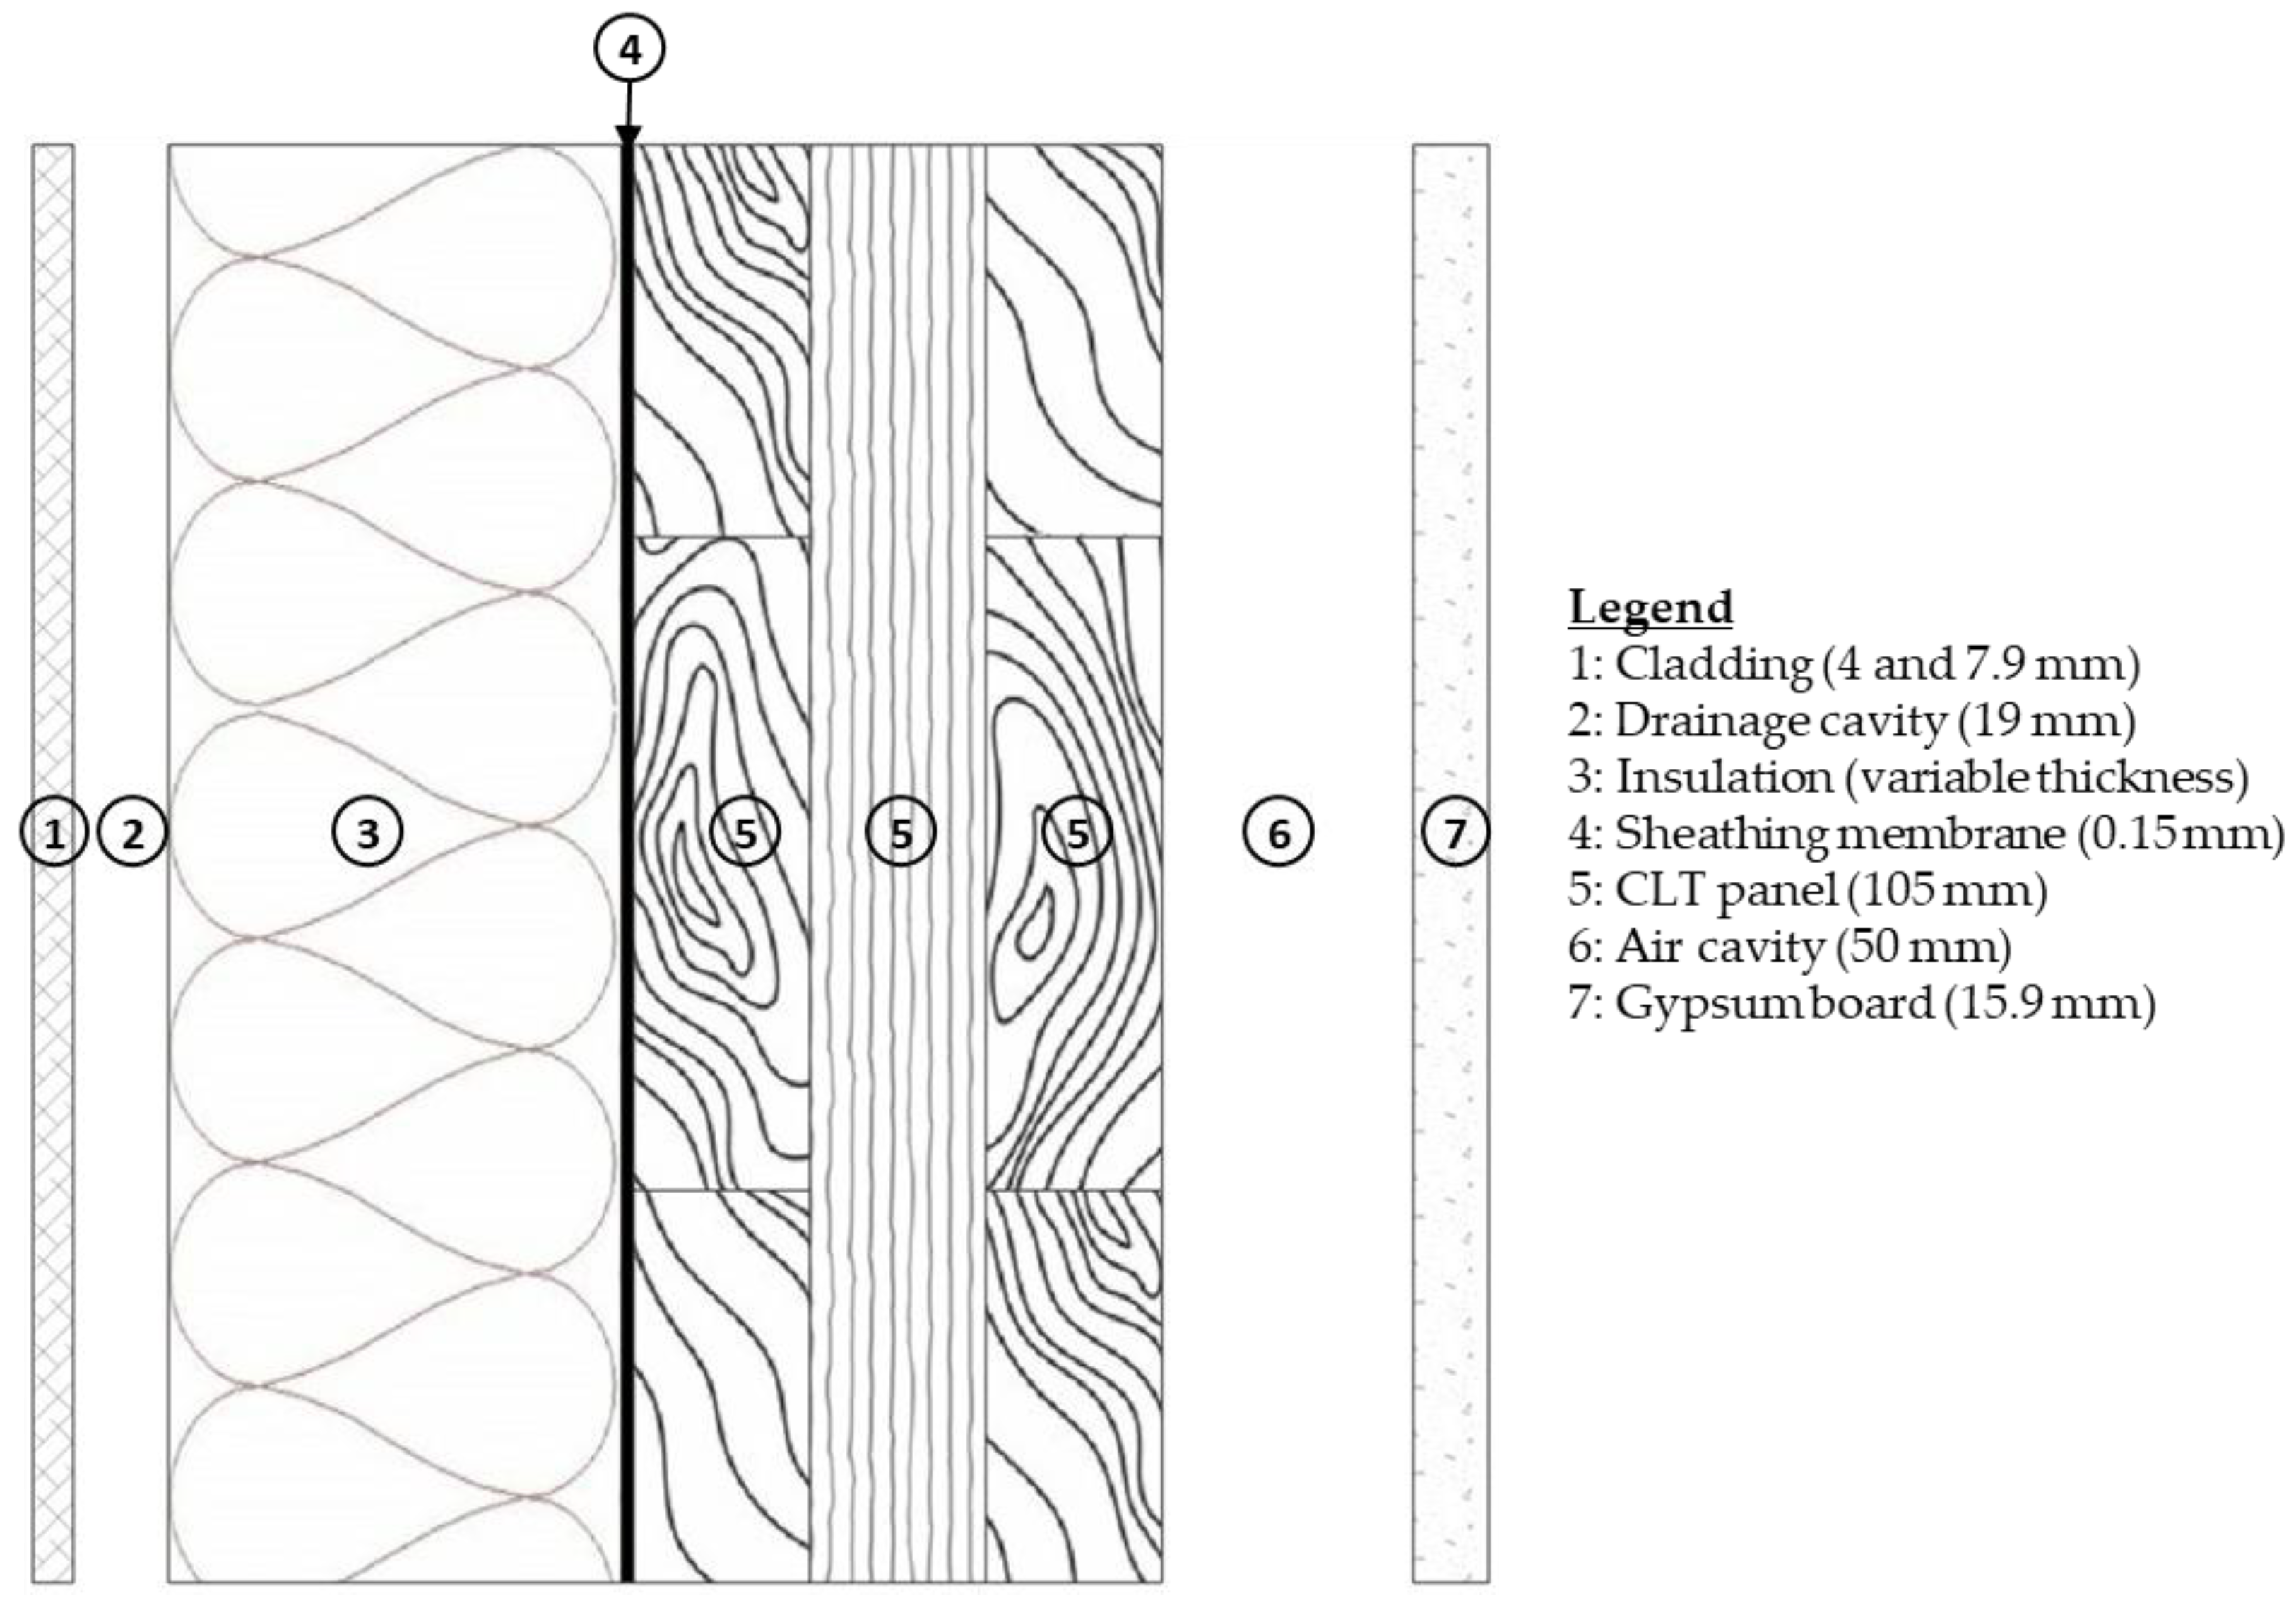
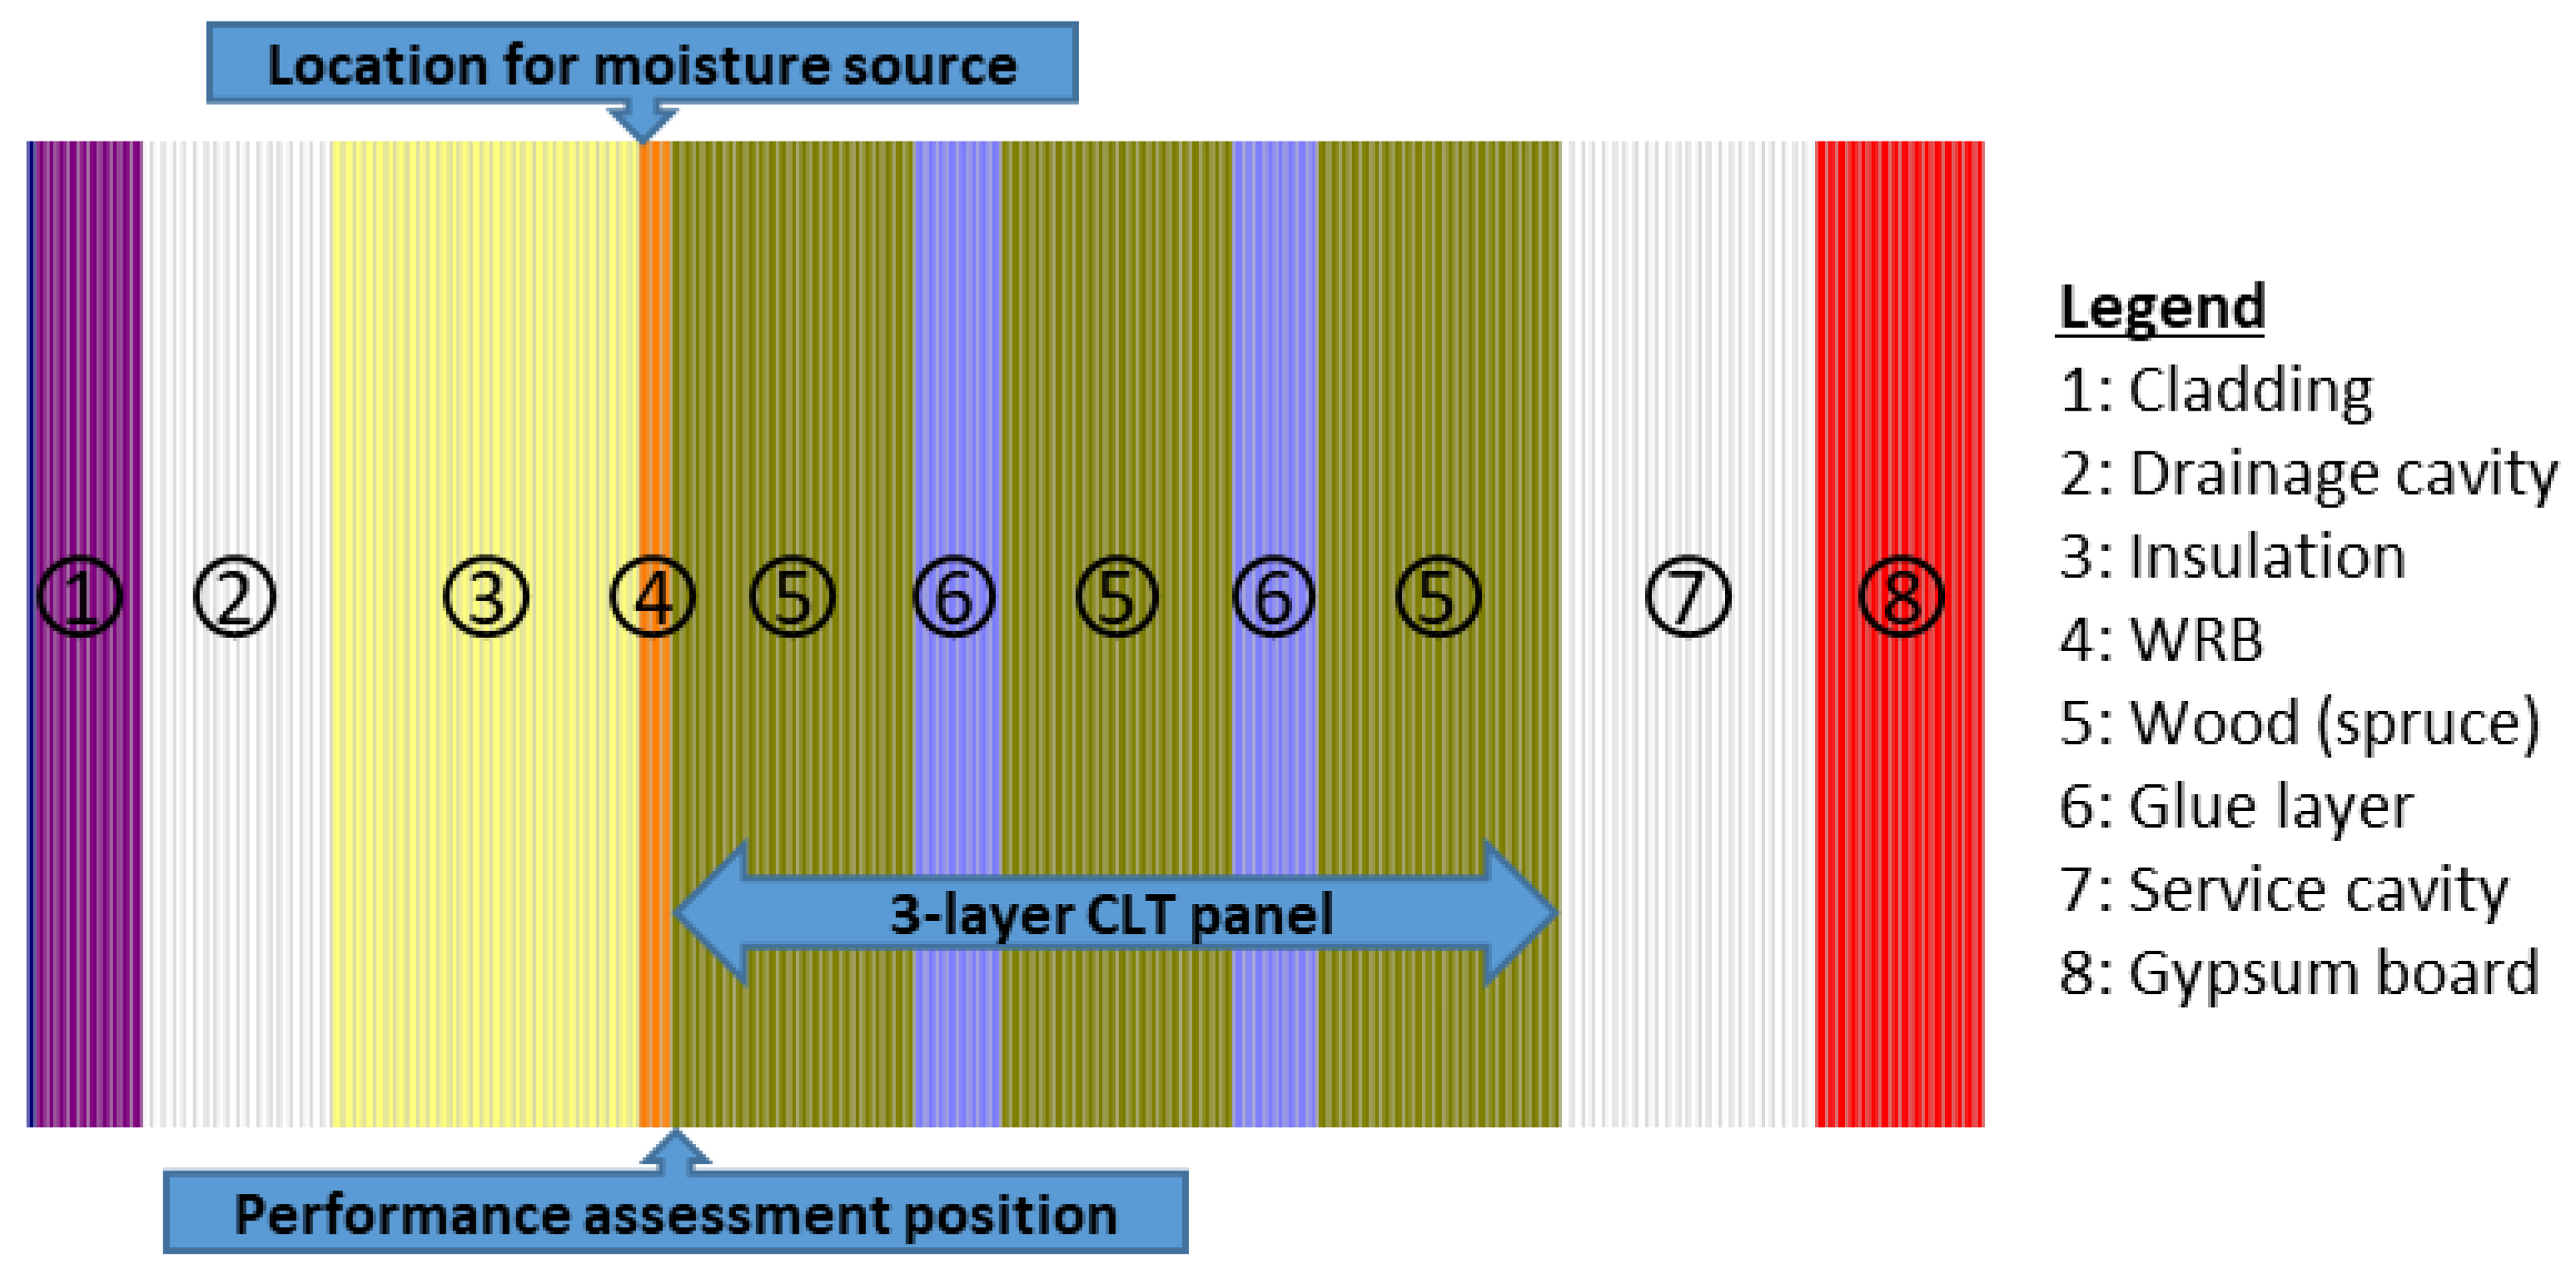
2.2. Building and Wall Configuration

The building considered for this study is a 13-story (~41 m) building that has a flat roof and is assumed to be located in the city center. Various configurations are proposed for mass timber walls in heating-dominated climate zones [16,17,18]. Primarily, the wall assembly is designed to warrant moisture durability, energy efficiency, fire safety, and noise control. From exterior to interior, a prevalent massive timber wall assembly encompasses a(n): cladding, drainage cavity, insulation, an air barrier/water-resistive barrier, and cross-laminated timber (CLT) panel. The exterior insulation is promoted for the thermal design approach, although interior insulation can be added to improve energy efficiency. A gypsum board is added on the interior side for fire safety, but where it is allowed, the CLT panel can be left exposed. A vapor permeable insulation is favored to permit outward drying of the CLT in case of incidental water ingress or if initially wetted. The vapor barrier is not necessary, given that the CLT panel provides enough outward vapor resistance. The material and thickness of insulation depend on the climate zone in which the building is located.
Figure 1 shows the configuration of the CLT wall investigated. It is a non-load-bearing wall composed of, from exterior to interior: (1) 7.9-mm fiber cement board (FCB) or 4-mm aluminum composite material (ACM) used as cladding, (2) 19-mm wood furring/drainage cavity, (3) mineral fiber insulation, (4) sheathing membrane (spun bonded polyolefin, 0.15 mm), (5) 3-layer CLT made of spruce, (6) an air cavity (50 mm) and (7) 15.9-mm type X interior grade gypsum board with latex primer and one coat of latex paint. The ACM considered in this study is AlucoBond Plus, made by 3A Composites [19], composed of faced skins made of aluminum and a fire-retardant mineral-filled core.
The insulation thickness varied with the climate zone. For climate zones 4 (Vancouver), 5 (Toronto), 6 (Ottawa, Montreal, Moncton, Charlottetown, Halifax, and St. John’s), and 7A and 7B (Calgary, Saskatoon, and Winnipeg), the minimum thermal resistance value, RSI, as recommended by the National Energy Code for Buildings [13], for above-grade opaque walls is 3.45, 3.77, 4.17, 4.65, and 5.26 (m2 K/W), respectively. To meet this minimum requirement, a 2.5″ (64 mm), 3″ (76 mm), 3.5″ (89 mm), and 4.5″ (114 mm) layer of mineral fiber was used as insulation for climate zones 4, 5, 6, and 7A and 7B, respectively.
Two cladding ventilation designs were analyzed: (1) a vented design (i.e., walls with an opening at the bottom only); and (2) a ventilated design (i.e., walls with openings at the bottom and top (100 to 350).

2.3. Material Properties
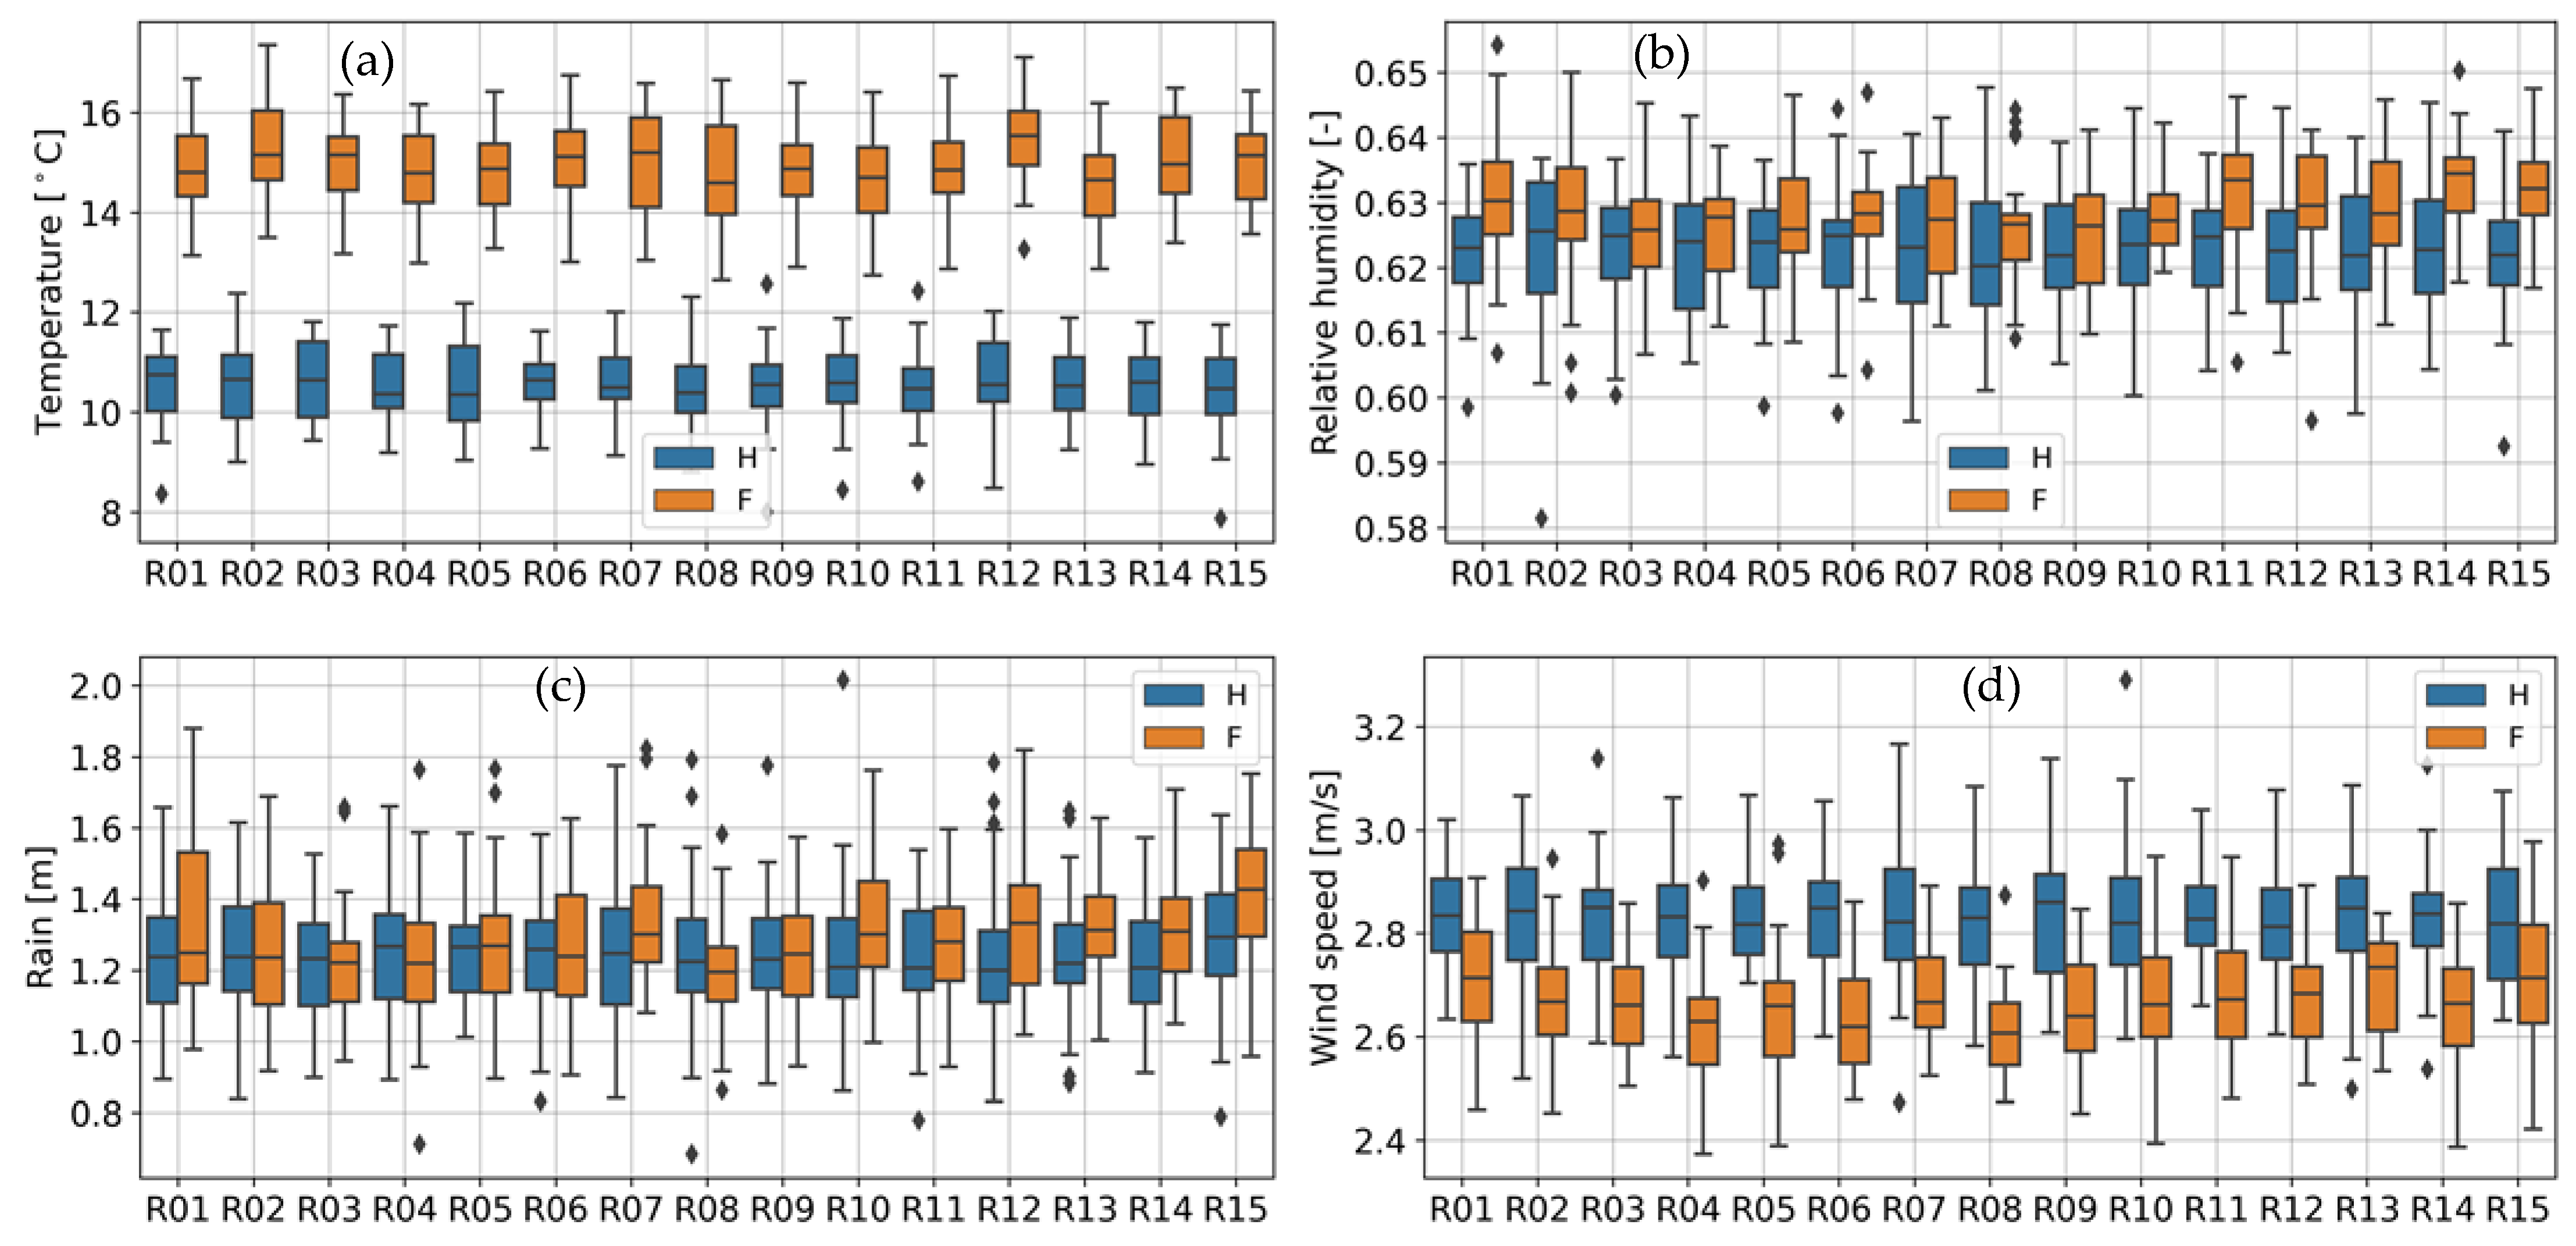
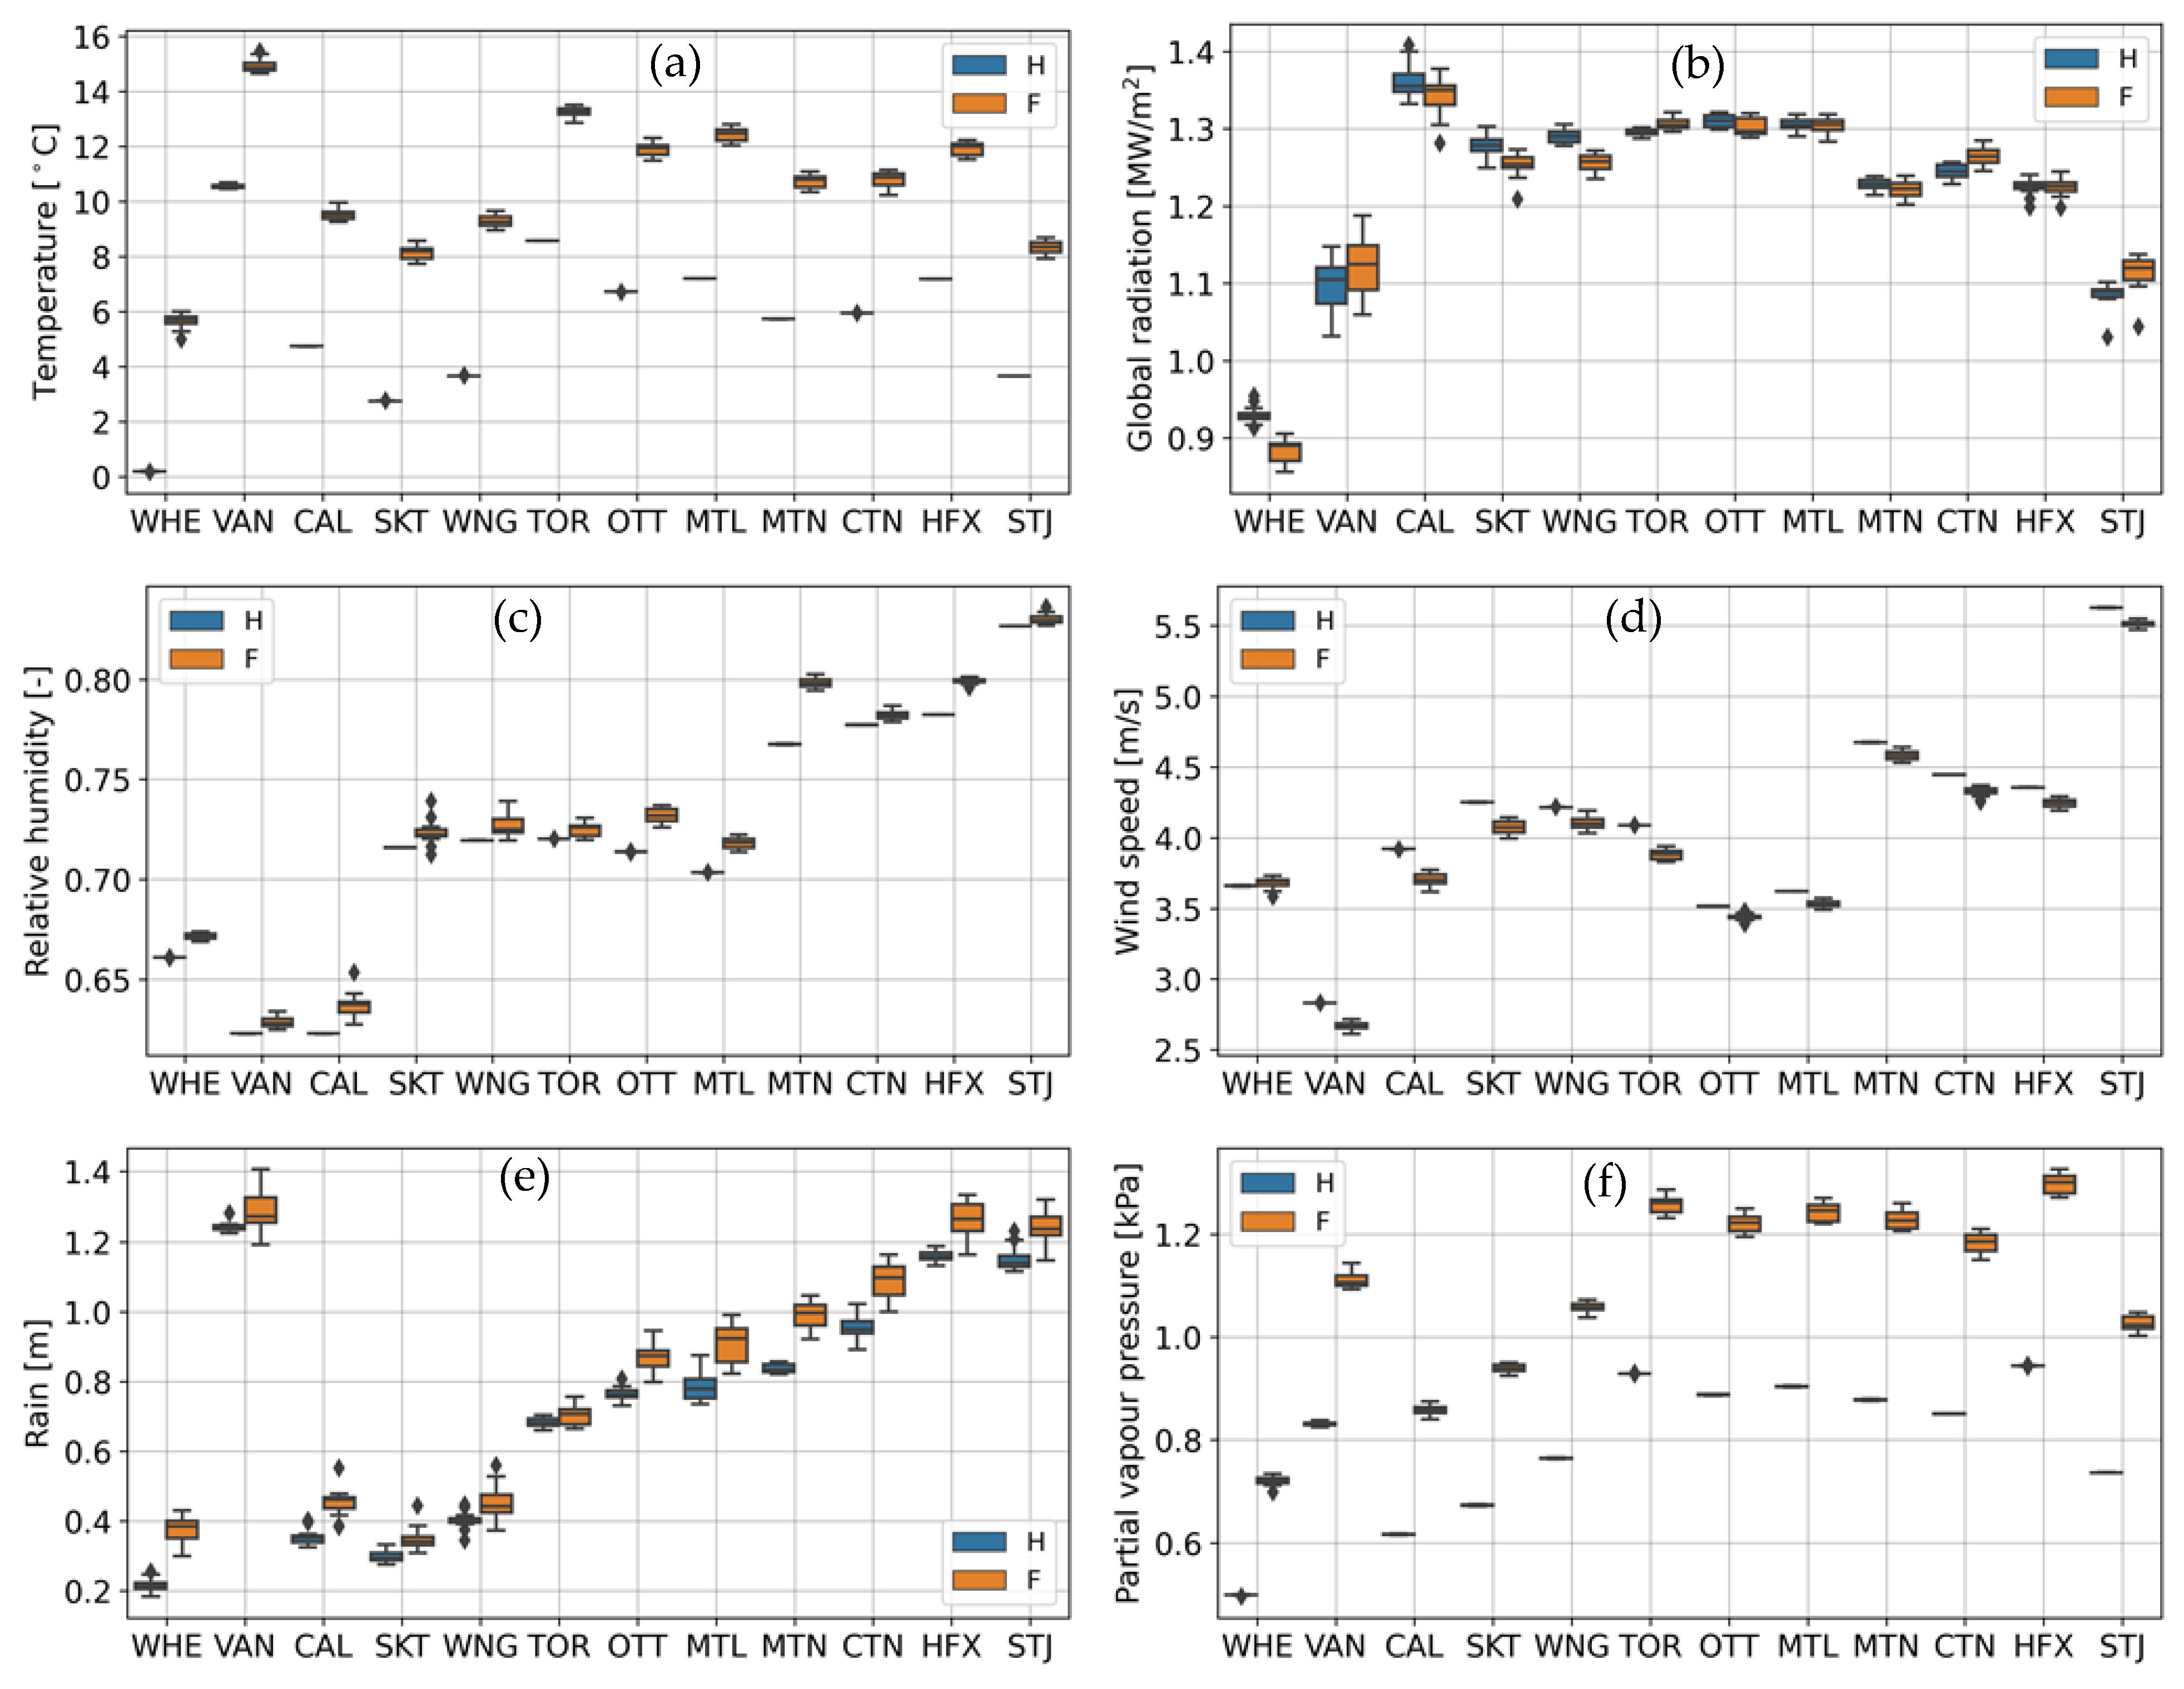
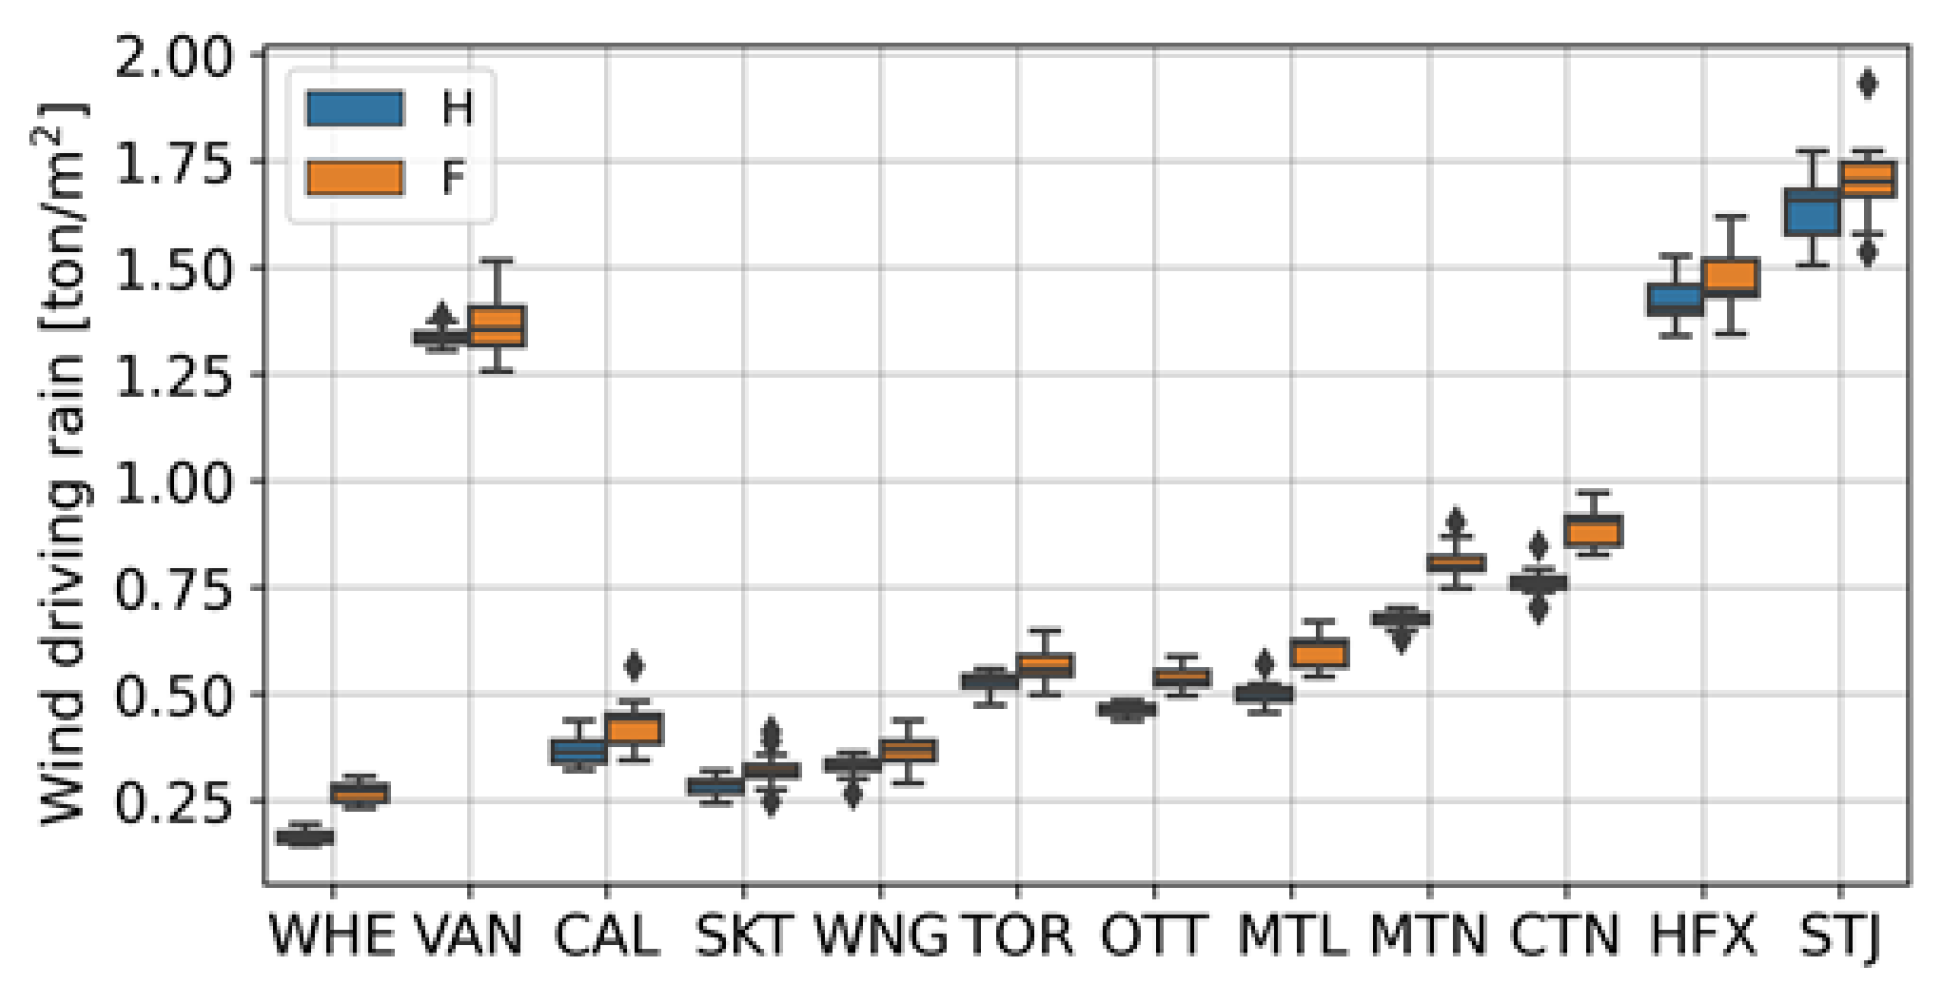
Most of the material properties were retrieved from the National Research Council hygrothermal material properties database [20], with the exception of those for the aluminum composite material, CLT adhesive layer, and mineral wool insulation. The CLT adhesive layer (assumed to extend 2 mm deep in the plank) was modeled with the same material properties as spruce, with the exception that the water vapor permeability and liquid water diffusivity were decreased by 50%. In fact, previous studies on the characterization of the hygrothermal properties of CLT have shown that its vapor permeability and moisture diffusivity are substantially reduced in comparison with solid wood [21]. The properties of insulation were retrieved from the DELPHIN material properties database, and those for the aluminum composite material were obtained from the product’s datasheet [19]. Table 2 shows the basic properties of materials used in this study. For ACM and mineral wool, small values of water absorption coefficient (0.00001) and vapor permeability (1 × 10⁻¹⁸) were used. The porosity is at saturation, and the density is at a dry state.

2.4. Climate Data

The ensemble climate data encompassed modeled hourly time series of climate variables useful for undertaking hygrothermal simulations for a reference period spanning 1986–2016 and future periods with projected global warming levels of 2 °C and 3.5 °C. The dataset for each time period comprised fifteen hourly realizations (also referred to as “runs”) that are part of the datasets derived from the large ensemble of climates simulated by the Canadian Regional Climate Model (CanRCM4)—version 4. Each of the fifteen hourly runs was initialized under a different set of initial conditions in the Canadian Earth System Model (CanESM2) under the historical and Representative Concentration Pathway 8.5 (RCP8.5) greenhouse gas emission scenario. The RCP8.5 is a high greenhouse emission scenario with a radiative forcing of 8.5 W/m2 by the end of the 21st century compared to the pre-industrial level and is accepted as an appropriate scenario for business-as-usual and non-climate policy conditions [22]. Under this condition, a global warming of 2.0 °C is expected to occur between 2034 and 2064, whereas a global warming of 3.5 °C is expected between 2062 and 2092. A comprehensive description of the method used to develop modeled historical (H) and projected future (F) climate data can be found in [23].
A preliminary analysis showed that the responses of the building envelope obtained from hygrothermal simulations for the future period that corresponded to a global warming of 2.0 °C were, in general, positioned between the historical and future periods corresponding to 3.5 °C global warming. As such, only the 31-year historical (H: 1986–2016) and future period corresponding to global warming of 3.5 °C (F: 2062–2092) were considered for evaluating the effects of climate changes on tall wood building wall assemblies.
The variability amongst the different runs of the H and F periods is shown in Figure 2 for the yearly average temperature, relative humidity (RH), wind speed, and yearly sum of horizontal rain in the city of Vancouver. The box shows the minimum (Q1 − 1.5 × IQR), the 25th percentile (Q1), the median, the 75th percentile (Q3), the maximum (Q3 + 1.5 × IQR), and the outliers (diamond), where IQR is the interquartile range. There are differences amongst the 15 runs of each time period, which illustrate the uncertainty in the climate data due to different sets of initial conditions.
Figure 3 presents the distribution of the 15 runs mean values of the yearly means or sums of climate variables for both H and F periods in the 12 cities considered: Whitehorse (WHE), Vancouver (VAN), Calgary (CAL), Saskatoon (SKT), Winnipeg (WNG), Toronto (TOR), Ottawa (OTT), Montreal (MTL), Moncton (MTN), Charlottetown (CTN), Halifax (HFX), and St. John’s (STJ). It can be noticed that: in all cities considered, the annual average temperature and partial vapor pressure will increase significantly between the two timelines; global solar radiation will either slightly decrease (Whitehorse, Calgary, Winnipeg, Saskatoon, Ottawa, and Moncton) or remain unchanged (Montreal and Halifax) or slightly increase (Vancouver, Toronto, Charlottetown and St. John’s); values for annual relative humidity and horizontal rain will moderately increase in all the cities; and average yearly wind speed will diminish for all the cities but for Whitehorse, where it will slightly increase in the future. It can also be seen in Figure 3 that for both H and F timelines, the city of Vancouver on the west coast is the warmest; the highest relative humidity values are found in the cities on the east coast (Moncton, Charlottetown, Halifax, and St. John’s) whereas Vancouver is amongst the cities having the lowest yearly average RH values. The yearly average rainfall is relatively greater for cities in coastal areas as compared to those located in the interior of the country. Vancouver has the lowest yearly average wind speed, whereas cities located on the east coast have the highest wind speed.
Wind-driven rain (WDR) was calculated using the ASHRAE’s model [24], assuming rain exposure and deposition factors of 1.5 and 1.0, respectively, as the building under consideration has a height greater than 20 m and is assumed to be located in the city center. This approach is very conservative, as it has been shown that the ASHRAE model tends to overestimate the WDR [25]. Results are shown in Figure 4 and summarized in Table 3 for the annual sum of WDR calculated for the orientation with the highest WDR load. It can be seen that there is a tendency toward increasing wind-driven rain in the future in all cities, the relative change being a function of the location.

2.5. Hygrothermal Simulations Setting

A set of simulations was performed to address the objectives of this work. To permit capturing the uncertainties related to the variability in the modeled climate data, simulations were realized for all 15 runs of each time period (i.e., historical and future projected climate). Two scenarios were considered: a scenario assuming a perfect wall with no deficiency in the cladding that might allow wind-driven rain to penetrate into the structure, and a scenario assuming that there are deficiencies in the cladding that allow rainwater to penetrate deeper into the wall beyond the insulation layer. This scenario may exist due to poor workmanship or due to the aging of the components during service life coupled with a poor maintenance plan. The building was assumed to be airtight so that the risk of condensation due to air exfiltration was thus minimal. Regardless, the insulation is located on the outer side of the CLT panel, which keeps it warm and minimizes the risk of condensation due to air leakage. In this section, the parameters used for simulations are described.

2.5.1. Simulation Tool

DELPHIN, CHAMPS-BES (Coupled Heat, Air, Moisture, Pollutant Simulation for Building Envelope Systems) developed and maintained by the Institute for Building Climatology, Faculty of Architecture, Technical University of Dresden, Germany, v5.9.6, was selected as the tool used for hygrothermal simulations in this study. A relevant feature of DELPHIN resides in its ability to handle WDR deposition and shortwave and long-wave radiation as part of its boundary conditions, as well as heat and moisture sources and air leakage. Its reliability has been successfully verified with HAMSTAD Benchmarks 1–5 [26] and with experimental data [27,28,29,30]. Details of the equations of the model can be found in references [31,32,33,34].

2.5.2. Wall Geometry, Discretization, and Solver Parameters

The simulations were realized in a one-dimensional (1-D) configuration on a portion of the vertical cross-section of the opaque wall that passes through the center of the air cavity, i.e., not including the furring, as shown in Figure 5. The heat and mass movements are supposed to be unidirectional in that position in the wall and can be represented by a 1-D model configuration. The use of this 1-D hygrothermal simulation model was deemed acceptable to seize the relative effects of climate change on the moisture performance of the massive timber walls.
For spatial discretization, apart from the weather-resistive barrier (WRB), the thickness of the first and last element was set to 0.5 mm, then an expansion factor of 125% was used to generate the grids. For the WRB, 3 grids of equal size were used.
For simulations, the standard solver of DELPHIN was used with the following parameters. The initial time step and the smallest time step permitted were set to 0.01 s and 10−5 s, respectively. The maximum time step was fixed to 1 h, corresponding to the time step in the climate data. Internally, the solver uses adaptive time steps, depending on the rate of convergence of the solution. The maximum method order, relative tolerance, and absolute tolerance (error level for which the iteration stops) were set to 5, 10−6, and 10−7, respectively, and were selected based on a compromise between the accuracy of the solution and need to minimize simulation time after preliminary evaluations.

2.5.3. Moisture Reference Years and Initial Conditions

Ideally, hygrothermal simulations should have been performed on the 31-year series of each climate realization. However, this method would have been unpractical for a large-scale study such as this as it would have required longer overall computational simulation time, owing to (1) the number of realizations of climate data per timeline (15); and (2) the large number of cases to be analyzed (12 cities and two wall assemblies per city). The common method for evaluating the hygrothermal performance of a wall is to rely on Moisture Reference Year(s) (MRYs) [15,35,36,37,38]. The MRYs were chosen using the moisture index (MI) approach developed by [15].
To evaluate the effect of climate change, which consists of comparing wall hygrothermal performance in the future period to that of historical, the approach used to define the moisture reference years (MRYs) for a 31-year series of data was to select one representative year from each realization of the historical (1986–2016) and future (2062–2092) climate data. This representative year, the test year, was within the 31-year series with a 90-percentile value for MI. The test year was repeated three times. The first two repeats were considered to be conditioning years, and the last repeat was used as the evaluation year. This approach was assumed sufficient to seize the relative response of climate change on the risk to mold growth of wall assemblies between H and F periods.
The initial conditions for each element of the wall assembly were arbitrarily set to an RH of 80% and a temperature of 15 °C. Preliminary studies showed that the effects of the initial relative humidity and temperature conditions on the hygrothermal responses are limited to one to two years of simulation depending on the initial conditions, the climate data, and whether or not the moisture source is considered; thus, the utilization of the two first repetitions of the test year to condition the wall and to relieve the effects of the initial conditions.

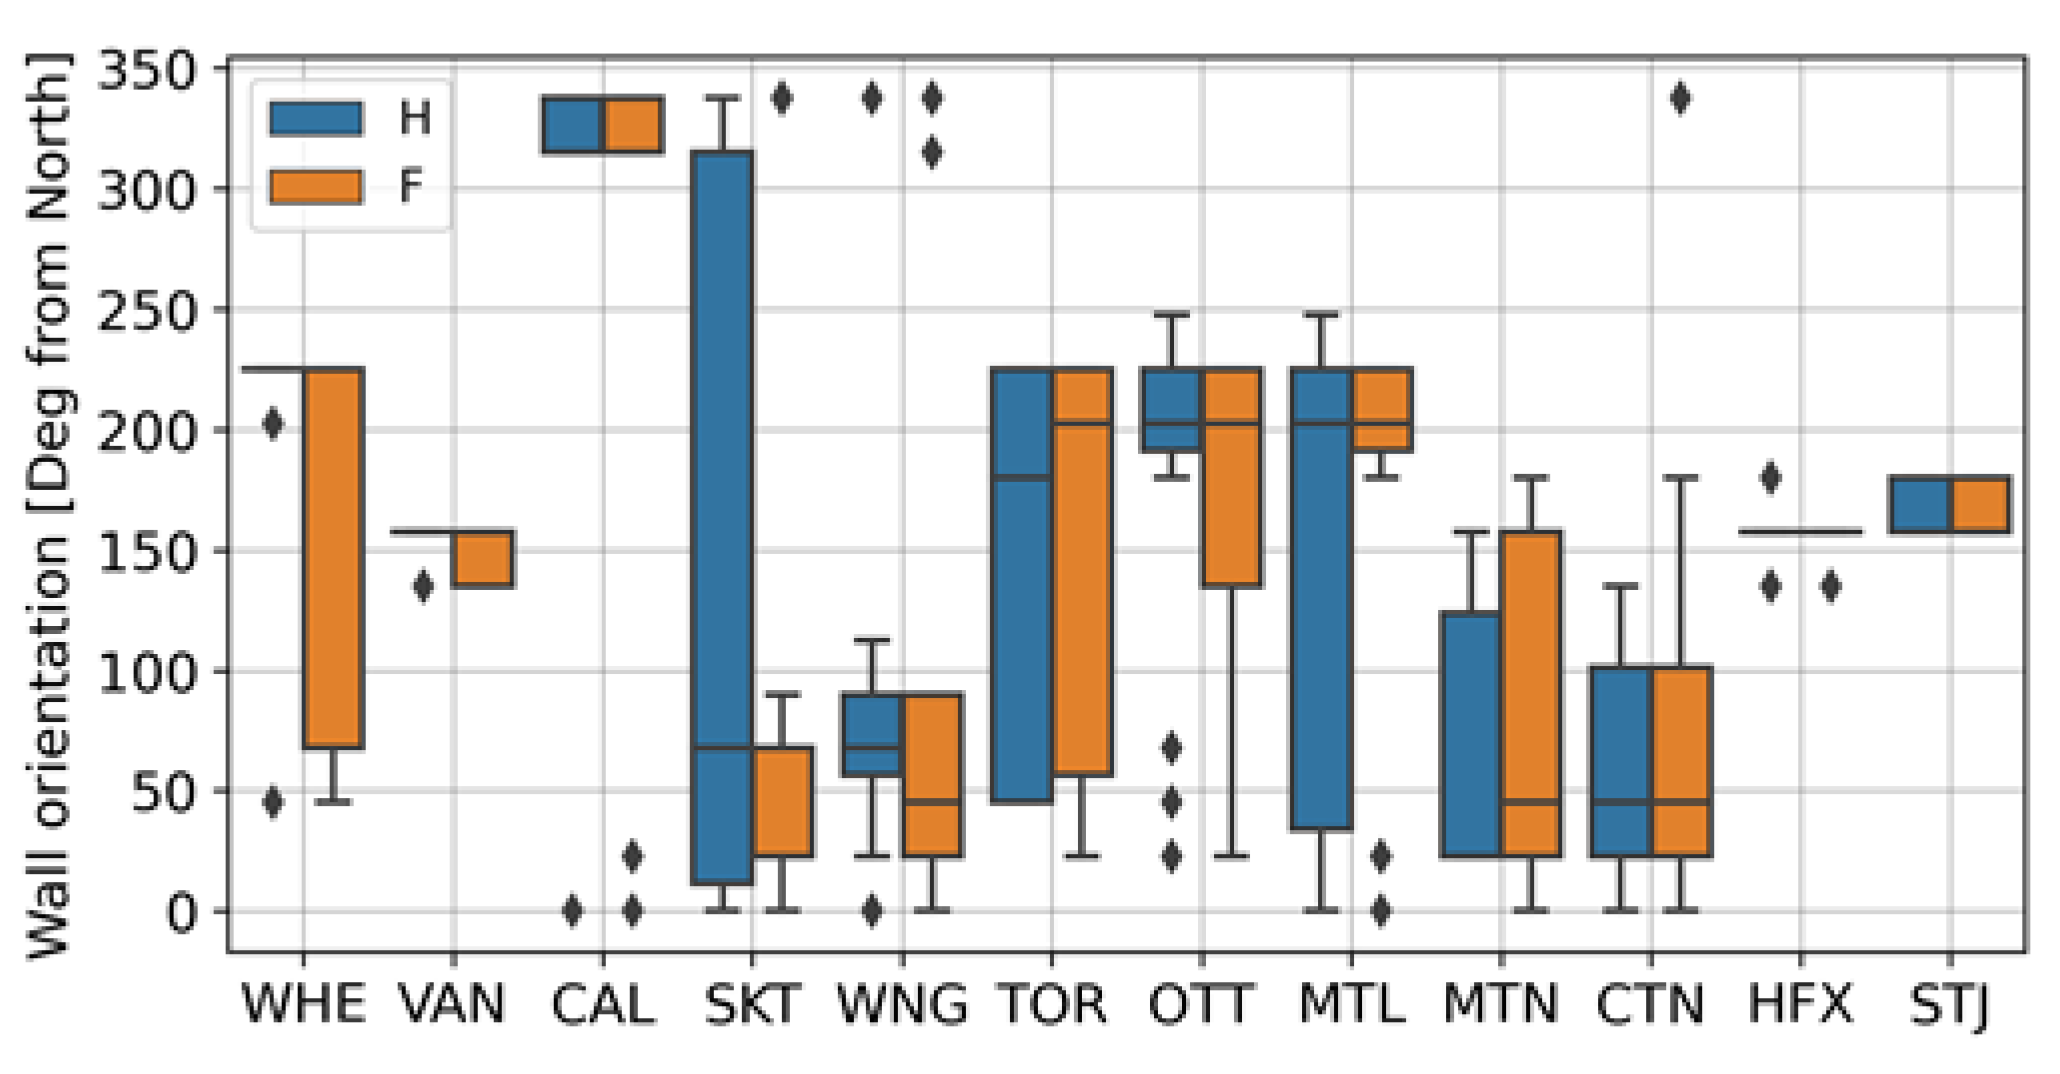
2.5.4. Wall Orientation

Hygrothermal simulations are costly in terms of computational time. Therefore, to save the time required for simulations, the common practice is to select the orientation which is likely to cause the most significant moisture issues. There are several performance attributes that can be used to evaluate the hygrothermal performance of walls [39]: frost damage of masonry, corrosion of metallic components, mold growth on the surface of materials, degradation of bio-based components due to decay fungi, and other degradation actions. In most cases, the accumulation of moisture within the wall is the primary cause of the degradation of wall components. As such, it is suggested that the wall orientation that receives the greatest quantity of WDR or the least solar radiation, or both, be used [24]. In this study, the wall orientation was chosen in each case as the orientation in which the rainfall deposition from WDR was the greatest for the test year. It was chosen using the wind-driven rain rose. Figure 6 summarizes the results obtained with respect to the range of wall orientation for the different locations across Canada as were studied. There is a large variability in wall orientations for the 15 realizations of the climate data set, with the exception of Whitehorse historical, Vancouver, Halifax, and St. John’s for both H and F periods.

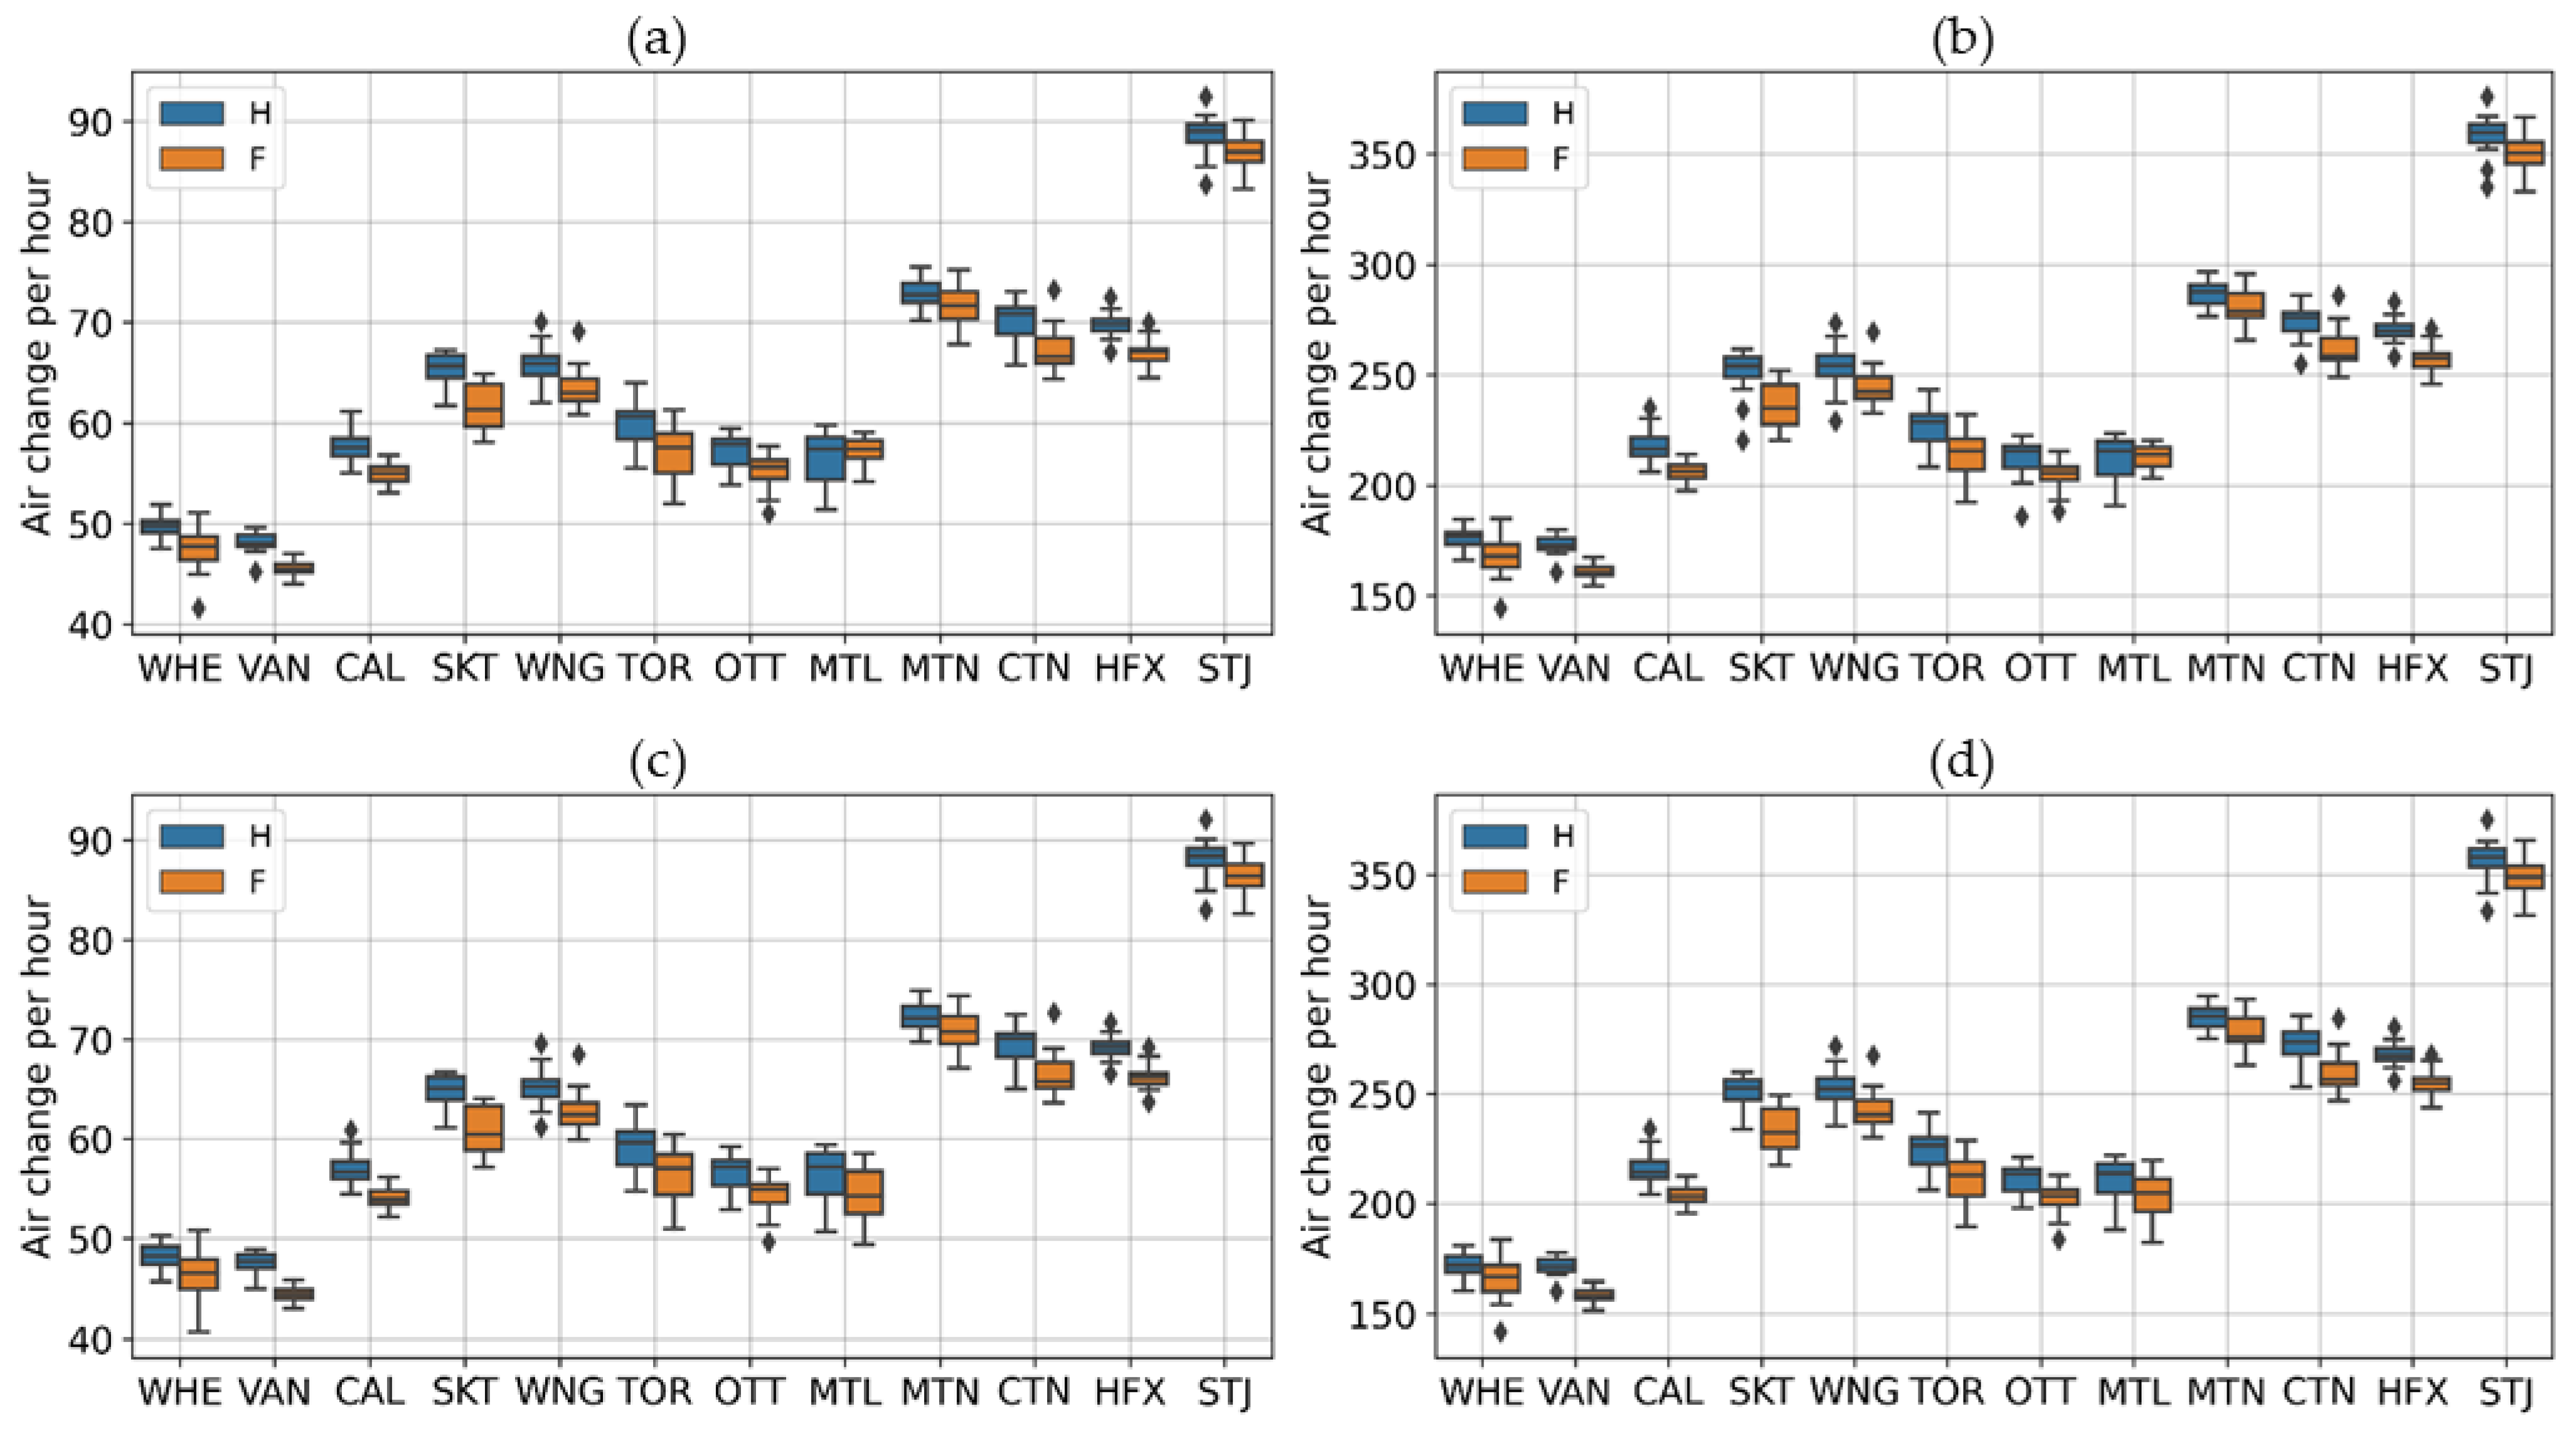
2.5.5. Air Change Rate

The air was supposed to remain still in the service cavity between the drywall and the CLT panel, but air movement in the drainage cavity, either vented or ventilated, was expected. For this study, the source/sink approach to implement the cladding ventilation was used, which considers the cladding ventilation as a heat and moisture source. This requires knowledge of drainage cavity depth and air changes per hour. The challenge is then to determine the values for air changes per hour (ACH) to use in the simulations.
To determine the cladding ventilation rate for hygrothermal simulation, a theoretical calculation was implemented for walls having a clear drainage cavity and continuous slot openings. Details of the calculation procedure, based on the approach used by [40,41], can be found in [42]. The findings for each wall system considered in this study are summarized in Figure 7 for the median of the hourly values calculated for the test year of each climate realization. In general: (1) ACH varies with the city in the same manner as wind speed (Figure 3); (2) vented walls experience low ventilation rate (40 to 90) as compared to ventilated walls (100 to 350); (3) As for wind speed, there is a trend of decreasing ACH in the future. For undertaking simulations, the median value of the calculated hourly ACH was used in each case. In fact, [41] showed that using hourly values or annual average values leads to similar responses. This was also verified by the results obtained in the preliminary study.

2.5.6. Moisture Source

The moisture source was determined, assuming water entry beyond the cladding would find its way to the surface of the sheathing membrane. With no information about the amount of water that can penetrate the massive timber wall structure, the water entry rate was set to 1% WDR, as suggested by the 2016 ASHRAE Standard 160 [24]. It was deposited to the exterior surface of the sheathing membrane, as indicated in Figure 5.
The assumed worst-case water entry value of 1% WDR, applied on the exterior surface of the sheathing membrane, may be too high for this type of wall given the presence of the 19-mm drainage cavity, the poor liquid conductivity of the insulation used and the long path the water would need to cover to reach the sheathing membrane. However, it remains likely to occur if there are deficiencies around doors and windows, at joints between components, or water leaks from the roofing system. Moreover, tall buildings are subjected to high winds.

2.5.7. Boundary Conditions

The 1-D simulation problem being considered requires a definition of the indoor and outdoor boundary conditions. The external boundary conditions are applied to the exterior surface of the cladding. The exterior conditions consist of the climate loads for a given location, which includes the following outdoor climate variables: wind speed and direction, WDR, temperature, RH, solar shortwave radiation (direct and diffuse) normal to the wall, sky long wave emission or atmospheric counter radiation, ground long wave emission.
Climate data and the approach to determining the WDR are described in Section 2.4. Direct and diffuse solar shortwave radiations were provided directly to DELPHIN, with the information required to calculate the normal components, i.e., wall orientation, geographical location (latitude and longitude), and time zone. The sky and ground long-wave emissions were explicitly computed and provided to DELPHIN, considering long-wave emissivity of 0.9 for the exterior cladding surface and the surrounding ground and 1.0 for the sky. The ground surface temperature and albedo were set to the air temperature and 0.2, respectively. The shortwave absorption coefficient of the cladding was set to 0.35, assuming a white-colored surface [43]. The outdoor convective heat transfer coefficient was calculated using Equation (1) [44]:
α c = 4 + 4 V
where αc is the outdoor convective heat transfer coefficient (W/m2 K), and V is the wind speed corrected for the height of the building (m/s). The outdoor convective vapor transfer coefficient was calculated using the outdoor convective heat transfer coefficient and the Lewis number [45]. At normal pressure, the Lewis number, which is the ratio of thermal diffusion to mass diffusivity, is equal to 6.1 × 10⁻⁹.
The indoor boundary conditions were selected as constants and set to 21 °C for temperature and 50% for relative humidity. Referring to ISO 6946 Standard [44], the indoor convective heat transfer coefficient was set to 2.5 W/m2 K, whereas the indoor radiative heat transfer coefficient was set to 5.5 W/m2 K. The indoor vapor transfer coefficient was calculated using the convective indoor heat transfer coefficient and the Lewis number [45]. Given a convective heat transfer coefficient of 2.5, the indoor vapor transfer coefficient was determined to be 1.53 × 10⁻⁸ s/m.

2.6. Performance Evaluation

Under favorable conditions of temperature and RH, mold fungi can grow on building material surfaces, and this is much regarded as problematic considering the potential risk to indoor air quality [46]. The development of mold models for evaluating the moisture durability of building materials has been ongoing for a number of decades. In particular, the works of [47,48] at the Technical Research Centre (VTT) of Finland have driven the development of an empirical model for mold growth [49,50] that is largely used in hygrothermal simulation tools for evaluating the durability of wood-based building materials. The use of this mold growth model (VTT mold model) is recommended in ASHRAE Standard 160 [24] for the evaluation of moisture performance. The mold growth index (MoI) was therefore chosen as the performance attribute to be used to assess the effects of climate change on the moisture performance of the tall wood building envelope considered in this study. While the mold growth risk provided by the model may not reflect reality, it at least permits a comparison of different scenarios.
The CLT panel is the critical component of the CLT wall assembly in regard to moisture durability. Its outer layer, in contact with the sheathing membrane, is more prone to moisture uptake and, under favorable conditions, can give rise to the risk of the formation of mold or decay. This location (0.5-mm), shown in Figure 5, was selected as the critical location from which to compare mold development as predicted using historical and future climate data. As the CLT was supposed to be made of spruce wood, the options selected for computing the mold growth index using ASHRAE’s implementation were: “Sensitive” for material with a mold growth decline factor of 0.3.
ASHRAE Standard 160 [24] recommends an MoI below 3.0 to avoid visible mold growth with no indication of the duration of time when the MoI is greater than 3.0. This is intended as the criterion for acceptable performance to a maximum mold growth index of 3.0. Using this criterion may lead to a false conclusion regarding the performance if there is no indication of the duration of the time for which the maximum value of MoI is greater than 3.0. For example, there may be a scenario where a maximum value greater than 3.0 occurs during a limited time period, i.e., for a few hours or days, in which case the health risk is minimal, and another scenario where a maximum value greater than 3.0 occurs over a long period of time and poses a potential health issue for building occupants. Given this limitation in using the maximum value of MoI, the mean value was selected with the criterion of failure set to a mean value greater than 1.0.

3. Results and Discussion

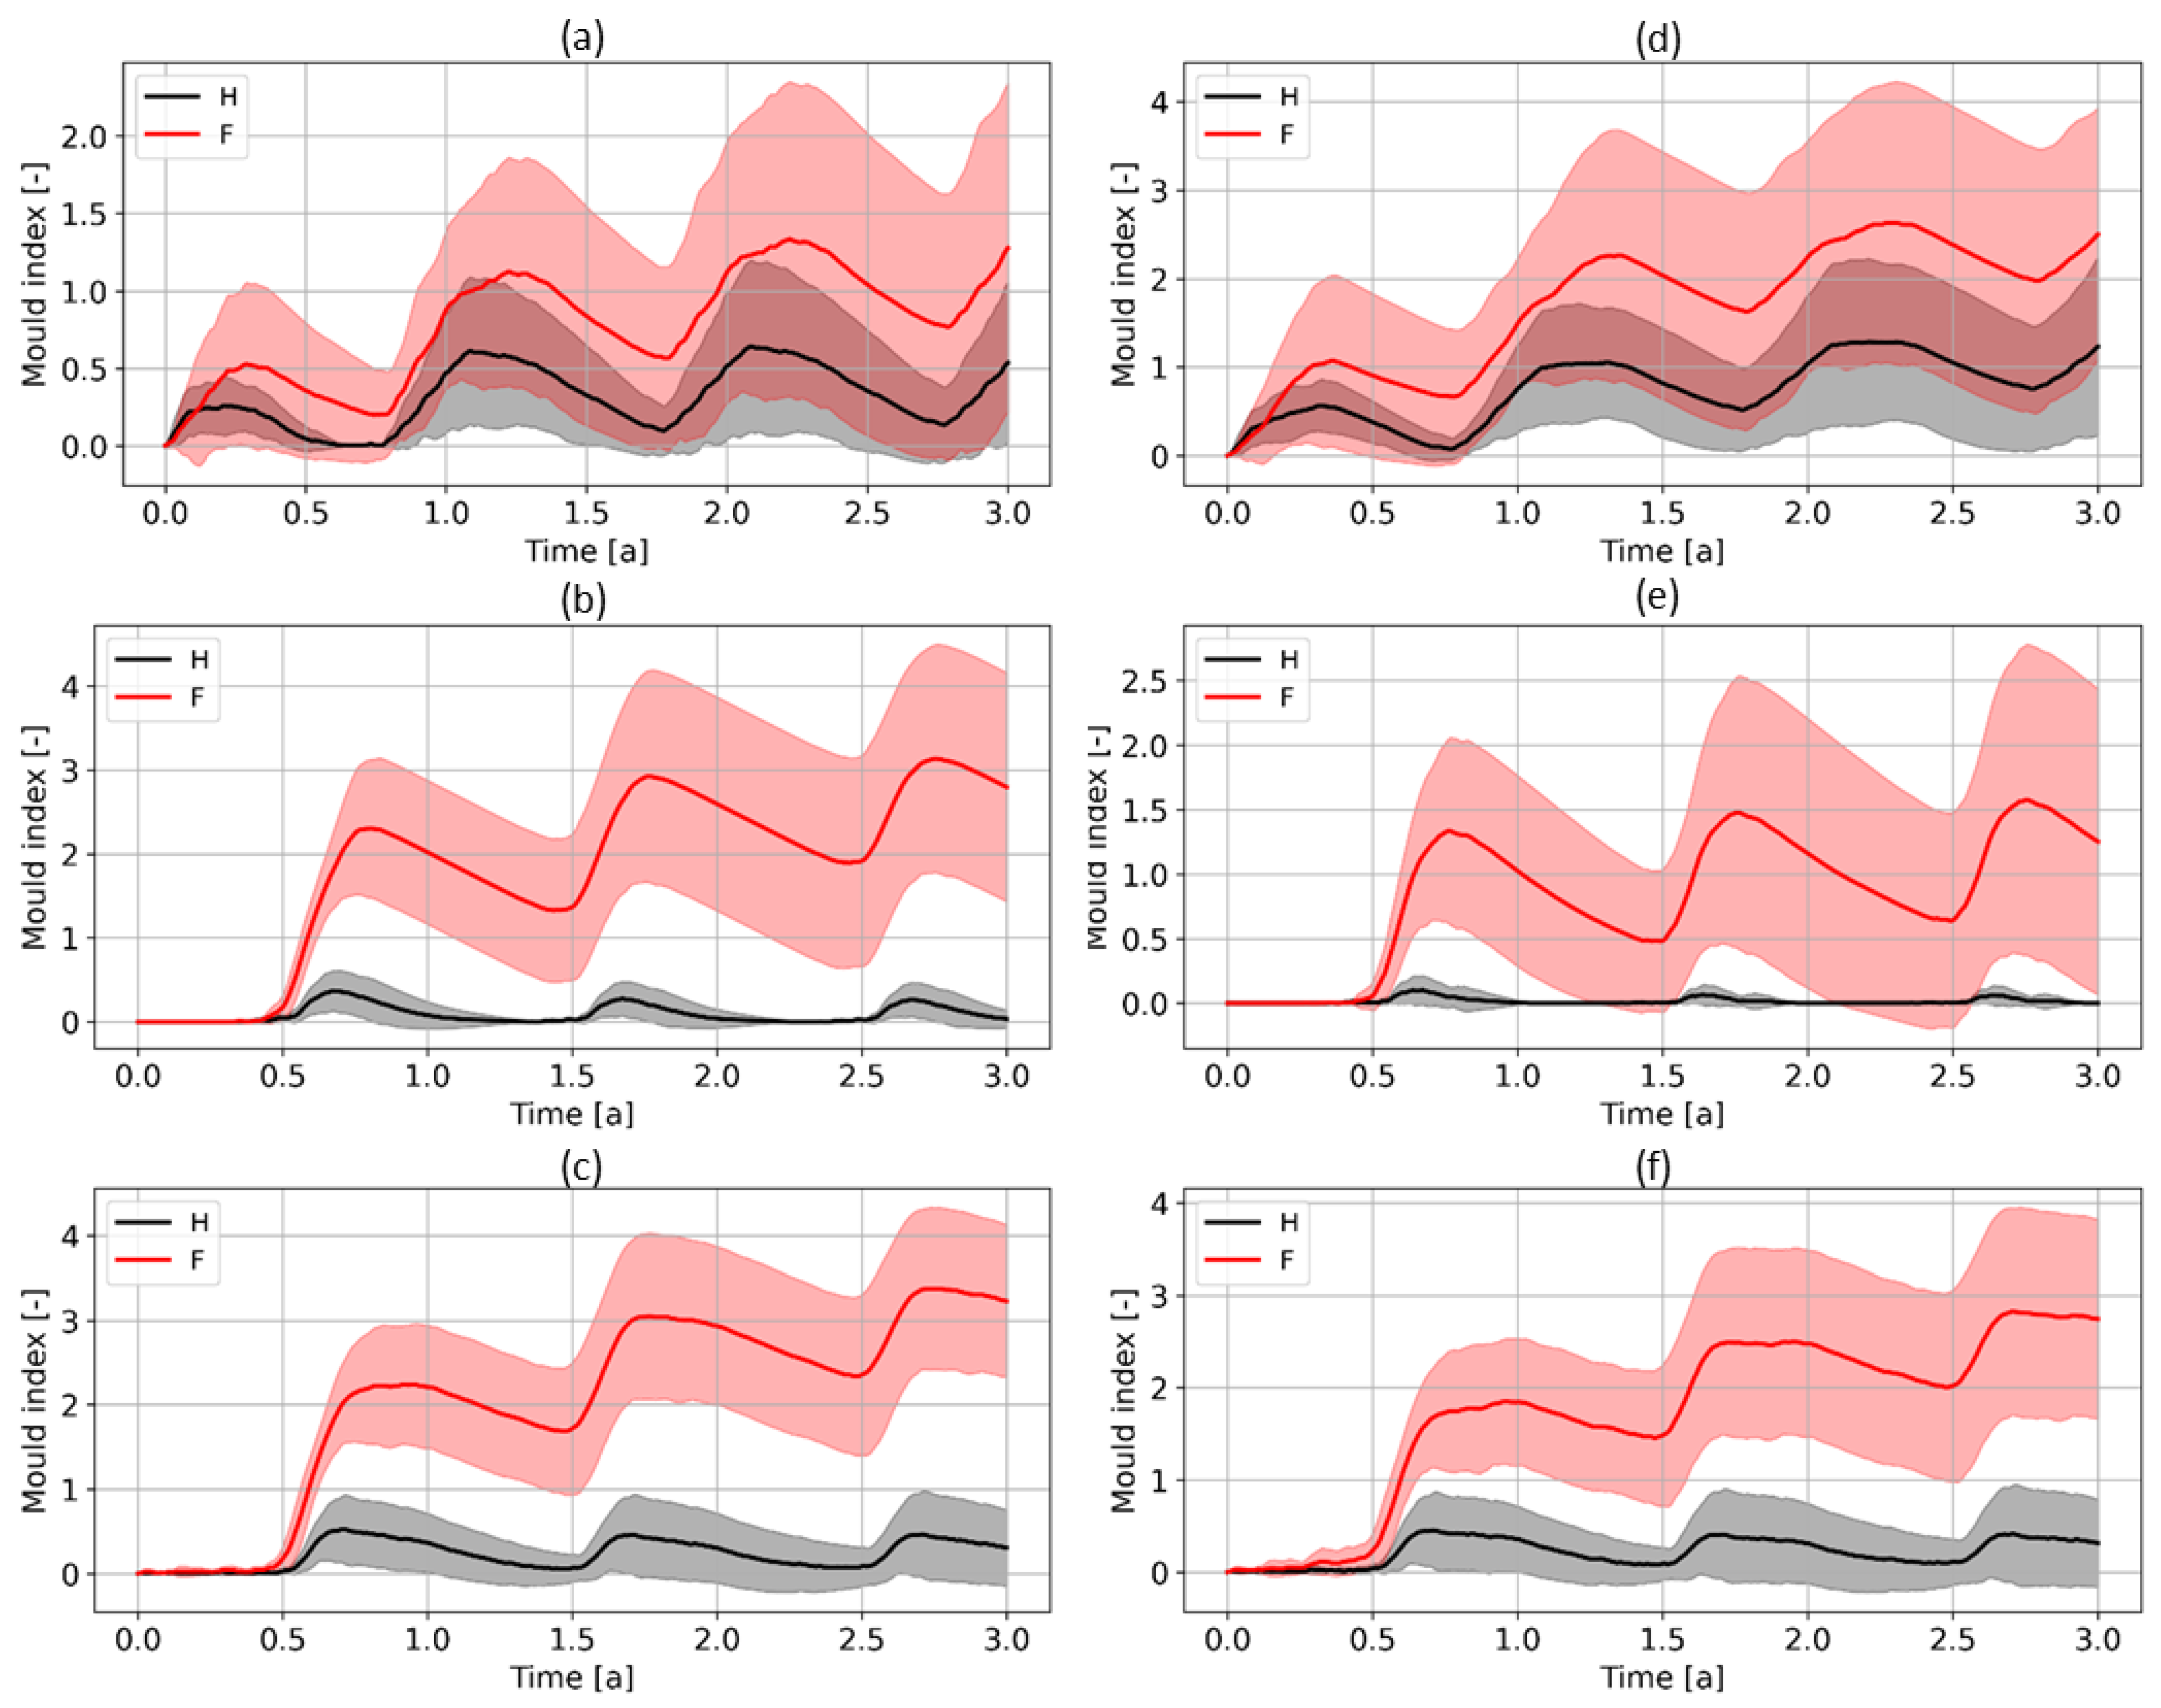
3.1. Mold Growth Index

Figure 8 shows, for illustration purposes, an example of mold growth profiles obtained for the 15 runs of historical and future periods in Vancouver for the two types of cladding evaluated and for the case with a moisture source. It shows the variability among different runs within each time period, with greater variability for the future period due to greater uncertainties in climate data.
From the mold growth profiles, the mean value for the last repetition of the test year of each run was determined. The results for the two types of wall assembly under historical (H) and future (F) periods are shown in Figure 9 for the cases with and without moisture source and for vented and ventilated claddings.
When the wall is considered perfect, i.e., with no deficiencies in the building envelope that may allow incidental water to infiltrate deeper into the structure, the risk of mold growth is minimal under both historical and future periods for the two claddings and for the vented and ventilated designs. Fiber cement board shows some signs of mold growth in the future in the southeastern and east maritime regions, but their values remain less than one for almost all the climate realizations. Given that the effects of climate change are limited for the wall with no deficiencies, the remaining analysis will be focused on the scenario where a water penetration rate equal to 1%WDR is assumed.

3.2. Effects of Climate Change on Mold Growth Risk

The statistics (minimum, median, and maximum) of mold growth index obtained for FCB and ACM claddings under historical and future periods and for the scenario considering a moisture source of 1%WDR are shown in Table 4 and Table 5, respectively. Also shown in Table 4 and Table 5 are the projected changes in the mold growth index and the results of the Student t-test performed to compare the means of the historical and future periods’ values. Before performing the t-test, the data were transformed using Yeo-Johnson power transformation [51] implemented in the Scikit-learn package [52] of Python [53] to make the data more Gaussian-like. As well, to account for the unequal variances in the H and F data, Welch’s unequal variance t-test [54] was used. All the tests were realized using the SciPy package [55] of Python. Overall, the means of the 15 climate realizations under the H and F periods are significantly different in all cities (p < 0.05). However, the relative changes in mold growth index vary with climate region, among the cities in the same region, and with the cladding type and ventilation design.
In Cordillera (Whitehorse) and Prairie (Calgary, Winnipeg, and Saskatoon) regions, the increase in the mold growth index in the future for the two claddings and ventilation designs, although statistically significant, is not enough to change the risk to an unacceptable level. In fact, with the exception of one run having a mean value of 1.1 in the future in Winnipeg in the case of FCB with a vented cavity, all the run mean values in the future remain below 1.0. These two regions have the lowest values of WDR and vapor pressure, and their increase in the future would not be enough to change the mold growth risk level as observed in the historical period.
In Vancouver (western maritime), the risk level could significantly increase for FCB and ACM in the future. The increase in the risk depends on the cladding type and the ventilation rate. For the vented cavity, the increase in the median and maximum values is 0.9 and 1.9 for FCB, respectively, whereas it is 1.3 and 1.8 for ACM, respectively. At the same time, the number of runs with mean MoI > 1 increases by 6 and 2 for FCB and ACM, respectively (Table 4 and Table 5). Therefore, it can be concluded that, compared to the baseline period, the increase in mean MoI for the vented FCB is less than that for the vented ACM, even if the increase in the number of runs having MoI > 1 is higher for FCB than ACM. It should be noted that the absolute values of mean MoI are higher for ACM than for FCB. This can be attributed to the impermeability to vapor and water of ACM: it can dry only via ventilation openings.
For the ventilated cavity in Vancouver, the increase in the median and maximum values are, respectively, 0.5 and 1.5 for FCB and 0.3 and 1.1 for ACM. Table 4 and Table 5 also show that the increase in the number of runs with mean MoI > 1 is 3 and 2 for FCB and ACM, respectively. As such, the effect of climate change is attenuated by the increased ventilation in this region for both walls, although the relative increase in the mold growth index is less for ACM than for FCB.
As shown in Figure 9, Table 4 and Table 5, there is a great difference in the moisture response of the two claddings to climate change among the cities in the southeastern region (Toronto, Ottawa, and Montreal). For the vented cavity, the median and maximum values of MoI increase by 0.5 and 1.7, 1.4 and 3.2, and 3.0 and 3.8 for FCB in Toronto, Ottawa, and Montreal, respectively, whereas they increase by 0.2 and 0.8, 0.3 and 1.4, and 0.8 and 3.6 for ACM in the same cities, respectively. The increase in the number of runs having a mean MoI > 1 is 6, 11, and 12 for FCB and 0, 1, and 6 for ACM in these three cities, respectively. Toronto, Ottawa, and Montreal all belong to the same climate region but to different climate zones: Toronto is in climate zone 5 with a current design MI equal to 0.90, while Ottawa and Montreal belong to climate zone 6 with a current design MI of 0.80 and 0.90, respectively. They have an almost similar amount of annual WDR (Figure 4). The difference in the moisture response between Toronto and that of Ottawa and Montreal may be attributed to the difference in the insulation thickness (vapor permeance). The thickness of insulation considered in this study was 74 mm in Toronto and 89 mm in Ottawa and Montreal, based on the National Model Code requirements for each climate zone.
Additionally, in this region, the effect of climate change on the vented cavity scenario is more pronounced for ACM than for FCB. For the ventilated cavity, the increase in the number of runs having a mean MoI greater than 1 is 2, 6, and 10 for FCB and 0, 1, and 5 for ACM. As such, the ventilation has less effect in reducing the risk to mold growth in Montreal than in Toronto and Ottawa for FCB, perhaps due to the relatively high increase in WDR in Montreal (Table 3). Overall, the increase in mold growth index in this region, especially for FCB cladding, could be problematic in the future.
In eastern maritime, there are two distinct groups of cities that behave differently: group 1, composed of Moncton, Charlottetown, and St. John’s, and group 2, composed of Halifax. In group 1, for the vented cavity scenario, the maximum increase in mean MoI is found in Moncton. In this city, the relative increase in the median and maximum values of the mean MoI is for FCB 0.8 and 3.4, respectively, and for ACM 0.5 and 2.3, respectively. In terms of the increase in the number of runs having a mean MoI > 1, the relative increase in the mean MoI in Charlottetown for FCB and ACM, in St. John’s for FCB, and in Moncton for ACM is not of big concern given the limited number of climate realizations having the mean MoI greater than 1 (less than 20%). On the contrary, the relative increase may be problematic in Moncton for FCB and in St. John’s for ACM, where the increase in the number of runs having a mean MoI > 1 is 47% and 33%, respectively.
For ventilated cavity in group 1, the effect of climate change is less pronounced. Here too, the largest increase is found in the city of Moncton, which is for FCB 0.6, 2.8, and 4 for the median, maximum MoI, and the number of runs having MoI > 1, respectively, and for ACM, 0.4, 2.1 and 3, respectively. As such, similar to cities in the southeastern region, the ACM cladding performs better than FCB cladding. It is difficult to explain the different behavior of the wall in Moncton and Charlottetown. Moncton has less annual WDR than Charlottetown (Figure 4). As such, one would have expected a better performance in Moncton than in Charlottetown. It is likely that the higher relative humidity (higher vapor pressure) in Moncton limits the drying capability of air entering the cavity via the vent openings. As for the difference between Moncton and St. John’s, the high wind speed and, therefore, higher ACH in St. John’s could explain the better performance in St. John’s, despite its higher levels of WDR and relative humidity.
Halifax has a singular behavior. It is the city with walls most at risk in this eastern maritime. In fact, for the vented wall, the increase in the median, maximum, and the number of runs having MoI > 1 for FCB is 2.9, 2.6, and 14, respectively, and for ACM, 2.3, 2.5, and 13, respectively. The ventilation seems to have less effect as the increase in the median, maximum, and the number of runs having MoI > 1 is similar to those of the wall with a vented cavity. The limited effect of ventilation in Halifax suggests that in this city, other measures than ventilation to mitigate the effect of climate change should be considered (i.e., measures that limit the amount of WDR impinging on the wall).
WDR is slightly less in Halifax than in St. John’s and is almost at the same level as in Vancouver (Figure 4). The difference between Halifax and Vancouver can be attributed to the lower level of relative humidity (higher drying capacity of the air) coupled with low insulation thickness in Vancouver. St. John’s has higher relative humidity and wind speed (Figure 3) and WDR (Figure 4) values. On the opposite, Halifax has a higher temperature, outdoor vapor pressure, and global radiation (Figure 3). The complex interaction between these climate variables and the wall makes it quite difficult to find the explanation for the significant difference in moisture response between Halifax and St. John’s. However, it is likely that the higher outdoor vapor pressure might have contributed to maintaining higher relative humidity in the wall and that the higher temperature might have promoted mold growth development in Halifax.
The findings in this study are consistent with those reported in the literature in regard to the effects of climate change on the moisture performance of the building envelope [4,8,11]. The risk of moisture accumulation in the wall and mold growth could increase in the future; however, as might be expected, there are considerable differences in the results induced, on one side, by the local climate and its uncertainties, and on another side by the configuration of the wall assemblies, their components, and properties. The individual and combined effects of climate variables and their complex interactions with building envelope require the assessment of each specific case to avoid generalization.

4. Conclusions

This study investigated the effects of climate change on the moisture performance of cross-laminated timber (CLT) wall assemblies used in tall wood buildings in several regions across Canada using hygrothermal simulations. For the building, wall assemblies, and simulation parameters considered, several conclusions can be drawn.
CLT wall assemblies with either a vented or ventilated cavity, but no deficiencies (i.e., perfect wall), seemed to be resilient to climate change as the risk of mold growth in both the historical and the future was nil or negligible.
For those building enclosures having deficiencies that allow rainwater to penetrate into the structure, the mold growth risk could increase significantly in all climatic regions and cities considered. However, in the cities located in the Cordillera and Prairie regions, the increase may not be problematic as mold growth was generally less than an unacceptable level of growth. For cities located in the coastal and southeastern regions, the increase in mold growth risk may be considerable. For walls with a vented drainage cavity, the relative change in mold growth risk (change in median and maximum values of the 15 runs) for fiber cement board (FCB, water, and vapor permeable) cladding was less than that for aluminum composite material (ACM, impermeable) cladding in Vancouver. However, for cities in the southeastern and eastern Maritime region, the relative increase was higher for FCB cladding than ACM cladding. For walls with a ventilated drainage cavity, the relative increase in mold growth index was higher for FCB cladding than ACM cladding. The impact of increasing the airflow rate in the drainage cavity on the reduction of the relative change of mold growth index was more efficient in Vancouver but less efficient in the southeastern and eastern Maritime regions for both claddings. This suggests that the 19-mm ventilated drainage cavity, as used in this study, may not be sufficient to attenuate the effects of climate change in the southeastern and eastern Maritime regions. Other measures would need to be taken to mitigate the risk to mold growth, such as increasing the cavity depth, or those measures that are intended to reduce the amount of wind-driven rain should be considered. The impact and feasibility of such measures will be evaluated in future studies. As well, the results found in this study could be further improved by considering the variability in material properties or other uncertainties in the simulation input parameters using stochastic simulation.

Author Contributions

Conceptualization, M.D. and M.A.L.; Air change rate calculation, L.W.; Simulations and data analysis, M.D.; Writing, M.D.; Review, M.A.L., L.W. and T.V.M. All authors have read and agreed to the published version of the manuscript.

Funding

This research was funded by Infrastructure Canada and Codes Canada in support of the Pan-Canadian Framework on Clean Growth and Climate Change and the further development of the National Building Code of Canada under Agreement no. A1-018006.

Informed Consent Statement

Not applicable.

Data Availability Statement

Climate data used in this study were obtained from Gaur, A.; Lacasse, M.; Armstrong, M. Climate Data to Undertake Hygrothermal and Whole Building Simulations Under Projected Climate Change Influences for 11 Canadian Cities. Data 2019, 4(2), 72 and are available online at https://www.mdpi.com/2306-5729/4/2/72/s1, File: data-498712_supplementary material.docx. Material properties data were obtained from Kumaran et al. (2002) and are available in Kumaran, M.K.; Lackey, J.C.; Normandin, N.; Tariku, F.; van Reenen, D. A Thermal and Moisture Transport Property Database for Common Building and Insulating Materials: Final Report from ASHRAE Research Project 1018-RP. American Society of Heating, Refrigerating and Air-Conditioning Engineers, Inc.: Atlanta, GA, USA, 2002. Data obtained from simulations in this study are available on request from the corresponding authors.

Acknowledgments

The authors would like to thank Abhishek Gaur for providing the climate data.

Conflicts of Interest

The authors declare no conflict of interest.

Abbreviations

1-DOne-dimensional
ACMAluminum composite material
ACHAir change per hour
CALCalgary
CLTCross-Laminated Timber
CTNCharlottetown
DRWPDriving rain wind pressure
EMCEquilibrium moisture content
FFuture
FCBFiber cement board
HHistorical
HDDHeating-degree-days
HFXHalifax
MIMoisture index
MoIMold growth index
MSMoisture source
MTLMontreal
MTNMoncton
OTTOttawa
RClimate run or realization
RCPRepresentative Concentration Pathway
RHRelative humidity
SBPOSpun bonded polyolefin
SKTSaskatoon
STJSt. John’s
TORToronto
VWind speed
VANVancouver
WDRWind-driven rain
WHEWhitehorse
WNGWinnipeg
WRBWeather resistive barrier

References

  1. IPCC Climate Change 2021: The Physical Science Basis; Contribution of Working Group I to the Sixth Assessment Report of the Intergovernmental Panel on Climate Change; Cambridge University Press: Cambridge, UK; New York, NY, USA, 2021; p. 2391.
  2. Bizikova, L.; Neale, T.; Burton, I. Canadian Communities’ Guidebook for Adaptation to Climate Change; Environment Canada: Ottawa, ON, Canada, 2009. [Google Scholar]
  3. Nijland, T.G.; Adan, O.C.; Van Hees, R.P.; van Etten, B.D. Evaluation of the effects of expected climate change on the durability of building materials with suggestions for adaptation. Heron 2009, 54, 37–48. [Google Scholar]
  4. Nick, V.; Mundt-Petersen, S.; Kalagasidis, A.; De Wilde, P. Future moisture loads for buildings facades in Sweden: Climate change and wind-driven rain. Build. Environ. 2015, 93, 362–375. [Google Scholar] [CrossRef]
  5. Sehizadeh, A.; Ge, H. Impacts of future climates on the durability of typical residential wall assemblies retroffited to the PassiveHaus for Eastern Canada region. Build. Environ. 2016, 97, 111–125. [Google Scholar] [CrossRef]
  6. Bylund Melin, C.; Hagentoft, C.E.; Holl, K.; Nik, V.M.; Kilian, R. Simulations of moisture gradients in wood subjected to changes in relative humidity and temperature due to climate change. Geosciences 2018, 8, 378. [Google Scholar] [CrossRef] [Green Version]
  7. Hayles, C.; Huddleston, M.; Chinoowsky, P.; Helman, J. Quantifying the effects of projected climate change on the durability and service life of housing in Wales, UK. Buildings 2022, 12, 184. [Google Scholar] [CrossRef]
  8. Vandemeulebroucke, I.; Kotova, L.; Caluwaerts, S.; Van Den Bossche, N. Degradation of brick masonry walls in Europe and the Mediterranean: Advantages of response-based analysis to study climate change. Build. Environ. 2023, 230, 109963. [Google Scholar] [CrossRef]
  9. Chang, S.; Wi, S.; Kang, Y.; Kim, S. Moisture risk assessment of cross-laminated timber walls: Perspectives on climate conditions and water vapor resistance performance of building materials. Build. Environ. 2020, 168, 106502. [Google Scholar] [CrossRef]
  10. Chang, S.J.; Yoo, J.; Wi, S.; Kim, S. Numerical analysis on the hygrothermal behavior of building envelope according to CLT wall assembly considering the hygrothermal-environmental zone in Korea. Environ. Res. 2020, 191, 110198. [Google Scholar] [CrossRef]
  11. Chang, S.; Kang, Y.; Yun, B.; Yang, S.; Kim, S. Assessment of effect of climate change on hygrothermal performance of cross-laminated timber building envelope with modular construction. Case Stud. Therm. Eng. 2021, 28, 101703. [Google Scholar]
  12. Defo, M.; Lacasse, M. Effects of Climate Change on the Moisture Performance of Tallwood Building Envelope. Buildings 2021, 11, 35. [Google Scholar] [CrossRef]
  13. NEBC National Energy Code of Canada for Buildings; National Research Council of Canada: Ottawa, ON, Canada, 2020.
  14. NBCC National Building Code of Canada; National Research Council of Canada: Ottawa, ON, Canada, 2020.
  15. Cornick, S.; Dalgliesh, W.A. A moisture index approach to characterizing climates for moisture management of building envelopes. In Proceedings of the 9th Canadian Conference on Building Science and Technology, Vancouver, BC, Canada, 27–28 February 2003. [Google Scholar]
  16. Glass, S.; Wang, J.; Easley, S.; Finch, G. Building enclosure design for cross-laminated timber construction. In CLT Handbook: Cross-Laminated Timber; U.S. Edition Special publication SP-529E; Karacabeyli, E., Douglas, B., Eds.; FPInnovations: Ponte-Claire, QC, Canada, 2013; pp. 393–441. [Google Scholar]
  17. Nordic Structures, Nordic Engineered Wood. In Non-Residential Design; Construction Guide, Nordic X-Lam; Nordic Structures: Montreal, QC, Canada, 2015.
  18. Finch, G.; Wang, J. Building enclosure design design of cross-laminated timber construction. In Canadian CLT Handbook; Special Publication SP-532E; Karacabeyli, E., Gagon, S., Eds.; FPInnovations: Pointe Claire, QC, Canada, 2019; pp. 517–581. [Google Scholar]
  19. 3A Composites USA Inc. Available online: https://d371dyuip757b1.cloudfront.net/downloads/ALUCOBOND%20PLUS%20-%20Tech%20Data%20sheet%20(12.21).pdf (accessed on 10 February 2022).
  20. Kumaran, M.K.; Lackey, J.C.; Normandin, N.; Tariku, F.; van Reenen, D. A thermal and moisture transport property database for common building and insulation materials. In Final Report from ASHRAE Research Project 1018-RP; ASHRAE: Atlanta, Georgia, 2002. [Google Scholar]
  21. AlSayegh, G. Hygrothermal Properties of Cross-Laminated Timber and Moisture Response of Wood at High Relative Humidity. Ph.D. Thesis, Carleton University, Ottawa, ON, Canada, 2012. [Google Scholar]
  22. IPCC Climate Change 2014: Synthesis Report; Contribution of Working Groups I, II and III to the Fifth Assessment Report of the Intergovernmental Panel on Climate Change; Team, C.W.; Pachauri, R.; Meyer, L. (Eds.) IPCC: Geneva, Switzerland, 2014; p. 151. [Google Scholar]
  23. Gaur, A.; Lacasse, M.; Armstrong, M. Climate data to undertake hygrothermal and whole building simulations under projected climate change influences for 11 Canadian cities. Data 2019, 4, 72. [Google Scholar] [CrossRef] [Green Version]
  24. ASHRAE ASHRAE Standard 160-2016; Criteria for Moisture-Control Design Analysis in Buildings. ASHRAE: Atlanta, Georgia, 2016.
  25. Nath, D. U.K. Field Measurements of Wind-Driven Rain on Mid- and High-Rise Buildings in Two Canadian Regions. Ph.D. Thesis, Concordia University, Montreal, QC, Canada, 2015. [Google Scholar]
  26. Sontag, L.; Nicolai, A.; Vogelsang, S. Validierung der Solverimplementierung des Hygrothermischen Simulationsprogramms Delphin; Institute of Building Climatology (TU Dresden): Dresden, Germany, 2013. [Google Scholar]
  27. Langmans, J.; Nicolai, A.; Klein, R.; Roels, S. A quasi-steady state implementation of air convection in a transient heat and moisture building component model. Build. Environ. 2012, 58, 208–218. [Google Scholar] [CrossRef]
  28. Vogelsang, S.; Kehl, D.; Ruisinger, U.; Meissner, F. Three-dimensional HAM Transport in Timber Beam Ends–Measurements and Simulation. In Proceedings of the 5th German-Austrian Conference of the International Building Performance Simulation Association (IBPSA), Aachen, Germany, 22–24 September 2014. [Google Scholar]
  29. Hejazi, B.; Sakiyama, N.R.; Frick, J.; Garrecht, H. Hygrothermal Simulations Comparative Study: Assessment of Different Materials Using WUFI and DELPHIN Software. In Proceedings of the 16th IBPSA International Conference, Rome, Italy, 2–4 September 2019. [Google Scholar]
  30. Ruisinger, U.; Kautsch, P. Comparison of hygrothermal 2D- and 3D-simulation results with measurements from a test house. In E3S Web of Conferences; EDP Sciences, P.A. de Courtaboeuf, France: Les Ulis, France, 2020; Volume 172, p. 08004. [Google Scholar]
  31. Janssens, A. Reliability Control of Interstitial Condensation in Lightweight Roof Systems. Calculation and Assessment Methods. Ph.D. Thesis, KU Leuven, Leuven, Belgium, 1998. [Google Scholar]
  32. Nicolai, A. Modeling and Numerical Simulation of Salt Transport and Phase Transitions in Unsaturated Porous Building Materials. Ph.D. Thesis, Syracuse University, New York, NY, USA, 2008. [Google Scholar]
  33. Langmans, L. Feasibility of Exterior Air Barriers in Timber Frame Construction. Ph.D. Thesis, KU Leuven, Leuven, Belgium, 2013. [Google Scholar]
  34. Nicolai, A.; Grunewald, J. DELPHIN 5 User Manual and Program Reference; Institute for Building Climatology/University of Technology Dresden (TUD): Dresden, Germany, 2014. [Google Scholar]
  35. Candenedo, L.; Derome, D.; Fazio, P.; Ge, H. Analysis of Montreal 30-year weather data to select loading conditions for large-scale tests on wall panels. In Proceedings of the 3th International Building Physics Conference, Montreal, QC, Canada, 27–31 August 2006. [Google Scholar]
  36. Salonvaara, M.; Sedlbauer, K.; Holm, A.; Pazera, M. Effect of selected weather year for hygrothermal analyses. In Proceedings of the Thermal Performance of the Exterior Envelopes of Whole Buildings XI Conference, Clearwater Beach, FL, USA, 5–9 December 2010. [Google Scholar]
  37. Zhou, X.; Derome, D.; Carmeliet, J. Robust moisture reference year methodology for hygrothermal simulations. Build. Environ. 2016, 110, 23–35. [Google Scholar] [CrossRef]
  38. Barreira, E.; Simões, M.L.; Delgado, J.M.P.Q.; Sousa, I. Procedures in the construction of a test reference year for Porto-Portugal and implications for hygrothermal simulation. Sustain. Cities Soc. 2017, 32, 397–410. [Google Scholar] [CrossRef]
  39. Lacasse, M.A.; Ge, H.; Hegel, M.; Jutras, R.; Laouadi, A.; Sturgeon, G.; Wells, J. Guideline on Design for Durability of Building Envelopes, CRBCPI-Y2-R19; National Research Council Canada: Ottawa, ON, Canada, 2018. [Google Scholar]
  40. Straube, J.; Burnett, E. Vents, Ventilation Drying, and Pressure Moderation; CMHC: Ottawa, ON, Canada, 1995. [Google Scholar]
  41. Straube, J.; Finch, G. Ventilated Wall Claddings: Review, Field Performance, and Hygrothermal Modelling Research Report-0907; Building Science Press: San Raphael, CA, USA, 2009. [Google Scholar]
  42. Defo, M.; Wang, L.; Lacasse, M. Evaluation of the Durability and Resilience of Wall Assemblies to Climate Change Using Hygrothermal Simulations RR NRCC-CONST-56534E; NRC: Ottawa, ON, Canada, 2021. [Google Scholar]
  43. Henninger, J.H. Solar Absorbance and Thermal Emittance of Some Common Space Craft Thermal-Control Coatings RP-1121; NASA: Washington, DC, USA, 1984. [Google Scholar]
  44. ISO 15927-3; Hygrothermal Performance of Buildings—Calculation and Presentation of Climatic Data. International Organization for Standardization. ISO: Geneva, Switzerland, 2009.
  45. Incropera, F.P.; DeWitt, D.P. Fundamentals of Heat and Mass Transfer, 4th ed.; John Wiley and Sons: New York, NY, USA, 1996. [Google Scholar]
  46. Wang, J.Y.; Stirling, R.; Paul, I.; Morris, A.; Taylor, J.; Lloyd, G.; Kirker, S.; Lebow, M.; Mankowski, H.; Barnes, M.; et al. Durability of mass timber structures: A review of the biological risks. Wood Fiber. Sci. 2018, 50, 110–127. [Google Scholar] [CrossRef] [Green Version]
  47. Viitanen, H.A.; Ritschkoff, A. Mould Growth in Pine and Spruce Sapwood in Relation to Air Humidity and Temperature; The Swedish University of Agricultural Sciences, Dept. of Forest Products: Uppsala, Sweden, 1991. [Google Scholar]
  48. Viitanen, H.A. Modelling the time factor in the development of mould fungi—The effect of critical humidity and temperature conditions on pine and spruce sapwood. Holzforshung 1997, 51, 6–14. [Google Scholar] [CrossRef]
  49. Hukka, A.; Viitanen, H.A. A mathematical model of mould growth on wooden material. Wood Sci. Technol. 1999, 33, 475–485. [Google Scholar] [CrossRef]
  50. Ojanen, T.; Viitanen, H.; Peuhkuri, R.; Lâhdesmäki, K.; Vinha, J.; Salminen, K. Mold growth modeling of building structures using sensitivity classes of materials. In Proceedings of the Thermal Performance of the Exterior Envelopes of Whole Building XI Conference, Clearwater Beach, FL, USA, 5–9 December 2010. [Google Scholar]
  51. Yeo, I.; Johnson, R. A new family of power transformations to improve normality or symmetry. Biometrika 2000, 87, 954–959. [Google Scholar] [CrossRef]
  52. Pedregosa, F.; Varoquaux, G.; Gramfort, A.; Michel, V.; Thirion, B.; Grisel, O.; Blondel, M.; Prettenhofer, P.; Weiss, R.; Dubourg, V.; et al. Scikit-learn: Machine Learning in Python. J. Mach. Learn. Res. 2011, 12, 2825–2830. [Google Scholar]
  53. Van Rossum, G.; Drake, F.L. Python 3 Reference Manual; CreateSpace: Scotts Valley, CA, USA, 2009. [Google Scholar]
  54. Welch, B.L. The generalization of "Student’s" problem when several different population variances are involved. Biometrika 1947, 34, 28–35. [Google Scholar] [CrossRef]
  55. Virtanen, P.; Gommers, R.; Oliphant, T.E.; Haberland, M.; Reddy, T.; Cournapeau, D.; Burovski, E.; Peterson, P.; Weckesser, W.; Bright, J.; et al. SciPy 1.0: Fundamental Algorithms for Scientific Computing in Python. Nat. Methods 2000, 17, 261–272. [Google Scholar] [CrossRef] [PubMed] [Green Version]
Figure 1. One dimensional configuration of the cross-laminated timber wall investigated in this study.
Forests 14 00718 g001
Figure 2. Boxplots of the annual average temperature (a), relative humidity (b) and wind speed (d), and annual sum of horizontal rain (c) for the 15 runs of historical (H) and future (F) time-periods in the city of Vancouver.
Forests 14 00718 g002
Figure 3. Boxplots of the run means of the yearly mean values of temperature (a), relative humidity (c), wind speed (d), and partial vapor pressure (f), and yearly sums of horizontal rain (e) and global radiation (b) for historical (H) and future (F) time-periods in the 12 cities studied. For each city, the left and right boxes are H and F, respectively.
Forests 14 00718 g003
Figure 4. Boxplots of the run means of the yearly sums of wind-driven rain for historical (H) and future (F) time-periods in the 12 cities studied.
Forests 14 00718 g004
Figure 5. One-dimensional geometry of CLT wall assembly showing the location where the moisture source was applied (outer grid of weather-resistive barrier—WRB), the critical position for performance evaluation (outer grid of CLT panel), and the meshing. Different layers are colored for clarity. Grids are not to scale.
Forests 14 00718 g005
Figure 6. Boxplots of wall orientation for historical (H) and future periods (F). Each box shows the variation of wall orientations obtained with the test year for the 15 climate realizations in each time period.
Forests 14 00718 g006
Figure 7. Boxplots of the median hourly values of air change per hour (ACH) for historical (H) and future periods (F): (a) FCB, vented; (b) FCB ventilated; (c) ACM vented and (d) ACM ventilated. Each box shows the variation of ACH values obtained with the test year for the 15 climate realizations in each time period.
Forests 14 00718 g007
Figure 8. Examples of mold growth index profiles obtained for the vented design over the three repetitions of the test year for fiber cement board (FCB) and aluminum composite material (ACM) claddings when a moisture source (MS) of 1% was considered: (a) FCB, Vancouver; (b) FCB, Montreal; (c) FCB, Halifax; (d) ACM, Vancouver; (e) ACM, Montreal; (f) ACM, Halifax. The black and red lines represent the average of the 15 realizations of historical and future periods, respectively, whereas the area represents +/− 1 standard deviation. Hourly values were daily averaged.
Forests 14 00718 g008
Figure 9. Boxplots of the mean values of mold growth indices on the outer surface of CLT panel obtained for fiber cement (FCB: (a,b,e,f)) and aluminum composite material (ACM: (c,d,g,h)) walls under historical (H) and future (F) periods, for vented (ad) and ventilated (eh) cladding and for the case with (b,d,f,h) and without (a,c,e,g) moisture source (MS).
Forests 14 00718 g009
Table 1. Geographical location and climate design data for the selected cities.
City (Province)Lat.Long.TimeClimateCZ 1KC 2HDD 3RSI 4MI 5RainDRWP 6
(o)(o)ZoneRegion (m2 K/W) (mm)(Pa, 1/5)
Whitehorse (YT)60.71−135.07−8.0Cordillera7BDfc65805.260.5017040
Vancouver (BC)49.19−123.18−8.0Western maritime4Csb28003.451.201070160
Calgary (AB)51.11−114.02−7.0Prairie7ADfb50004.650.40325220
Saskatoon (SK)52.17−106.70−6.0Prairie7ADfb57004.650.40265160
Winnipeg (MB)49.91−97.24−6.0Prairie7ADfb56704.650.60415180
Toronto (ON) 743.63−79.39−5.0Southeastern5Dfb35203.770.90720160
Ottawa (ON)45.32−75.67−5.0Southeastern6Dfb45004.170.80750160
Montreal (QC) 845.47−73.74−5.0Southeastern6Dfb44004.170.90760180
Moncton (NB)46.11−64.68−4.0Eastern maritime6Dfb46804.171.00850220
Charlottetown (PE)46.29−63.12−4.0Eastern maritime6Dfb44604.171.10900350
Halifax (NS)44.88−63.51−4.0Eastern maritime6Dfb40004.171.501350280
St.-John’s (NL)47.62−52.75−4.0Eastern maritime6Dfb48004.171.401200400
1 CZ: climate zone. 2 KC: Köppen climate type (Dfc = Subarctic, Dfb = Warm-summer humid continental, Csb = warm-summer Mediterranean). 3 HDD: Heating Degree-Days. 4 RSI: thermal resistance (m2 K/W). 5 MI: moisture index. 6 DRWP: driving rain wind pressure. 7 City center. 8 Dorval airport.
Table 2. Basic properties of materials used.
ComponenteDensitylPorosityEMC (%)Vapor Permeance (ng/m2sPa)A
Material(mm)(kg/m3)(W/mK)(m3/m3)50%RH80%RH95%RH10%RH50%RH90%RH(kg/m2s0.5)
Cladding
Regular Portland stucco1919600.4070.243.555.277.6330.694.7160.50.01230
ACM419000.440--------
Fibre cement7.913800.2500.485.3012.0024.0026.6206.318990.02500
Rainscreen
Air191.2040.0261.00---10,00010,00010,000-
Insulation
Mineral wool64370.0320.920.0030.0070.008204720472047-
76370.0320.920.0030.0070.008172417241724-
89370.0320.920.0030.0070.008147214721472-
114370.0320.920.0030.0070.008114911491149-
WRB
SBPO0.154640.2480.010.010.050.14080408040800.00031
CLT105
Spruce354000.0940.7511.021.027.010.889.4842.90.00220
Glue line44000.0940.7511.021.027.047.1391.336880.00220
Service cavity
Air501.2040.2781.00---10,000380010,000-
Interior sheathing
Gypsum15.97000.1600.49.010.713.085.5319.213020.00190
e: thickness (mm); λ: thermal conductivity at dry state; EMC: equilibrium moisture content; ACM: aluminium composite material; WRB: weather resistive barrier; -: no data; SBPO: Spun bonded polyolefin.
Table 3. Summary statistics and projected change in annual sum of wind-driven rain (ton/m2).
HistoricalFuture% Change
RegionCityMinMedianMaxMinMedianMaxMinMedianMax
CordilleraWHE0.140.160.190.230.270.3161.467.257.8
Western maritimeVAN1.311.331.381.261.361.51−3.81.79.4
PrairieCAL0.320.360.440.340.440.567.221.629.4
PrairieSKT0.240.290.320.250.320.412.010.128.4
PrairieWNG0.270.330.360.290.370.448.611.621.0
SoutheasternTOR0.470.530.560.500.560.655.05.316.1
SoutheasternOTT0.440.460.480.500.530.5913.315.820.9
SoutheasternMTL0.450.500.570.540.620.6718.723.017.5
Eastern maritimeMTN0.630.670.700.750.800.9019.118.928.6
Eastern maritimeCTN0.700.760.850.830.900.9718.119.215.0
Eastern maritimeHFX1.341.411.531.341.441.620.42.66.0
Eastern maritimeSTJ1.501.661.771.541.701.932.12.69.0
Table 4. Summary statistics and projected changes in mold growth index in the case of fiber cement cladding with a moisture source of 1%.
H: 1986–2016F: 2062–2092F–H 3t-Test
Climate RegionCityMinP50 1MaxRuns > 1 2MinP50MaxRuns > 1MinP50MaxRuns > 1t-Valuep-Value
Fibre cement cladding, vented, MS = 1%
CordilleraWHE0.00.00.000.00.00.000.00.00.00−2.6400.019
Western maritimeVAN0.00.31.320.01.23.380.00.91.96−3.3100.004
PrairieCAL0.00.00.000.00.00.100.00.00.10−3.6290.002
PrairieSKT0.00.00.000.00.00.300.00.00.30−3.6770.002
PrairieWNG0.00.00.000.00.11.110.00.11.11−5.0410.000
SoutheasternTOR0.00.00.100.10.51.760.10.51.76−7.1010.000
SoutheasternOTT0.00.00.300.41.53.5110.41.43.211−8.6400.000
SoutheasternMTL0.00.00.300.53.04.2120.53.03.812−7.0270.000
Eastern maritimeMTN0.00.00.300.20.83.770.20.83.47−8.8810.000
Eastern maritimeCTN0.00.00.100.00.31.930.00.31.83−7.0930.000
Eastern maritimeHFX0.00.21.611.63.04.2151.62.92.614−13.1090.000
Eastern maritimeSTJ0.00.00.400.00.31.830.00.21.43−4.5410.000
Fibre cement cladding, ventilated, MS = 1%
CordilleraWHE0.00.00.000.00.00.000.00.00.00−2.5280.023
Western maritimeVAN0.00.20.900.00.72.430.00.51.53−3.4440.003
PrairieCAL0.00.00.000.00.00.100.00.00.00−2.5670.018
PrairieWNG0.00.00.000.00.00.100.00.00.10−3.5960.003
PrairieSKT0.00.00.000.00.00.500.00.00.50−3.9470.001
SoutheasternTOR0.00.00.000.00.31.220.00.31.22−6.2900.000
SoutheasternOTT0.00.00.200.10.62.460.10.62.36−7.3290.000
SoutheasternMTL0.00.00.200.21.84.0100.21.83.810−6.3680.000
Eastern maritimeMTN0.00.00.200.10.63.040.10.62.84−8.0340.000
Eastern maritimeCTN0.00.00.100.00.21.420.00.21.32−6.4280.000
Eastern maritimeHFX0.00.11.211.12.54.1151.12.42.914−13.8360.000
Eastern maritimeSTJ0.00.00.200.00.21.430.00.11.13−4.1340.001
1: Number of climate realizations having average moisture index greater than 1; 2: Median value; 3: Absolute difference between future and historical values. Values in bold are those for which the change between future and historical periods is problematic.
Table 5. Summary statistics and projected changes in mold growth index in the case of aluminum composite cladding with a moisture source of 1%.
H: 1986–2016F: 2062–2092F–H 3t-Test
Climate RegionCityMinP50 1MaxRuns > 1 2MinP50MaxRuns > 1MinP50MaxRuns > 1t-Valuep-Value
Aluminum composite material cladding, vented, MS = 1%
CordilleraWHE0.00.00.000.00.00.000.00.00.00−2.4780.025
Western maritimeVAN0.11.22.590.12.54.3110.11.31.82−3.5300.002
PrairieCAL0.00.00.100.00.00.200.00.00.10−1.4640.156
PrairieSKT0.00.00.000.00.00.100.00.00.10−3.5420.003
PrairieWNG0.00.00.000.00.00.400.00.00.40−3.2550.006
SoutheasternTOR0.00.00.100.00.20.800.00.20.80−4.9680.000
SoutheasternOTT0.00.00.100.00.31.510.00.31.41−5.7870.000
SoutheasternMTL0.00.00.100.00.83.760.00.83.66−5.6830.000
Eastern maritimeMTN0.00.00.100.00.52.430.00.52.33−6.7470.000
Eastern maritimeCTN0.00.00.100.00.11.310.00.11.21−4.6440.000
Eastern maritimeHFX0.00.11.611.02.44.1141.02.32.513−12.4140.000
Eastern maritimeSTJ0.00.00.800.00.21.850.00.11.05−3.5630.003
Aluminum composite material cladding, ventilated, MS = 1%
CordilleraWHE0.00.00.000.00.00.000.00.00.00−2.3840.030
Western maritimeVAN0.00.10.600.00.41.720.00.31.12−3.1770.005
PrairieCAL0.00.00.000.00.00.100.00.00.00−1.6430.113
PrairieWNG0.00.00.000.00.00.000.00.00.00−3.4780.003
PrairieSKT0.00.00.000.00.00.400.00.00.30−3.2640.006
SoutheasternTOR0.00.00.000.00.10.700.00.10.70−5.5060.000
SoutheasternOTT0.00.00.000.00.31.110.00.31.11−5.8120.000
SoutheasternMTL0.00.00.000.00.63.350.00.63.35−5.6980.000
Eastern maritimeMTN0.00.00.100.10.42.130.10.42.13−7.0510.000
Eastern maritimeCTN0.00.00.100.00.10.900.00.10.80−5.1210.000
Eastern maritimeHFX0.00.00.900.81.84.0100.81.83.110−14.1040.000
Eastern maritimeSTJ0.00.00.20.00.00.11.000.00.10.80−3.7080.002
1: Number of climate realizations having average moisture index greater than 1; 2: Median value; 3: Absolute difference between future and historical values. Values in bold are those for which the change between future and historical periods is problematic.
Disclaimer/Publisher’s Note: The statements, opinions and data contained in all publications are solely those of the individual author(s) and contributor(s) and not of MDPI and/or the editor(s). MDPI and/or the editor(s) disclaim responsibility for any injury to people or property resulting from any ideas, methods, instructions or products referred to in the content.

