Article

Composition of the Gas-Air Mixture in the Containment and Suppression of Forest Fires with Promising Extinguishing Agents

Heat and Mass Transfer Laboratory, National Research Tomsk Polytechnic University, 30 Lenin Avenue, Tomsk 634050, Russia
*
Author to whom correspondence should be addressed.
Forests 2023, 14(4), 786; https://doi.org/10.3390/f14040786
Submission received: 7 March 2023 / Revised: 30 March 2023 / Accepted: 8 April 2023 / Published: 11 April 2023

Abstract

:
This paper presents experimental research findings on the gas composition of pyrolysis and combustion products of typical forest fuels (leaves, needles, twigs, a mixture of these, and timber). These experiments were performed for the combustion and application of a fire extinguishing agent to a pyrolyzing material. Water, a bischofite solution, a bentonite slurry, and a foaming agent solution were utilized. Two gas analysis systems were used, as follows: an industrial one based on CO2, CO, H2, CH4, and O2 sensors and a scientific one (a gas analyzer with H2, CH4, H2S, SO2, CO, and CO2 sensors). Fires were extinguished by using two common techniques, as follows: continuous liquid supply and cycling spraying. The comparative efficiency of applying a group of fire extinguishing agents to forest fires was estimated, taking account of liquid consumption, suppression time, and environmental pollution. A method was proposed for calculating the relative efficiency factors of fire extinguishing agents when containing and suppressing forest fires, allowing for the consumed time, resources, and anthropogenic emissions.

1. Introduction

The annual statistics on forest fires worldwide reveal [1,2,3,4,5] that the number of woodland areas catching fire keeps rising every year. High rates of the fire front spread within a short time and multiply over the areas deforested by fire [6]. They are hazards to animals and populated areas and cause environmental pollution, which is among many other factors that act as an incentive for the international community to develop technologies for forest fire monitoring and high-performance containment and suppression of fires. Modern aerial firefighting systems rely on different methods of liquid supply, both directly to the fire zone and in front of it. They utilize a wide range of additives to water (thickeners, wetting agents, foaming agents, etc., [7,8]) for enhanced wildfire suppression. However, fire extinguishing agents often contain components that interact with pyrolysis and combustion products at high temperatures to produce hazardous emissions [9,10]. The emitted toxic substances have a destructive effect on the ecosystems near the fire-affected area, damaging forest vegetation, fauna, and soil [11]. A sharp rise in carbon oxide concentrations caused by a wildfire reduces carbon redistribution and impacts the carbon cycle [12].
The main components of combustion products are solid particles, hydrocarbons, nitrogen, and carbon oxides. CO2 accounts for up to 90% of the total gas volume. The annual CO2 emission levels due to forest fires make up around 8% of the total CO2 production and 50% of industrial emissions based on the carbon dioxide volumes that result from biomass decomposition after fires [13]. Medical research findings [14] confirm the cause-and-effect relationship between air pollution with CO2 and the negative impact on human health, since atmospheric circulations can carry pollution plumes hundreds of kilometers. The negative consequences mentioned above demonstrate the relevance of comparing the gas emissions from the combustion, containment, and extinguishing of forest fires. Thus, a considerable number of scientific papers seek to develop methods and approaches for reducing the pollution of CO and CO2 emissions to the environment [15]. These methods include a complex multiple-criteria analysis that is used to identify the most promising technologies for fire suppression. This analysis relies on the estimation of the integral efficiency factor [16,17,18] of the process (in the considered case, it is extinguishment using different agents). This method helps work out a strategy for suppressing fires with a priority set on different indicators. When the environment is the main priority, a firefighting composition is chosen in the calculations that ensures minimum emissions of the gaseous products of thermal decomposition.
The supply of fire extinguishing agents to a forest fire zone is not safe [19]. There are convection columns, smoke, fluctuations in temperature, and gas concentrations. These factors place some constraints on fire suppression methods and the use of agents. They also hamper the work of aircraft in a fire zone. A major implication of forest fires is that they exacerbate global warming [20,21]. This is due to the emissions of forest fuel pyrolysis and combustion products. To date, there has been little experimental research on the trends of product concentrations in a fire zone when a fire is not suppressed and when it is rapidly extinguished.
Most recent studies have focused on recording the characteristics of the thermal decomposition of forest fuels [22] and on the analysis of toxic substances produced during the combustion and smoldering of typical woodland components [23,24,25]. Ma et al., for instance, [26] reported the estimates of the ranges of gaseous substance concentrations during forest fires involving fuels (branches, leaves) with different moisture contents. They conducted experimental research using gas chromatography–mass spectrometry. A low moisture content in the fuel resulted in the concentrations of CO, CO2, NOx, and SO2 reaching their peaks faster. As the moisture content in the material increased, the emissions of CO rose, whereas those of CO2, NOx, and SO2 dropped. The type of combustible material also affects its emission of gaseous products. The authors showed that with greater moisture in the material, the concentrations of CO, CO2, NOx, and SO2 from the combustion of coniferous forest fuel increased more significantly than in the case of deciduous forest fuel. Pallozzi et al. [27] investigated the emissions of gases and solid particles during the combustion of forest cover (needles/leaves, twigs, and fallen needles/leaves). In their experiments, they collected air samples at different fire stages (ignition, flame combustion, and smoldering) in a combustion chamber. The main gaseous emissions were found to be CO and CO2. The dominant aromatic hydrocarbons were benzene and toluene. They experimentally established that the peak concentration of methane corresponded to the combustion phase. The maximum level of CO was recorded at the smoldering phase. The thermal decomposition of leaves and needles was shown to produce a larger amount of volatile organic compounds than that of twigs. They noted that the findings made it possible to estimate the yield of combustion products at different stages of a forest fire. The influence of the type of material on the qualitative and quantitative values of emissions of forest fuel combustion products was examined in [28]. The authors established that the smoldering of trees, shrubs, and surface dead fuel produced higher concentrations of CO and HC than flame combustion. These flue gas components, such as CO2 and NOx, followed the opposite trend. Most CO emissions were found in the tree bark and the humus layer of surface dead fuel. These findings provide a theoretical foundation for regional environmental assessments.
During an active fire, it is extremely difficult to perform on-site reliable measurements of the gas component concentrations and calculate the masses of the most hazardous pollutants. It is rational to use laboratory-scale fires to compare the gas emissions from a forest fire that is being extinguished. Considerable progress has already been made in the study of the qualitative and quantitative concentrations of combustion products from the thermal decomposition of indoor combustible materials (various interior design and furniture materials, flooring types, etc.) [24,25,29,30]. A number of authors have investigated how the method of supplying liquid (water) to the ignition source affects the range of concentrations of the gaseous products of pyrolysis (namely, CO and CO2) [29,30]. Other researchers have [16,17,18] established that it is possible to use the experimental research findings on the concentrations of flue gases obtained in laboratory tests to describe the behavior of large fires in actual compartments. Currently, there are no corresponding studies published on forest fires, which served as the motivation for our research.
The purpose of this paper was to identify differences in the composition of the mixture of air with the pyrolysis and combustion products of typical forest fuels during combustion, containment, and suppression using a wide range of extinguishing agents.

2. Materials and Properties

2.1. Forest Fuels

The fire hazard in a forest is determined by the ratio of the dead (dry) forest fuel (which causes a rapid fire spread) to the living forest fuel (which has a high moisture content and is unable to burn by itself). Carriers of fire include boreal zone components that take little time to dry out and can burn on their own. For this research, dead forest fuels were chosen, as follows: fallen leaves, needles, twigs, and timber. Taken together, these materials form a ground cover and are the most fire-hazardous. The thickness of the leaves was 0.09–0.1 mm. The diameters of the twigs and needles were 6 mm and 0.65 mm, respectively. The sample mass (m0) in the experiments was 30 g. Before the measurements, the materials were stored at room temperature (about 25 °C) for five days to equilibrate in atmospheric moisture. The samples were not pre-dried at a higher temperature. The main characteristics of the materials in this study are presented in Table 1.

2.2. Firefighting Compositions

Forest fires are usually extinguished with water, and its great extinguishing effect is caused by its high heat capacity. Different substances are often added to water to improve its extinguishing effects [7,8,31]. For instance, different wetting and foaming agents are added to improve its wetting ability (ability to penetrate). In this case, a fire, especially one involving porous and fibrous materials, is extinguished more effectively. Adding such chemical substances also strengthens the firefighting properties of water. It was experimentally established [32] that control lines constructed to contain the flames during wildfires should involve specialized fire extinguishing agents based on different chemical additives rather than pure water. The reason being that water quickly evaporates from a forest fuel surface, whereas specialized fire extinguishing additives used to create firefighting compositions can remain on the forest fuel surface for a long time and retain water in the near-surface layers of forest cover.
The firefighting liquids chosen for this experimental research were as follows: water; foaming agent solution (5 vol%); bentonite slurry (5 vol%); and bischofite solution (10 vol%). The choice of these compositions was determined by practical experience and the results of tests performed by firefighting services that demonstrated the best performance of the aforementioned compositions in terms of economic and environmental aspects [33,34]. Thus, for example, bentonite is a natural clay material, and bischofite is a natural mineral. Compared to other fire retardants, bentonite and bischofite slurries used to extinguish fires are environmentally friendly for humans, flora, and fauna. The main properties of their compositions are summarized in Table 2.

3. Experimental Technique

Full-scale experiments with fires encompassing large woodland areas are complicated and require considerable resources [36,37,38,39]. Therefore, present-day studies on the analysis of the dynamics of the combustion of forest fuels are divided into two types. First, laboratory-scale experimental research [23,25,26,28,39]. The other is numerical simulation [20] or prediction (based on satellite data) [1,2] of the processes developing in active woodland fires. The first approach, when experiments are performed in a laboratory (heating chambers, dedicated boxes, etc.), is considered appropriate and quite representative [23,25,26,28,39]. A number of studies [23,25,26,28,39] are conducted in heating units and combustion chambers, whose findings can be used to create a database on combustible materials and lay the theoretical foundation for environmental estimates. This research makes it possible to analyze the qualitative values of emissions from the combustion of a material on a regional scale as well as identify the specific aspects of the thermal decomposition of combustible materials with varying properties.
Figure 1 presents the experimental system used to conduct this research. It consisted of a box (1) (Figure 1) with the dimensions 1.5 × 1 × 1.25 m and a monitoring and control system with a PC (2). Inside the box were a laboratory-scale fire (3), a gas analysis system (4)—based on industrial sensors for oxygen O2, carbon dioxide CO2, carbon monoxide CO, and methane CH4—and a laboratory gas analyzer (5) with sensors for carbon monoxide CO, carbon dioxide CO2, hydrogen H2, oxygen O2, sulfur oxide SO2, methane CH4, and hydrogen sulfide H2S. As well as a dome camera (6), a high-speed pyrometer (7), and atomizers (8) to supply fire extinguishing liquid. Two thermocouples were mounted inside the experimental setup immediately above the laboratory-scale fire at a height of 1.2 m to measure the air temperature.
Signals from the industrial sensors, high-speed pyrometer, and gas analyzer were transmitted to the monitoring and control system. It displayed the measurements of all the recorded parameters (gas concentrations, fire temperatures) on the screen and transmitted them to the PC for subsequent processing and activation of the fire-extinguishing liquid supply to contain and suppress the fire.
The gaseous emission concentrations were analyzed with a laboratory gas analyzer (response rate: 5–15 s). It consisted of a probe to collect air samples (9), a pump, and a filtration system for the collected samples. The built-in pump and probe of the gas analyzer provided a constant flow of gases produced during the combustion of a material to its sensors. The gas analyzer specifications are given in Table 3.
The average concentrations of gaseous emissions were calculated using the trapezoidal rule [36]. The concentrations of gaseous emissions measured in this way were used to estimate the emission factors for each species Y i . The following equation was used [30]:
Y i = C v t m 0
where C is the average concentration (calculated according to the method from [36]) of a component of the gas mixture, mg/m3; t is the duration of flue gas release, s; v is the capacity of the gas analyzer pump (volume of gas taken by the gas analyzer during the experiment (0.00001 m3/s)); m0 is the initial mass of material, g.
The industrial gas analysis system comprised fixed gas analyzers of the Senson-SV-5023 type. The main characteristics of the sensors are summarized in Table 4.
The materials were set on fire using a gas burner. The flame application time ranged from 10 to 30 s, depending on the type of combustible material. To extinguish the fire in the upper part of the experimental setup, an FMT-100 nozzle was placed at a distance of 1 m from the fire. Fire extinguishing liquid was supplied through a flexible hose at 200 kPa.
For each composition in Table 2, the discharge density was determined for combustible materials. For that process, the materials to be burned were placed on a metal pallet with the dimensions of 30 × 20 × 5 cm. The sprayed fire extinguishing agent accumulated on the pallet; its mass was determined. The specific discharge density was calculated based on the mass of the liquid, spraying time, and pallet area. This indicator characterizes the amount of liquid supplied per unit time and per unit area. Knowing the liquid discharge density and fire suppression time, it is possible to find the specific flow rate of the fire extinguishing agents by multiplying the two values together.
Fire extinguishing began as soon as the fire detectors were activated or after the fire surface temperature (measured with the pyrometer) reached constant values. Water was supplied until there were burning regions recorded by the dome camera and until the CO concentrations recorded by the gas analyzer started falling rapidly. The two most common techniques of liquid supply to the fire were utilized [37], as follows: continuous spraying and cycling spraying. In continuous spraying, a firefighting composition was supplied without interruption for as long as suppression proceeded. In cycling spraying, fire extinguishing liquid was supplied in bursts at certain time intervals (pulses). The research by Gupta et al. [38] experimentally explored the influence of a cycling spraying system on fire suppression time and water consumption. A fire suppression performance index (FSPI) was proposed to assess the effectiveness of fire suppression. It is the inverse product of the fire suppression time and the amount of water spent on extinguishing. Different ON- and OFF-cycle patterns of the spraying system were studied [38]. In continuous suppression, FSPI was 0.08. In cycling spraying, it was 0.1–0.14, which is 20% higher than with a continuous water supply. The FSPI was highest in a pulsing cycle of 1.3 s (ON) and 1 s (OFF). Using cycles with a fixed delay between water discharges makes it possible to reduce the amount of water spent on extinguishing by almost 50%.
The pulsing duration in this study was chosen based on preliminary experiments. The cycle in which liquid is supplied for 30 s with 3-second pauses contributes to more effective fire suppression in terms of the required time and liquid consumption. Longer pauses between water discharges (e.g., up to 10 s) intensified the thermal decomposition of the material. This happened because the liquid in the combustion zone rapidly evaporated within the time interval between water discharges. Due to a long break in the droplet flow supply to the reacting area, the heat released exceeded the heat removal intensity. This facilitated the thermal decomposition of the materials on fire, thus leading to a longer suppression time. A liquid supply with a pulsing duration of less than 30 s is not enough to generate the amount of water flow necessary to absorb the heat released by the fire. When the pulsing duration is increased to more than 30 s, the liquid supply to the fire becomes excessive. The pauses of 3 s between water discharges are comparable to the time of a firefighting system activation (1–2 s) [38]. A sprayed water flow supplied to the fire with the aforementioned parameters can extinguish it in less than 200 s. Following the experiments, the authors determined the concentrations of CO, CO2, O2, CH4, and H2 in the experimental setup, the duration of fire suppression using a fire extinguishing composition (te), and the specific discharge density. For each type of combustible material, a set of five experiments was conducted.

4. Results and Discussion

4.1. Gas Concentrations in the Free Burning of Forest Fuels

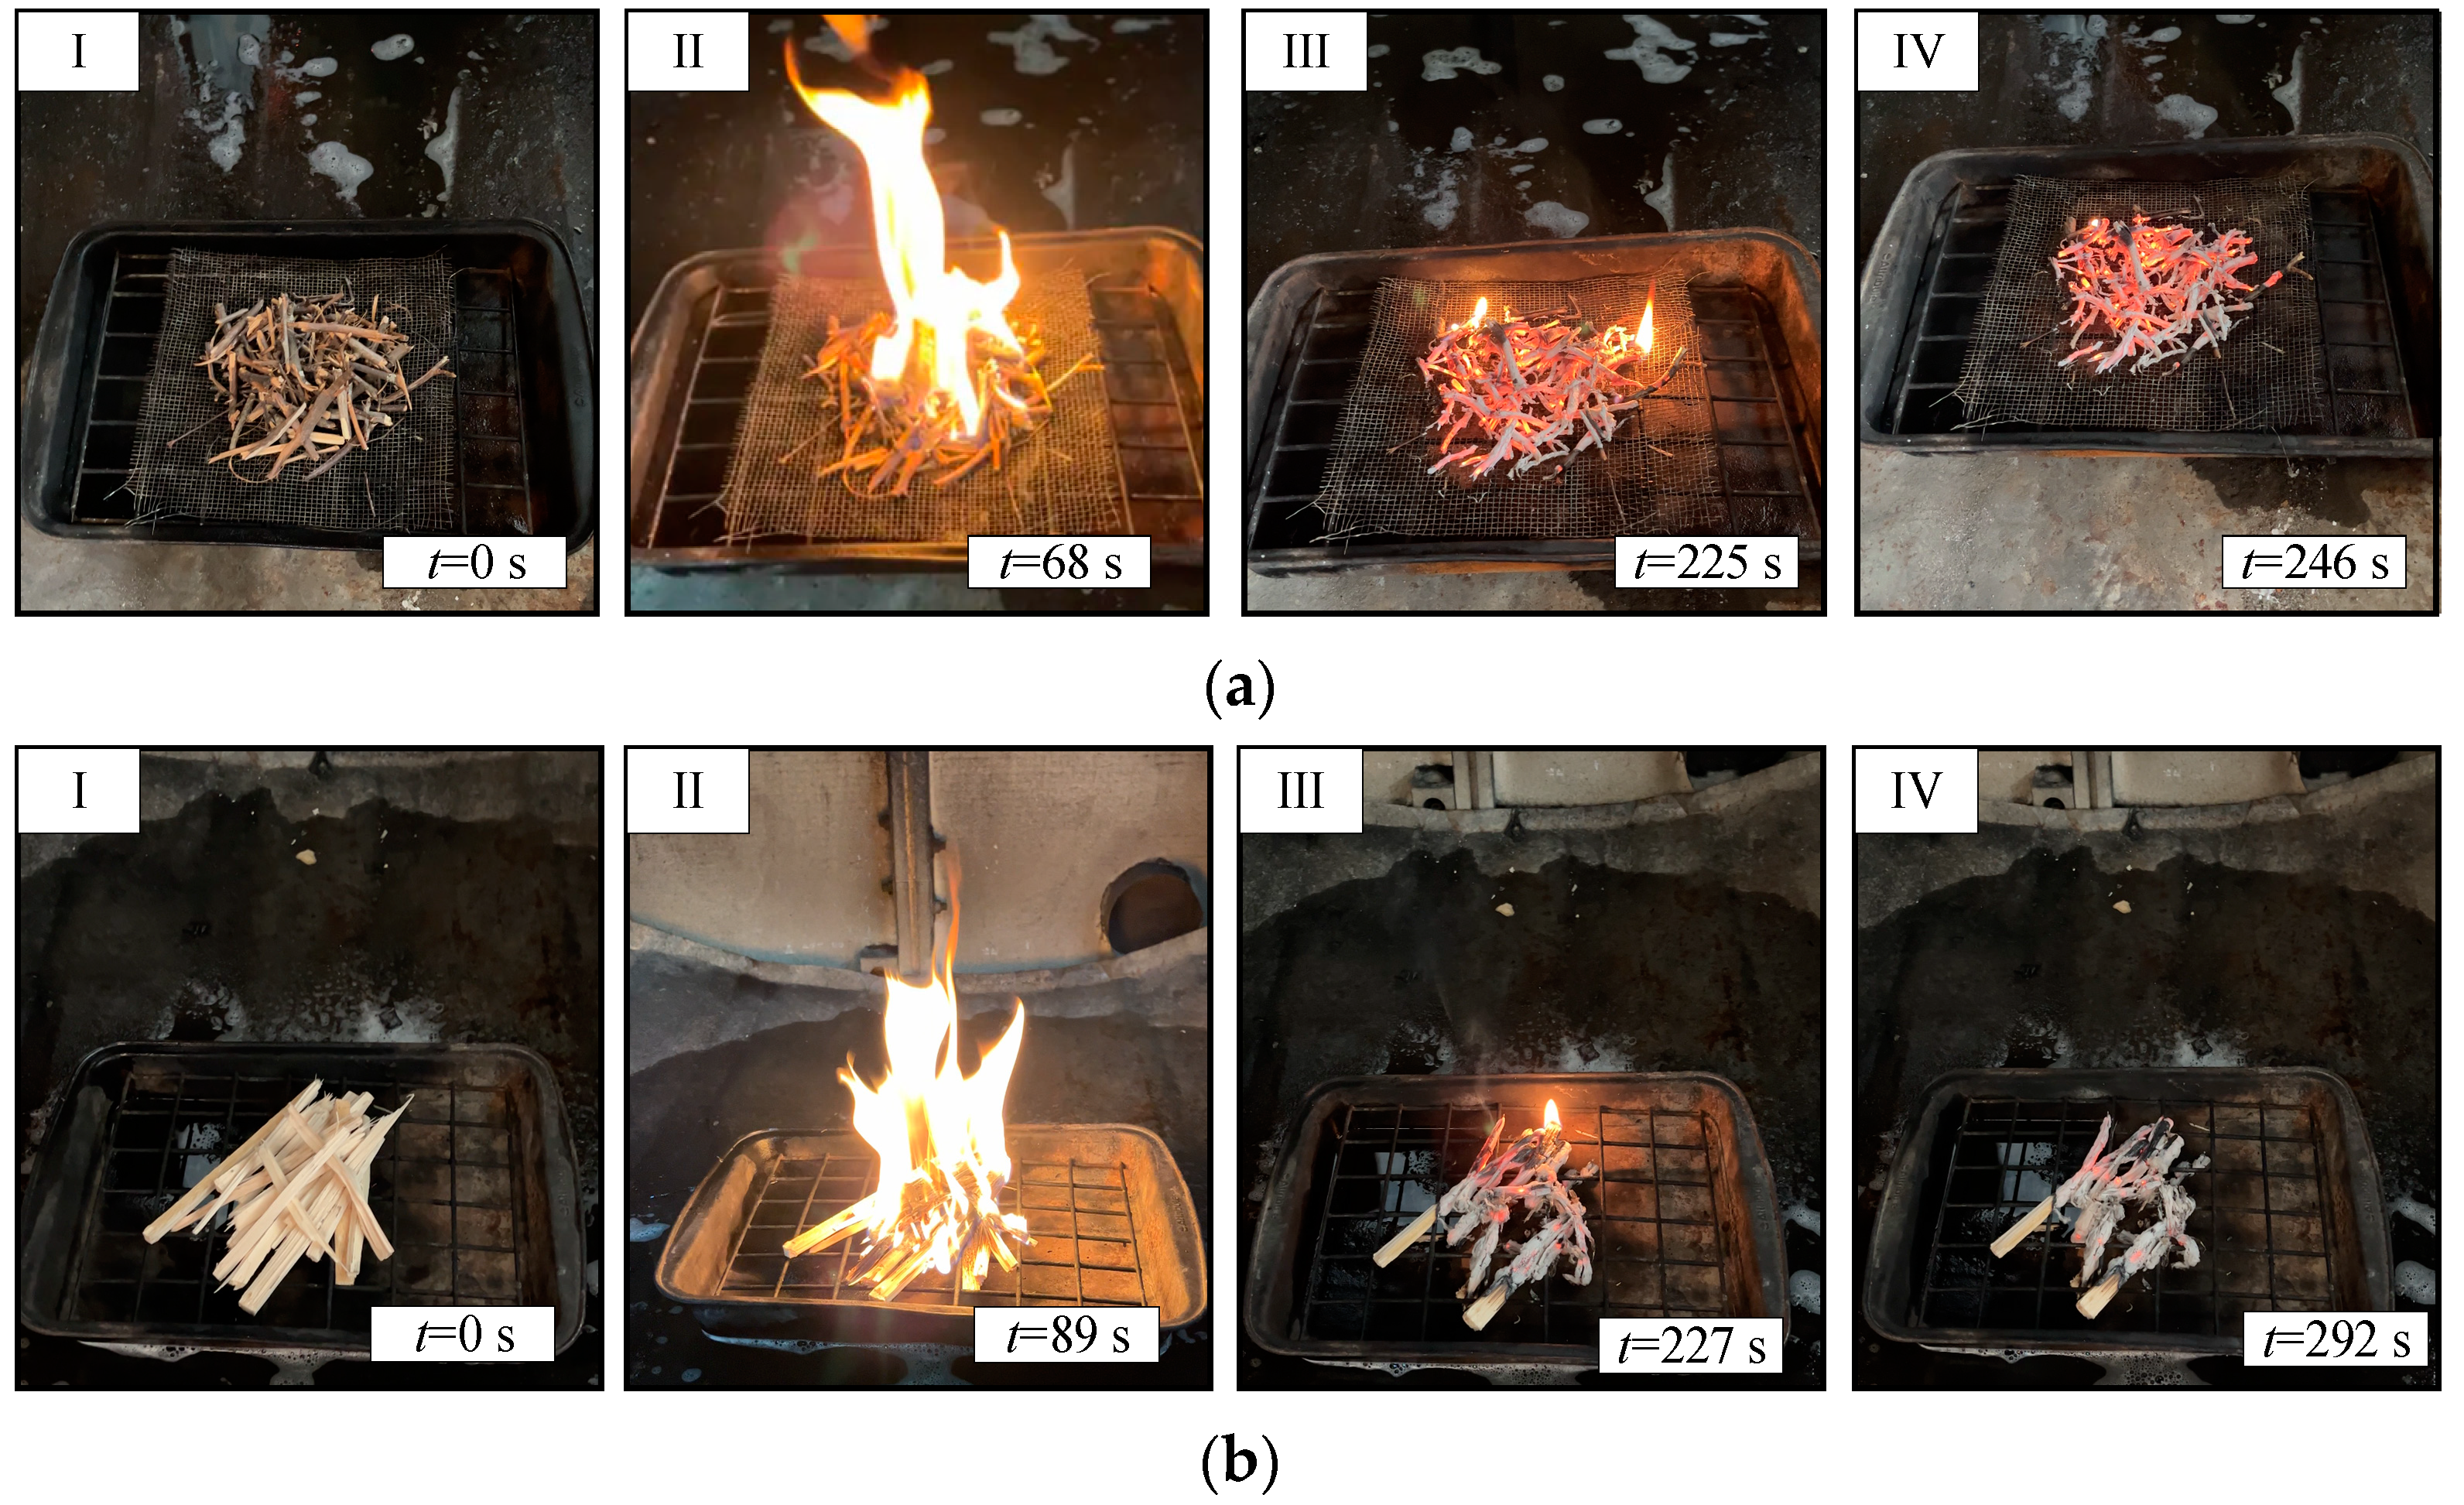
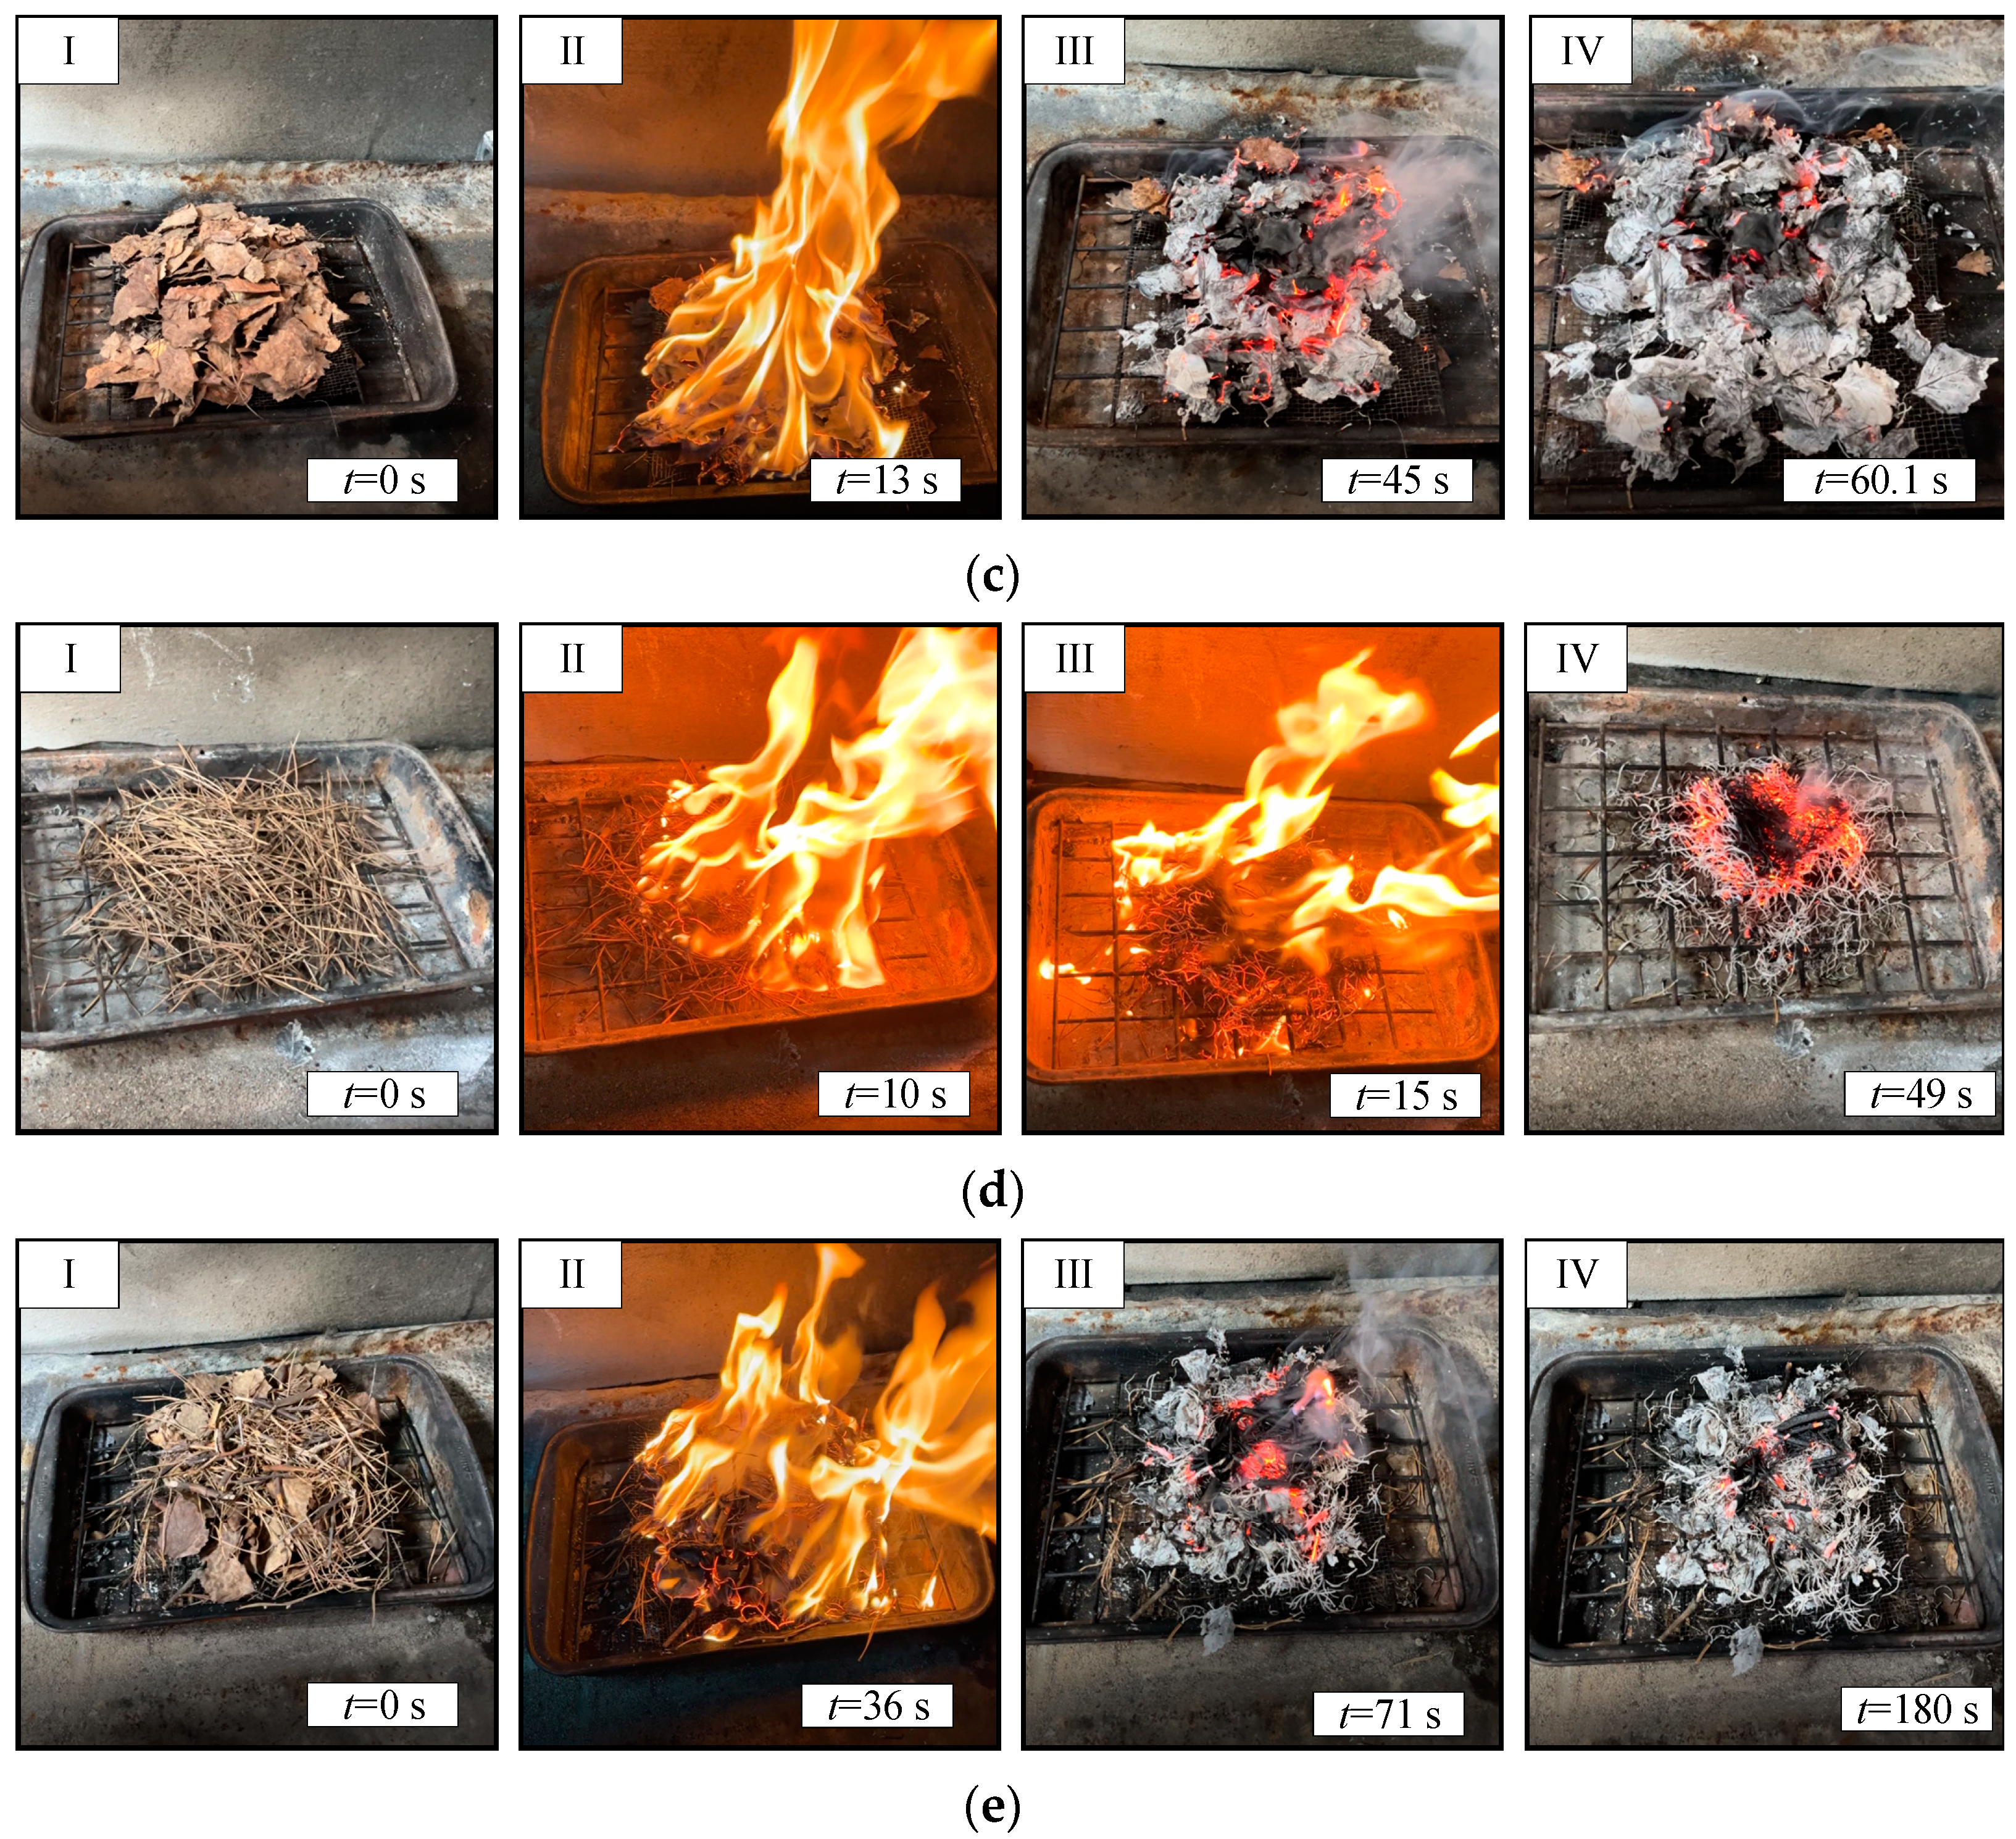
Figure 2 presents typical images of laboratory-scale fires with a fire load of different types of forest fuels (branches, timber, leaves, needles, and a mixture of forest fuels) at different combustion stages. The images at stage I show combustible materials at the initial point (before ignition). The images at stage II correspond to active combustion of materials; this stage is characterized by the greatest flame height and a rather weak smoke generation. Stage III show the decay of the laboratory-scale fire and the smoldering of forest fuel. At this stage, the smoke and combustion products released still remain intense for all the combustible materials under investigation. At the stage of smoldering completion (IV), burning-out fragments were seen without active smoke generation (both when using the laboratory gas analyzer and industrial sensors). We started recording the gas emissions when we ignited the material with the gas burner. We stopped the measurements using the aforementioned equipment at the stage of smoldering, when there were no visible signs of smoke, the oxygen concentrations started rising, and the CO concentrations reached constant values or started falling. Thus, the industrial sensors and the gas analyzer measured the emission concentrations at the same time.
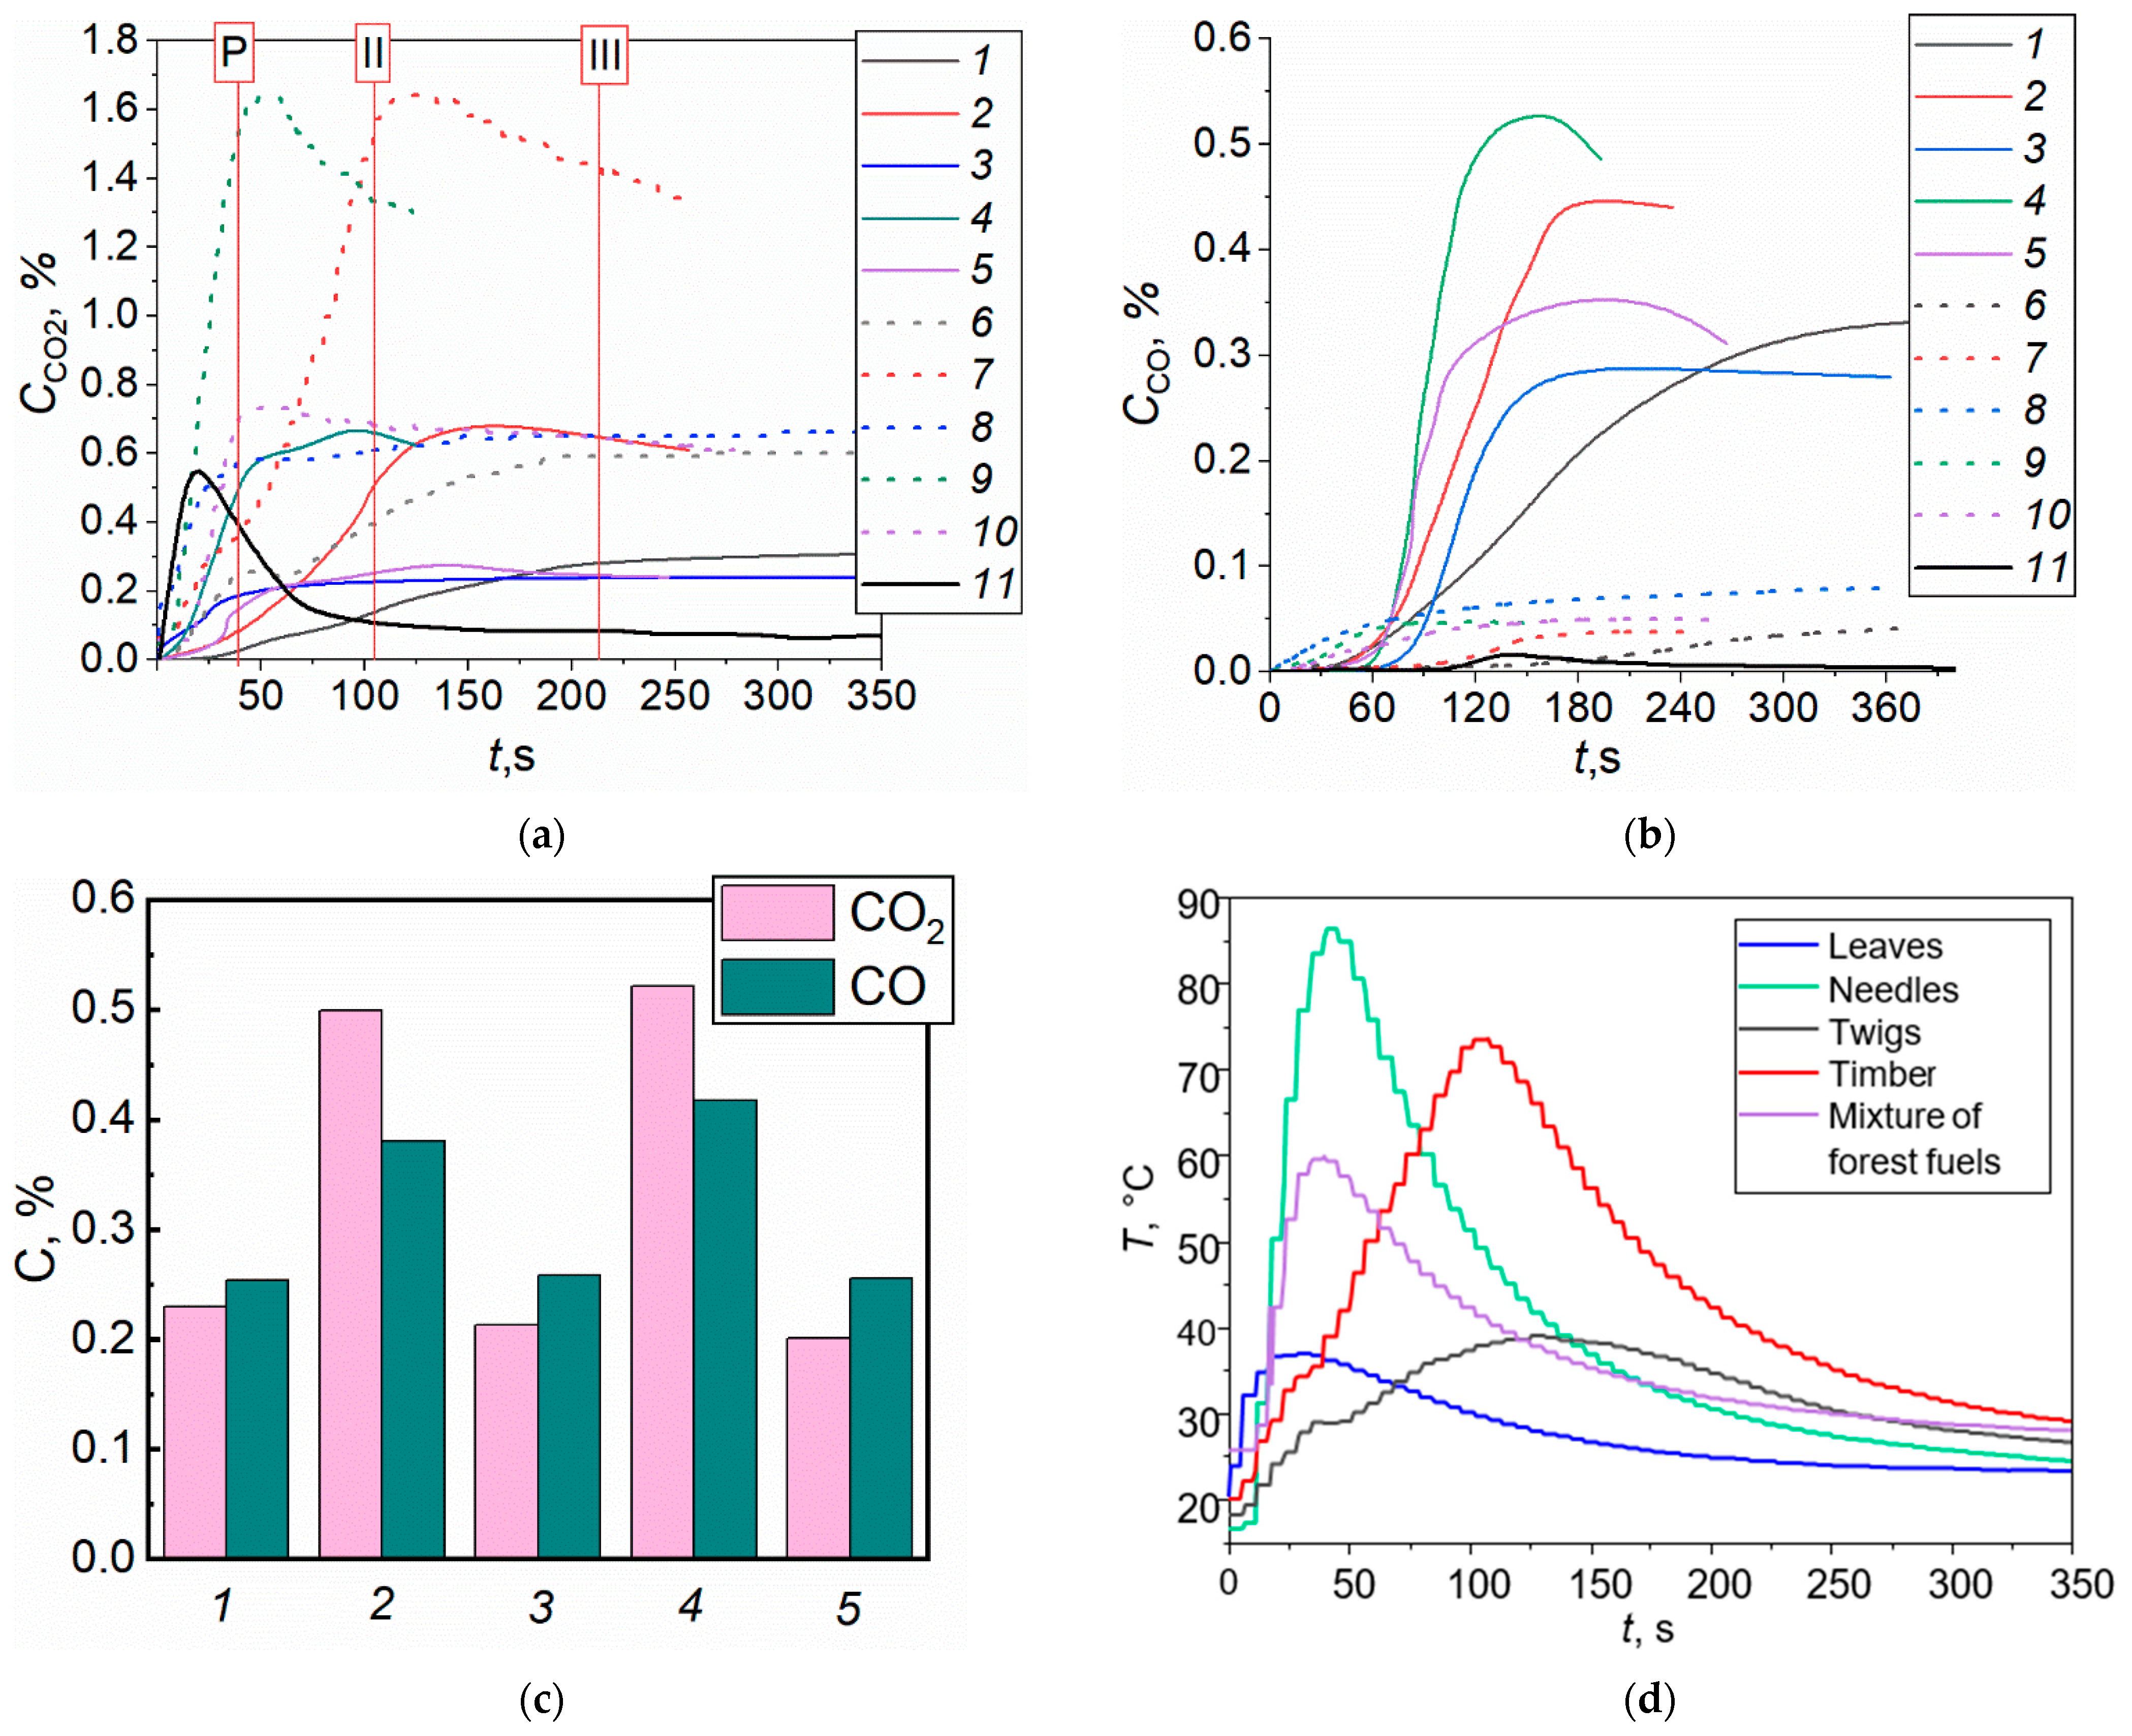
The ranges of CO, CO2, CH4, H2, and O2 concentrations were analyzed. Figure 3 presents the trends and average concentrations of CO and CO2 recorded by the laboratory gas analyzer and industrial sensors.
The concentrations of CH4 and H2 emissions were low (0.004–0.1%). The subsequent analysis was based on the emissions of the main gases characterizing combustion—carbon monoxide and dioxide. CO2 was produced at the combustion stage; CO was emitted during the smoldering phase. For better readability, two main phases were shown in Figure 3: active combustion (II) and smoldering (III) of timber. Differences between the gas concentrations over the whole period of the thermal decomposition of the material were identified. It was clear that the maximum concentrations of CO and CO2 (Figure 3a,b) were recorded during the thermal decomposition and combustion of timber and needles. The values were the minimum for leaves and a mixture of forest fuels. A similar trend persists for average gas concentrations too. These differences stem from the structure of the materials, their different reaction rates, physicochemical properties, sizes, and shapes, as well as temperature gradients in the material layer and on its surface. In Figure 3, combustible materials show varied times when their gas concentrations remained high. For example, the peak concentration of carbon monoxide (CO) (Figure 3b) for needles was recorded 43 s earlier than for timber and leaves. A similar trend can be seen in Figure 2. In particular, the duration of the combustion stage of this material was the shortest. The maximum values of CO and CO2 for timber and needles differ from those for twigs, leaves, and a mixture of forest fuels by 35–52%.
Figure 3a clearly shows that the carbon dioxide concentrations measured with industrial sensors were somewhat higher than those measured with a laboratory gas analyzer. The time taken to reach the peak (maximum) value, though, was the same for the two gas analysis systems. There were also differences (Figure 3b) between the CO concentrations measured with the two gas analysis systems. This difference was because carbon monoxide is heavier than air, which causes it to mostly accumulate at the bottom of the experimental setup and not reach the upper part. As a result, not all the gas produced reaches the industrial sensors placed above. The gas analyzer is fitted with a pump that captures a slightly greater volume of flue gases. Therefore, the carbon monoxide concentrations measured with the gas analyzer exceed those measured with the industrial sensor. Figure 3d presents the temperature trends describing the dynamics of heat release for all the combustible materials under consideration. The highest air temperature (86 °C) in the experimental box was recorded during the combustion of pine needles. This material was also characterized by the highest emission of CO. The recorded temperature trends correspond to the CO emission trends for all the materials (Figure 3b,c).
For comparison, the research findings from [39] were also included in Figure 3. They show the gas emissions during the piloted ignition and self-ignition of pine needles at different heat fluxes (10–50 kW/m2). Their research was conducted in a cone calorimeter. The compositions of the gas emissions were analyzed using FTIR, NDIR, chemiluminescence, and paramagnetic gas analyzers. CO2 and water were found to be the main products. The maximum values of CO2 obtained in [39] differ from those obtained for pine needles in this research by 18.2%.
To generalize the research findings, Table 5 shows the emission factors (g/g) of CO and CO2. The emission factor (g/g) was defined as the amount of combustion product from the burning of 1 g of combustible material. The gas concentrations presented in this way will make it possible to assess the fire hazard of combustible materials at different fire stages. In Table 5, the production of CO for leaves, needles, and twigs was higher than that of CO2, which can be accounted for by the fact that smoldering prevailed for these materials. Thus, most of the emissions were produced during this stage.
The emission factors presented in Table 5 are consistent with the results of other studies. In particular, the values of CO and CO2 recorded in the conducted experiments are in agreement with those obtained in [27] (0.12–0.18 g/g for CO and 0.98–1.48 g/g for CO2) during the combustion of forest litter (needles, leaves, and twigs). Moreover, the amount of carbon monoxide and dioxide recorded in the present research was close to the data in [40] that was obtained for wildfires in Portugal. The yield of CO in [40] was 0.07–0.38 g/g and for CO2 was 1.02–1.65 g/g.

4.2. Gas Concentrations during the Suppression of Forest Fuel Fires Using Fire Extinguishing Compositions

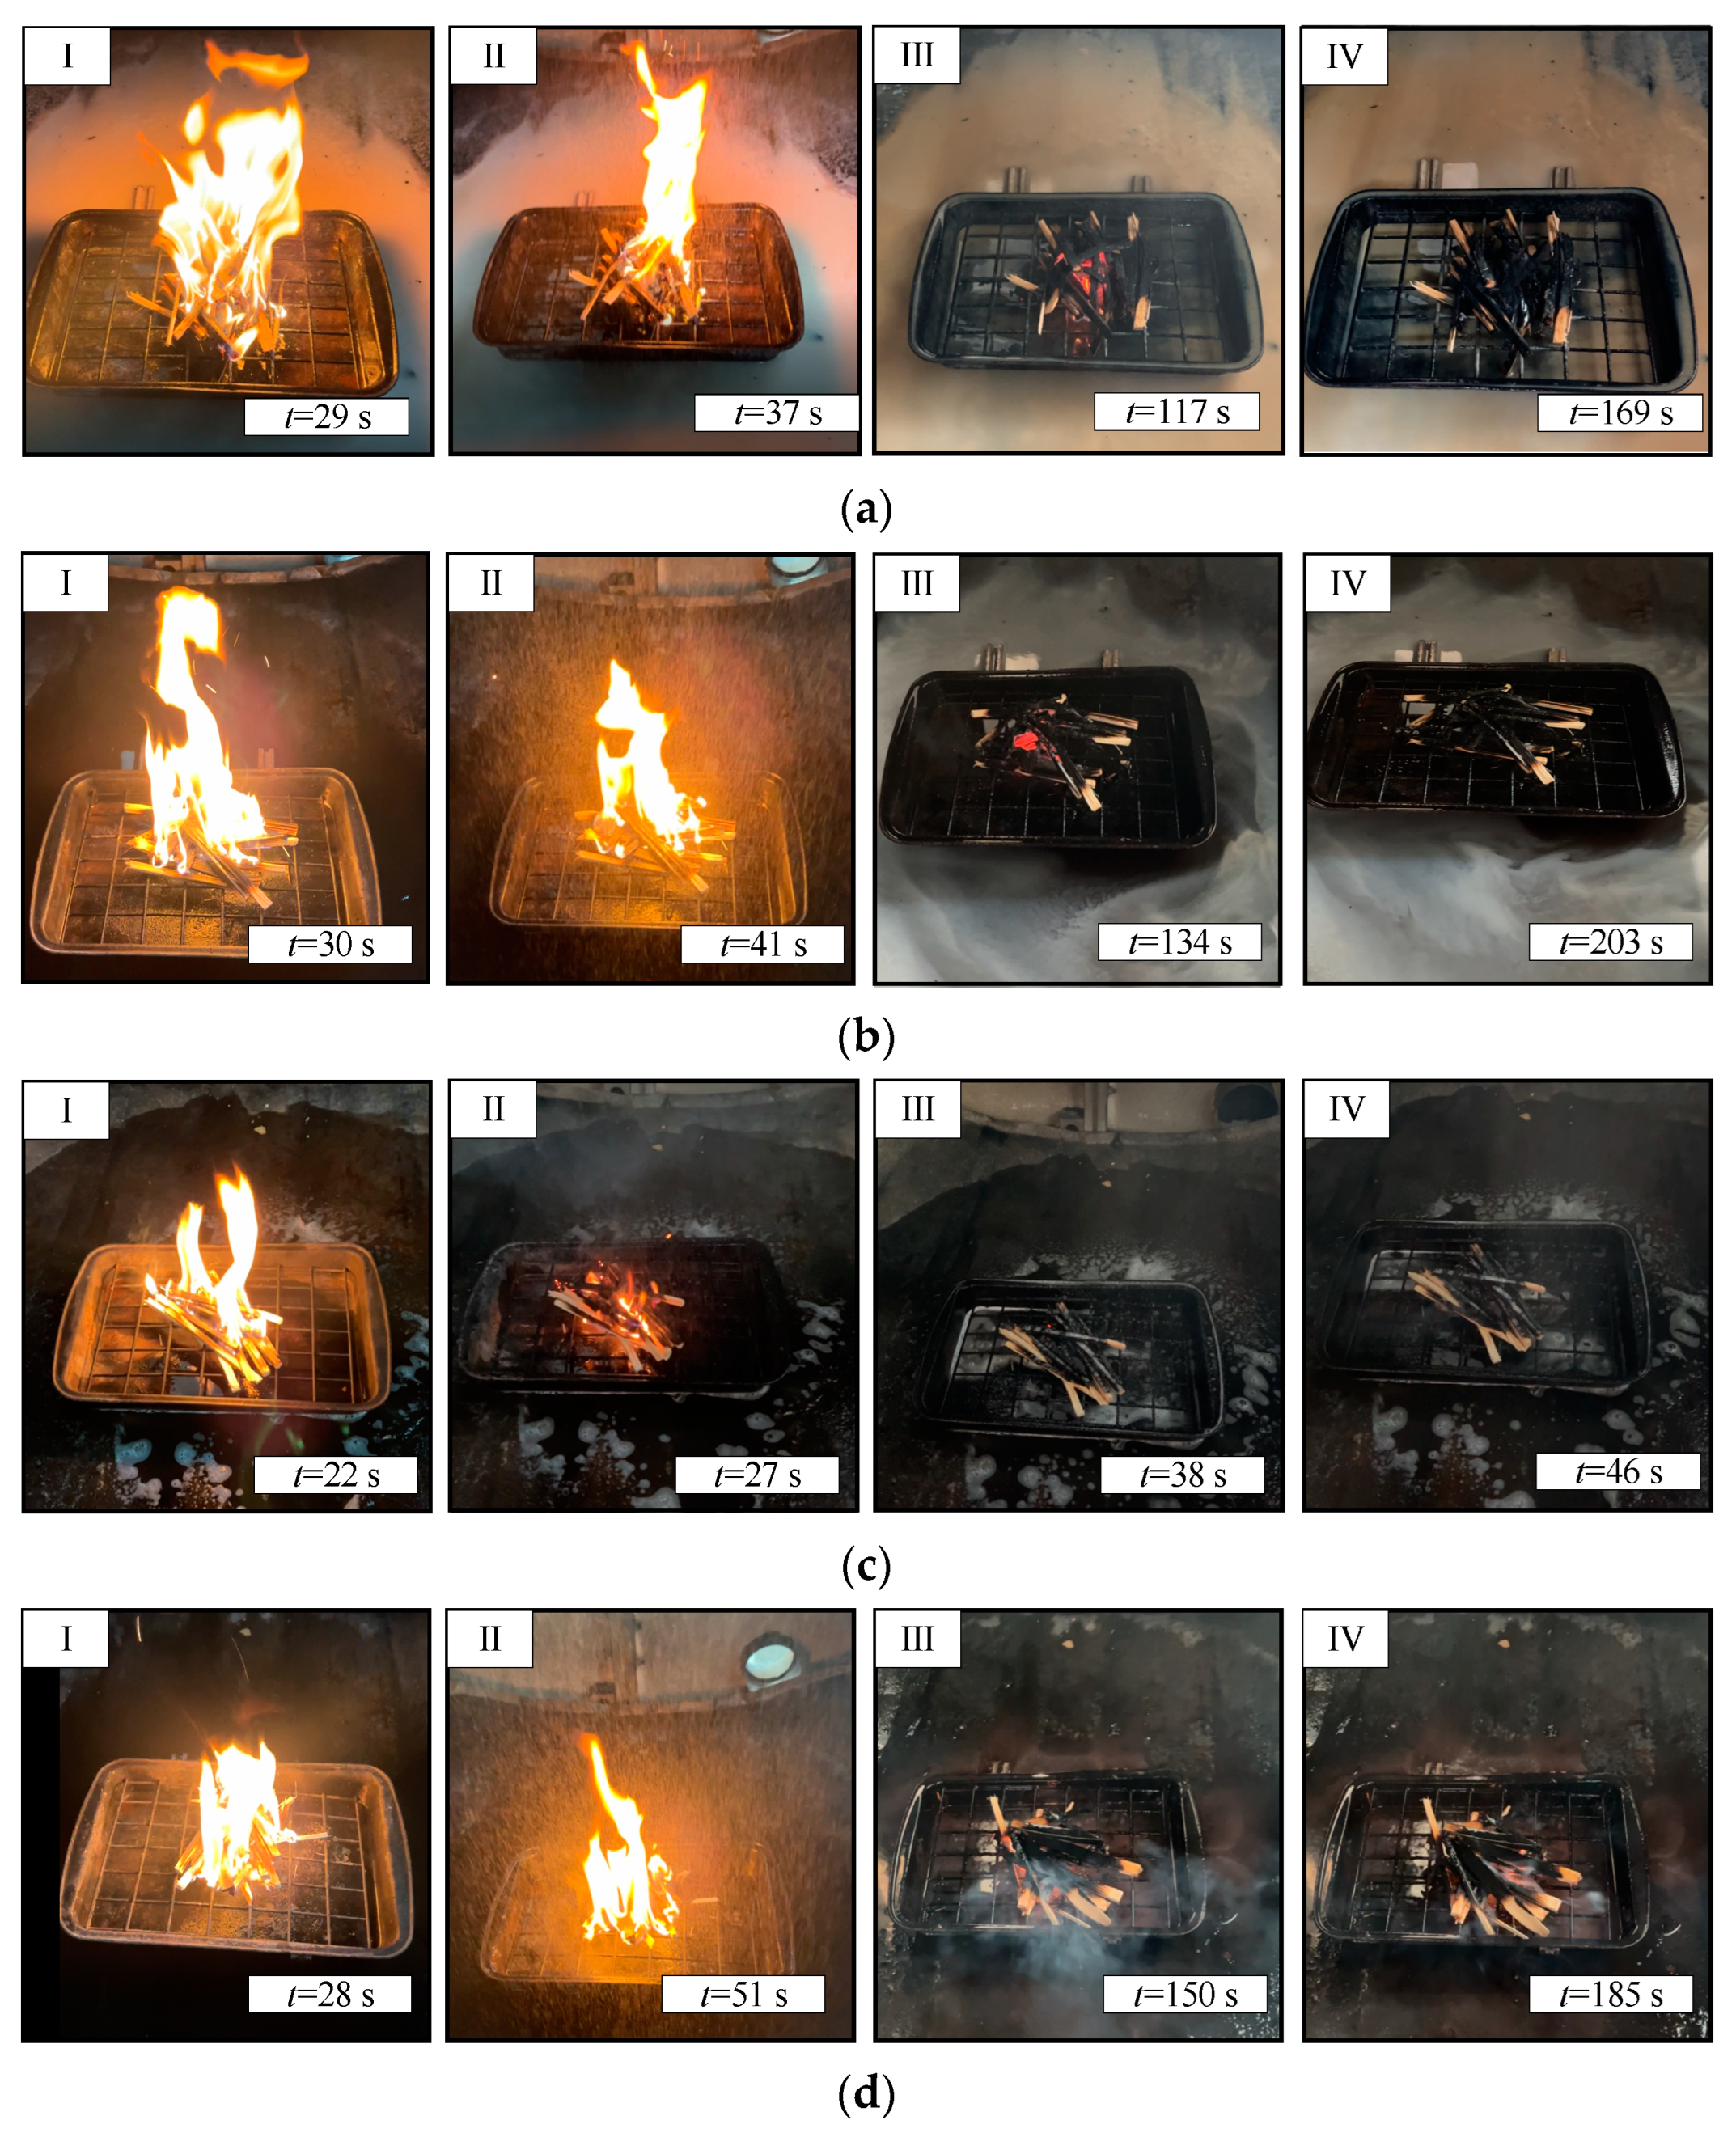
Figure 4 presents the images of the experiments involving the suppression of laboratory-scale fires (timber) using extinguishing liquids with varying compositions and properties. The images demonstrated different stages of combustion initiation and suppression. For instance, at the first stage (I), flame combustion occurred immediately after the gas burner was removed. At this stage, the emissions of CO and CO2 were too low for the sensors in the gas analysis equipment to detect them. The second stage (II) corresponded to the point when a firefighting liquid was supplied. The trends of the interaction between a sprayed flow of firefighting liquid and a laboratory-scale fire with forest fuels were different. Figure 4a,c indicates that shortly (within 5–10 s) after a bentonite slurry and a foaming agent solution were supplied to the fire, the combustion intensity sharply decreased (the flame was knocked down). However, that was not the case with a water and bischofite solution. The smoldering stage (III) was characterized by a sharp decrease in the intensity of combustion and a generation of smoke and combustion products. At this stage, the fire extinguishing liquid supply was stopped, as the camera did not reveal any visible signs of combustion and the fire surface temperature, estimated by the thermal imager readings, did not exceed 200 °C. At the fourth and final stage (IV), there was no smoldering or gaseous combustion product release, which indicated the end of the thermal decomposition of forest fuels.
Figure 5a,b and Supplementary Materials Videos S1 and S2 present the trends and average concentrations of CO and CO2, produced in the continuous and cycling modes of extinguishing laboratory-scale fires with timber using water. The CO concentration growth corresponds to the time when a sprayed water flow was applied to the fire. The carbon monoxide and dioxide concentrations peaked at 249 s.
When liquid was supplied through nozzles to the reaction region for 30 s, the sprayed water flow mixed with hot, moving gases. This results in the rapid evaporation of droplets and the formation of water vapor. When water discharge was stopped for 3 s, the droplets that had not evaporated absorbed the thermal energy from the combustion zone during evaporation. The combustion intensity decreases. Thus, the droplets that did not evaporate during the water discharge evaporated in the interval between the bursts, weakening the flame combustion in each cycle.
The analysis of the gaseous products of timber pyrolysis and combustion when spraying water using different techniques indicates (Table 6) that the yield of carbon monoxide and dioxide in cycling spraying was 25–32% higher than in continuous spraying. This might be due to the fact that the interval between water discharges was shorter than the optimal one or their duration was longer than was required. Experimentally, water discharges lasting less than 30 s (10–15 s) did not generate enough water mist, thus reducing the heat removal rate. This increased the combustion intensity between water discharges rather than reducing it. The concentrations of CO2 and CO went up. With a water discharge time of 30 s and a pause between discharges of 3 s, the fire was suppressed in 5–6 bursts. However, with an increase in the pause between water discharges to up to 5 s, the suppression time increased compared to continuous water spraying. Hence, there was evidence to suggest that the liquid consumption, suppression time, and emission of the thermal decomposition products can be reduced by using proper patterns and techniques of liquid supply to the fire, taking the specifics of heat and mass transfer into account. Water consumption and suppression durations in cycling spraying were 1.4 times lower than in continuous water supply.
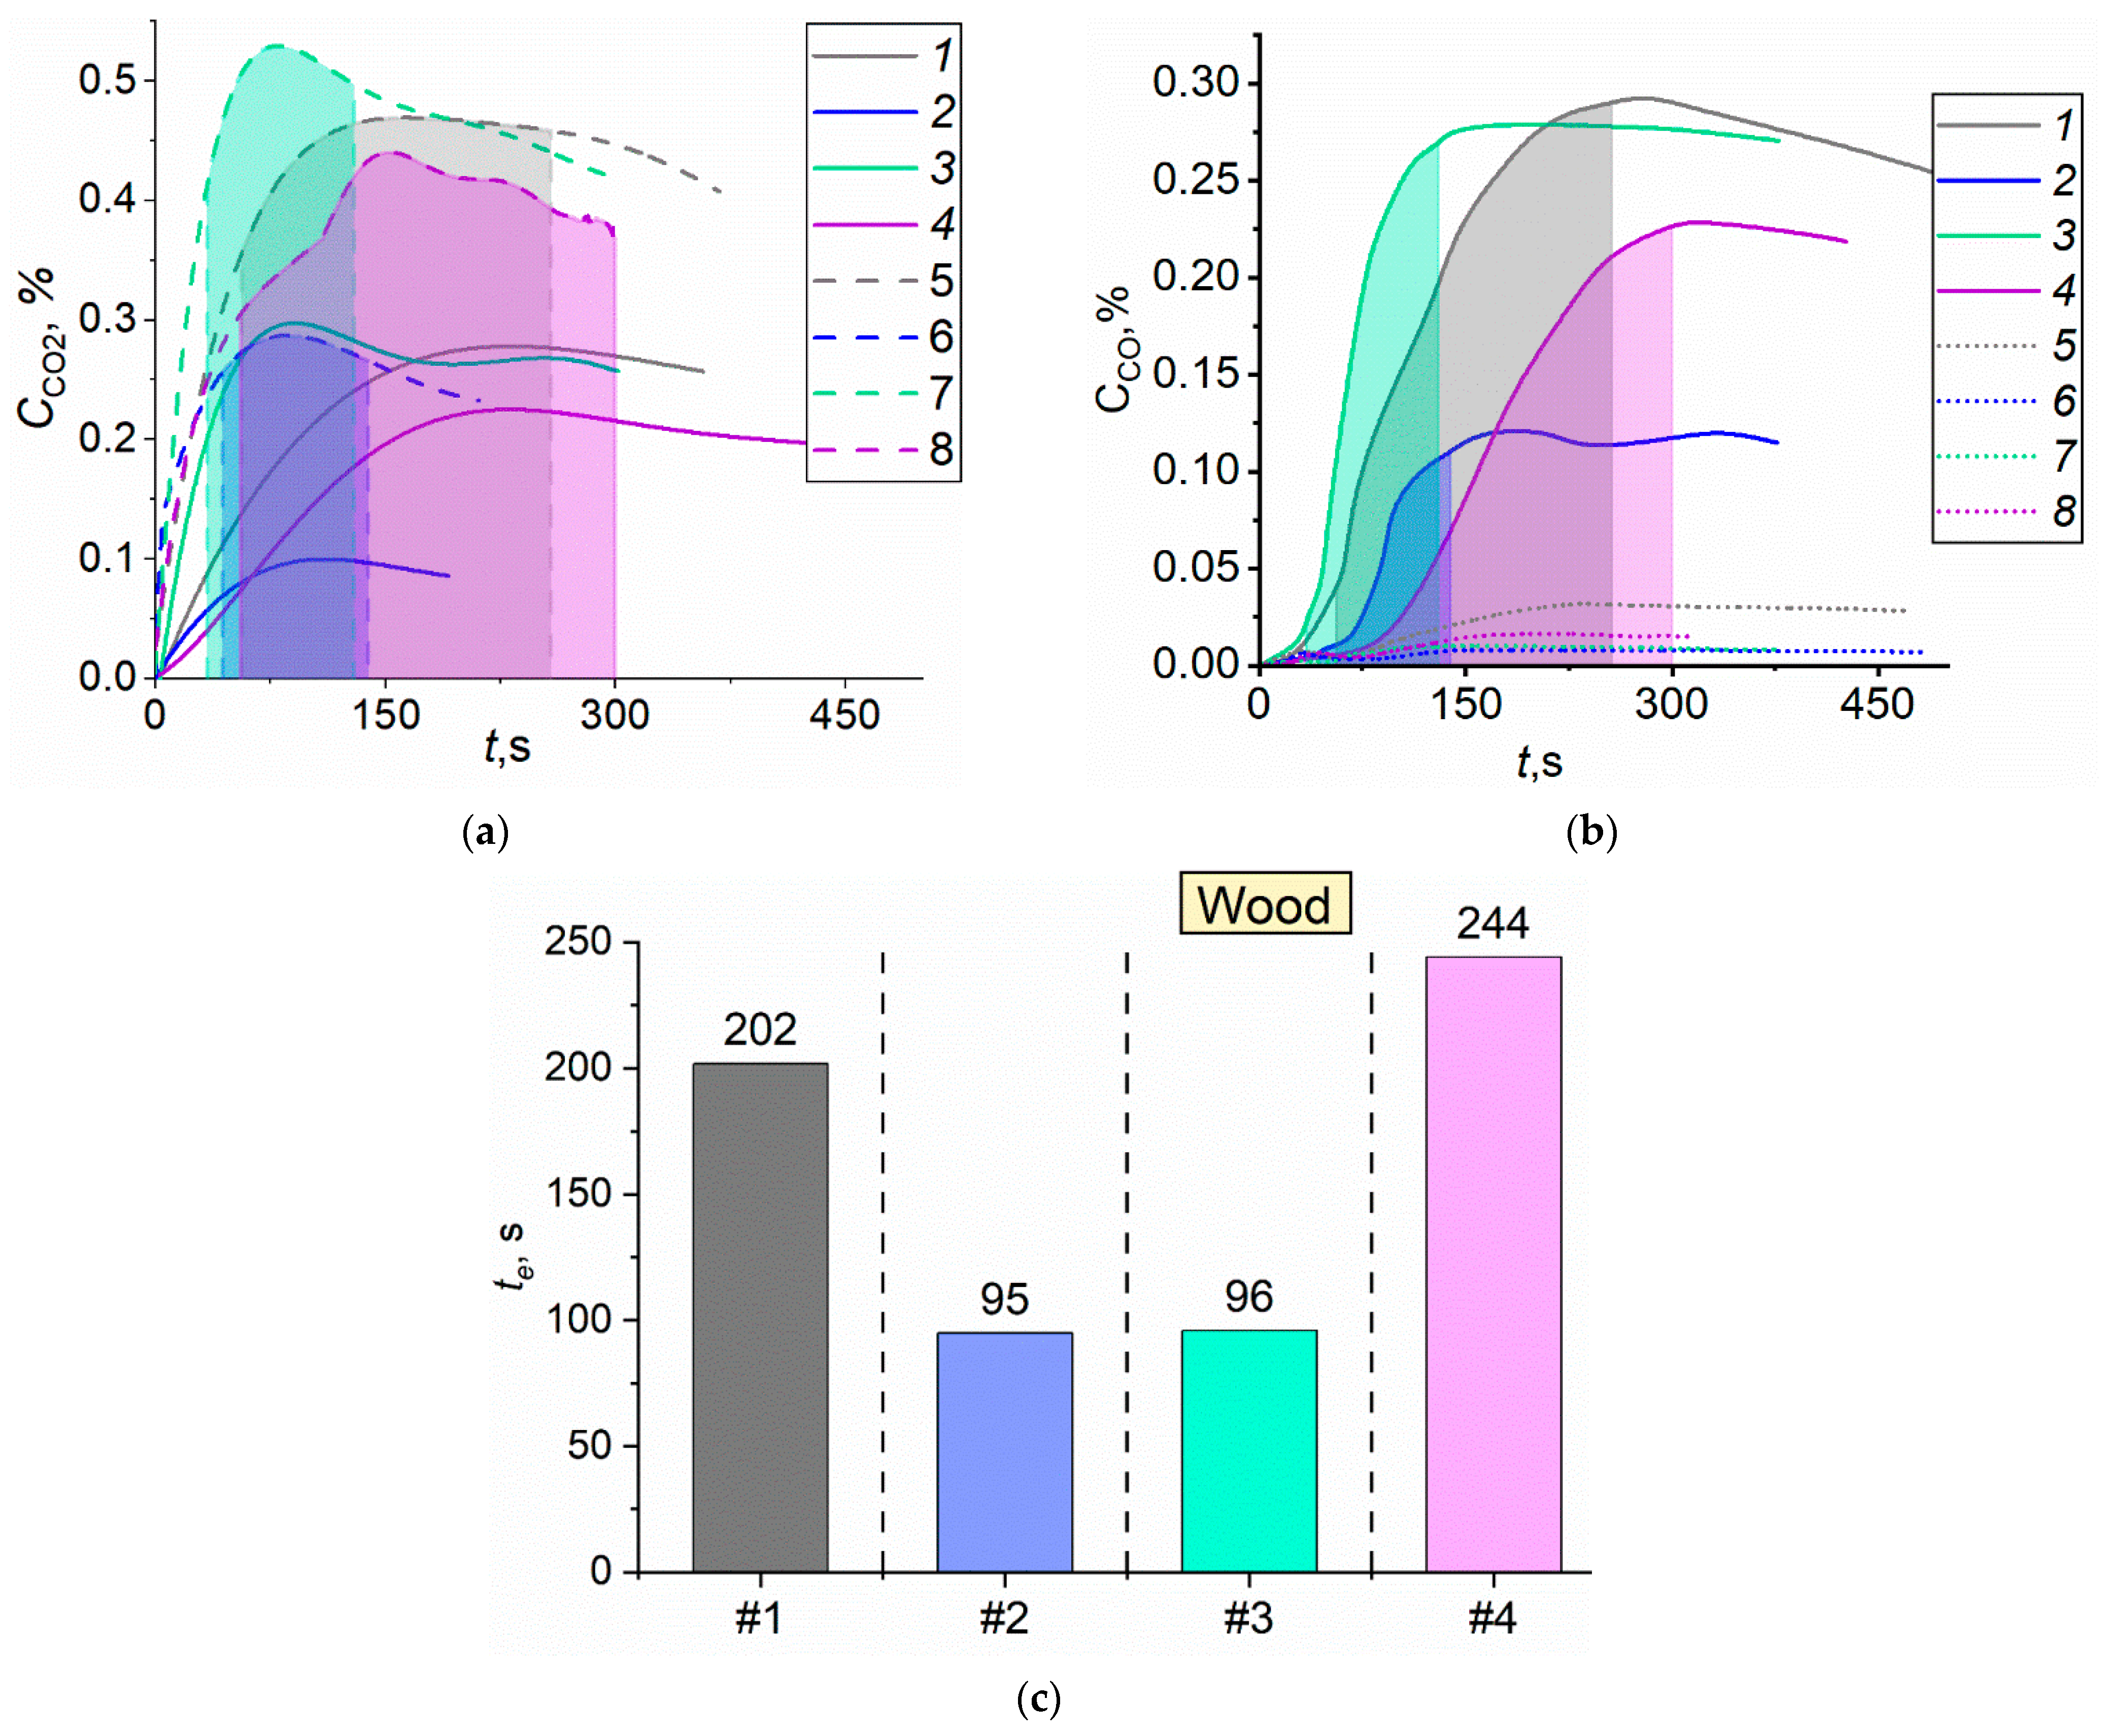
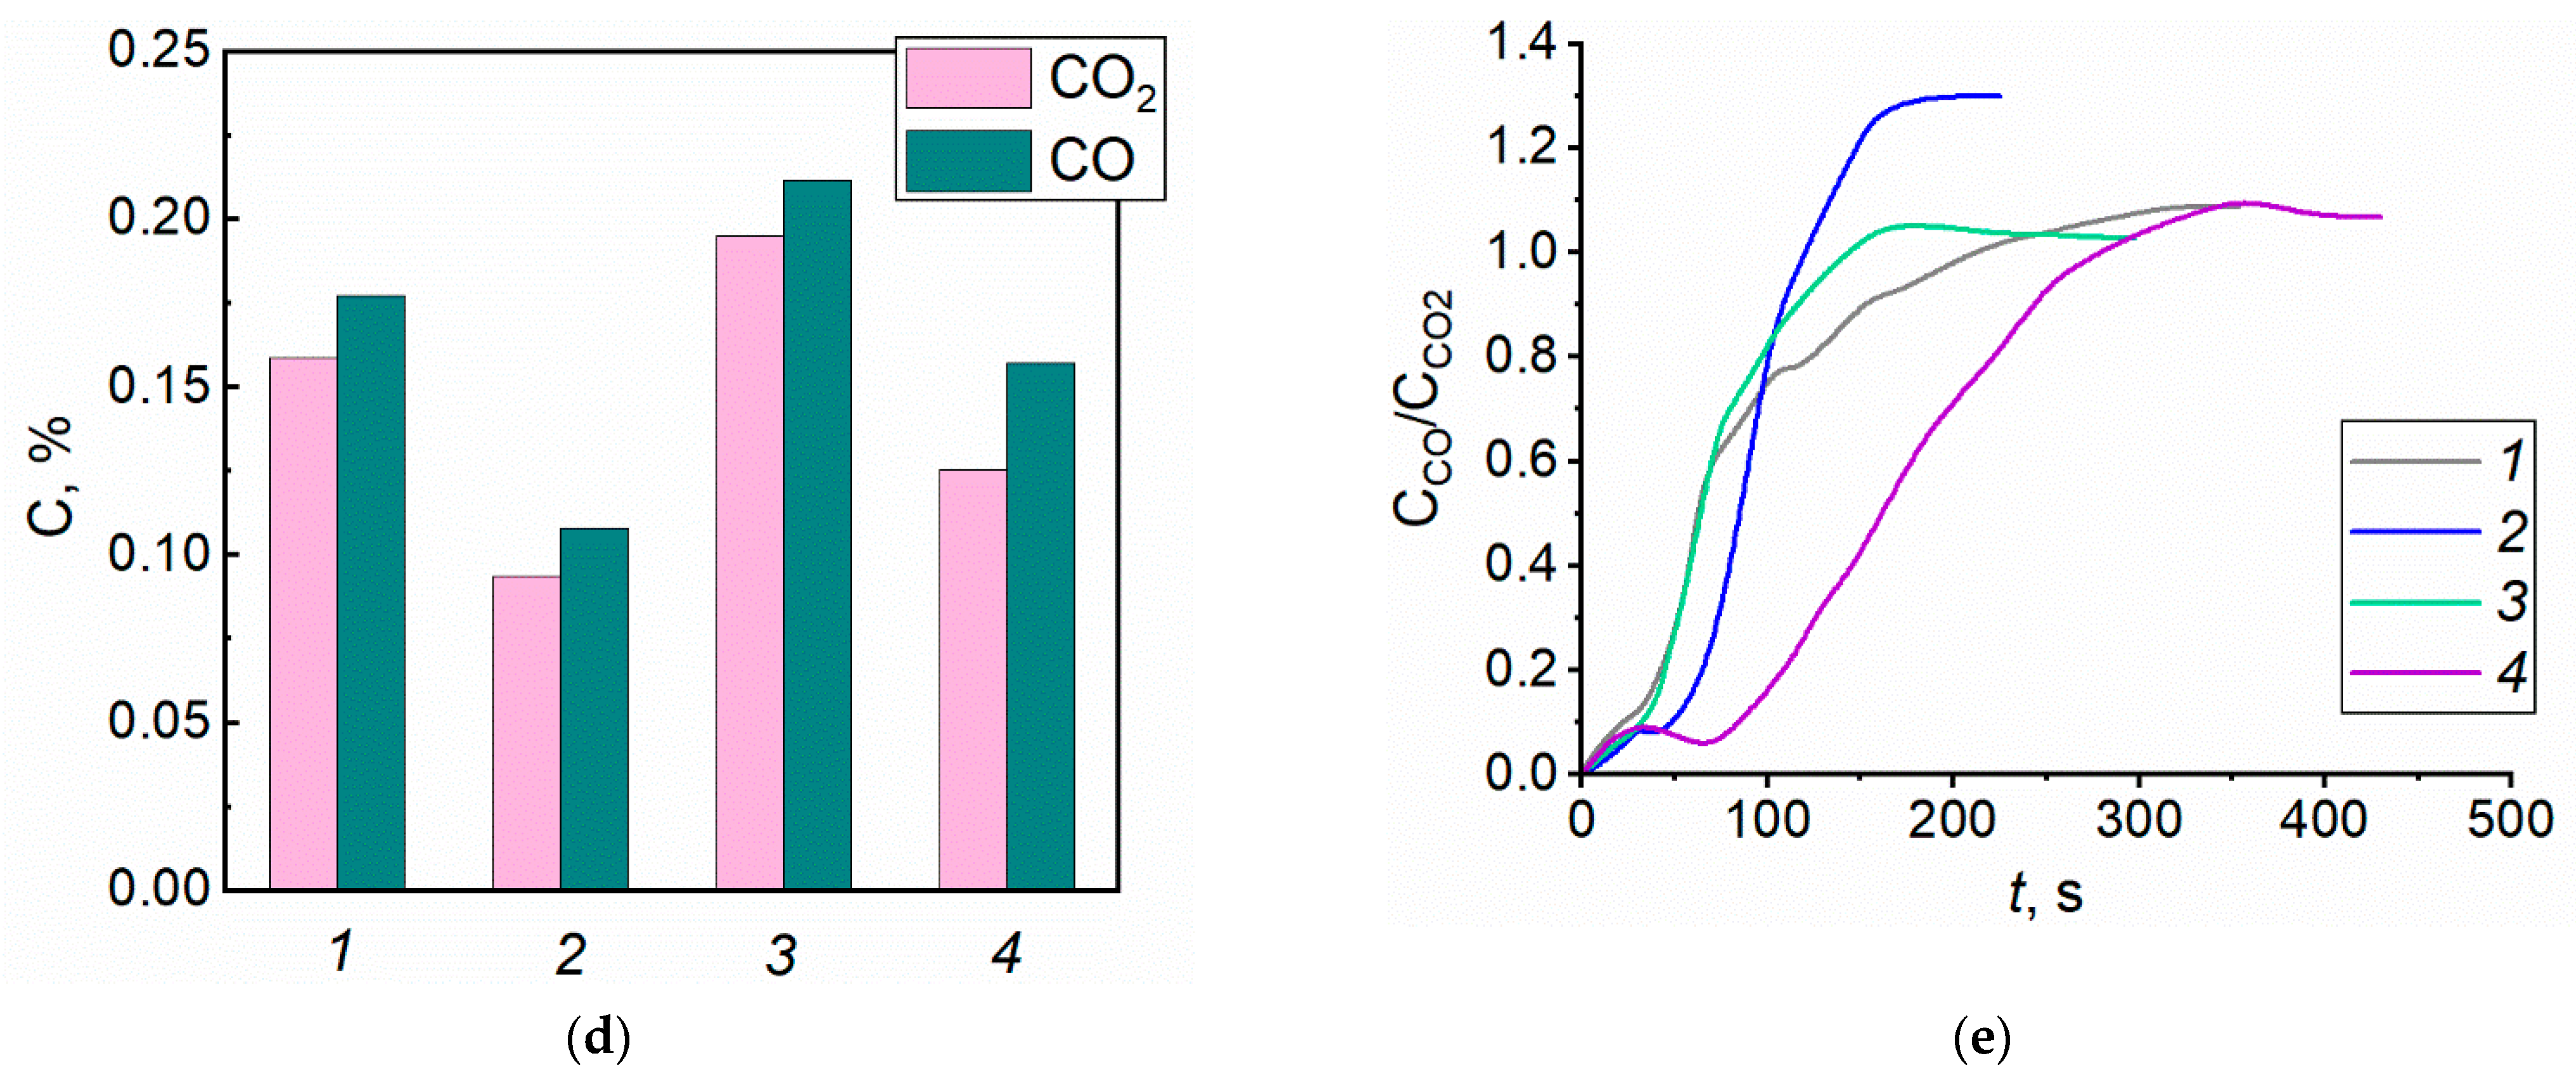
Figure 6a,b presents the trends of CO and CO2 concentrations produced in the interaction of different fire extinguishing compositions with burning materials. Figure 6d shows the average concentrations of carbon monoxide and dioxide during the extinguishment of timber with different fire extinguishing compositions. The experiments revealed that the composition of the fire extinguishing liquid made a significant contribution to the concentration ranges of the gaseous products of combustion. For instance, significant differences were recognized (Figure 6) between gas concentrations when spraying solutions, slurries, and emulsions. Thus, the maximum concentrations of CO and CO2 were recorded when laboratory-scale fires involving timber were extinguished with a bentonite slurry and a foaming agent solution. The lowest values were typical of extinguishing timber with a bischofite solution (Supplementary Materials Video S3), which can be explained by the different aspects of the interaction between fire extinguishing compositions and a forest fuel layer. A bentonite slurry interacting with combustible material remained on its surface and hardly penetrated into its deep layers. Thus, pyrolysis continues within the forest fuel frame (Figure 4a), and the CO concentrations keep rising. When a foaming agent solution was supplied to the fire, it spread on the material surface and, in contrast, penetrated into the sample layer due to the lower surface tension of this composition. As a result, the free surface of the timber was almost completely covered with the foaming agent solution. Thus, most of the gaseous products of combustion were released at the initial point in time.
As shown in Figure 6c, the lowest suppression times corresponded to the foaming agent solution (#2) and bischofite solution (#3) and did not exceed 100 s. Despite a lower discharge density, these compositions suppressed a fire 61% more effectively (in terms of extinguishment time) than water (#4) and bentonite slurry (#2) did. Figure 6e shows the ratios of carbon monoxide to carbon dioxide concentrations (CO/CO2) during the extinguishment of timber with different fire extinguishing compositions. At this stage of the thermal decomposition of the material, both of these gases were emitted. Thus, using the changing CO to CO2 ratio made it possible to estimate the ranges of these indicators when using water, a bentonite slurry, a bischofite solution, and a foaming agent solution. The CO to CO2 ratios had comparable ranges for different firefighting compositions.
Table 7 provides the yields (g/g) of CO and CO2 in the extinguishment of forest fuels with different firefighting compositions.
Table 7 shows that the yields (g/g) of CO and CO2 when extinguishing timber fires with a bentonite slurry were 73% higher than when using water. The lowest emissions were recorded when using a bischofite solution (63% lower than for water). The yields of CO and CO2 can be reduced by 28% when using a foaming agent instead of water.
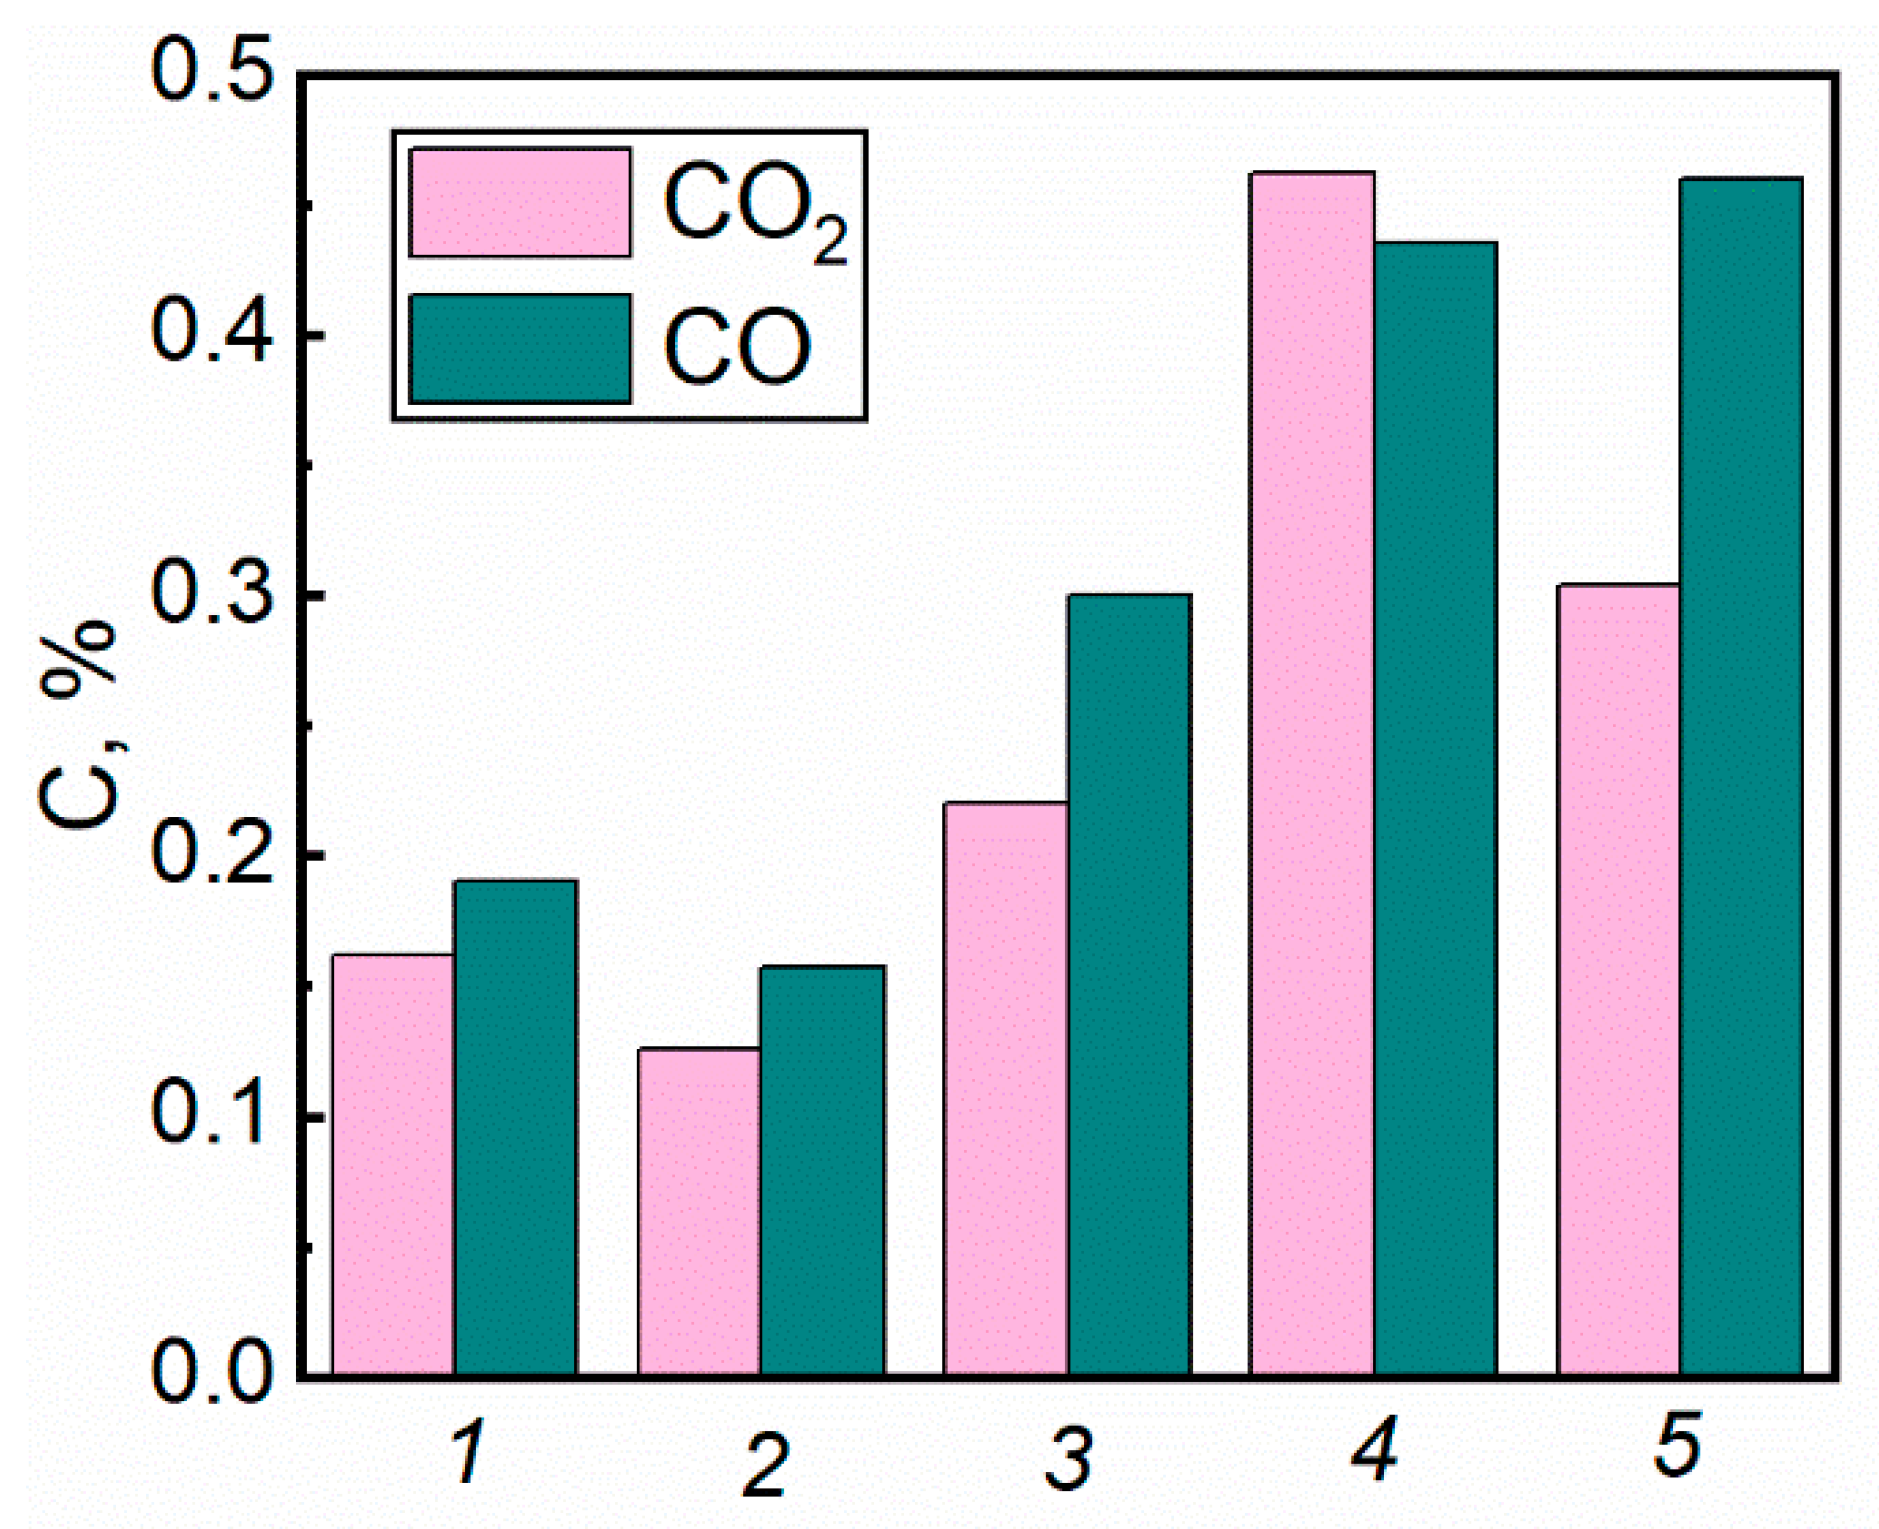
When different types of forest fuel (twigs, leaves, needles, and timber) were extinguished with water, some important aspects were understood (Figure 7). The highest average concentrations of CO and CO2 were in the suppression of burning needles and a mixture of forest fuels. This was caused by the highly heterogeneous structure of the layer of these materials, which led to intense thermal decomposition inside the material sample despite the application of liquid to the fire. For leaves, the average concentrations of flue gas components were slightly lower. When a sprayed water flow was in contact with the surface of leaves, a considerable volume of liquid settled in the near-surface layers at the initial point in time. In the deep layers, smoldering continues, accompanied by carbon monoxide production.

4.3. Relative Efficiency Indicators of Fire Extinguishing Agents

The obtained findings reveal that the trends of concentrations of the gaseous products of thermal decomposition and combustion of materials were significantly different for various types of forest fuels. In order to improve the efficiency of using firefighting compositions in terms of the time and volume of liquid spent to extinguish a fire, as well as anthropogenic emissions, the experimental findings were generalized using efficiency factors. The weighted sum method was employed to determine the fire extinguishing composition with the best performance based on the recorded parameters [41]. The best value was chosen within each recorded parameter: time of suppression, discharge density, and emission of gaseous products of pyrolysis and combustion. The lowest values in a set were considered the best ones for the above parameters. The efficiency factor was given by the following:
A n = w j x i j
where wj is the weighting factor of each parameter, xij is the normalized value of the parameter. All the weighting factors add up to 1.
There are different approaches to calculating the efficiency factor. The first one implies using equal weights for a group of factors. Such an approach helps evaluate the strengths and weaknesses of the fire extinguishing agents under investigation. The second approach relies on using unequal weighting factors. Such an approach evaluates the viability of a fire extinguishing agent for practical tasks in terms of the priority of a contributing factor.
Table 8 shows the absolute values of the criteria obtained in the experimental research for different fire extinguishing agents. For each criterion, the best value was chosen, and the other values were normalized for this criterion relative to this one. The normalized values are summed up in Table 9.
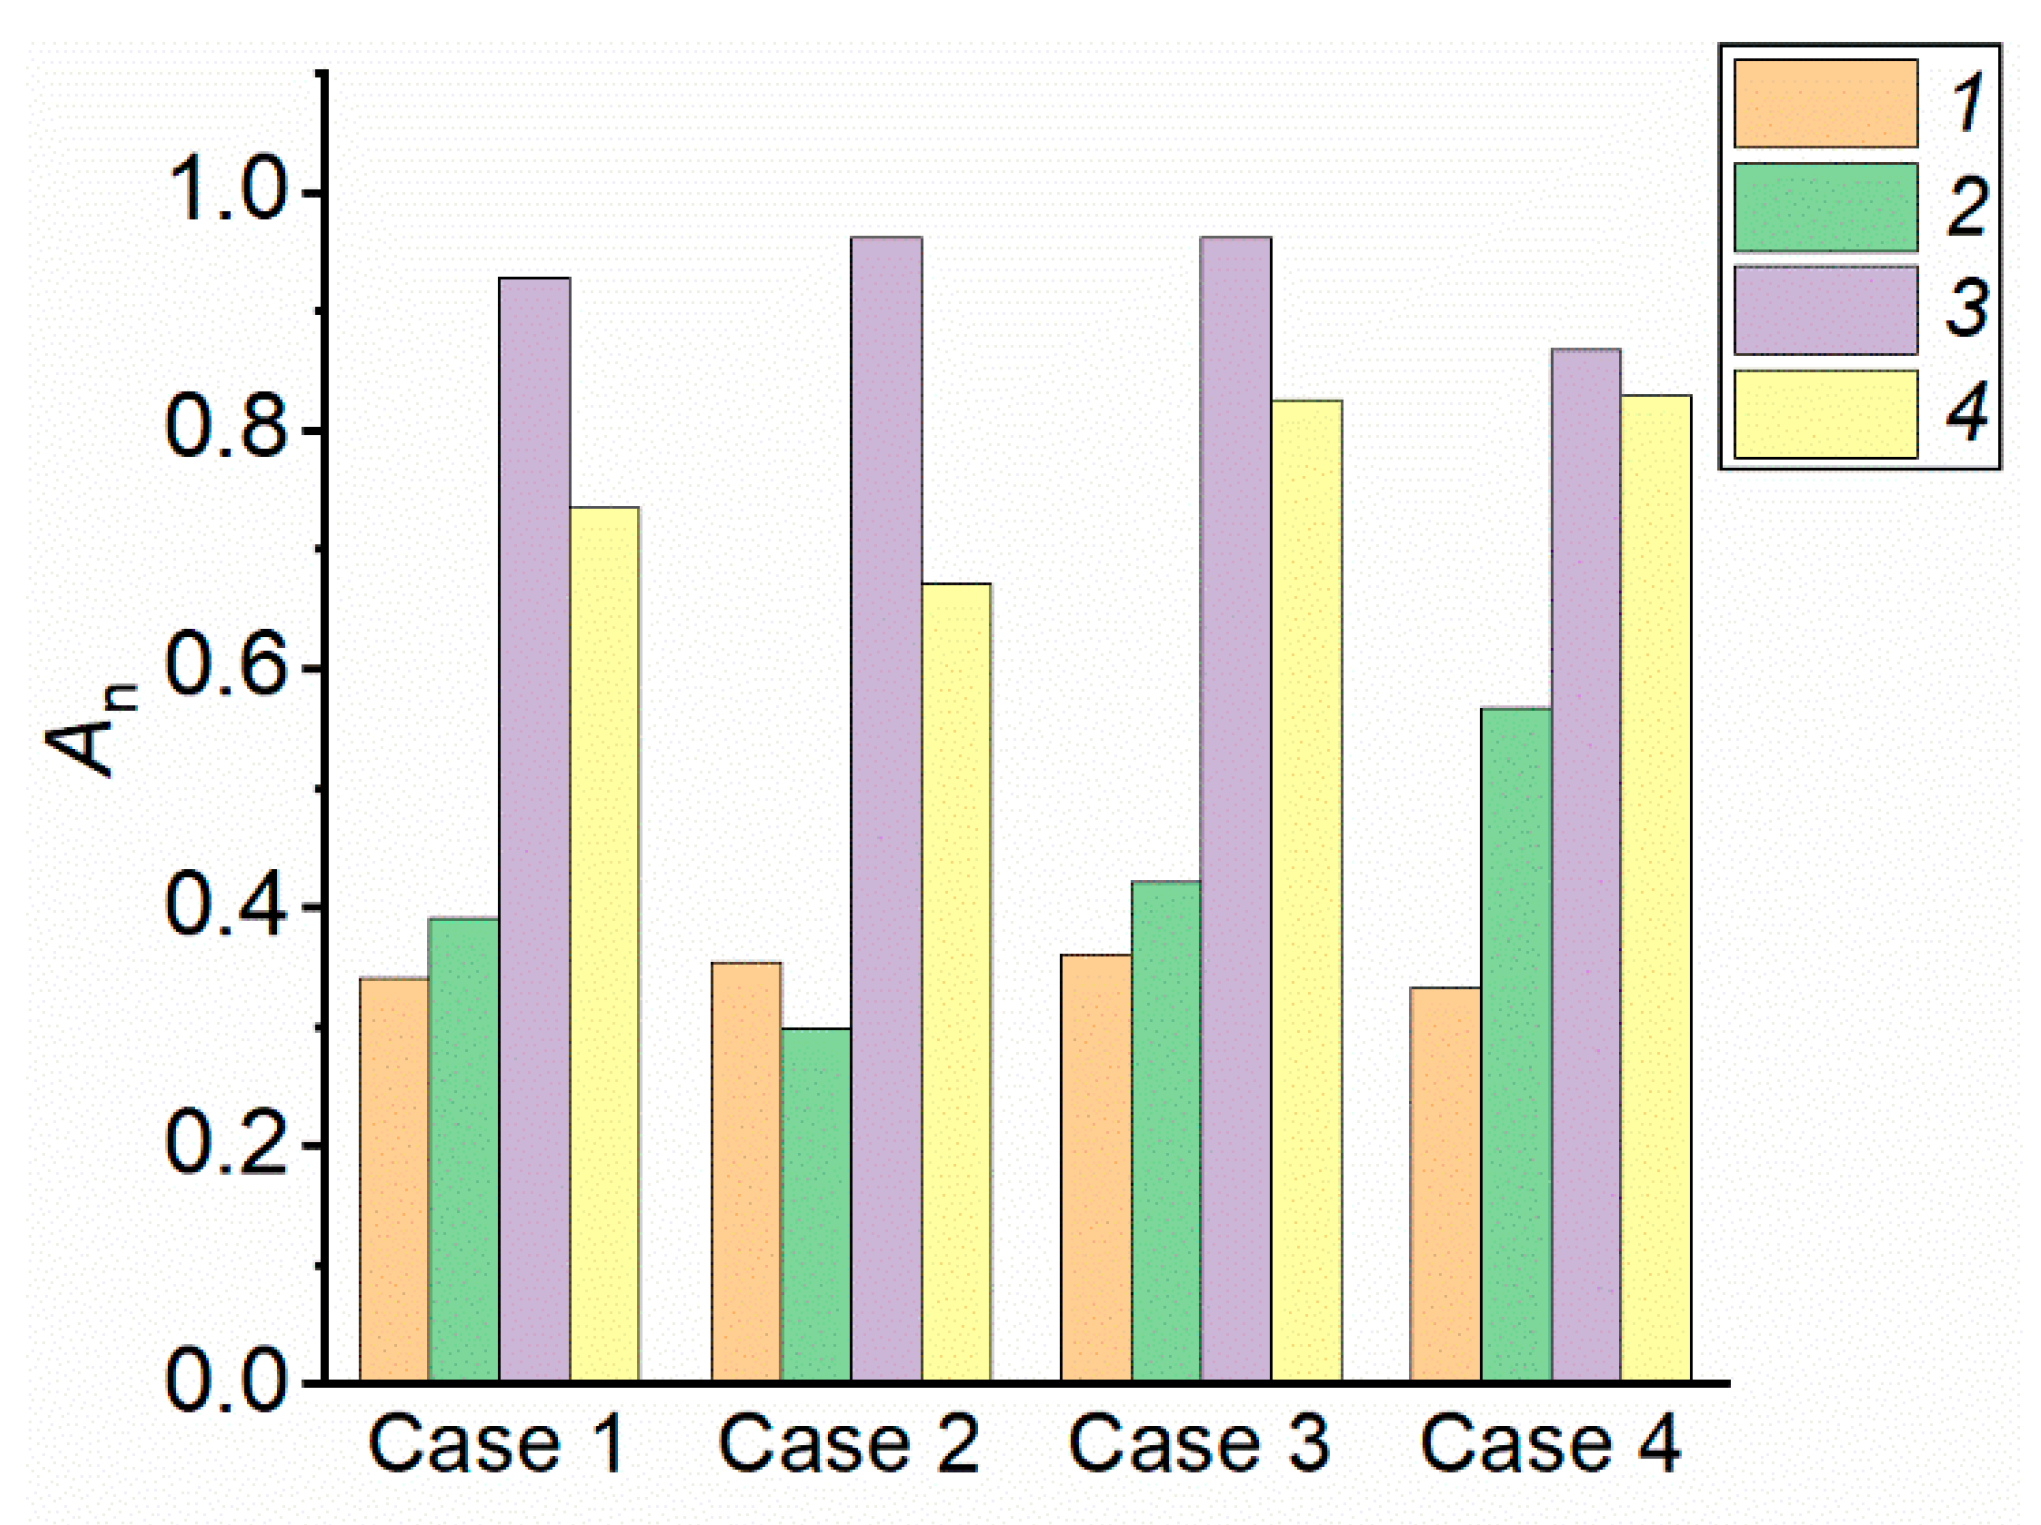
The calculations were performed for different firefighting compositions (Table 2) when varying the weighting factors and priority of using the composition (environmental friendliness, economic efficiency (in terms of time and materials spent on suppression)). The range of the efficiency factor (An) was determined for the conditions when the environment or saving material resources used for fire suppression is a top priority. Different weighting factors are possible. The following cases were considered: for equal weighting factors (case 1)—the sum of all weighting factors equals 1. Each summand of the equation (2) is assigned the value 0.25; case 2—the environmental protection is a priority. The sum of all weighting factors is 1. The maximum weighting factor (0.5) is assigned to environmental indicators. The remaining summands of the equation are assigned equal weighting factors (0.17); case 3—reducing the fire extinguishment time is a top priority (saving material resources used for fire suppression). The sum of all weighting factors is 1. The maximum weighting factor (0.5) is assigned to the time indicator. The remaining summands of the equation are assigned equal weighting factors (0.17); case 4—reducing the fire extinguishing liquid consumption is a top priority (saving material resources used for fire suppression). The sum of all weighting factors is 1. The maximum weighting factor (0.5) is assigned to the indicator characterizing the volumes of fire extinguishing liquid supplied. The remaining summands of the equation are assigned equal weighting factors (0.17). Figure 8 presents the efficiency factors of fire extinguishing agents (An) calculated for the cases described above.
Variations in the weighting factor changed the overall indicator by An 5–21% (Figure 8). Assigning the maximum weighting factor to the extinguishment time increased the An for a bischofite solution and foaming agent solution by 5–11% compared to the other cases. When environmental indicators (low toxic gas emissions) were a priority, the lowest efficiency factor belonged to a bentonite slurry. When the firefighting agent consumption was a priority, the maximum efficiency factor corresponded to a bischofite solution and the foaming agent solution, the lowest one—to water. For water and bischofite solution, there was no considerable difference when assigning the maximum weighting factors to environmental and economic indicators. The proposed method of calculating the efficiency factor of fire extinguishing agents can be applied to assess the quality of extinguishment with a certain liquid.

5. Conclusions

The findings presented in this research allow analyzing the dynamics of the release of gaseous substances from the thermal decomposition of typical forest fuels, which are the basis of forest cover, as well as the effect of firefighting liquids with varying properties and compositions on these processes. The conducted research enabled us to evaluate, to a first approximation, the performance of different water-based firefighting compositions in terms of the environment, economy, and energy (volumes of liquid necessary and sufficient to suppress a fire). The recorded trends provide deeper insight into the release of gaseous products of combustion when the thermal decomposition of forest fuel just begins and there is no intense combustion while the seat of fire is local with a low intensity of heat release. The differences identified in the concentrations of pyrolysis products in materials lay the foundation for the modeling of processes that occur in the boreal zone.
(i)
The conducted experiments demonstrated fundamental differences in the composition of forest fuel pyrolysis and combustion products with and without the application of promising fire extinguishing agents. Solutions, slurries, and emulsions were used. Utilizing two gas analysis systems provided important patterns of flue gas composition changes throughout the time during a burning forest fuel fire. The CO and CO2 concentrations for typical forest fuels (leaves, needles, twigs, a mixture of these, and timber) were found to differ by 35–52%.
(ii)
The comparison of continuous and cycling modes of applying fire extinguishing liquids to a forest fire revealed that the production of carbon monoxide and dioxide in cycling spraying is slightly higher (25–32%) than in continuous spraying. However, the amount of water required for extinguishment in cycling spraying is 1.4 times smaller. The firefighting liquid composition plays a decisive role. For instance, significant differences were identified between gas concentrations when spraying solutions, slurries, and emulsions. The emission factors of CO and CO2 when extinguishing timber fires with a bentonite slurry are 73% higher than when using water. The lowest emissions were recorded when a bischofite solution was used to extinguish fires involving timber. The yield of carbon monoxide and dioxide in this case was 63% lower than when water was used. The production of CO and CO2 can be reduced by 28% when using a foaming agent solution instead of water.
(iii)
When generalizing the experimental findings, wide ranges of efficiency factors were defined for different forest fuels and liquids applied. The efficiency factor varied in the range between 0.29 and 0.96. The created database of values can be used to choose the type and volume of extinguishing agent as well as the discharge technique, taking the requirements and priorities into account.

Supplementary Materials

The following supporting information can be downloaded at: https://www.mdpi.com/article/10.3390/f14040786/s1, Video S1: Video of the continuous suppression of timber fires. Video S2: Video of cycling suppression of timber fires. Video S3: Video of laboratory-scale fires under study at different combustion and suppression stages when using bischofite.

Author Contributions

Conceptualization, Writing—original draft, Writing—review and editing, P.S.; Methodology, Investigation, A.S.; Methodology, Investigation, Writing—original draft, V.D.; Investigation, Writing—original draft, Writing—review and editing, S.K. All authors have read and agreed to the published version of the manuscript.

Funding

This research was supported by the Russian Science Foundation (Project No. 21-19-00009, https://rscf.ru/en/project/21-19-00009/) accessed on 20 April 2021.

Conflicts of Interest

The authors declare no conflict of interest.

References

  1. Kumar, G.; Kumar, A.; Saikia, P.; Roy, P.S.; Khan, M.L. Ecological Impacts of Forest Fire on Composition and Structure of Tropical Deciduous Forests of Central India. Phys. Chem. Earth Parts A/B/C 2022, 128, 103240. [Google Scholar] [CrossRef]
  2. Bohórquez, L.; Gómez, I.; Santa, F. Methodology for the Discrimination of Areas Affected by Forest Fires Using Satellite Images and Spatial Statistics. Procedia Environ. Sci. 2011, 7, 389–394. [Google Scholar] [CrossRef] [Green Version]
  3. Yao, Q.; Fang, K.; Wang, Z. Fire History and Its Forcing in Northeastern Asia Boreal Forests. Nat. Hazards Res. 2022, 2, 166–171. [Google Scholar] [CrossRef]
  4. Bondur, V.G.; Tsidilina, M.N.; Kladov, V.L.; Gordo, K.A. Irregular Variability of Spatiotemporal Distributions of Wildfires and Emissions of Harmful Trace Gases in Europe Based on Satellite Monitoring Data. Dokl. Earth Sci. 2019, 485, 461–464. [Google Scholar] [CrossRef]
  5. Chew, Y.J.; Ooi, S.Y.; Pang, Y.H.; Wong, K.-S. A Review of Forest Fire Combating Efforts, Challenges and Future Directions in Peninsular Malaysia, Sabah, and Sarawak. Forests 2022, 13, 1405. [Google Scholar] [CrossRef]
  6. Lippok, D.; Beck, S.G.; Renison, D.; Gallegos, S.C.; Saavedra, F.V.; Hensen, I.; Schleuning, M. Forest Recovery of Areas Deforested by Fire Increases with Elevation in the Tropical Andes. For. Ecol. Manag. 2013, 295, 69–76. [Google Scholar] [CrossRef]
  7. Rakowska, J.; Szczygieł, R.; Kwiatkowski, M.; Porycka, B.; Radwan, K.; Prochaska, K. Application Tests of New Wetting Compositions for Wildland Firefighting. Fire Technol. 2017, 53, 1379–1398. [Google Scholar] [CrossRef] [Green Version]
  8. Rakowska, J.; Prochaska, K.; Twardochleb, B.; Rojewska, M.; Porycka, B.; Jaszkiewicz, A. Selection of Surfactants as Main Components of Ecological Wetting Agent for Effective Extinguishing of Forest and Peat-Bog Fires. Chem. Pap. 2014, 68, 823–833. [Google Scholar] [CrossRef]
  9. Guo, X.; Pan, X.; Zhang, L.; Hua, M.; Li, H.; Li, S.; Zhang, H. The Inhibitory Combustion Reaction Performance and Tail Gas Analysis of Composite Ultra-Fine Dry Powder Extinguishing Agent Containing Different Additives. J. Loss Prev. Process Ind. 2020, 65, 104153. [Google Scholar] [CrossRef]
  10. Andersson, B.; Blomqvist, P. Experimental Study of Thermal Breakdown Products from Halogenated Extinguishing Agents. Fire Saf. J. 2011, 46, 104–115. [Google Scholar] [CrossRef]
  11. Roberts, A.J.; Crowley, L.M.; Sadler, J.P.; Nguyen, T.T.T.; Gardner, A.M.; Hayward, S.A.L.; Metcalfe, D.B. Effects of Elevated Atmospheric CO2 Concentration on Insect Herbivory and Nutrient Fluxes in a Mature Temperate Forest. Forests 2022, 13, 998, Correction in Forests 2022, 13, 1216. [Google Scholar] [CrossRef]
  12. Ping, X.; Chang, Y.; Liu, M.; Hu, Y.; Huang, W.; Shi, S.; Jia, Y.; Li, D. Carbon Emission and Redistribution among Forest Carbon Pools, and Change in Soil Nutrient Content after Different Severities of Forest Fires in Northeast China. Forests 2022, 13, 110. [Google Scholar] [CrossRef]
  13. Bowman, D.M.J.S.; Balch, J.K.; Artaxo, P.; Bond, W.J.; Carlson, J.M.; Cochrane, M.A.; D’Antonio, C.M.; DeFries, R.S.; Doyle, J.C.; Harrison, S.P.; et al. Fire in the Earth System. Science 2009, 324, 481–484. [Google Scholar] [CrossRef] [PubMed]
  14. Mallongi, A.; Indra, R.; Arief, M.K.M.; Fais Satrianegara, M. Environmental Pollution and Health Problems Due to Forest Fires with CO2 Parameters. Med.-Leg. Updat. 2020, 20, 888–892. [Google Scholar]
  15. Xu, D.; Huang, G.; Guo, L.; Chen, Y.; Ding, C.; Liu, C. Enhancement of Catalytic Combustion and Thermolysis for Treating Polyethylene Plastic Waste. Adv. Compos. Hybrid Mater. 2022, 5, 113–129. [Google Scholar] [CrossRef]
  16. Mlonka-Mędrala, A.; Evangelopoulos, P.; Sieradzka, M.; Zajemska, M.; Magdziarz, A. Pyrolysis of Agricultural Waste Biomass towards Production of Gas Fuel and High-Quality Char: Experimental and Numerical Investigations. Fuel 2021, 296, 120611. [Google Scholar] [CrossRef]
  17. Hoque, M.E.; Rashid, F.; Aziz, M. Gasification and Power Generation Characteristics of Rice Husk, Sawdust, and Coconut Shell Using a Fixed-Bed Downdraft Gasifier. Sustainability 2021, 13, 2027. [Google Scholar] [CrossRef]
  18. Hoque, M.; Rashid, F.; Prodhan, M.; Arman, A. Analysis of Energy Consumption and Efficiency to Reduce Power Losses in Industrial Equipment. In Proceedings of the International Conference on Mechanical Engineering, Dhaka, Bangladesh, 23–24 December 2017; pp. 18–20. [Google Scholar]
  19. Dhall, A.; Dhasade, A.; Nalwade, A.; VK, M.R.; Kulkarni, V. A Survey on Systematic Approaches in Managing Forest Fires. Appl. Geogr. 2020, 121, 102266. [Google Scholar] [CrossRef]
  20. Kim, H.-S.; Noulèkoun, F.; Noh, N.-J.; Son, Y.-W. Future Projection of CO2 Absorption and N2O Emissions of the South Korean Forests under Climate Change Scenarios: Toward Net-Zero CO2 Emissions by 2050 and Beyond. Forests 2022, 13, 1076. [Google Scholar] [CrossRef]
  21. Mamkin, V.; Varlagin, A.; Yaseneva, I.; Kurbatova, J. Response of Spruce Forest Ecosystem CO2 Fluxes to Inter-Annual Climate Anomalies in the Southern Taiga. Forests 2022, 13, 1019. [Google Scholar] [CrossRef]
  22. Jia, J.; Huang, R.; Wang, Y. Study on the Combustion Characteristics of Mountain Forest Vegetation. Forests 2022, 13, 1443. [Google Scholar] [CrossRef]
  23. Nestola, E.; Sgrigna, G.; Pallozzi, E.; Caccavale, L.; Guidolotti, G.; Calfapietra, C. Experimental Characterization of Particulate and Gaseous Emissions from Biomass Burning of Six Mediterranean Species and Litter. Forests 2022, 13, 322. [Google Scholar] [CrossRef]
  24. Barboni, T.; Leonelli, L.; Santoni, P.-A.; Tihay-Felicelli, V. Study of the Burning of Pteridium Aquilinum L. and Risk for the Personnel Involved: Thermal Properties and Chemical Risk. Fire Saf. J. 2019, 110, 102904. [Google Scholar] [CrossRef]
  25. Barboni, T.; Leonelli, L.; Santoni, P.-A.; Tihay-Felicelli, V. Aerosols and Carbonaceous and Nitrogenous Compounds Emitted during the Combustion of Dead Shrubs According to Twigs’ Diameter and Combustion Phases. Fire Saf. J. 2020, 113, 102988. [Google Scholar] [CrossRef]
  26. Ma, Y.; Yang, S.; Zhu, Z.; Wang, G.; Tigabu, M.; Guo, Y.; Zheng, W.; Guo, F. Emissions of Gaseous Pollutants Released by Forest Fire in Relation to Litter Fuel Moisture Content. Atmos. Environ. 2022, 284, 119215. [Google Scholar] [CrossRef]
  27. Pallozzi, E.; Lusini, I.; Cherubini, L.; Hajiaghayeva, R.A.; Ciccioli, P.; Calfapietra, C. Differences between a Deciduous and a Conifer Tree Species in Gaseous and Particulate Emissions from Biomass Burning. Environ. Pollut. 2018, 234, 457–467. [Google Scholar] [CrossRef]
  28. Zhang, H.; Li, H.; Liu, X.; Ma, Y.; Zhou, Q.; Sa, R.; Zhang, Q. Emissions Released by Forest Fuel in the Daxing’an Mountains, China. Forests 2022, 13, 1220. [Google Scholar] [CrossRef]
  29. Li, Y.Z.; Ingason, H. Influence of Fire Suppression on Combustion Products in Tunnel Fires. Fire Saf. J. 2018, 97, 96–110. [Google Scholar] [CrossRef] [Green Version]
  30. Kropotova, S.S.; Kuznetsov, G.V.; Strizhak, P.A. Identifying Products of Pyrolysis and Combustion of Materials at Incipient Stages of Fires. Fire Saf. J. 2022, 132, 103643. [Google Scholar] [CrossRef]
  31. Antonov, D.V.; Volkov, R.S.; Voitkov, I.S.; Zhdanova, A.O.; Kuznetsov, G. V Influence of Special Additives in a Water Aerosol on the Suppression of a Forest Fire with It. J. Eng. Phys. Thermophys. 2018, 91, 1250–1259. [Google Scholar] [CrossRef]
  32. Atroshenko, Y.K.; Kuznetsov, G.V.; Strizhak, P.A.; Volkov, R.S. Protective Lines for Suppressing the Combustion Front of Forest Fuels: Experimental Research. Process Saf. Environ. Prot. 2019, 131, 73–88. [Google Scholar] [CrossRef]
  33. Kuznetsov, G.V.; Islamova, A.G.; Orlova, E.G.; Strizhak, P.A.; Feoktistov, D. V Physicochemical Features of the Effect of Special Water-Based Fire Retardants on Forest Materials. Fire Saf. J. 2021, 123, 103371. [Google Scholar] [CrossRef]
  34. Zhdanova, A.; Islamova, A.; Kurapov, R.; Volkov, R. Evaporation of Promising Fire Extinguishing Agent Droplets. Forests 2023, 14, 301. [Google Scholar] [CrossRef]
  35. Kuznetsov, G.V.; Kropotova, S.S.; Voytkov, I.S.; Strizhak, P.A. Influence of the Component Composition of Extinguishing Fluids on the Droplet Distribution in an Aerosol Cloud. Powder Technol. 2022, 395, 838–849. [Google Scholar] [CrossRef]
  36. Dorokhov, V.V.; Kuznetsov, G.V.; Nyashina, G.S.; Strizhak, P.A. Composition of a Gas and Ash Mixture Formed during the Pyrolysis and Combustion of Coal-Water Slurries Containing Petrochemicals. Environ. Pollut. 2021, 285, 117390. [Google Scholar] [CrossRef]
  37. Dombrovsky, L.A.; Levashov, V.Y.; Kryukov, A.P.; Dembele, S.; Wen, J.X. A Comparative Analysis of Shielding of Thermal Radiation of Fires Using Mist Curtains Containing Droplets of Pure Water or Sea Water. Int. J. Therm. Sci. 2020, 152, 106299. [Google Scholar] [CrossRef]
  38. Gupta, M.; Rajora, R.; Sahai, S.; Shankar, R.; Ray, A.; Kale, S.R. Experimental Evaluation of Fire Suppression Characteristics of Twin Fluid Water Mist System. Fire Saf. J. 2012, 54, 130–142. [Google Scholar] [CrossRef]
  39. Fateh, T.; Richard, F.; Batiot, B.; Rogaume, T.; Luche, J.; Zaida, J. Characterization of the Burning Behavior and Gaseous Emissions of Pine Needles in a Cone Calorimeter–FTIR Apparatus. Fire Saf. J. 2016, 82, 91–100. [Google Scholar] [CrossRef]
  40. Vicente, A.; Alves, C.; Calvo, A.I.; Fernandes, A.P.; Nunes, T.; Monteiro, C.; Almeida, S.M.; Pio, C. Emission Factors and Detailed Chemical Composition of Smoke Particles from the 2010 Wildfire Season. Atmos. Environ. 2013, 71, 295–303. [Google Scholar] [CrossRef]
  41. Glushkov, D.O.; Nyashina, G.S.; Anand, R.; Strizhak, P.A. Composition of Gas Produced from the Direct Combustion and Pyrolysis of Biomass. Process Saf. Environ. Prot. 2021, 156, 43–56. [Google Scholar] [CrossRef]
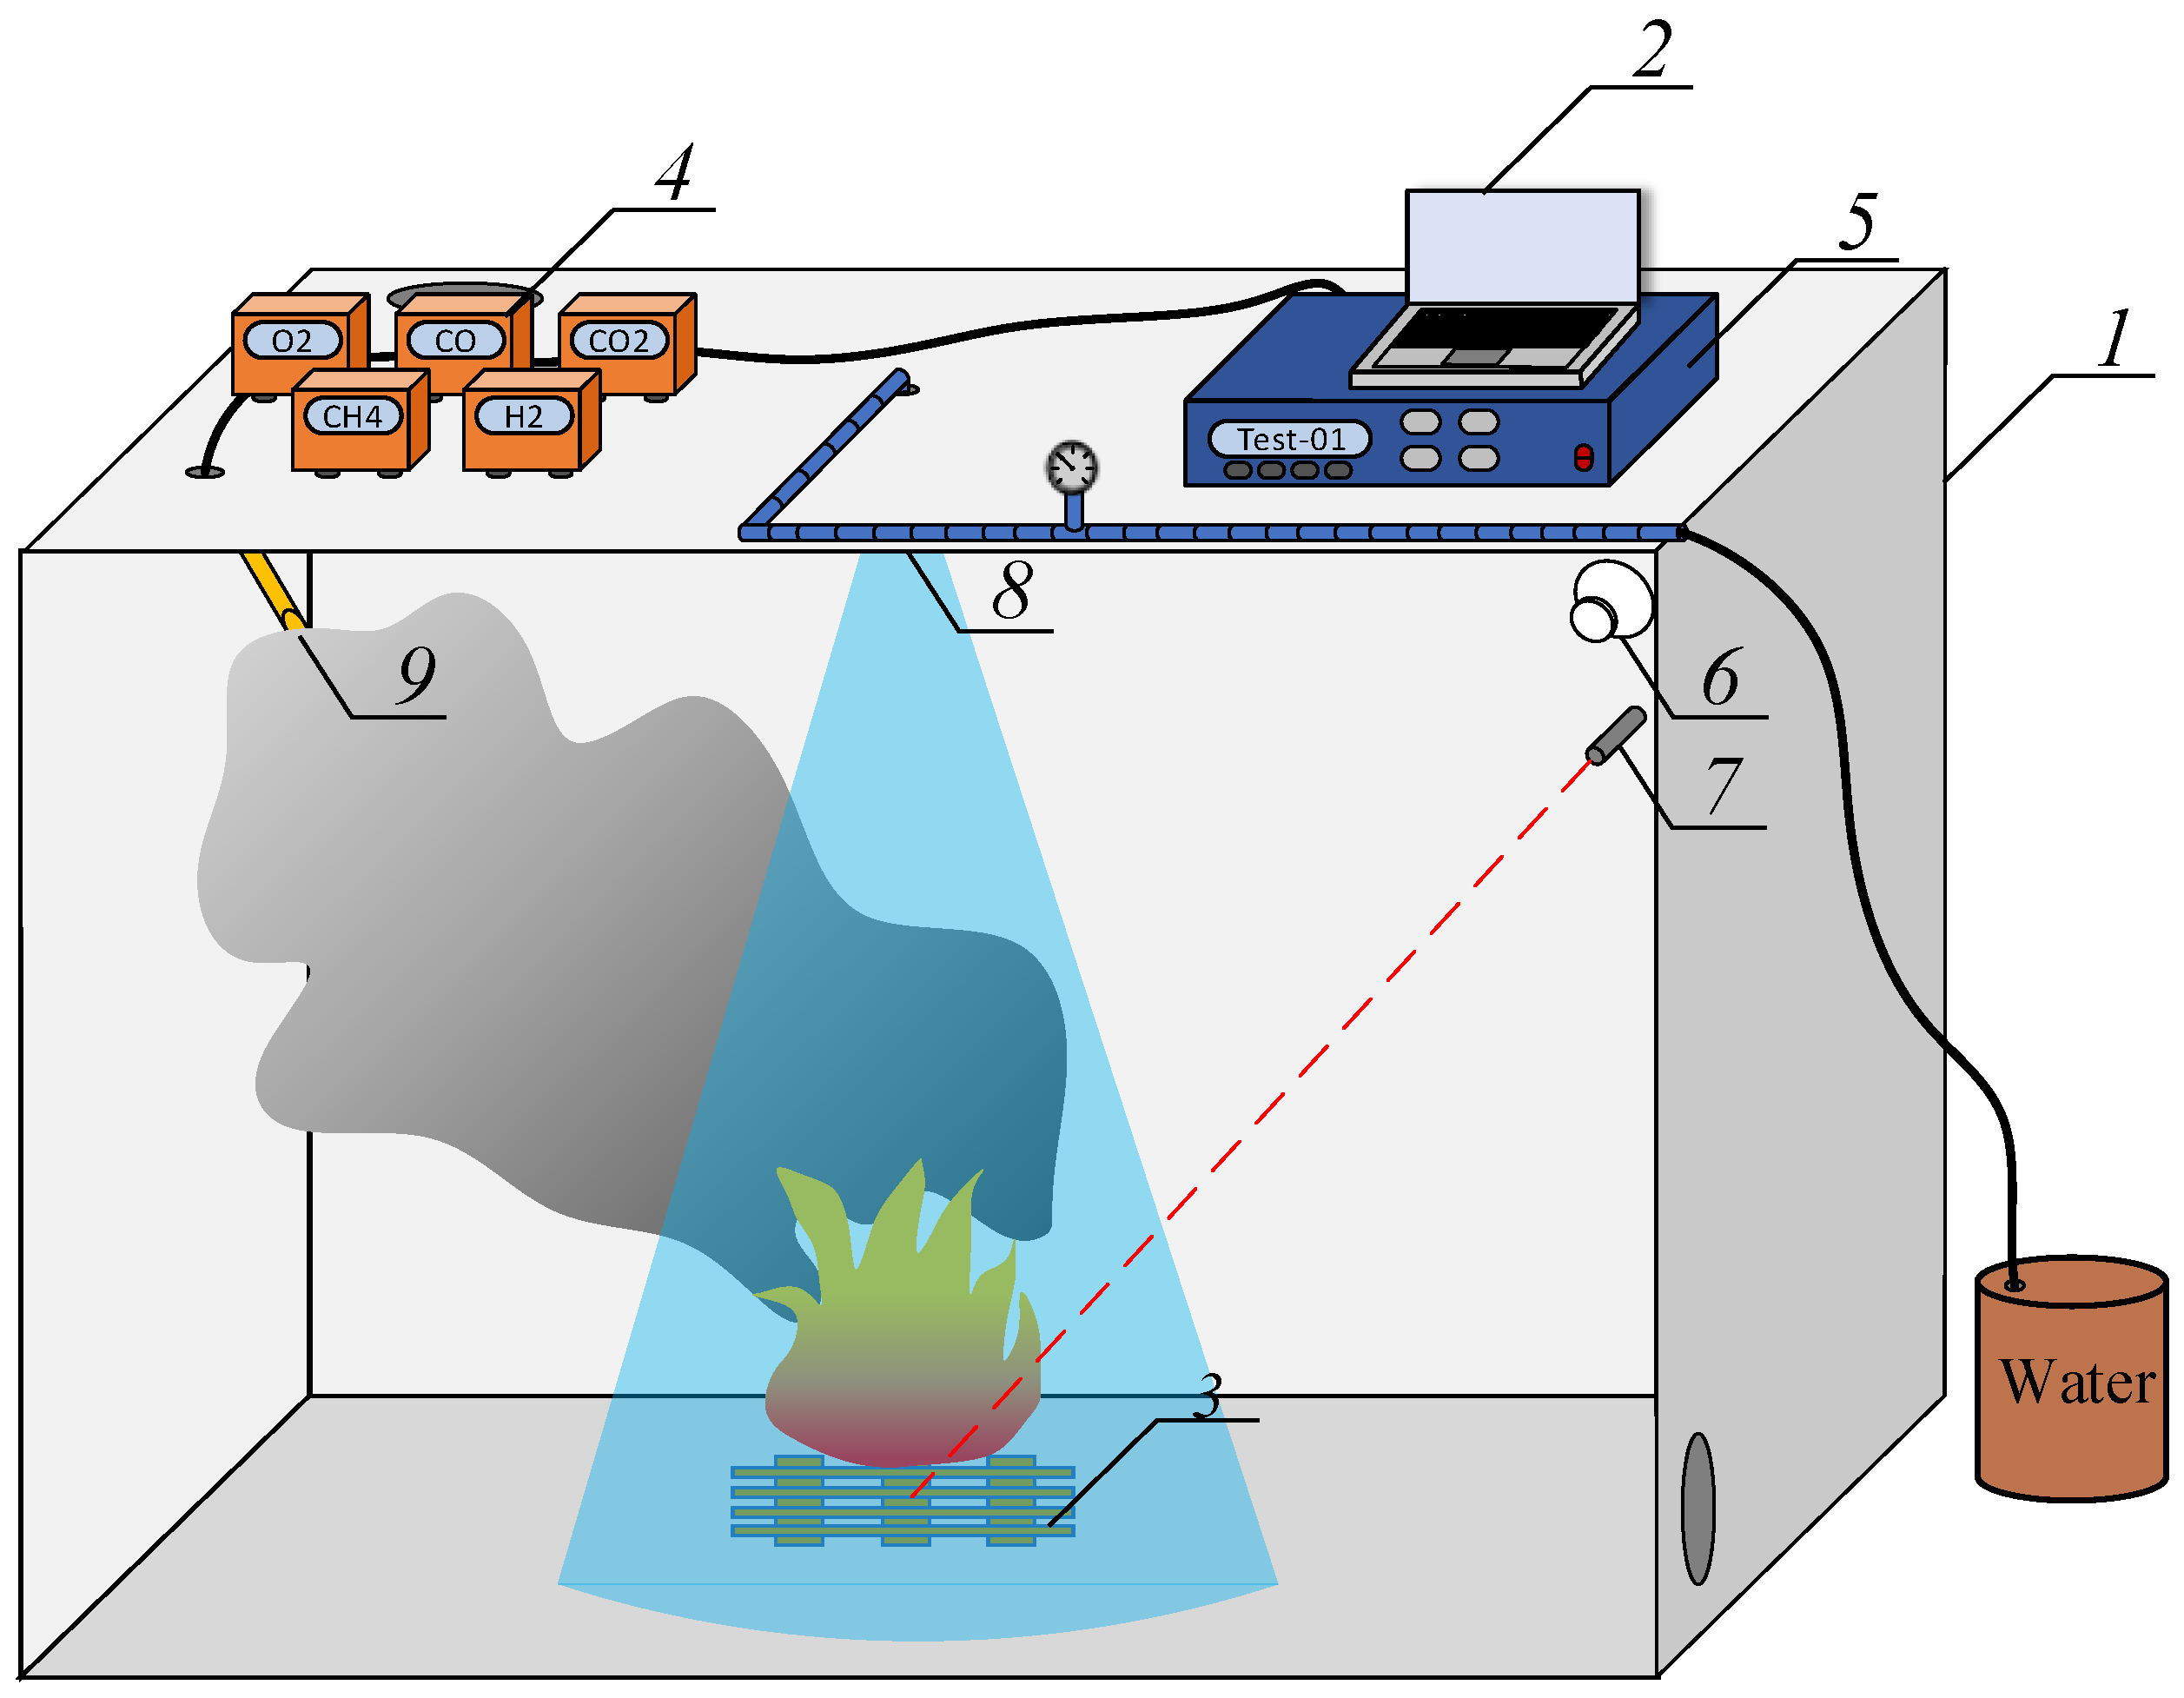
Figure 1. Experimental setup: 1—box with dimensions 1.5 × 1 × 1.25 m; 2—PC; 3—laboratory-scale fire; 4—industrial sensors; 5—laboratory gas analyzer; 6—dome camera; 7—high-speed pyrometer; 8—nozzle; and 9—gas analyzer probe.
Forests 14 00786 g001
Figure 2. Images of laboratory-scale fires at different combustion stages: I—combustible material sample at the initial point (before ignition); II—active combustion; and III—decay and smoldering; IV—release of combustion products stops. (a)—branches; (b)—timber; (c)—leaves; (d)—needles; and (e)—mixture of forest fuels.
Forests 14 00786 g002aForests 14 00786 g002b
Figure 3. Trends of CO2 (a) and CO (b) recorded during the combustion of typical forest fuels: 1,6—twigs; 2,7—timber; 3,8—leaves; 4,9—needles; and 5,10—mixture of forest fuels. 15—concentrations of CO and CO2 measured with a laboratory gas analyzer; 610—concentrations of CO and CO2 measured with industrial sensors; 11—research findings [39] obtained for pine needles. Average concentrations of flue gas components (c): 1—twigs; 2—timber; 3—leaves; 4—needles; and 5—mixture of forest fuels. P—ignition of the material using a gas burner, II—active flame combustion phase, and III—smoldering phase. (d) curves of the air temperature in the experimental box during combustion of different types of forest fuel.
Forests 14 00786 g003
Figure 4. Images of laboratory-scale fires under investigation at different combustion and suppression stages: I—active combustion; II—suppression; III—smoldering; and IV—completion of combustion product release: (a)—bentonite; (b)—bischofite; (c)—foaming agent; and (d)—water.
Forests 14 00786 g004
Figure 5. Trends of CO2 and CO (a) recorded in the cycling and continuous suppression of timber fires. Average concentrations of CO2 and CO (b): 1—continuous water supply; 2—cycling spraying.
Forests 14 00786 g005
Figure 6. Trends of CO2 (a) and CO (b) recorded in the suppression of laboratory-scale timber fires using different fire extinguishing compositions. (c) Suppression times of laboratory-scale timber fires using different fire extinguishing compositions. (d) Average concentrations of flue gas components during the suppression of burning timber with different fire extinguishing compositions. CO/CO2 ratios in the suppression of burning timber with different fire extinguishing compositions (e): 1—bentonite slurry; 2—bischofite solution; 3—foaming agent solution; and 4—water.
Forests 14 00786 g006aForests 14 00786 g006b
Figure 7. Average concentrations of flue gas components produced by the extinguishment of different types of forest fuels with water, as follows: 1—twigs; 2—timber; 3—leaves; 4—needles; and 5—mixture of forest fuels.
Forests 14 00786 g007
Figure 8. Relative efficiency factor of fire extinguishing agents when varying the weighting factors: 1—water; 2—bentonite slurry; 3—bischofite solution; and 4—foaming agent solution.
Forests 14 00786 g008
Table 1. Forest fuel characteristics.
Forest FuelComponentLayer Density, kg/m3Particle Density, kg/m3Porosity
(Fraction of Pores)
PineTwigs with needles0.05–0.12320–5000.583
Pine needlesneedles306500.794
Leavesleaves8–123000.787
Timber (pine)Timber4484480.7
Table 2. Properties of components and solutions, slurries, and emulsions prepared [35].
Name of CompositionProperties of Additives and Fire Extinguishing Agents Prepared Fire Suppression Method
WaterDensity: 998.2 kg/m3
Surface tension: 72.7 × 10⁻³ N/m
Dynamic viscosity: 1.004 × 10⁻³ Pa·s
Thermal diffusivity: 14.3 × 10⁻⁸ m2/s
Heat capacity: 4.183 kJ/(kg·K)
Thermal conductivity: 0.599 W/(m·K)
Average ability to remain on forest fuel: 60.5%
Cooling
Foaming agent solution (AFFF)
5 vol%
Properties of the 5% solution:
Density: 1002–1187 kg/m3.
Dynamic viscosity: 0.12 Pa·s
Surface tension: 17.3 × 10⁻³ N/m
Thermal diffusivity: 12.9 × 10⁻⁶ m2/s
Heat capacity: 3.995 kJ/(kg·K)
Thermal conductivity: 0.595 W/(m·K)
Foam stability: 250 s.
Average ability to remain on forest fuel: 74.5%
Cooling, smothering
Bentonite slurry
5 vol%
Fire protection efficiency group I
melting point >1250 °C
Properties of the 5% solution:
Density: 1100 kg/m3
Surface tension: 68.5 × 10⁻³ N/m
Dynamic viscosity: 24.3 × 10⁻³ Pa·s
Thermal diffusivity: 5.44 × 10⁻⁴ m2/s
Heat capacity: 3.83 kJ/(kg·K)
Thermal conductivity: 0.704 W/(m·K)
Smothering
Bischofite solution
10 vol%
Fire protection efficiency group I
Properties of the 10% solution:
Thermal conductivity: 0.58 W/(m·K)
Heat capacity: 3.603 kJ/(kg·K)
Density: 1081.49 kg/m3
Dynamic viscosity: 1.015 × 10⁻³ Pa·s
Surface tension: 75.8 × 10⁻³ N/m
Smothering
Table 3. Characteristics of the gas analyzer.
Component of Gas-Air MixtureTypes of SensorsMeasurement RangeAccuracyReaction Time
O2electrochemical0%–25%±0.2 vol% (absolute)≤15 s
H2polarographic0%–5%±0.2 vol% (absolute)≤35 s
CO2optical0%–30%±2% (basic percentage error)≤25 s
CH4optical0%–30%±5% (relative)≤25 s
COelectrochemical0%–30%±5% (relative)≤35 s
H2Selectrochemical0–500 ppm±5% (relative)≤45 s
SO2electrochemical0–1000 ppm±5% (relative)≤45 s
Table 4. Main metrological characteristics of the Senson-SV-5023 gas analyzer sensors.
Type of DetectorMeasurement RangeMaximum Permissible Relative Error, δ %
Carbon dioxide (CO2)0.01–5 vol%±15
Carbon monoxide (CO)0.1–300 mg/m3±10
Methane (CH4)0.01–2.5 vol%±10
Oxygen (O2)0.1–30 vol%±5
Hydrogen (H2)0.01–4 vol%±10
Table 5. Yields of pyrolysis and combustion products from forest fuel.
Material CO, g/gCO2, g/g
Twigs0.7140.676
Timber0.3750.491
Needles0.8220.636
Leaves0.2080.181
Mixture0.1270.177
Table 6. Yields of pyrolysis and combustion products of timber when spraying water using different techniques.
Water Discharge TechniqueCO Yield, g/gCO2 Yield, g/gte, sDischarge Density, l/(m2·s)
Cycling water discharge0.2050.2211807.96
Continuous spraying0.1530.15025011.06
Table 7. Yields of pyrolysis and combustion products of forest fuel extinguished with fire extinguishing agents.
MaterialWaterBentonite SlurryBischofite SolutionFoaming Agent Solution
CO, g/gCO2, g/gCO, g/gCO2, g/gCO, g/gCO2, g/gCO, g/gCO2, g/g
Twigs0.5680.456
Timber0.1530.1500.5820.5510.0570.0450.1090.105
Needles0.1690.258
Leaves0.1810.149
Mixture0.1290.106
Table 8. Efficiency criteria of fire extinguishing agents.
CriteriaWaterBentonite SlurryBischofite SolutionFoaming Agent Solution
Extinguishing time, s2442029596
CO yield, g/g0.1530.5820.0570.109
CO2 yield, g/g0.150.5510.0450.105
Discharge density, l/(m2·s)10.83.64.63.3
Table 9. Normalized criteria for fire extinguishing agent efficiency evaluation.
CriteriaWaterBentonite SlurryBischofite SolutionFoaming Agent Solution
Extinguishing time, s0.390.4710.99
CO yield, g/g0.370.09810.52
CO2 yield, g/g0.30.08210.43
Discharge density, l/(m2·s)0.310.920.721
Disclaimer/Publisher’s Note: The statements, opinions and data contained in all publications are solely those of the individual author(s) and contributor(s) and not of MDPI and/or the editor(s). MDPI and/or the editor(s) disclaim responsibility for any injury to people or property resulting from any ideas, methods, instructions or products referred to in the content.