Article

Quantification of Hydrolytic Sugars from Eucalyptus globulus Bio-Oil Aqueous Solution after Thermochemical Liquefaction

1
Centro de Química Estrutural, Institute of Molecular Sciences, Faculdade de Ciências, Universidade de Lisboa, Campo Grande, 1749-016 Lisboa, Portugal
2
CERENA—Centre for Natural Resources and the Environment, Instituto Superior Técnico, Av. Rovisco Pais, 1049-001 Lisboa, Portugal
3
C5Lab—Sustainable Construction Materials Association, Instituto Superior Técnico, Av. Rovisco Pais, 1049-001 Lisboa, Portugal
*
Author to whom correspondence should be addressed.
Forests 2023, 14(4), 799; https://doi.org/10.3390/f14040799
Submission received: 6 March 2023 / Revised: 28 March 2023 / Accepted: 11 April 2023 / Published: 13 April 2023
(This article belongs to the Special Issue Development and Utilization of High-Value Products from Woody Biomass)

Abstract

:
Eucalyptus globulus sawdust is a residue from the pulp and paper industry which has been underutilised and undervalued. The thermochemical liquefaction of sawdust can be considered an alternative for recycling this residue, as it results in the production of a bio-oil that, when extracted in water, allows the obtention of an aqueous solution composed of carbohydrates. The sugars resulting from the aqueous fraction of bio-oil can be valued by and applied in the industry to produce sustainable materials. For the first time, the sugar composition of the aqueous extract of bio-oil was disclosed, identified, and quantified by a high-pressure liquid chromatograph (HPLC) coupled to a refractive index (RID) detector containing fructose (36.58%) and glucose (33.33%) as the main components, sucrose (15.14%), trehalose (4.82%) and xylose (10.13%). The presence of these sugars was further confirmed by two-dimensional (2D) 1H-13C heteronuclear single-quantum correlation–nuclear magnetic resonance (HSQC–NMR) spectroscopy. Fourier-transform infrared (FTIR-ATR) and elemental analyses were also used. In addition, the pathway leading to the identified sugars is also suggested.

1. Introduction

World energy consumption is expected to grow by 56%, with fossil fuels accounting for around 80% of total demand. Energy consumption using renewable sources is expected to grow by 2.5% annually. The limit of renewable resources is constantly changing, and negotiations are currently underway in the European Union to increase it from 40% to 45% by 2030. Global demand for coal as an energy source is also expected to stabilise by 2035 due to environmental policies of carbon sequestration and the mitigation of atmospheric emissions of greenhouse gases [1]. In this context, biomass can be seen as an option to contribute to sharing renewable resources for bioenergy and the production of biomaterials, providing benefits for society and industry.
Lignocellulosic biomass from wood residues has gained considerable interest in the industry regarding its use as a raw material for obtaining sustainable materials with added economic value [2]. Eucalyptus globulus represents one of the primary raw materials for Portugal’s pulp and paper industry. Waste generated by the cellulose industry, such as bark, has been burned for energy production [3]. Therefore, these residues are not valued in industrial processes that use lignocellulosic biomass. Eucalyptus has been considered a renewable raw material source for producing paper and other wood-based products due to its high productivity in crops, low moisture content, and ease of harvesting [4]. However, many eucalyptus residues can be converted into fuels and carbon sources through chemical processes such as thermochemical liquefaction [5].
Thermochemical liquefaction for bio-oil production is a promising technique to valorise biomass [6]. During thermochemical liquefaction, the lignocellulosic structure is broken into smaller molecules that can be used in other applications [7]. The acid catalyst can act in thermochemical liquefaction as a proton donor that helps hydrolyse glycosidic bonds, which make up the structures of cellulose and hemicellulose [4]. The so-formed monosaccharides and disaccharides can then be extracted from the aqueous fractions of the bio-oil [8]. These sugars may be used to produce biodegradable materials used in several downstream industries as substitutes for the currently employed unsustainable materials; for example, plastics [9]. Previous studies have qualitatively demonstrated that bio-oils resulting from liquefaction have high contents of sugar and its derivatives [10].
The first Eucalyptus globulus thermochemical liquefaction studies were conducted on bark affording bio-oil in a ca. 92% yield [1]. Later, Fernandes et al. optimized Eucalyptus globulus sawdust thermochemical liquefaction [4]. Reaction conditions were evaluated and optimised, aiming at an increase in conversion rates, with 96.2% being the highest reported conversion rate. The liquefaction time resulting in a high conversion rate was 180 min, using p-toluenesulfonic acid (>2.44%) as a catalyst. The temperature that favoured the highest yield of bio-oil was 160 °C. In this context, the evaluation of bio-oil sugar content after aqueous extraction, as well as the elucidation of the mechanisms that lead to sugar formation from the lignocellulosic biomass liquefaction process, is of great importance and constitutes a scientific innovation.
Rodrigues et al. studied FTIR spectroscopy to determine the composition of monosaccharides in Eucalyptus globulus biomass. In this study, the chemical composition of sugars was analysed using dry wood free from extraction, determining the composition of glucose to be from 43.2% to 59.5%, of xylose to be from 9.4% to 17.8%, of galactose to be from 0.5% to 5.4%, of mannose to be from 0% to 2.8%, and of rhamnose to be from 0.3% to 0.8% [11]. Salazar et al. studied the construction patterns of the cell walls of eucalyptus species, including Eucalyptus globulus, using extraction methods with ammonium oxalate, sodium carbonate, potassium hydroxide, and sodium chlorite for this purpose. The sugars fructose, arabinose, galactose, rhamnose, glucose, xylose and mannose were identified in the cell wall by analysing the glycome profile [12].
In this sense, the results of the present study depend on the chemical composition of the original raw material of sugars, as in this study, aqueous extracts from the thermochemical liquefaction of eucalyptus globulus sawdust were used. In addition, wood is an extremely complex material that can contain a wide variety of sugars in its composition, which may result from the depolymerisation of cellulose and hemicellulose.
Glucose is the only hydrolytic product of cellulose, but it can suffer isomerisation to afford other sugars. Conversely, the depolymerisation of hemicellulose leads to the formation of glucose and other hexoses (mannose, galactose, and rhamnose) or pentoses (xylose and arabinose). Kunaver et al. carried out the qualitative identification of sugar trimethylsilyl ethers (TMS) by GC-MS in Eucalyptus globulus wood chips provided by the Agronelli company, namely of glucose, xylose, and galactose TMS ethers, totalling about 10% of total sugars. However, these sugars have not yet been quantified [13]. Mateus et al. also qualitatively identified the presence of maltose in the aqueous extract of bio-oils obtained from the liquefaction of potato peel [7].
Most studies quantifying the carbohydrates in lignocellulosic biomass are carried out using hydrolytic procedures [14]. Alves et al. studied the determination of carbohydrates in biomass samples of Eucalyptus grandis, bagasse and bamboo through hydrolysis, followed by HPLC analysis and procedures of methanolysis [15]. The relevance of these studies encourages further investigation to overcome the lack of information regarding the identification and quantification of extracted sugars from the thermochemical liquefaction of an aqueous fraction and, therefore, to emphasise the need for and value of this present study.
The main drawback of gas chromatography include its delayed derivatisation processes [16]. Trimethylsilyl ethers (TMS), generally used in derivatisation, have limitations since they are unstable, challenging to prepare and lead to multiple peaks [17]. Other methodologies are used to determine sugar composition, namely electrophoresis with a UV detector, which is another commonly used analytical technique. Still, the UV detector is unreliable and very limited due to the absence of a chromophore in sugars [18].
High-performance liquid chromatography (HPLC) is an alternative and fruitful analytical method for determining sugars in aqueous fractions due to its simplicity, ease of sample preparation and accuracy. The refractive index (RID) detector has high sensitivity and is suitable for identifying a large group of sugars [19]. However, the analytical method for determining sugars becomes challenging due to the lack of chromophores and the high polarity of their structure. The development of a robust and reliable method to determine sugars derived from eucalyptus sawdust must be addressed.
The present study aims to quantify the sugars present in the aqueous extract of liquefied Eucalyptus globulus. A reliable, fast, economical, and accurate analytical method using the HPLC-RID technique to identify and quantify sugars in the aqueous fraction is used for that purpose. As far as is known, the quantification of sugars obtained by the thermochemical liquefaction of biomass has never been disclosed.

2. Materials and Methods

2.1. Chemicals, Reagents, and Standards

All used chemicals, reagents and standards are of analytical grade. Standards (D-xylose, D-fructose, D-glucose, D-sucrose, D-trehalose) with a minimum purity of 99% were purchased from Alfa Aesar (Alfa Aesar, Thermo Fisher Scientific, Ward Hill, MA, USA). Solvents (acetonitrile and water) were HPLC grade with purities of ≥ 99.9% and purchased from Sigma Aldrich (Sigma-Aldrich Corporation, St. Louis, MO, USA). All aqueous solutions used as standards and the analysed samples’ aqueous fractions were filtered using hydrophobic polytetrafluoroethylene (PTFE) membrane filters of a porosity of 0.45 µm and a diameter of 25 mm (Branchia, Labbox Labware S.L. Premià de Dalt, BCN, ES).

2.2. Hydrolytic Sugars Sample Preparation

The bio-oil was produced from Eucalyptus globulus sawdust by thermochemical liquefaction at 160 °C in a lab-scale reactor following the procedure described and optimised by Fernandes et al. [4], according to the flowchart depicted in Figure 1. The biomass-to-solvent ratio of 1:2.5 was used, and 3% of p-toluenesulfonic acid (w/w) was used as a catalyst. Typically, the biomass and the solvent, 2-ethylhexanol, along with the catalyst, are placed in a glass reactor at a set temperature. After 90 min, the reactor cools down, and the reactional mixture is filtered off. The afforded bio-oil, still with the excess solvent, is concentrated. The excess solvent is removed under a vacuum to afford a dark bio-oil. The biomass conversion, based on the filtration cake obtained upon the filtration of the reactional mixture, was 96%. For this biomass conversion process, the gaseous products were neglectable. Thus, the mass balance considered the amount of biomass and the mass of the solid residue after liquefaction. Before further treatment, the bio-oil sample was stored in sealed containers in the freezer at −10 °C. A bio-oil sample (100 g) was extracted with distilled water (4 × 50 mL). The aqueous phases were combined to afford the aqueous extract. Afterwards, an aliquot was retrieved for further HPLC analysis. Furthermore, another aliquot was freeze-dried for NMR, FTIR and elemental analysis experiments. The remaining aqueous extract was stored in the freezer at −10 °C for further investigations.

2.3. Elemental Analysis

The elemental analysis (for determining the contents of carbon, hydrogen and nitrogen, on a dry ash-free basis) of the aqueous extract was performed by a LECO TruSpec CHN analyser (LECO Corporation, St. Joseph, MI, USA), whilst a LECO CNS2000 analyser was used to determine the content of sulphur. The oxygen content was assessed by the difference.

2.4. HPLC Experiments

2.4.1. Preparation of Standard Solutions for Measuring Peak Detection Levels

Stock solutions were prepared with different standard sugars at concentrations of 1 g/L, 5 g/L, 10 g/L, 15 g/L, 20 g/L and 25 g/L to test the standards’ detection limits and the retention time (Rt) of each sugar. From the stock solutions, mixed solutions were prepared to test the separation efficiency of the method.

2.4.2. Preparation of Samples of Aqueous Fractions

Samples from the aqueous fraction (1 mL) were placed in falcon tubes containing 10 mL of HPLC grade water, then dissolved by shaking the tubes for 5 min. The samples were filtered using 47 mm syringe filters of a 0.45 µm porosity with a PTFE membrane.

2.4.3. Optimisation of Chromatographic Separation

Several injections were performed with a mixed standard solution at the same concentration at different flow rates from 0.2 to 1.0 mL/min to optimise the mobile phase’s flow rate, noting which rates provided the best conditions as the best separation of peaks, the highest sensitivity, and the shortest analysis time.

2.4.4. Column Temperature

To optimise the column temperature, injections were performed with the same standard solutions at different temperatures from 28 to 40 °C.

2.4.5. HPLC Analysis

Monosaccharides and disaccharides were identified using a Waters 2695 HPLC system (Waters Corporation, Milford, MA, USA) coupled to a Jasco RI-4030 detector (JASCO Corporation, Hachioji-shi, TYO, Japan). Chromatographic separation was performed using an Interchim PuriSflash 100-5 NH2 column (4.6 × 250 mm) (Interchim SA, Montluçon, France) operating at 28 °C. Software Clarity 2.4 (DataApex, Praha, Czech Republic) was used for data analysis. The mobile phase used was HPLC grade acetonitrile/water, 7:3 (v/v), at a flow rate of 0.6 mL/min, the sample injection volume being 10 μL.

2.5. NMR

Sample sugars and sugar standard fractions were also analysed by two-dimensional (2D) 1H–13C heteronuclear single-quantum correlation–nuclear magnetic resonance (HSQC–NMR) spectroscopy via a Bruker Avance 400 MHz NMR spectrometer (Bruker Corporation, Billerica, MA, USA). The frequencies of 1H and 13C for the Bruker AV400 NMR spectrometer are 400.13 MHz and 100.62 MHz, respectively. In each analysis, the aqueous extract sample (100 mg) was dissolved in dimethyl sulfoxide-d6 (560 μL), which acts as a solvent for chemical shift calibration. The HSQC–NMR spectrometric data (1024 points for 1H or 256 points for 13C) (TopSpin Software version 4.2.0, from Bruker Corporation) were recorded at a 90° pulse angle, a 1.5 s relaxation delay time, and a 0.08 s acquisition time for a total of 48 scans.

2.6. Fourier Transformed Infrared (FTIR-ATR)

The FTIR-ATR analysis was performed on a Spectrum Two Perkin Elmer spectrometer. The spectra were captured from 4000 to 600 cm−1 and analysed in the Perkin Elmer Spectrum IR software version 10.7.2.

3. Results

The work disclosed herein focuses on characterising the aqueous extract of bio-oil obtained from eucalyptus liquefaction. After liquefaction and consecutive aqueous extraction, the hydrophilic extract was analysed by HPLC and further characterised by FTIR-ATR, NMR, TGA and elemental analyses.
The chemical characterization of the original raw material (sawdust) was carried out through the elemental composition, which was assessed to infer the carbon, hydrogen, and oxygen content; see Table 1. Biomass and its derivatives are mainly composed of C, H, and O (about 97%–99%). Sulphur and nitrogen contents were below the detection limit; thus, their content was neglected [20].
The higher oxygen content in Eucalyptus globulus sawdust corroborates the presence of oxidised entities, e.g., carbohydrates, suggesting that the aqueous extract is enriched with those compounds, presenting an oxygen content of 47.79%, whereas the bio-oil only showed a content of 17.82%. On the other hand, the carbon and hydrogen content was lower in the aqueous extract, being 43.01% and 9.20%, respectively. The elemental analysis substantiated that aqueous extraction efficiently withdrew the sugars from the bio-oil. In addition, since elemental analysis has high precision in the results, it is possible to carry out an adequate comparison between the contents of oxygen, hydrogen and carbon between the sawdust and the aqueous extract.

3.1. HPLC-RID Determination of Sugars in Aqueous Fractions of the Thermochemical Liquefaction of Eucalyptus globulus

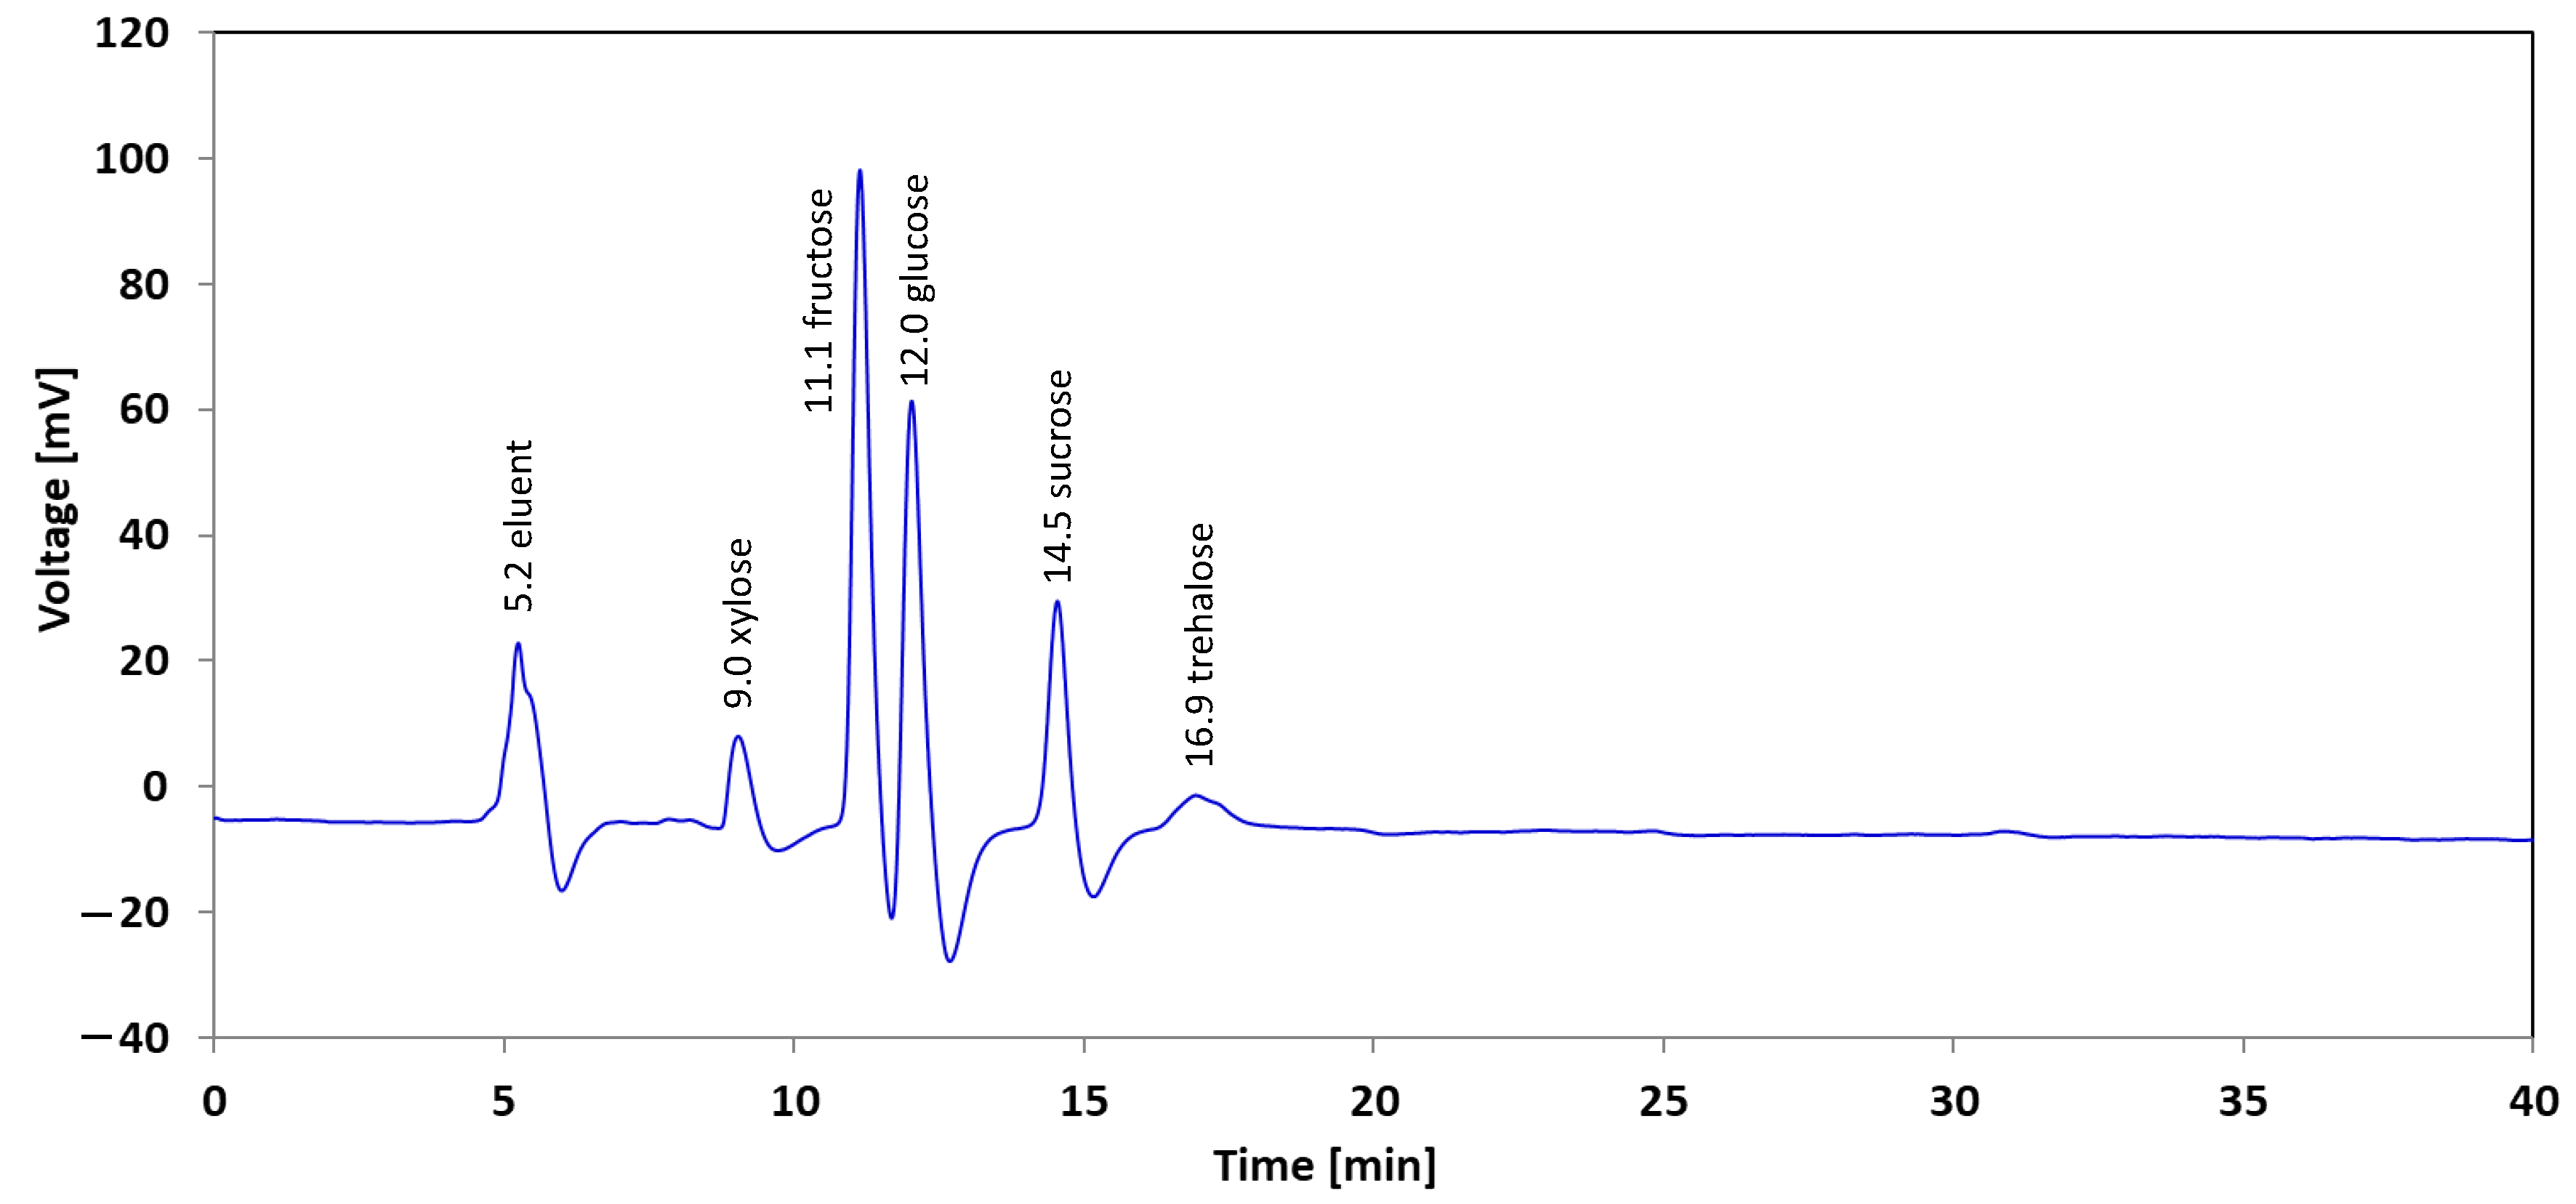
This study presents the development and validation of an HPLC-RID method to identify and quantify monosaccharides (fructose, glucose, and xylose) and disaccharides (sucrose and trehalose) present in aqueous fractions from the thermochemical liquefaction of Eucalyptus globulus sawdust. The column temperature between 28 °C and 40 °C was tested, and the results showed that the peak resolution increased with decreasing temperature. Therefore, Interchim Puriflash column analyses took place at 28 °C. Variations in flow rates between 0.2 and 1 mL/min were studied, upon which it was observed that with an increase in the flow rate of 1 mL/min, there was a decrease in peak resolution, and the best-observed flow rate was 0.2 mL/min. Variations in the proportions of acetonitrile/water solvents used in the mobile phase were studied; the increase in acetonitrile promoted a decrease in the peak resolution and area, with the proportion of acetonitrile/water (ACN/H2O) being ideal at 7:3 (v/v). The optimised temperature, flow rate and solvent ratio of acetonitrile/water conditions were used in all experiments with the studied aqueous fractions and sugar standards. The temperature of the RID detector during the analyses was 28 °C. The runs for analysing the aqueous fractions took 40 min, and the analysis of standards took 20 min each.
Figure 2 shows the chromatogram for the characterisation of the diluted aqueous fraction obtained by thermochemical liquefaction, in which the sugars are identified in the sample and their retention times are observed: fructose (11.1 min); glucose (12.0 min), sucrose (14.5 min), trehalose (16.9 min), and xylose (9.0 min).
In the aqueous fraction obtained by the thermochemical liquefaction of Eucalyptus globulus sawdust, sugars of molar concentrations between 1.26 and 9.57 mg/mL were identified by HPLC in the diluted sample (Table 2), with fructose and glucose concentrations being the highest ones. Therefore, the presence of fructose (9.57 mg/mL), glucose (8.72 mg/mL), sucrose (3.96 mg/mL), trehalose (1.26 mg/mL), and xylose (2.65 mg/mL) in the fraction studied was observed. Since the 1 mL sample was diluted to 11 mL, the actual sugar concentrations in the aqueous extract samples were of fructose (105.27 mg/mL), glucose (95.92 mg/mL), sucrose (43.56 mg/mL), trehalose (13.86 mg/mL) and xylose (29.15 mg/mL), with a total value of 287.76 mg/mL of sugars.
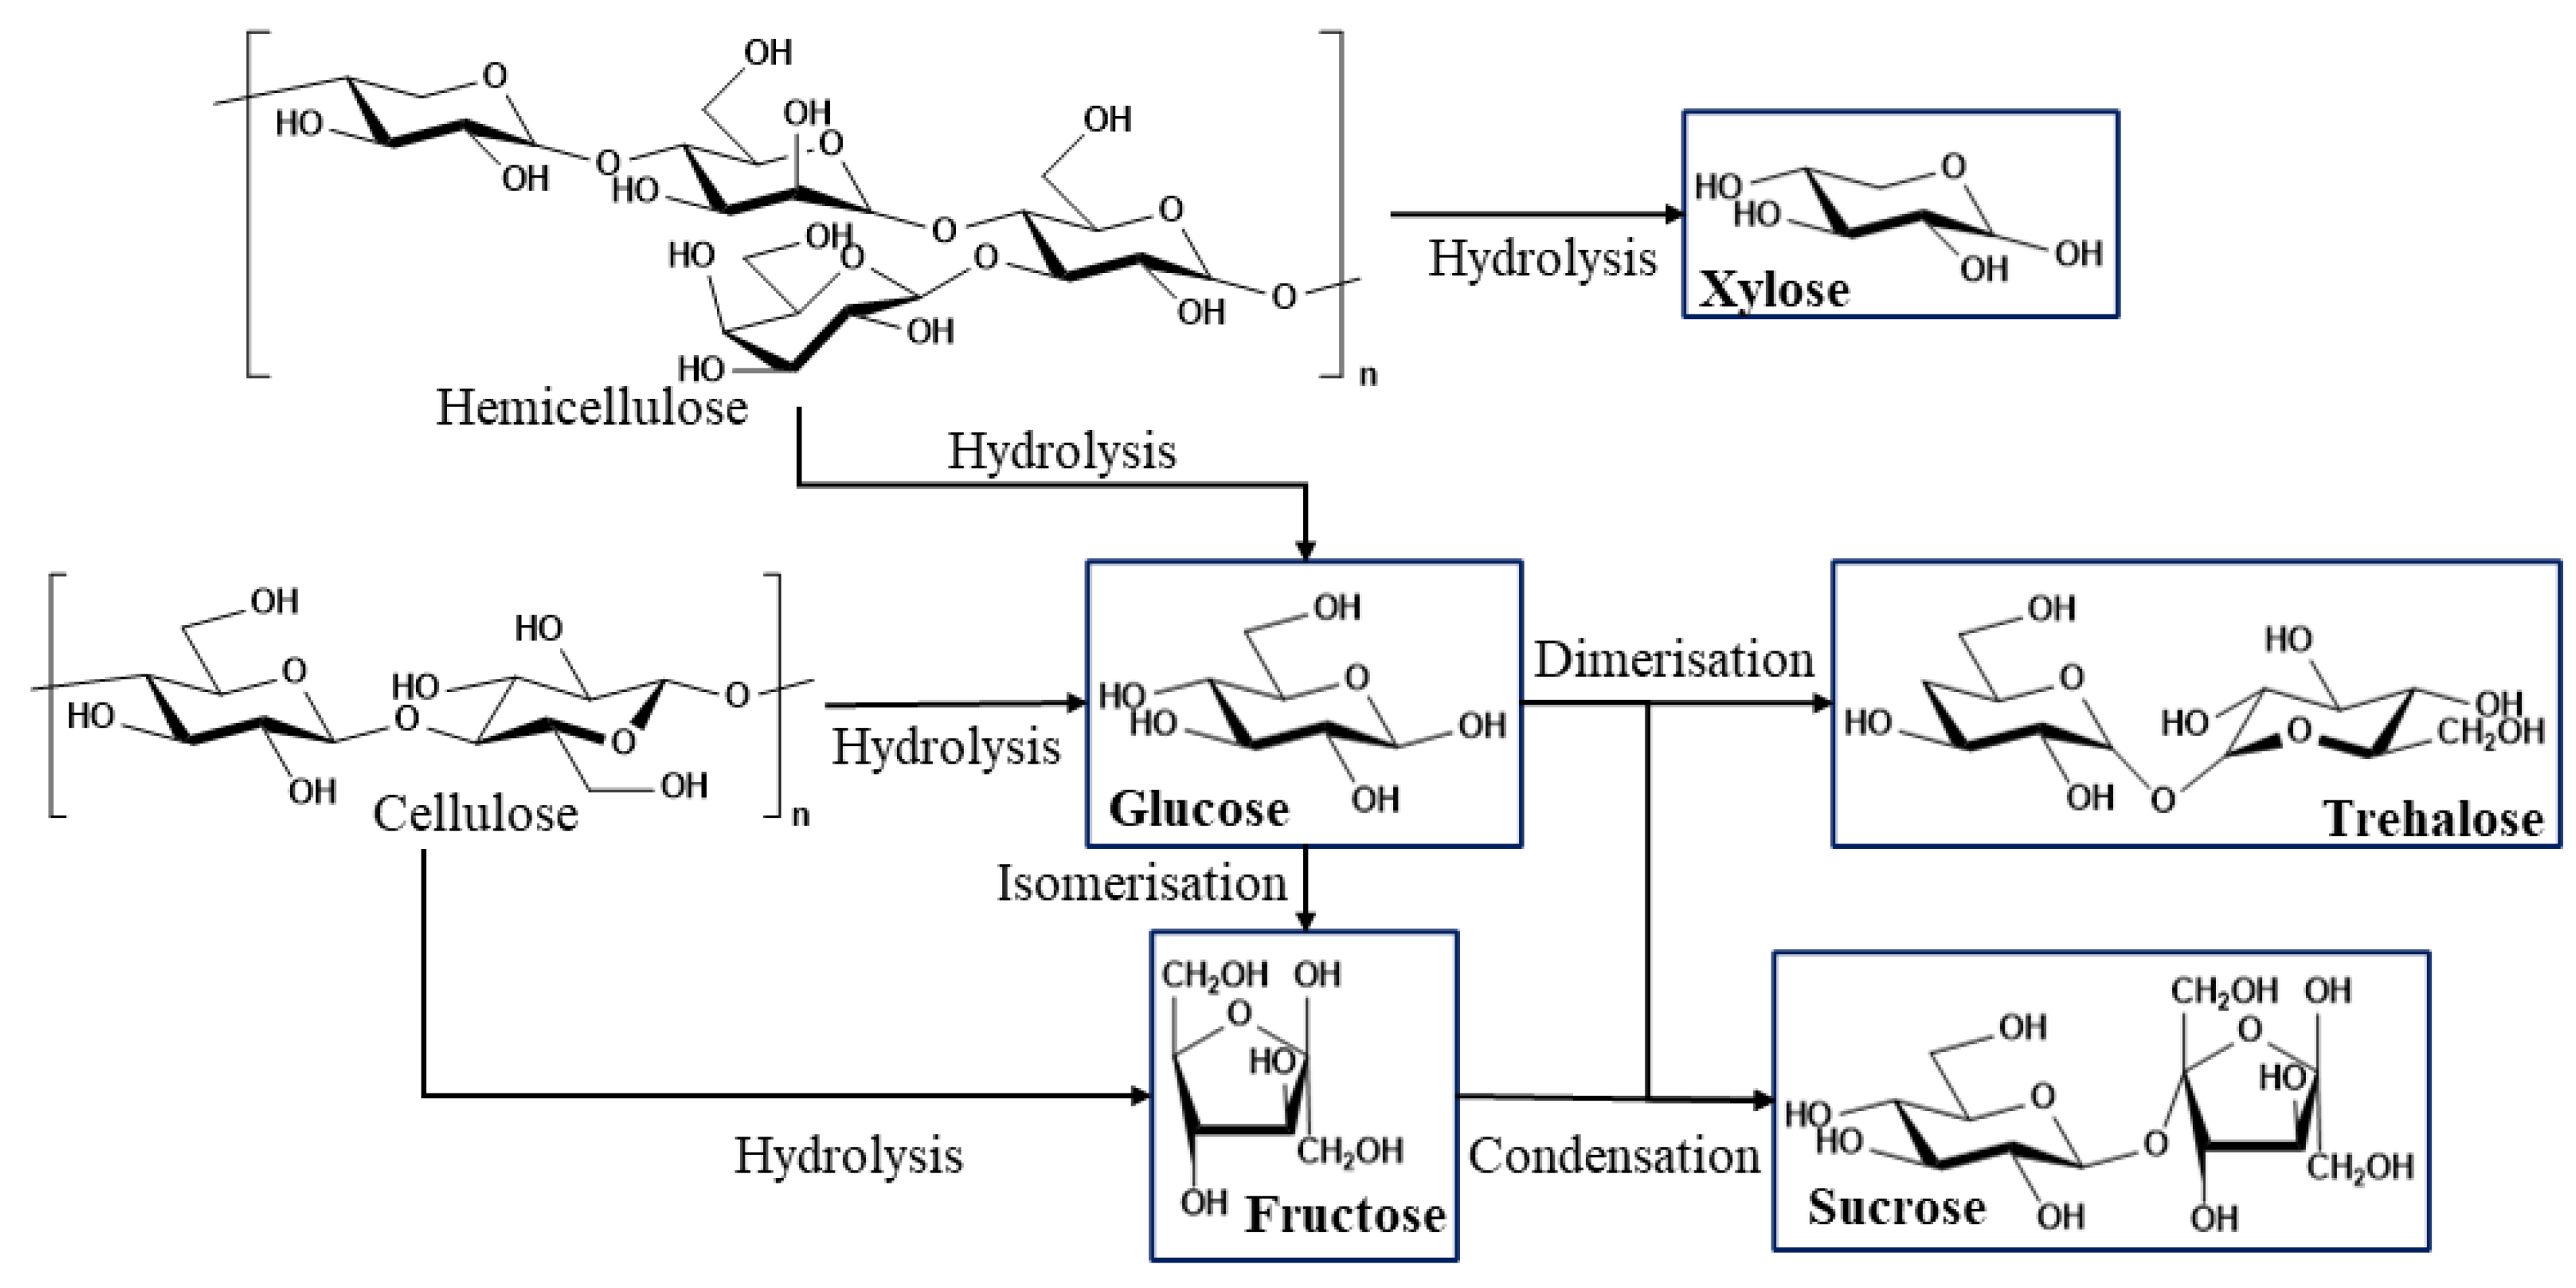
In the aqueous fraction, the identified sugars may have resulted from the depolymerisation of cellulose and hemicellulose [21]. Regarding the sugar content of eucalyptus globulus, the most abundant macromolecular component is cellulose, present in concentrations of up to 50%, composed of glucose units. Afterwards, the most significant component, after cellulose, is hemicellulose, present in concentrations varying from 24%–27%, in which the most abundant sugar entities are xylans (16%–20%) and glucans (4%–6%) [22]. Considering this sugar content, glucose and xylose and their derivatives are expected to be the most abundant sugars obtained upon liquefaction. In fact, glucose and xylose were detected. Trehalose, a disaccharide of glucose, was also found, along with fructose and sucrose. These last three sugars, in fact, are not expected to be found within the cell wall of eucalyptus globulus; therefore, they must have resulted from chemical reactions that may occur during the liquefaction process. Figure 3 displays the general pathway that leads to the formation of the sugar units present in the aqueous extract sample. In general, the acidic hydrolysis of cellulose leads mainly to the formation of glucose and reduced numbers of fructose units, the latter resulting from the isomerization of glucose under certain conditions [23]. The presence of fructose and glucose in an acid medium can trigger dehydration reactions leading to the formation of glycosidic bonds between these two monomers, resulting in the loss of water molecules and the formation of sucrose [24]. On the other hand, the depolymerisation of hemicellulose can lead to the formation of xylose and glucose [25], the latter suffering further dimerisation reactions to afford trehalose [26]. The presence of trehalose and sucrose demonstrates that the chemical reactions occurring during the liquefaction process are not limited to the hydrolysis of the lignocellulosic structures. Additionally, parallel reactions occur within the hydrolysed compounds. In addition to the identified sugars, other sugars such as arabinose and mannose may also be present in Eucalyptus globulus [27], but these sugars most likely do not appear as they may not have been hydrolysed. In addition, since the hydrolysis of hemicellulose can promote the formation of mannose and arabinose [28], an incomplete hydrolysis process may not lead to the formation of said sugars.

3.1.1. Method Validation

A calibration methodology using an external standard was developed to identify and quantify the analysed sugars (fructose, glucose, sucrose, trehalose, and xylose). Sugars were quantified by comparing peak areas according to the calibration curve. Five standard solutions with concentrations ranging from 1 to 25 g/L were evaluated. For each sugar standard, 10 repetitions were performed, with a standard deviation of ≤4%.

3.1.2. Linearity

The linearity evaluation was performed by linear regression between the peak areas and the concentrations of standard sugars (1; 5; 10; 15; 20; 25 mg/mL). The equations for the linear regression curves are given in Table 3, where y corresponds to the peak area, and x refers to the concentration (mg/mL) of the corresponding standard. This method presents good linearity between 1 to 25 mg/mL, with coefficients of determination above 0.9861, and the aforementioned coefficient values are mentioned in method validation protocols [29].

3.1.3. Detection Limit and Quantification Limit

The limit of detection (LOD) and the limit of quantification (LOQ) were determined using the parameters of the calibration curve, with LOD and LOQ being calculated as 3.3 and 10 times the value of the intercept standard deviation divided by the slope, respectively [30]. The quantification and detection limits indicate the system’s sensitivity. Within our study, the LOD ranged from 3.22 to 7.22 mg/mL, while the LOQ ranged from 9.76 to 21.89 mg/mL. These values are similar to those of other authors [31,32].

3.1.4. Statistical Analysis

The results of the analyses were expressed as the linearity across the calibration curve, the limit of detection (LOD) and the limit of quantification (LOQ). For data analysis, the Microsoft Office 365 Excel program (Microsoft Corporation, Redmond, WA, USA) was used.

3.2. NMR Studies

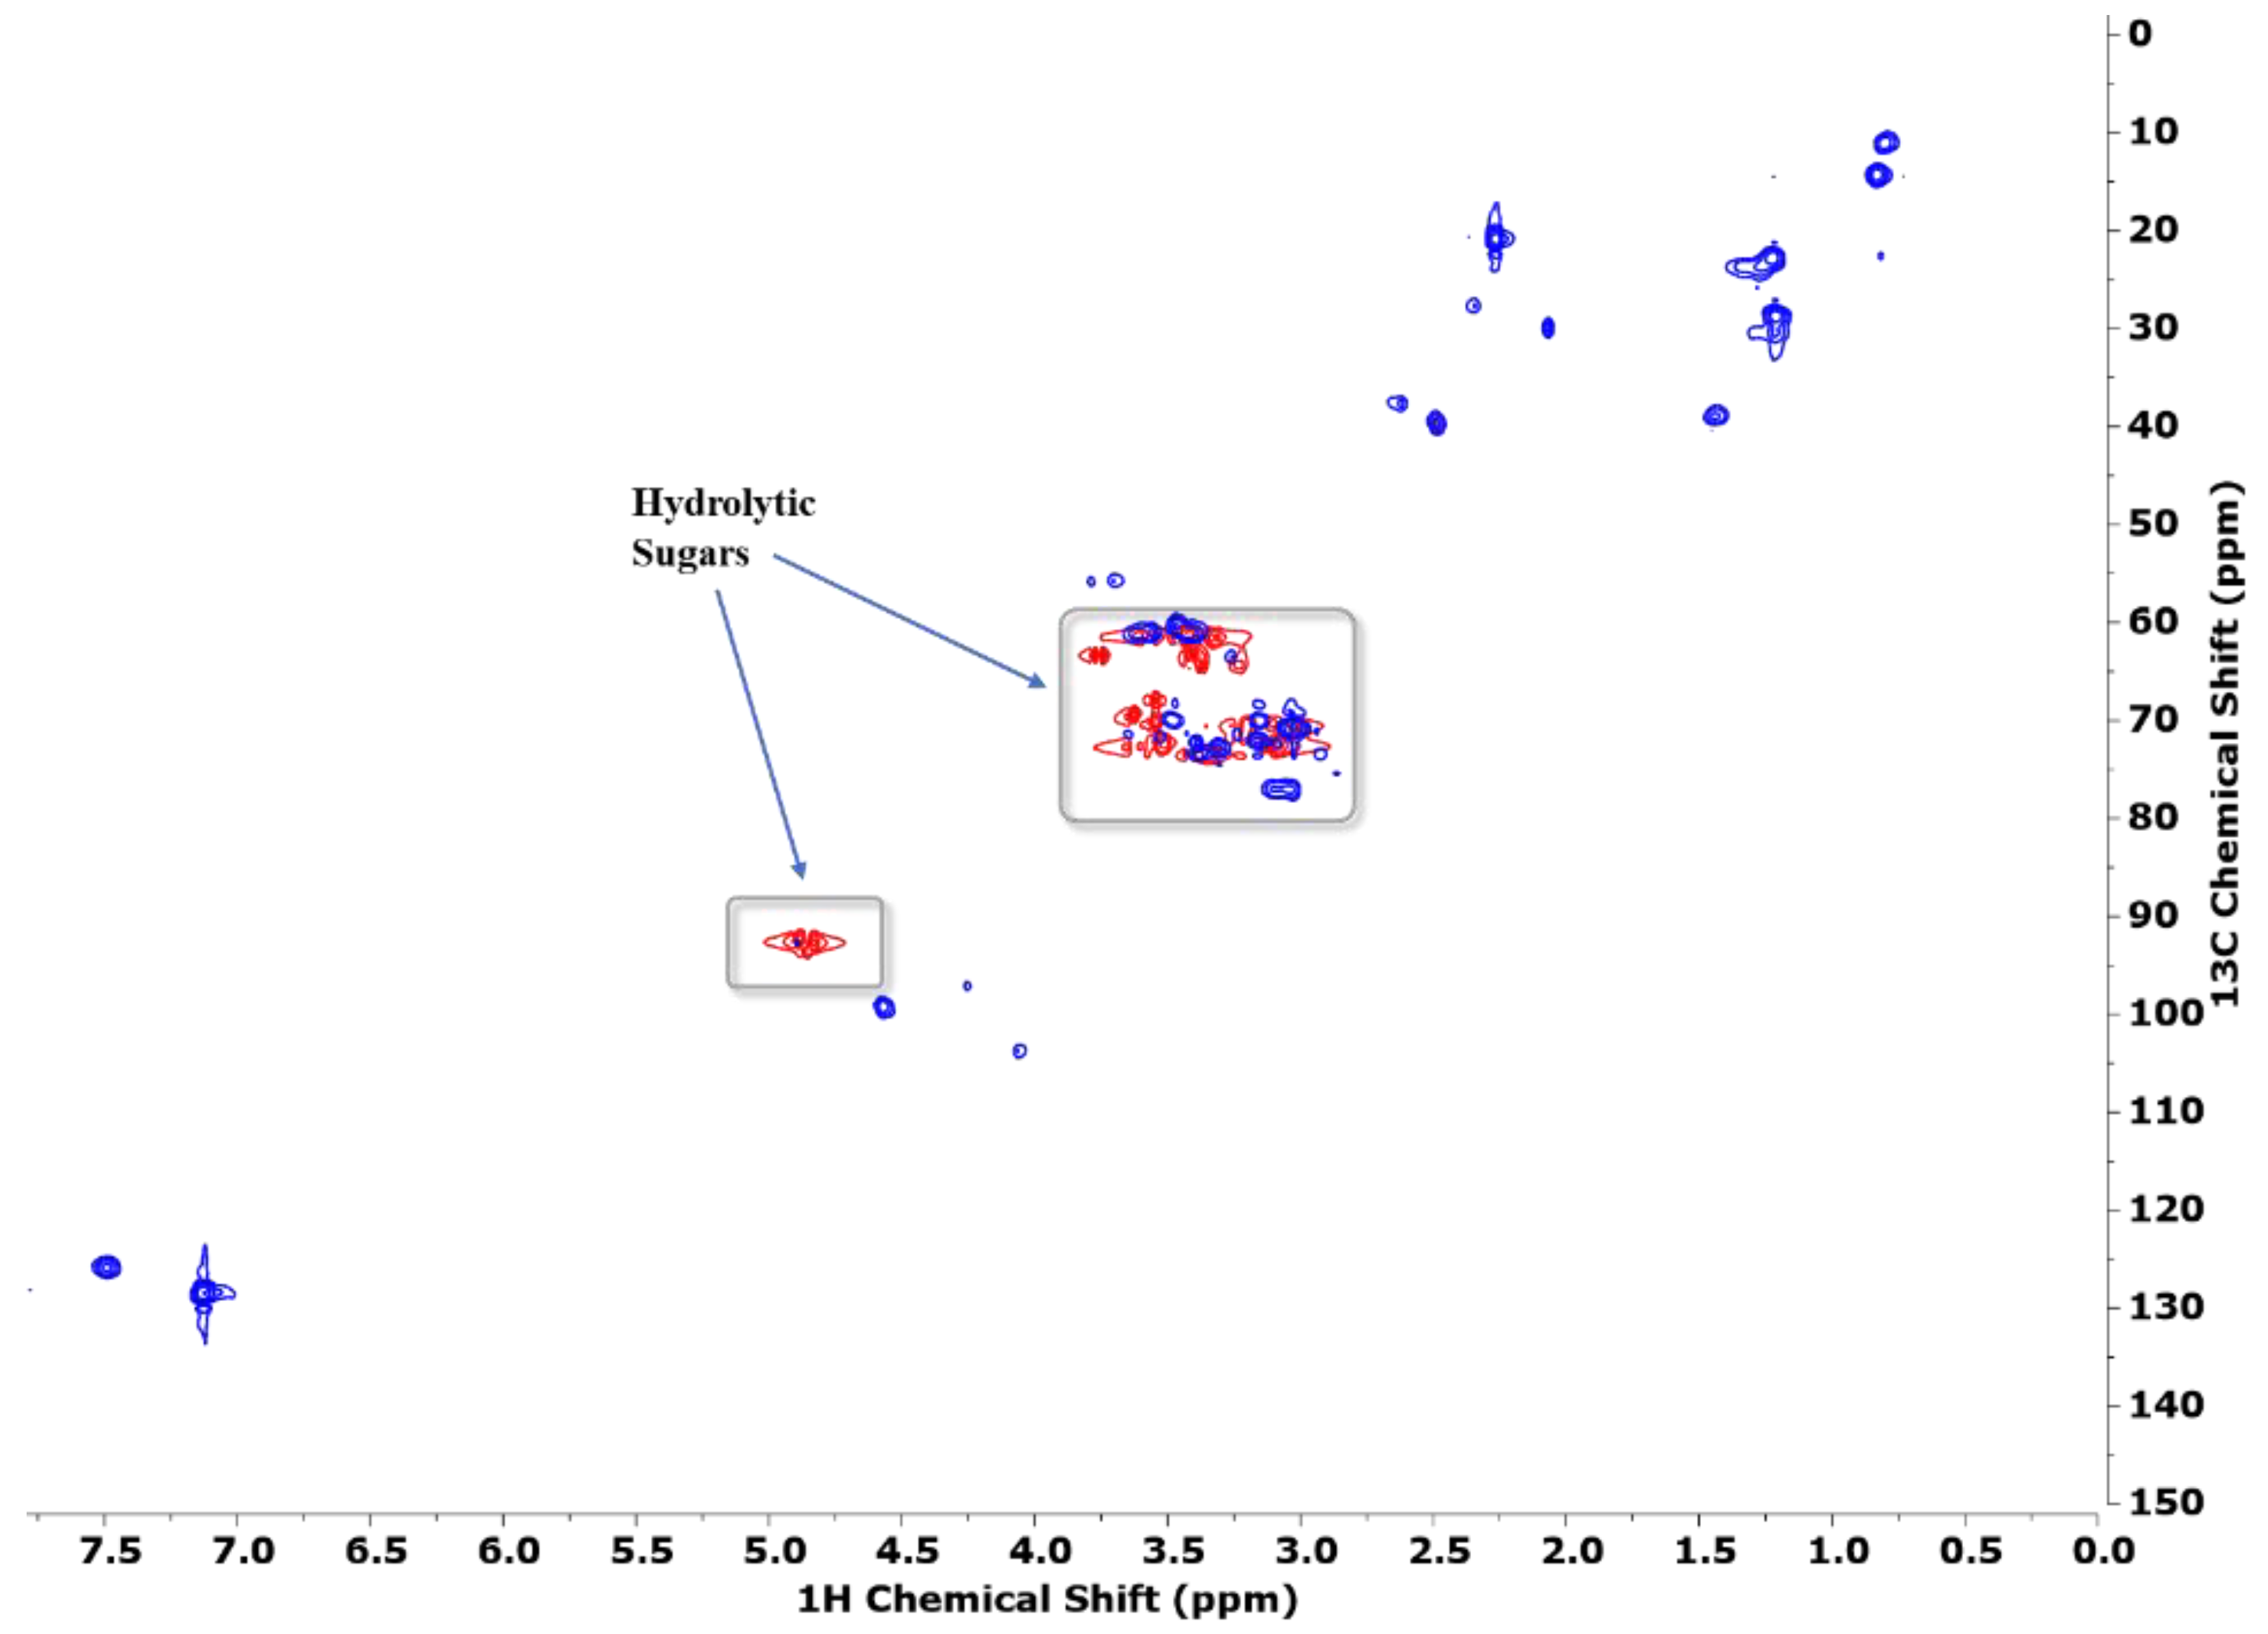
NMR techniques were used to identify other chemical structures alongside the carbohydrates. The bidimensional spectra in Figure 4 provided compelling evidence of the presence of sugars in the water-soluble fraction of bio-oil, corroborating the HPLC results. The difficulty in assessing the sugar structures present in the aqueous extract by NMR is mainly because those sugars’ moieties appear to be bonded to alkyl or alkylphenolic derivatives from lignin depolymerisation. The HSQC spectra of the aqueous fraction in dimethylsulfoxide-d6 were obtained to understand the chemical profile of the components of the water-soluble bio-oil extract. Additionally, a HSQC spectrum of a mixture containing the sugars identified by HPLC of the bio-oil’s aqueous fraction (xylose, fructose, glucose, sucrose, and trehalose) was also obtained for further comparison. This approach for comparing sugars from biomass depolymerisation and standards by HSQC was disclosed by Yu et al. in a study regarding the identification of pyrolytic sugars [33].
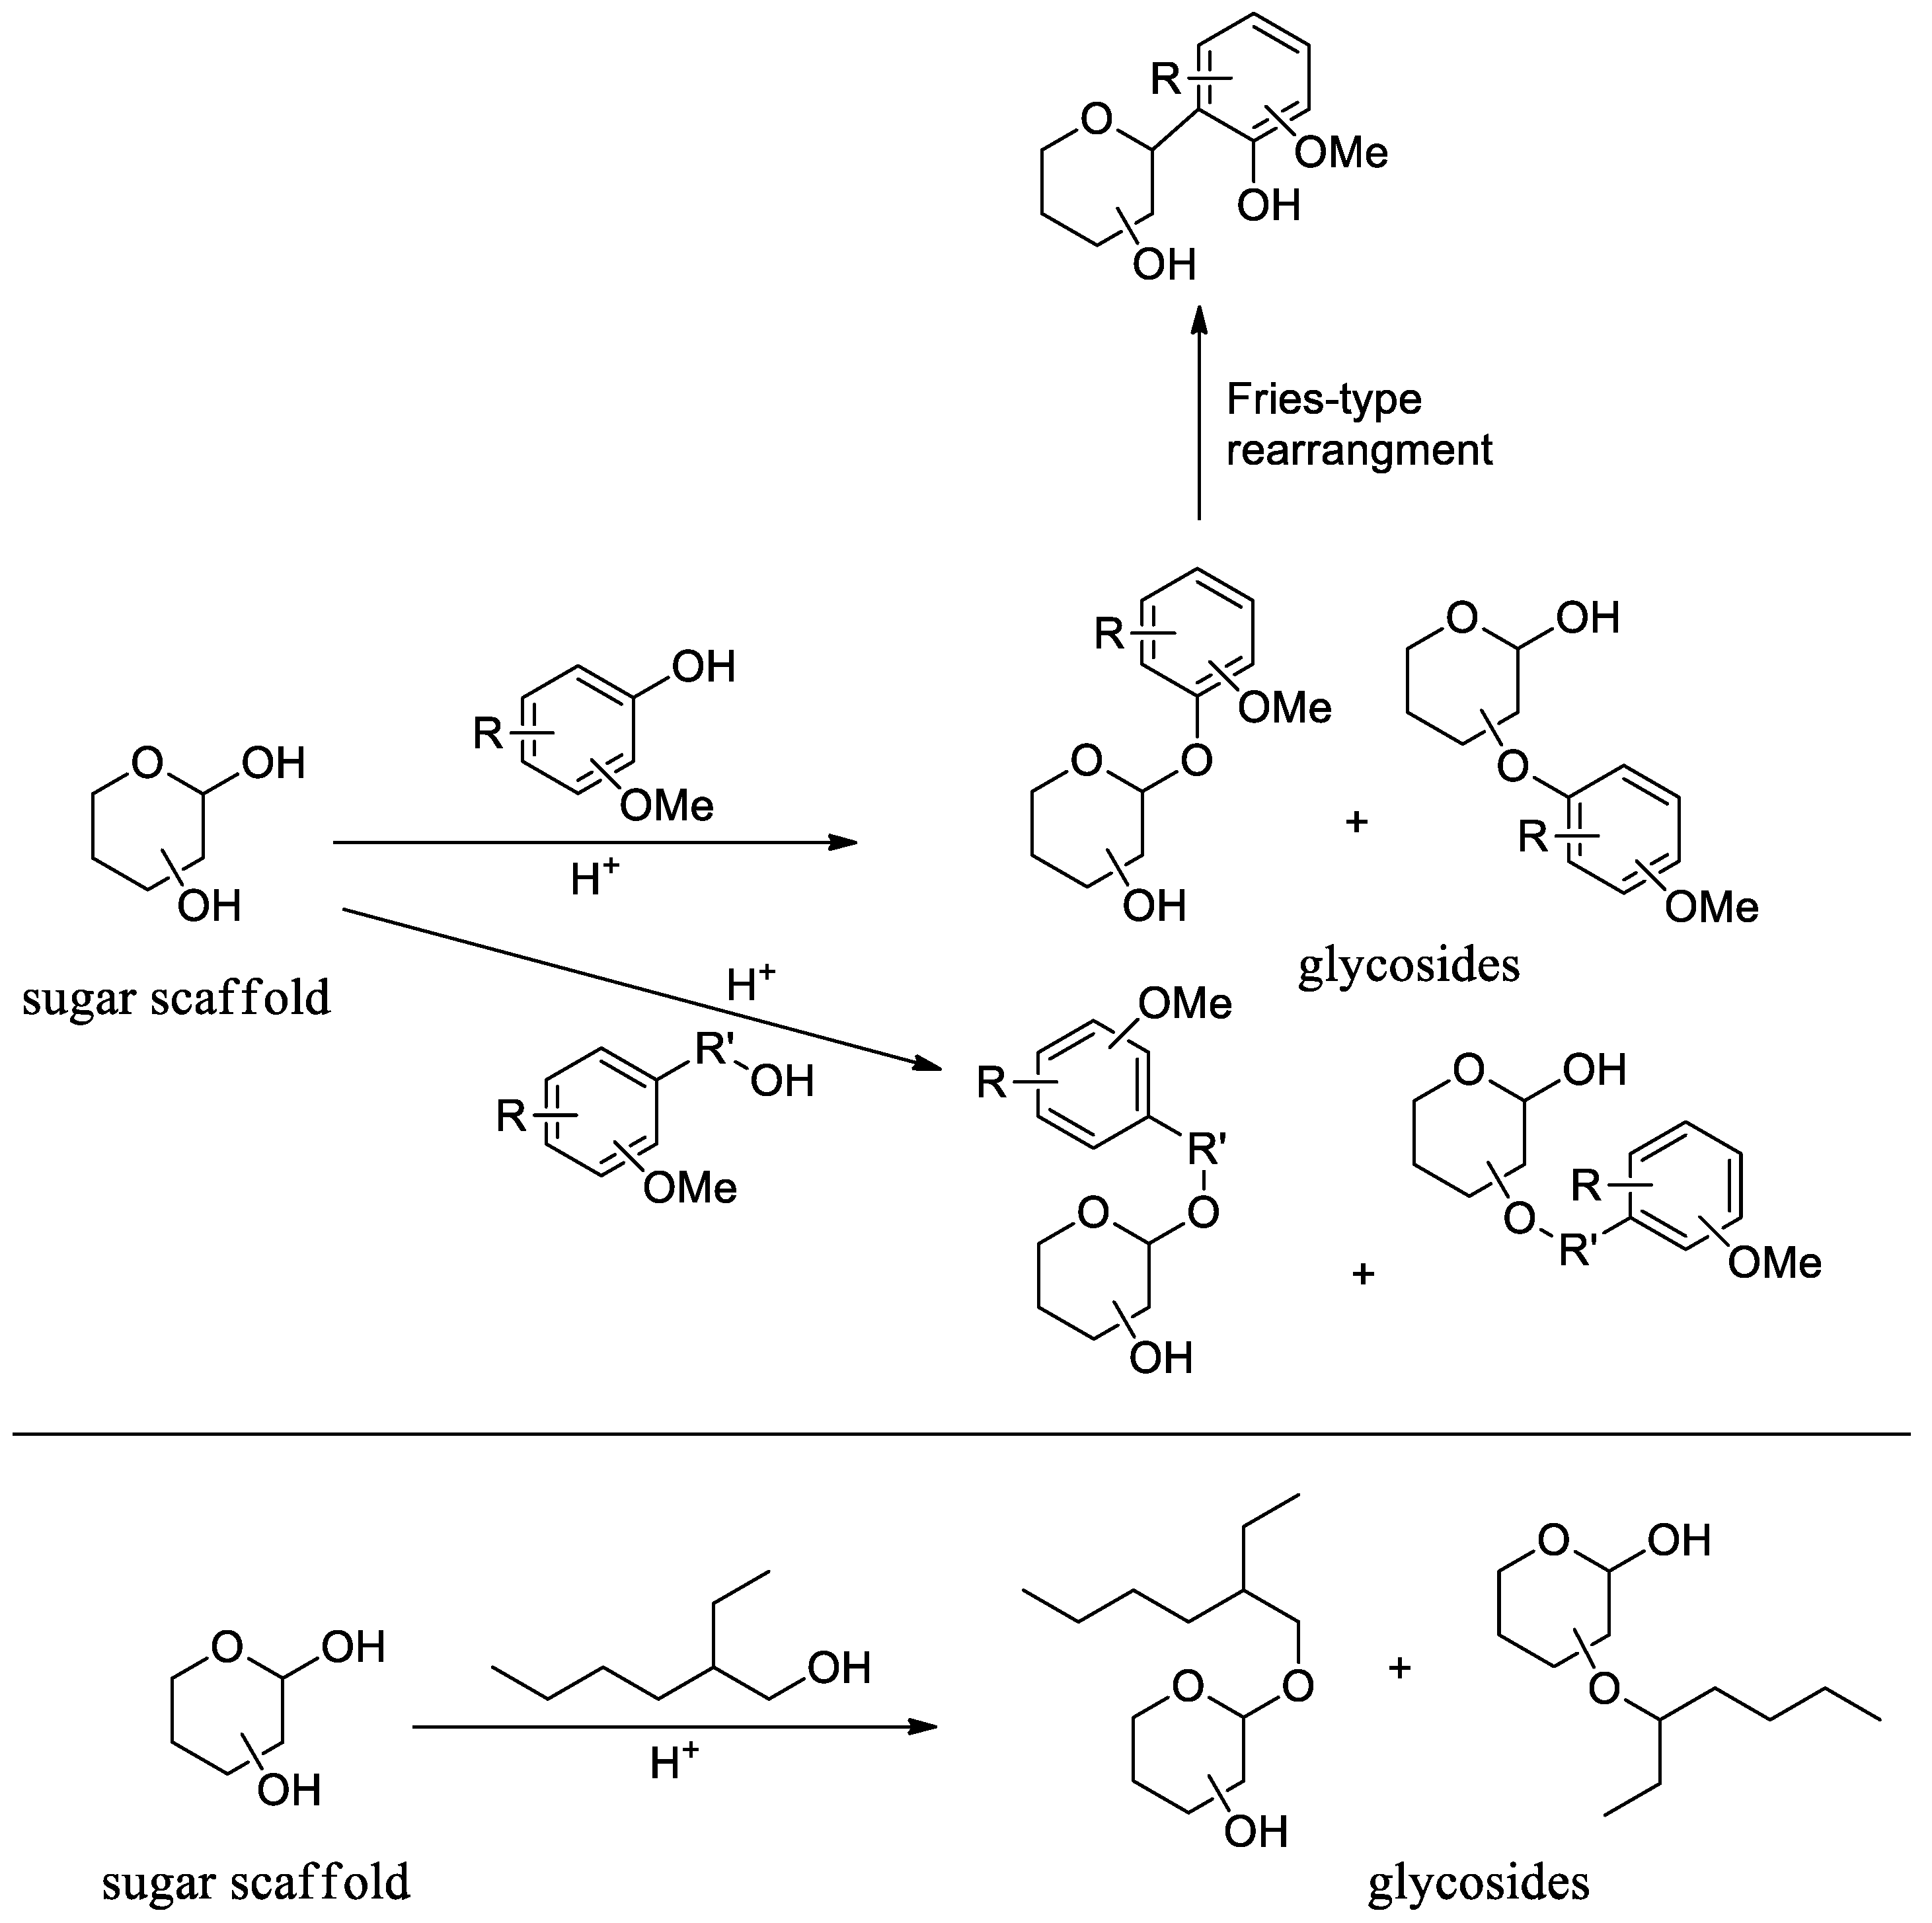
The presence of sugar derivatives, identified by HPLC, became evident by superimposing both spectra. The amount of sugar derivatives in the aqueous extract was considerably higher than that of the other identified compounds. This is in accordance with what was expected since most hydrolytic sugars are water-soluble, while the compounds from lignin decomposition tend to be hydrophobic. In addition, some phenolic and aliphatic derivatives were also observed. Signals in the HSQC spectra in the region 120–130 ppm/7.0–7.5 ppm, which is typical of aromatic moieties, are also found. These signals can be assigned to C–H aromatic bonds resulting from the presence of structures from lignin depolymerisation, e.g., guaiacyl moieties [33]. Those structures may appear as products of the reaction of carbohydrates with phenolic moieties, affording glycosides. Figure 5a resumes the presumed routes of the formation of several glycosides. The reaction of those structures with carbohydrates may occur between a phenolic hydroxy group or a hydroxy group on the alkyl chain, with the anomeric carbon of the carbohydrate to form an acetal. Ethers are also formed by the reaction of the lignin derivatives with non-anomeric carbohydrate positions. Moreover, C-glycosides can be formed by a reaction of the anomeric carbon with a phenolic hydroxy in an acidic medium through a Fries-type reaction or rearrangement, which involves the formation of an O-glycoside, which undergoes intramolecular rearrangement to afford a C-glycosylated compound [34]. This type of structure has more of an affinity to the aqueous phase due to the hydrophilic profile of the sugar moiety [35].
On the other hand, the aliphatic derivatives that appear at the lower 1H and 13C chemical shift region in the HSQC spectrum (10–20 ppm/0.5–2 ppm) may result from the reaction of the solvent, 2-ethylhexanol, with the sugar moieties, resulting in the formation of alkyl glycosides. This reaction occurs either with the OH groups on the anomeric carbon or the primary and secondary ones (Figure 5b). The evidence of the formation of glycosides from the solvent and sugar moieties has already been stressed by the work of Mateus et al. regarding bio-oils from sweet potato skin [36].

3.3. FTIR Analysis

The characterisation via ATR-FTIR of the aqueous extract of the bio-oil obtained from Eucalyptus globulus liquefaction can be found in Figure 6. This experiment was carried out to confirm the chemical profile of the extract. The presence of residual water is confirmed by the bands being located at 3338 and at 1650 cm−1, which corresponds to the in-plane bending of water [37]. In the NMR experiment, aromatic derivatives were found. The signals corresponding to these moieties are also found in the FTIR-ATR spectra. The spectra reveal a band at 1035 cm−1 assigned to the aromatic C-H in-plane deformation of guaiacyl derivatives [38]. The presence of other characteristic bands of aromatic rings, usually found at 1460 cm−1 [39] and a peak related to syringyl rings at 1379 cm−1 corroborates the presence of lignin derivatives [40]. In contrast, the spectra of the aqueous extract also exhibits the characteristic carbohydrate fingerprint region (683–1220 cm−1) [6]. The bands at 682 cm−1 and 1049 cm−1 are assigned to C-H bend and C-O-C stretch signals, respectively [41]. On the other hand, the CH2OH side chain of hexoses, associated with the C-O-H bending mode, is detected at 1214 cm−1 [6]. Another signal at 1124 cm−1, characteristic of the pyranosidic ring structure, often assigned to the stretching vibrations of C-O-C bonds, is also detected [42]. Moreover, the vibrational states of 1→4 glycosidic linkages found in holocellulose derivatives peak at 918 cm−1 [43]. Likewise, an anti-symmetric out-of-phase ring stretch is found at 896 cm−1, resulting from a C-H equatorial deformation vibration band, characteristic of α- and β-pyranoses spectra [44] A signal related to carbohydrate stretching is found at 820 cm−1 [40]. Lastly, the alkyl chains in the NMR spectra peak appear at 2870–2920 cm−1 and are usually assigned to CH2- and CH3-stretching [40].

4. Conclusions

The sugar content of the aqueous extract of the bio-oil produced by the thermochemical liquefaction of Eucalyptus globulus sawdust was identified and quantified for the first time using the HPLC chromatographic methodology. The elemental analysis of the original raw material (sawdust), the bio-oil and the aqueous extract was used to prove the efficiency of the aqueous extraction procedure that removed the sugars from the bio-oil. HSQC–NMR and FTIR-ATR analyses were also used to corroborate the presence of carbohydrates in aqueous extracts. The sugars identified were fructose (36.58%) and glucose (33.33%) as the main components, sucrose (15.14%), trehalose (4.82%) and xylose (10.13%). This study’s main advantage is providing the sugar content for further use. These sugars can later be used for other processes, such as chemical building blocks, substrates for fermentation processes, or the production of sustainable polymers. Moreover, this study suggested the chemical mechanism of the formation of the identified sugars. Further studies should include the study of sugar extracts of bio-oils obtained with different reaction periods. The performance of NMR on the raw biomass can also give an insight into the sugar structures present in the raw biomass and should be carried out.

Author Contributions

Conceptualisation, R.G.d.S.; methodology, R.G.d.S.; formal analysis, L.S., D.G., I.P., N.M.X., A.P.R. and R.G.d.S.; investigation, L.S., D.G., J.C., M.M., N.M.X., A.P.R., J.M.B. and R.G.d.S.; resources, J.M.B. and R.G.d.S.; writing—original draft preparation, L.S., S.O., A.P.R. and R.G.d.S.; writing—review and editing, L.S., A.P.R. and R.G.d.S.; supervision, N.M.X., A.P.R. and R.G.d.S.; project administration, R.G.d.S.; funding acquisition, J.M.B. and R.G.d.S.; methodology, R.G.d.S. All authors have read and agreed to the published version of the manuscript.

Funding

This work was carried out under the project “inpactus–innovative products and technologies from eucalyptus”, project no. 21874, funded by Portugal 2020 through the European Regional Development Fund (ERDF) in the frame of COMPETE 2020 no.° 246/AXIS II/2017, and by the project BETTER PLASTICS—Plastics in a circular economy (POCI-01-0247-FEDER-046091 and LISBOA-01-0247-FEDER-046091).

Data Availability Statement

Not applicable.

Acknowledgments

The authors would like to acknowledge the Forestry and Paper Research Center, RAIZ, and Fundação para a Ciência e a Tecnologia for the support of CERENA (project UIDB/04028/2020), and Centro de Química Estrutural (projects UIDB/00100/2020 and UIDP/00100/2020), and Institute of Molecular Sciences, an Associate Laboratory funded through project LA/P/0056/2020. N.M.X. acknowledges FCT for funding through Grant CEECIND/03881/2018.

Conflicts of Interest

The authors declare no conflict of interest.

References

  1. Mateus, M.M.; Guerreiro, D.; Ferreira, O.; Bordado, J.C.; Galhano dos Santos, R.; dos Santos, R. Heuristic Analysis of Eucalyptus Globulus Bark Depolymerization via Acid-Liquefaction. Cellulose 2017, 24, 659–668. [Google Scholar] [CrossRef]
  2. Huang, X.; Li, F.; Xie, J.; de Hoop, C.F.; Peng, X.; Qi, J.; Chen, Y.; Xiao, H. Preliminary Evaluation of Liquefaction Behavior of Eucalyptus Grandis Bark in Glycerol. J. For. Res. 2020, 31, 687–691. [Google Scholar] [CrossRef]
  3. Santos, S.A.O.; Freire, C.S.R.; Domingues, M.R.M.; Silvestre, A.J.D.; Neto, C.P. Characterization of Phenolic Components in Polar Extracts of Eucalyptus Globulus Labill. Bark by High-Performance Liquid Chromatography-Mass Spectrometry. J. Agric. Food Chem. 2011, 59, 9386–9393. [Google Scholar] [CrossRef]
  4. Fernandes, F.; Matos, S.; Gaspar, D.; Silva, L.; Paulo, I.; Vieira, S.; Pinto, P.C.R.; Bordado, J.; dos Santos, R.G. Boosting the Higher Heating Value of Eucalyptus Globulus via Thermochemical Liquefaction. Sustainability 2021, 13, 3717. [Google Scholar] [CrossRef]
  5. Heidari, A.; Khaki, E.; Younesi, H.; Lu, H.R. Evaluation of Fast and Slow Pyrolysis Methods for Bio-Oil and Activated Carbon Production from Eucalyptus Wastes Using a Life Cycle Assessment Approach. J. Clean. Prod. 2019, 241, 118394. [Google Scholar] [CrossRef]
  6. Vidal, M.; Bastos, D.; Silva, L.; Gaspar, D.; Paulo, I.; Matos, S.; Vieira, S.; Bordado, J.M.; Galhano dos Santos, R. Up-Cycling Tomato Pomace by Thermochemical Liquefaction—A Response Surface Methodology Assessment. Biomass Bioenergy 2022, 156, 106324. [Google Scholar] [CrossRef]
  7. Mateus, M.M.; Ventura, P.; Rego, A.; Mota, C.; Castanheira, I.; Moura Bordado, J.; Galhano, R.; Santos, D. Acid Liquefaction of Potato (Solanum tuberosum) and Sweet Potato (Ipomoea batatas) Cultivars Peels—Pre-Screening of Antioxidant Activity/Total Phenolic and Sugar Contents. Bioresources 2017, 12, 1463–1478. [Google Scholar] [CrossRef] [Green Version]
  8. Xu, J.; Xie, X.; Wang, J.; Jiang, J. Directional Liquefaction Coupling Fractionation of Lignocellulosic Biomass for Platform Chemicals. Green. Chem. 2016, 18, 3124–3138. [Google Scholar] [CrossRef]
  9. Raj, T.; Chandrasekhar, K.; Naresh Kumar, A.; Kim, S.H. Lignocellulosic Biomass as Renewable Feedstock for Biodegradable and Recyclable Plastics Production: A Sustainable Approach. Renew. Sustain. Energy Rev. 2022, 158, 112130. [Google Scholar] [CrossRef]
  10. Mateus, M.M.; Gaspar, D.; Matos, S.; Rego, A.; Motta, C.; Castanheira, I.; Bordado, J.M.; Galhano Dos Santos, R. Converting a Residue from an Edible Source (Ceratonia Siliqua L.) into a Bio-Oil. J. Environ. Chem. Eng. 2019, 7, 103004. [Google Scholar] [CrossRef]
  11. Rodrigues José; Puls Jürgen; Faix Oskar; Pereira Helena Determination of Monosaccharide Composition of Eucalyptus. Holzforschung 2001, 55, 265–269. [CrossRef]
  12. Salazar, M.M.; Grandis, A.; Pattathil, S.; Neto, J.L.; Camargo, E.L.O.; Alves, A.; Rodrigues, J.C.; Squina, F.; Cairo, J.P.F.; Buckeridge, M.S.; et al. Eucalyptus Cell Wall Architecture: Clues for Lignocellulosic Biomass Deconstruction. Bioenergy Res. 2016, 9, 969–979. [Google Scholar] [CrossRef]
  13. Kunaver, M.; Anžlovar, A.; Žagar, E. The Fast and Effective Isolation of Nanocellulose from Selected Cellulosic Feedstocks. Carbohydr. Polym. 2016, 148, 251–258. [Google Scholar] [CrossRef]
  14. Bose, S.K.; Barber, V.A.; Alves, E.F.; Kiemle, D.J.; Stipanovic, A.J.; Francis, R.C. An Improved Method for the Hydrolysis of Hardwood Carbohydrates to Monomers. Carbohydr. Polym. 2009, 78, 396–401. [Google Scholar] [CrossRef]
  15. Alves, E.F.; Bose, S.K.; Francis, R.C.; Colodette, J.L.; Iakovlev, M.; van Heiningen, A. Carbohydrate Composition of Eucalyptus, Bagasse and Bamboo by a Combination of Methods. Carbohydr. Polym. 2010, 82, 1097–1101. [Google Scholar] [CrossRef]
  16. Grembecka, M.; Lebiedzińska, A.; Szefer, P. Simultaneous Separation and Determination of Erythritol, Xylitol, Sorbitol, Mannitol, Maltitol, Fructose, Glucose, Sucrose and Maltose in Food Products by High Performance Liquid Chromatography Coupled to Charged Aerosol Detector. Microchem. J. 2014, 117, 77–82. [Google Scholar] [CrossRef]
  17. Debebe, A.; Temesgen, S.; Redi-Abshiro, M.; Chandravanshi, B.S.; Ele, E. Improvement in Analytical Methods for Determination of Sugars in Fermented Alcoholic Beverages. J. Anal. Methods Chem. 2018, 2018, 4010298. [Google Scholar] [CrossRef] [PubMed] [Green Version]
  18. Karlsson, G.; Winge, S.; Sandberg, H. Separation of Monosaccharides by Hydrophilic Interaction Chromatography with Evaporative Light Scattering Detection. J. Chromatogr. A 2005, 1092, 246–249. [Google Scholar] [CrossRef]
  19. Chávez-Servín, J.L.; Castellote, A.I.; López-Sabater, M.C. Analysis of Mono- and Disaccharides in Milk-Based Formulae by High-Performance Liquid Chromatography with Refractive Index Detection. J. Chromatogr. A 2004, 1043, 211–215. [Google Scholar] [CrossRef] [PubMed]
  20. Sheng, C.; Azevedo, J.L.T. Estimating the Higher Heating Value of Biomass Fuels from Basic Analysis Data. Biomass Bioenergy 2005, 28, 499–507. [Google Scholar] [CrossRef]
  21. Gagic, T.; Perva-Uzunalic, A.; Knez, Ž.; Škerget, M. Hydrothermal Treatment of Sugars to Obtain High-Value Products. J. Serb. Chem. Soc. 2020, 85, 97–109. [Google Scholar] [CrossRef]
  22. Evtuguin, D.; Neto, C. Recent Advances in Eucalyptus Wood Chemistry: Structural Features Through the Prism of Technological Response. 2007. Available online: https://www.eucalyptus.com.br/icep03/20Evtuguin.text.pdf.pdf (accessed on 15 March 2021).
  23. Sweygers, N.; Alewaters, N.; Dewil, R.; Appels, L. Microwave Effects in the Dilute Acid Hydrolysis of Cellulose to 5-Hydroxymethylfurfural. Sci. Rep. 2018, 8, 7719. [Google Scholar] [CrossRef] [Green Version]
  24. Stick, R.V.; Williams, S.J. Disaccharides, Oligosaccharides and Polysaccharides. Carbohydr. Essent. Mol. Life 2009, 2, 321–341. [Google Scholar] [CrossRef]
  25. Ruiz, H.A.; Zanuso, E.; Lara-Flores, A.A.; Aguilar, D.L.; Velazquez-Lucio, J.; Aguilar, C.N.; Rodriguez-Jasso, R.M. Kinetic Modeling, Operational Conditions, and Biorefinery Products from Hemicellulose: Depolymerization and Solubilization during Hydrothermal Processing. In Hydrothermal Processing in Biorefineries: Production of Bioethanol and High. Added-Value Compounds of Second. and Third Generation Biomass; Springer: Berlin/Heidelberg, Germany, 2017; pp. 141–160. [Google Scholar] [CrossRef]
  26. Wang, Y.L.; Chow, S.Y.; Lin, Y.T.; Hsieh, Y.C.; Lee, G.C.; Liaw, S.H. Structures of Trehalose Synthase from Deinococcus Radiodurans Reveal That a Closed Conformation Is Involved in Catalysis of the Intramolecular Isomerization. Acta Crystallogr. D Biol. Crystallogr. 2014, 70, 3144–3154. [Google Scholar] [CrossRef] [PubMed] [Green Version]
  27. Garrote, G.; Kabel, M.A.; Schols, H.A.; Falqué, E.; Domínguez, H.; Parajó, J.C. Effects of Eucalyptus Globulus Wood Autohydrolysis Conditions on the Reaction Products. J. Agric. Food Chem. 2007, 55, 9006–9013. [Google Scholar] [CrossRef]
  28. Gullón, P.; González-Muñoz, M.J.; van Gool, M.P.; Schols, H.A.; Hirsch, J.; Ebringerová, A.; Parajó, J.C. Structural Features and Properties of Soluble Products Derived from Eucalyptus Globulus Hemicelluloses. Food Chem. 2011, 127, 1798–1807. [Google Scholar] [CrossRef]
  29. Zaky, A.S.; Pensupa, N.; Andrade-Eiroa, Á.; Tucker, G.A.; Du, C. A New HPLC Method for Simultaneously Measuring Chloride, Sugars, Organic Acids and Alcohols in Food Samples. J. Food Compos. Anal. 2017, 56, 25–33. [Google Scholar] [CrossRef]
  30. Snyder, L.R.; Kirkland, J.J.; Dolan, J.W. Introduction to Modern Liquid Chromatography; John Wiley & Sons, Inc.: Hoboken, NJ, USA, 2010. [Google Scholar] [CrossRef]
  31. Chinnici, F.; Spinabelli, U.; Riponi, C.; Amati, A. Optimization of the Determination of Organic Acids and Sugars in Fruit Juices by Ion-Exclusion Liquid Chromatography. J. Food Compos. Anal. 2005, 18, 121–130. [Google Scholar] [CrossRef]
  32. Ribeiro Vasconcelos De Sá, L.; de Oliveira Moutta, R.; Pinto Da Silva Bon, E.; Christe Cammarota, M.; Ferreira-Leitão, V.S. Fermentative Biohydrogen Production Using Hemicellulose Fractions: Analytical Validation for C5 and C6-Sugars, Acids and Inhibitors by HPLC. Int. J. Hydrogen Energy 2015, 40, 13888–13900. [Google Scholar] [CrossRef]
  33. Yu, Y.; Chua, Y.W.; Wu, H. Characterization of Pyrolytic Sugars in Bio-Oil Produced from Biomass Fast Pyrolysis. Energy Fuels 2016, 30, 4145–4149. [Google Scholar] [CrossRef]
  34. dos Santos, R.G.; Jesus, A.R.; Caio, J.M.; Rauter, A.P. Fries-Type Reactions for the C-Glycosylation of Phenols. Curr. Org. Chem. 2010, 15, 128–148. [Google Scholar] [CrossRef]
  35. Santos, R.G.; Xavier, N.M.; Bordado, J.C.; Rauter, A.P. Efficient and First Regio- and Stereoselective Direct C-Glycosylation of a Flavanone Catalysed by Pr(OTf)3 under Conventional Heating or Ultrasound Irradiation. Eur. J. Org. Chem. 2013, 2013, 1441–1447. [Google Scholar] [CrossRef]
  36. Mateus, M.M.; Vieira, S.; Bastos, D.; Matos, S.; Gaspar, D.; Bordado, J.C.; Galhano, R.; Santos, D. GC-MS Analysis and Characterization of Bio-Oil from Sweet Potato Peel-A Putative Bio-Fuel. J. Mater. Sci. Technol. Res. 2019, 6, 110–119. [Google Scholar] [CrossRef] [Green Version]
  37. Laurson, P.; Raudsepp, P.; Kaldmäe, H.; Kikas, A.; Mäeorg, U. The Deconvolution of FTIR-ATR Spectra to Five Gaussians for Detection of Small Changes in Plant-Water Clusters. AIP Adv. 2020, 10, 085214. [Google Scholar] [CrossRef]
  38. Xiao, B.; Sun, X.F.; Sun, R. Chemical, Structural, and Thermal Characterizations of Alkali-Soluble Lignins and Hemicelluloses, and Cellulose from Maize Stems, Rye Straw, and Rice Straw. Polym. Degrad. Stab. 2001, 74, 307–319. [Google Scholar] [CrossRef]
  39. Zhou, G.; Taylor, G.; Polle, A. FTIR-ATR-Based Prediction and Modelling of Lignin and Energy Contents Reveals Independent Intra-Specific Variation of These Traits in Bioenergy Poplars. Plant. Methods 2011, 7, 9. [Google Scholar] [CrossRef] [PubMed] [Green Version]
  40. Goncalves, D.; Orišková, S.; Matos, S.; Machado, H.; Vieira, S.; Bastos, D.; Gaspar, D.; Paiva, R.; Bordado, J.C.; Rodrigues, A.; et al. Thermochemical Liquefaction as a Cleaner and Efficient Route for Valuing Pinewood Residues from Forest Fires. Molecules 2021, 26, 7156. [Google Scholar] [CrossRef]
  41. Doulati Ardejani, F.; Badii, K.; Limaee, N.Y.; Shafaei, S.Z.; Mirhabibi, A.R. Adsorption of Direct Red 80 Dye from Aqueous Solution onto Almond Shells: Effect of PH, Initial Concentration and Shell Type. J. Hazard. Mater. 2008, 151, 730–737. [Google Scholar] [CrossRef]
  42. Mohebby, B. Application of ATR Infrared Spectroscopy in Wood Acetylation. J. Agric. Sci. Technol. 2008, 10, 253–259. [Google Scholar] [CrossRef]
  43. Kizil, R.; Irudayaraj, J.; Seetharaman, K. Characterization of Irradiated Starches by Using FT-Raman and FTIR Spectroscopy. J. Agric. Food Chem. 2002, 50, 3912–3918. [Google Scholar] [CrossRef]
  44. Yona, A.M.C.; Budija, F.; Kričej, B.; Kutnar, A.; Pavlič, M.; Pori, P.; Tavzes, Č.; Petrič, M. Production of Biomaterials from Cork: Liquefaction in Polyhydric Alcohols at Moderate Temperatures. Ind. Crops Prod. 2014, 54, 296–301. [Google Scholar] [CrossRef]
Figure 1. Flowchart followed in characterisation of aqueous extract.
Forests 14 00799 g001
Figure 2. HPLC chromatogram of aqueous extract sugars, with ACN/H2O as the mobile phase at a flow rate of 0.6 mL/min and column temperature of 28 °C.
Forests 14 00799 g002
Figure 3. Scheme of monosaccharide and disaccharide formation from holocellulose.
Forests 14 00799 g003
Figure 4. Superimposed HSQC spectra of hydrolytic sugars (blue) and the mixture standards (red).
Forests 14 00799 g004
Figure 5. Mechanism of glycoside formation from alkylphenolic moieties (above), and glycoside formation from 2-ethylhexanol (below).
Forests 14 00799 g005
Figure 6. FTIR-ATR spectra of aqueous extract of bio-oil of Eucalyptus globulus.
Forests 14 00799 g006
Table 1. Elemental analysis of the aqueous extract from eucalyptus globulus bio-oil.
Elemental Composition (%)
SamplesCHO
Aqueous extract43.019.2047.79
Bio-oil [12]69.5310.1417.82
Eucalyptus globulus [12]48.725.9944.67
Table 2. Concentrations of hydrolytic sugars found in aqueous fractions obtained by the thermochemical liquefaction of Eucalyptus globulus, characterised by HPLC-RID.
CompoundHPLC Concentration
(mg/mL)
Aqueous Extract Concentration (mg/mL)
Fructose9.57105.27
Glucose8.7295.92
Sucrose3.9643.56
Trehalose1.2613.86
Xylose2.6529.15
Table 3. Calibration data used for HPLC-RID quantification of sugars from thermochemical liquefaction of Eucalyptus globulus.
CompoundStandard Curve a (Linearity from 1 to 25 mg/mL)R2LOD b (mg/mL)LOQ c (mg/mL)
Fructosey = 25.331x − 55.8650.99723.229.76
Glucosey = 24.877x − 78.0060.99544.1712.63
Sucrosey = 248.64x − 8.5550.98617.2221.89
Trehalosey = 206.17x − 16.7040.99275.2415.88
Xylosey = 191.38x − 106.230.98946.3319.19
a x: concentration (mg/mL); y: peak area; b LOD: limit of detection; c LOQ: limit of quantification
Disclaimer/Publisher’s Note: The statements, opinions and data contained in all publications are solely those of the individual author(s) and contributor(s) and not of MDPI and/or the editor(s). MDPI and/or the editor(s) disclaim responsibility for any injury to people or property resulting from any ideas, methods, instructions or products referred to in the content.