Article

Analysis of Soil–Water Characteristics and Stability Evolution of Rainfall-Induced Landslide: A Case of the Siwan Village Landslide

1
Key Laboratory of New Technology for Construction of Cities in Mountain Area of the Ministry of Education, National Joint Engineering Research Center for Prevention and Control of Environmental GeoHazards in the TGR Area, School of Civil Engineering, Chongqing University, Chongqing 400045, China
2
Chongqing Institute of Geology and Mineral Resources, Chongqing 400042, China
3
State Key Laboratory of Hydroscience and Engineering, Department of Hydraulic Engineering, Tsinghua University, Beijing 100190, China
*
Author to whom correspondence should be addressed.
Forests 2023, 14(4), 808; https://doi.org/10.3390/f14040808
Submission received: 12 March 2023 / Revised: 6 April 2023 / Accepted: 12 April 2023 / Published: 14 April 2023

Abstract

:
This paper aimed to study the soil–water characteristics and stability evolution law of rainfall-induced landslide. Taking the two landslide events in Siwan village as an example, the formation conditions of the disaster and landslide characteristics were analyzed. Additionally, the deformation characteristics and destruction mechanisms of landslides were discussed in-depth. The soil–water characteristics and hydraulic conductivity of the landslides were analyzed based on TRIM experiment results. Geo-Studio numerical software was further used for typical sections to analyze the stability of the evolution of the landslide events under rainfall conditions. The results showed that (1) The soil–water characteristic curve (SWCC) inversely varies with water content volume, and the sliding body has lower saturated water content and matrix suction than the sliding zone. The hydraulic conductivity function (HCF) increases with water content volume, and the sliding body has higher hydraulic conductivity (0.43 m/d) than the sliding zone (0.03 m/d). (2) Rainfall is the primary cause of landslides, and there is a hysteretic effect. Heavy rainfall will inevitably accelerate the formation of landslides in the analysis of the deformation characteristics and destruction mechanisms of rainfall-induced landslides. (3) Compared with the engineering analogy of the Fredlund and Xing (FX) model, the Van Genuchten–Mualem (VGM) model of the soil–water characteristics test based on the TRIM experimental system can better reflect the actual field situation. The numerical simulation method based on the TRIM experiments of the soil–water characteristics test is scientifically sound and reliable for the stability evolution of overburden rainfall-induced landslides.

1. Introduction

The geological conditions of mountain regions are complicated, often accompanied by changes in meteorological and hydrological conditions. These lead to frequent geological disasters. Northeast Chongqing and the Three Gorges Reservoir area, in China, are typical areas with frequent landslide events [1,2]. The forest coverage is extensive, and the mountain features are remarkable in these areas. Small and shallow soil landslides occur widely in the rainy season [3]. The stability of these landslides is closely related to the rainfall-induced change of soil–water characteristics.
Soil–water characteristic curves and hydraulic conductivity functions are significant in the research of unsaturated soil seepage [4,5]. The normal method used for analyzing slope stability is confronted with some problems when analyzing natural slope problems. Many factors such as time and climate affect the stability of natural slopes. To predict and prevent geological disasters, such as landslides caused by heavy rainfall, soil–water content change is significant [6,7]. In actual engineering, it is necessary to conduct experimental research on saturated soil to understand the variability of its soil–water characteristics. However, using a soil–water characteristic curve can be very convenient to understand the characteristics of unsaturated soil without the need for tedious experimental research [8,9]. Due to the complex geological structure and climatic conditions of the Sichuan–Chongqing area, China, precipitation infiltration often leads to excessive deformation or landslide events of unsaturated mixed soil in the area. The engineering properties of unsaturated soil are closely related to the matrix suction value [10]. Soil–water characteristic curves play a vital role in the study of the hydraulic and mechanical properties of unsaturated soil. Due to the structural nature of undisturbed loess, the matrix suction of undisturbed loess does not increase infinitely with the increase of load [11]. A strong relationship exists between slope instability and rainfall infiltration, and parameter analysis provides a deeper understanding of this relationship. The transient seepage field caused by rainwater infiltration can be simulated by the finite element method, and also the transient pore water pressure distribution can be used for limit equilibrium analysis of slopes [6]. A series of one-dimensional seepage tests were conducted to study the variation of wetting front, hydraulic conductivity, and vertical deformation under water stress coupling [12]. However, based on the soil–water characteristics test, no numerical simulation is combined, a seepage numerical simulation is not used, and no analysis is verified with field examples. It is only the deformation mechanisms that are analyzed.
Numerical simulation technology has been widely used in the study of conventional geological disasters, and significant progress has been made in the calculation methods, calculation models, and determination of rock and soil parameters [13]. Numerical simulation can easily consider all possible working conditions on site, which is helpful for quick analysis and making decisions during emergencies or for the prevention of disasters [14,15]. In particular, Geo-Studio can better solve the slope finite element simulation problem of the coupled numerical test [16]. FEM, BEM, DEM, and FDM are commonly used for numerical slope simulation, and the available software includes MIDAS-GTS /NX, Mein-Larson, UDEC discrete element, FLAC3D, ABAQUS, and Geo-Studio [17,18,19,20,21,22,23]. After comparing the advantages of each software and method, it was found that Geo-Studio can be meaningfully combined with transient tests and numerical stability. Geo-slope/W software is used dynamically to analyze the stability of slopes and has the advantage of providing feedback on emergency monitoring information [24]. The SEEP/W module of the Geo-Studio software was used to simulate the seepage rate [25].
Moreover, the numerical simulation method in which SIGMA/W and SLOPE/W modules are combined was adopted to study slope stability from the stability coefficient [26]. Geo-Studio numerical software was used to establish an engineering model to predict the stability coefficient and potential slip surface of the east slope [27]. In combination with geotechnical test data, the SEEP/W module of the Geo-Studio software and the SLOPE/W module were used to perform seepage stability simulations of landslides under various precipitation periods [28]. The soil–water characteristic parameters used in the abovementioned study were obtained using the engineering analogy SEEP/W module transient dynamic analysis, which may differ from the actual soil–water characteristics of the landslide [29]. Therefore, it is of scientific significance and necessary to use soil and water characteristics data of the TRIM Dehumidification and Hygroscopic experiment system to replace the Geotechnical data of the engineering analogy method.
In this paper, the research methodology and presented findings are highly innovative. By combining remote sensing images, drone images, meteorological data, and on-site investigation data, this paper provides a detailed analysis of two landslide events in Siwan Village. The stability of the landslides was analyzed using a combination of the Van Genuchten–Mualem (VGM) model parameters and numerical simulation methods, as well as the Fredlund and Xing (FX) model parameters and engineering analogy methods. The evolution of stability verified the accuracy and effectiveness of the prediction methods. Additionally, this paper proposed a detailed survey of surface tension cracks during heavy rain, offering new insights for considering rainfall as a special delayed phenomenon in landslides. Notably, this paper integrated the TRIM moisture absorption and desorption test system with numerical simulation, introducing a new method that provides fresh ideas and insights for analyzing the stability of rainfall-induced landslides.

2. Materials

2.1. Landslide Events and Disaster-Causing Conditions

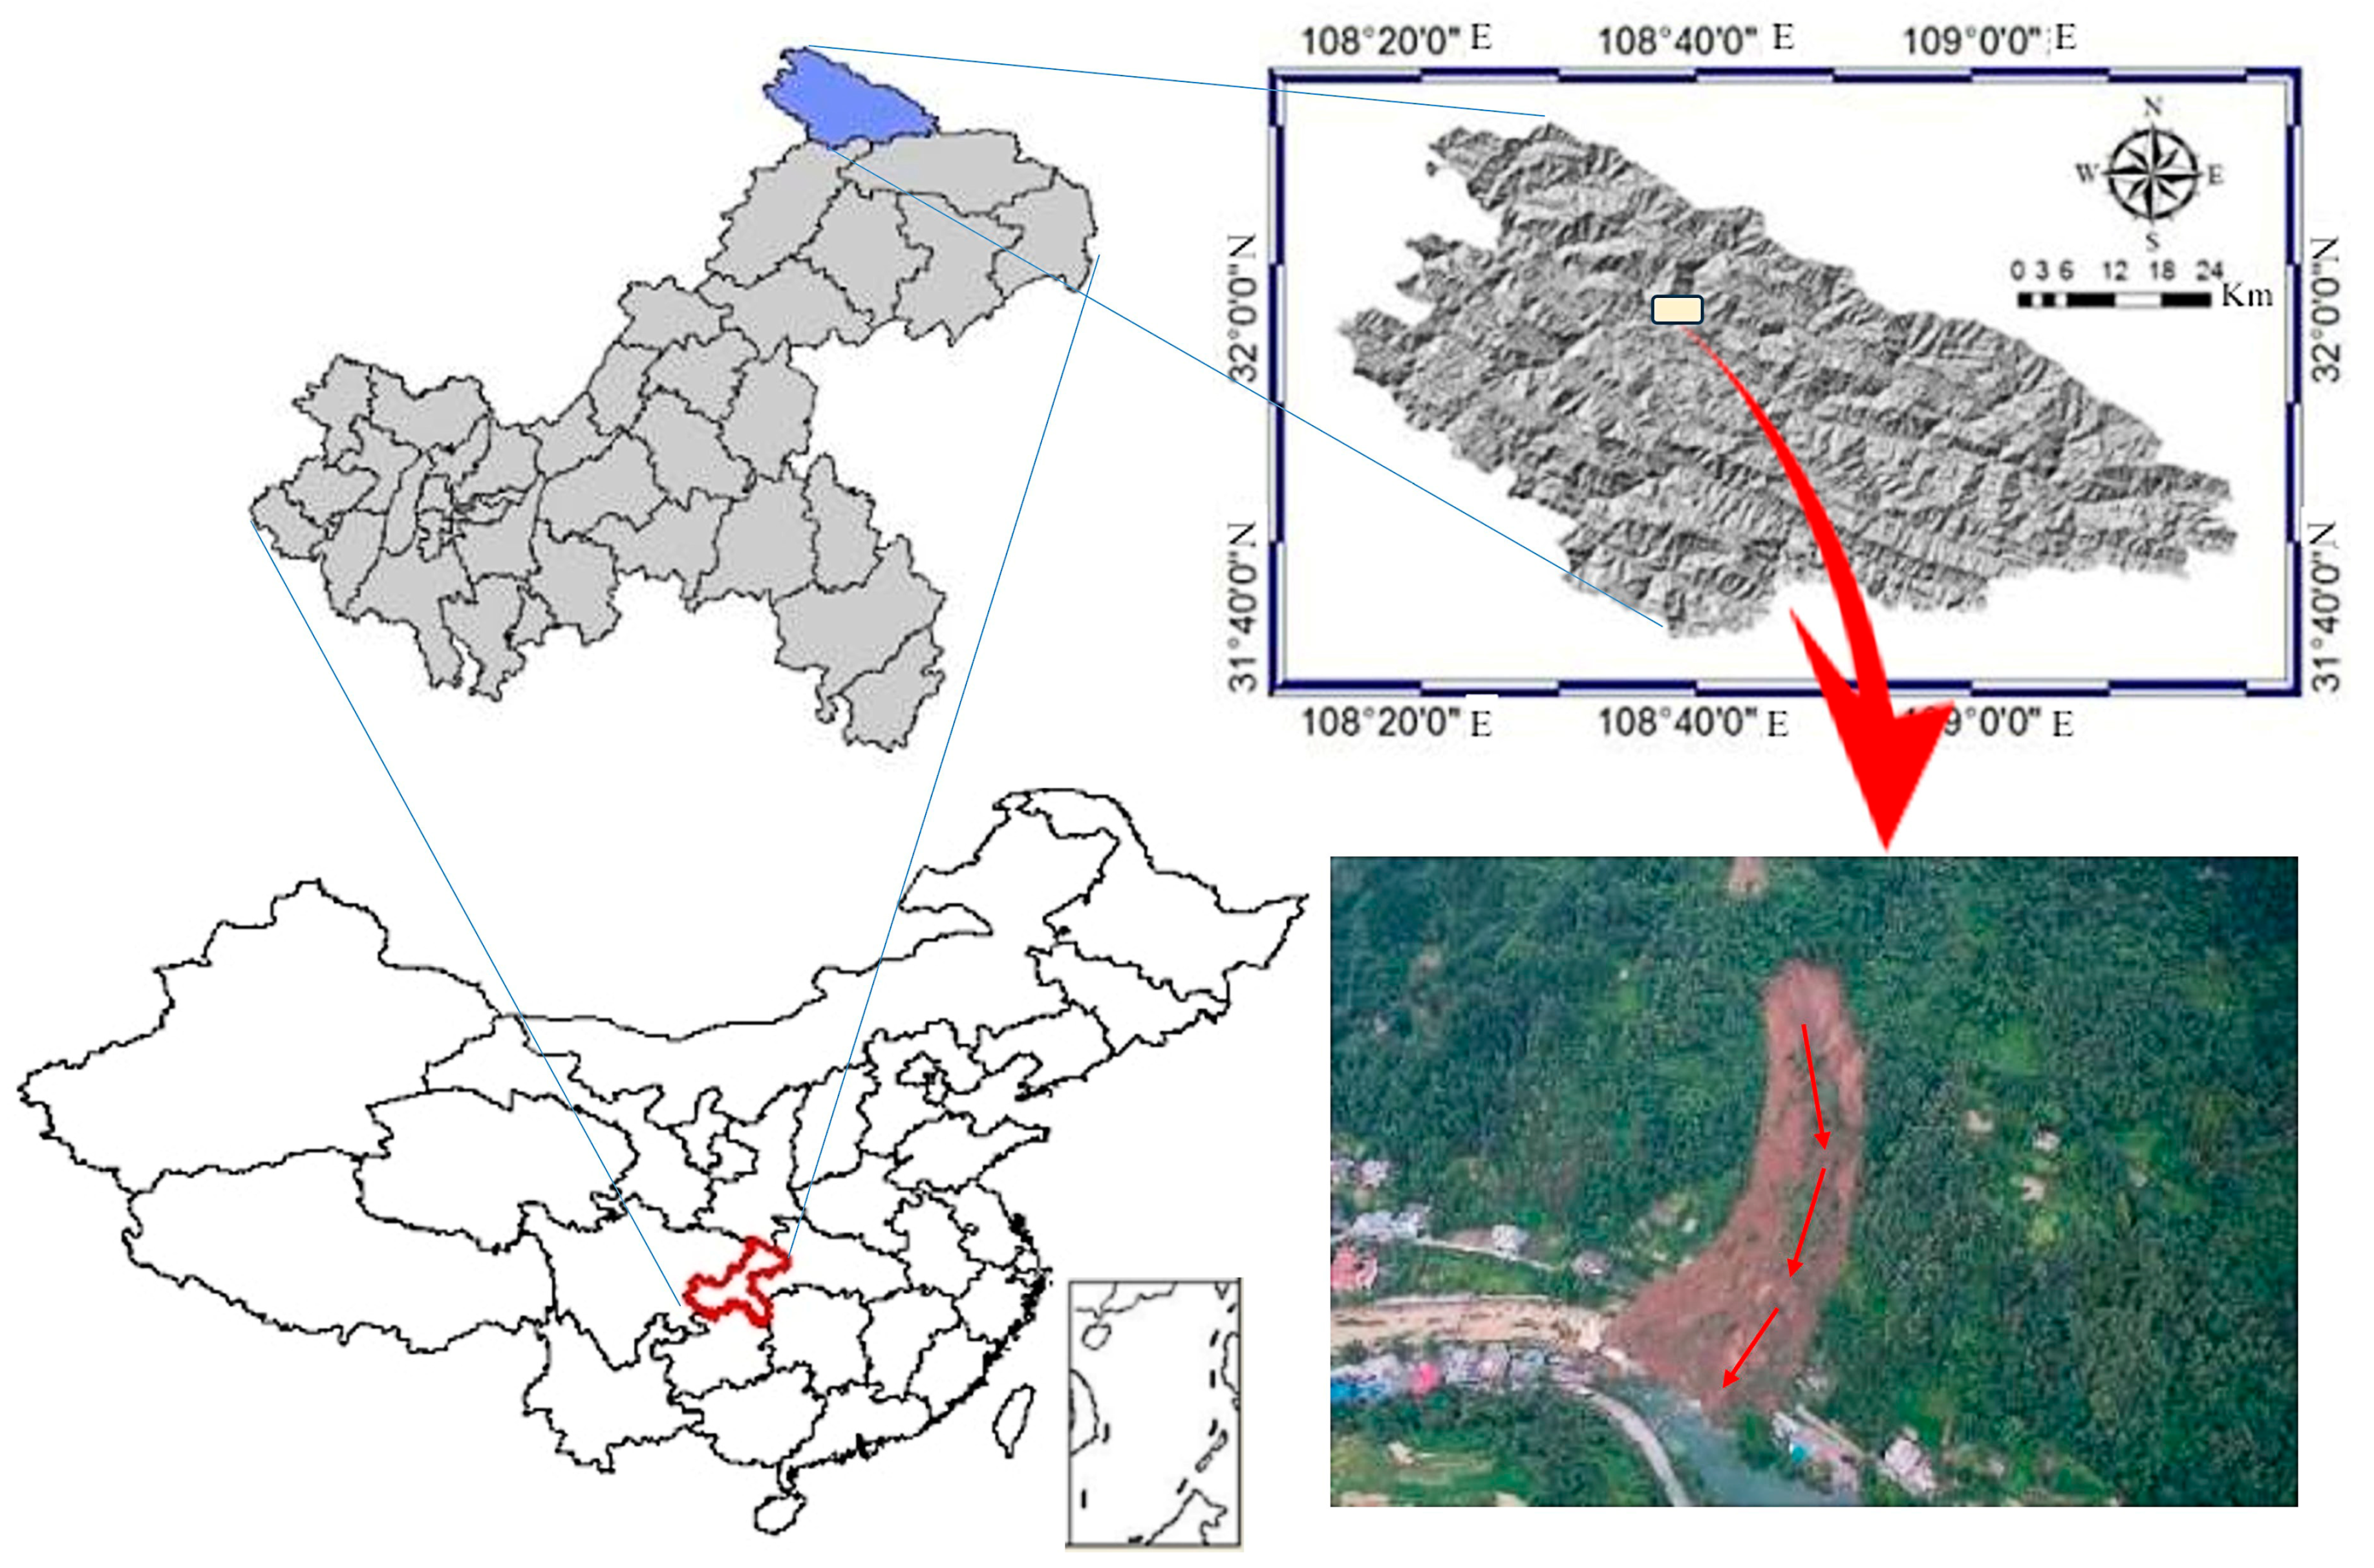
2.1.1. Overview of the Landslide Events

A landslide occurred on the right bank of Longtan River, a tributary of Renhe River, in Siwan Village, Longtian Township, Chengkou County, on 31 July 2019. Two weeks later, another landslide occurred around 3 am on 14 August. The landslides occurred on 31°58’38 “N and 108°38’35” E (Figure 1). Using DEM with 0.5 m spatial resolution, combined with Google Earth 3D images, UAV images, and site survey data, this study found that the landslide caused damage to 3 houses and a brick factory, resulting in 7 people missing. After 39 h of searching, 7 people were confirmed dead. The remote sensing image (Figure 2) shows the landslide’s general situation and damage to the surrounding area. The event occurred in a mountainous forest with favorable conditions for vegetation due to temperature, humidity, and precipitation. The soft soil rich in organic matter also makes it prone to rainfall-induced shallow landslides.

2.1.2. Conditioning and Triggering Factors

  • Topography and Landform
The landslide area belongs to the deep-cutting erosion landform of moderate mountain valleys; it has high mountains and deep valleys, intense landform cutting, and complex rock, soil, and geological structures. At the bottom of the valley, the intense erosion of water cuts into snake-like valleys and narrow valleys, and the valley slopes on both sides are mostly “V” shaped. The landform is generally high in the northwest and low in the southeast, and the overall landform is a single steep slope. The top (watershed) elevation is about 1335 m, and the Longtan Riverbed at the foot of the slope is about 725 m, with a relative elevation difference of about 610 m; the catchment area is 0.2 km2. The original topography of the landslide area is a “saucer” type of negative landform, which is the primary channel for runoff and the discharge of the upper slope catchment. The upper part of the slope is relatively steep with a slope angle of 30–60°, while the lower part is relatively gentle with a slope angle of 10–20°. The rock–soil interface is the transfixion structural surface controlling the stability of the steep slope. Regarding space, it has good space conditions and gravity potential energy reserves, which provide a favorable landform and slip space for the formation and development of landslides.
2.
Geological conditions
The study area is located in the southwest wing of the secondary minor syncline, which is situated at the northeast wing of the paraxial part of the Chengkou–Gaoyan compound syncline in the Southern Daba mountain brush structural belt. The slight syncline extends in the direction of 29° NW. Under the influence of the fracture zone, the stratigraphy of the slope’s southwest flank is reversed, the northeast flank of the Doushantuo Formation is covered over the Dengying Formation, and the strata of the syncline axis is the Shuijingtuo Formation.
Cheng’s deep and large fault zone passes from the left side of the landslide, and the torsion action results in the formation of the whole arc structure. Under stress, the rock mass near the fault zone is transformed by tectonic action and shallow epigenetic action (such as unloading, weathering, and groundwater). This leads to fracture development and makes the rock mass structure and its surface complex. According to the observation of the bedrock outcrop, the strata are 50–72°∠54–80°. According to the regional geological data, two reverse faults are distributed near the collapse area, which intersects the northwest ridge of the collapse area at a slight angle. Because a quaternary system covers the landslide area, the fault-related signs and features are covered. The area of subsidence is between two faults, and the thick soil layer between the faults provides material conditions for the landslide.
3.
Meteorology and hydrology
Siwan Village’s landslide research area belongs to the Northern subtropical mountain climate of the Sichuan Basin. The climate of the region is mild, with abundant rainfall, sufficient sunshine, and four distinct seasons. The annual average temperature is about 13.8 °C. The annual maximum temperature was 14.9 °C in 2006, and the annual minimum temperature was 13.0 °C in 1974. The highest extreme temperature was 40.0 °C on 28 June 2006, and the lowest extreme temperature was −7.3 °C on 31 December 2012.
Meteorological data show that the average annual rainfall is 1261.40 mm and is for 166 days; the maximum annual rainfall was 1629.30 mm in 2003 and the lowest annual rainfall was 890.10 mm in 2006. The maximum daily rainfall was 285.80 mm on 10 July 2009. The precipitation is mainly concentrated in the flood season from May to September, which is 857.10 mm, and accounts for 68% of the total annual precipitation.
Siwan Village experiences typical rainfall-induced landslides. Generally speaking, rainfall has a significant role in inducing landslides. In addition to immediate rainfall, early rainfall also has a hysteretic effect on landslides. When the hysteretic effect of early rainfall is considered, it is called early effective rainfall [30]. The recent precipitation in the landslide area was analyzed using China’s meteorological information data (Figure 3).

2.2. Characteristics and Failure Mechanism of Landslide Events

2.2.1. Characteristics of Landslide Deformation and Failure

According to the 205 geological teams of the Chongqing Bureau of Geology and Mineral Exploration and Development that visited residents nearby in 2001, obvious deformation occurred in the LF4 position of the existing slump area, and a tension fracture roughly parallel to the landform contour line appeared (about 50 m and 1 m long) under the lateral slope body. No new significant changes were observed before 14 August 2019. According to the field investigation, multiple tension cracks were found at ZK6 after 14 August 2019 (Figure 4).
At about 9:30 am, on 31 July 2019, the soil mass above the water channel at the foot of the slope (with an elevation of about 735 m) and the landslide front slowly bulged; radiating cracks appeared and gradually intensified. Blocks started to fall and collapse, there were prominent shear outlets and dislocation, mud and muddy water seepage, and the landslide tongue was extended. The whole landslide moved slowly, and the trees on the slope became a “drunk forest”. The lower fault of the landslide formed a graben-type sinkhole zone, and the back wall of the landslide was about 6 m high, with water seeping out via the bottom. The flow rate was about 0.8–1.2 L/s. The landslide perimeter was obvious. The body length of the landslide is about 180 m, the average width is about 30 m, the thickness is 2–7 m, the average thickness is about 5 m, and the square volume is about 2.7 × 10⁴ m3. The sliding body is tongue-shaped, the sliding direction is the same as the slope direction, about 150°, the sliding distance is about 20 m, and the sliding surface is the soft surface inside the soil layer. The sliding zone is still unstable, the creep process is continuing, and the trailing edge slope of the sliding zone is potentially sliding.
At about 3:00 in the morning of 14 August, the trailing edge slope of the “7.31 landslide” suddenly slipped again. The elevation of the landslide start-up area is about 790–865 m; its length is 100 m and width is 60 m. It has an average thickness of about 15 m and a volume of about 9.0 × 10⁴ m3. The sliding direction is 125°, which is consistent with the slope direction of the original landform. The landslide slides along the soil–rock contact surface, and the angles of the slide surface area are between 30 ° and 50°. Under gravity, many high-sliding bodies slide at high speed, and the overburden of the lower slope body and the “7.31” landslide accumulated body slide along the rock–soil interface together. The topography controls the sliding direction; the sliding direction changes from 125° to 150–170° (the original slope direction), pushing the leading-edge soil to slide continuously. A fan-shaped accumulated body was formed at the foot of the slope, and a small amount of sliding body crossed the channel and blocked the front channel, forming a barrier lake locally. The total volume of the Siwan village landslide is about 11.7 × 10⁴ m3. It is about 1.0 × 10⁴ m3 at the trailing edge and both sides of the landslide. The loose soil is in an under-unstable state.
Combining the regional geological data (slide elevation information and site investigation data), we made the landslide lot plan and three-dimensional topographic map (Figure 2) and analyzed the section along the sliding direction to obtain the landslide profile (Figure 5). According to the analysis of the landslide’s surface and profile, the landslide sliding direction is the same as the original landform slope direction (deflection occurs), the landslide sliding damage occurs along the soil–rock contact surface and the slip surface undulates along the soil–rock interface in a folded development.
From the top to the bottom of the landslide, the glide direction of the plan ranges from 120° to 145°. Regarding the profile morphology of the landslide, the slope is between 20° and 35°, and the upper part of the slope body is steeper than the lower part, especially the upper part, which forms a convex profile slope. The field investigation found that the tension fracture at the trailing edge (ZK6 drill hole) is developed, and the gap width was 6–10 cm.

2.2.2. Analysis of Deformation and Failure Mechanism
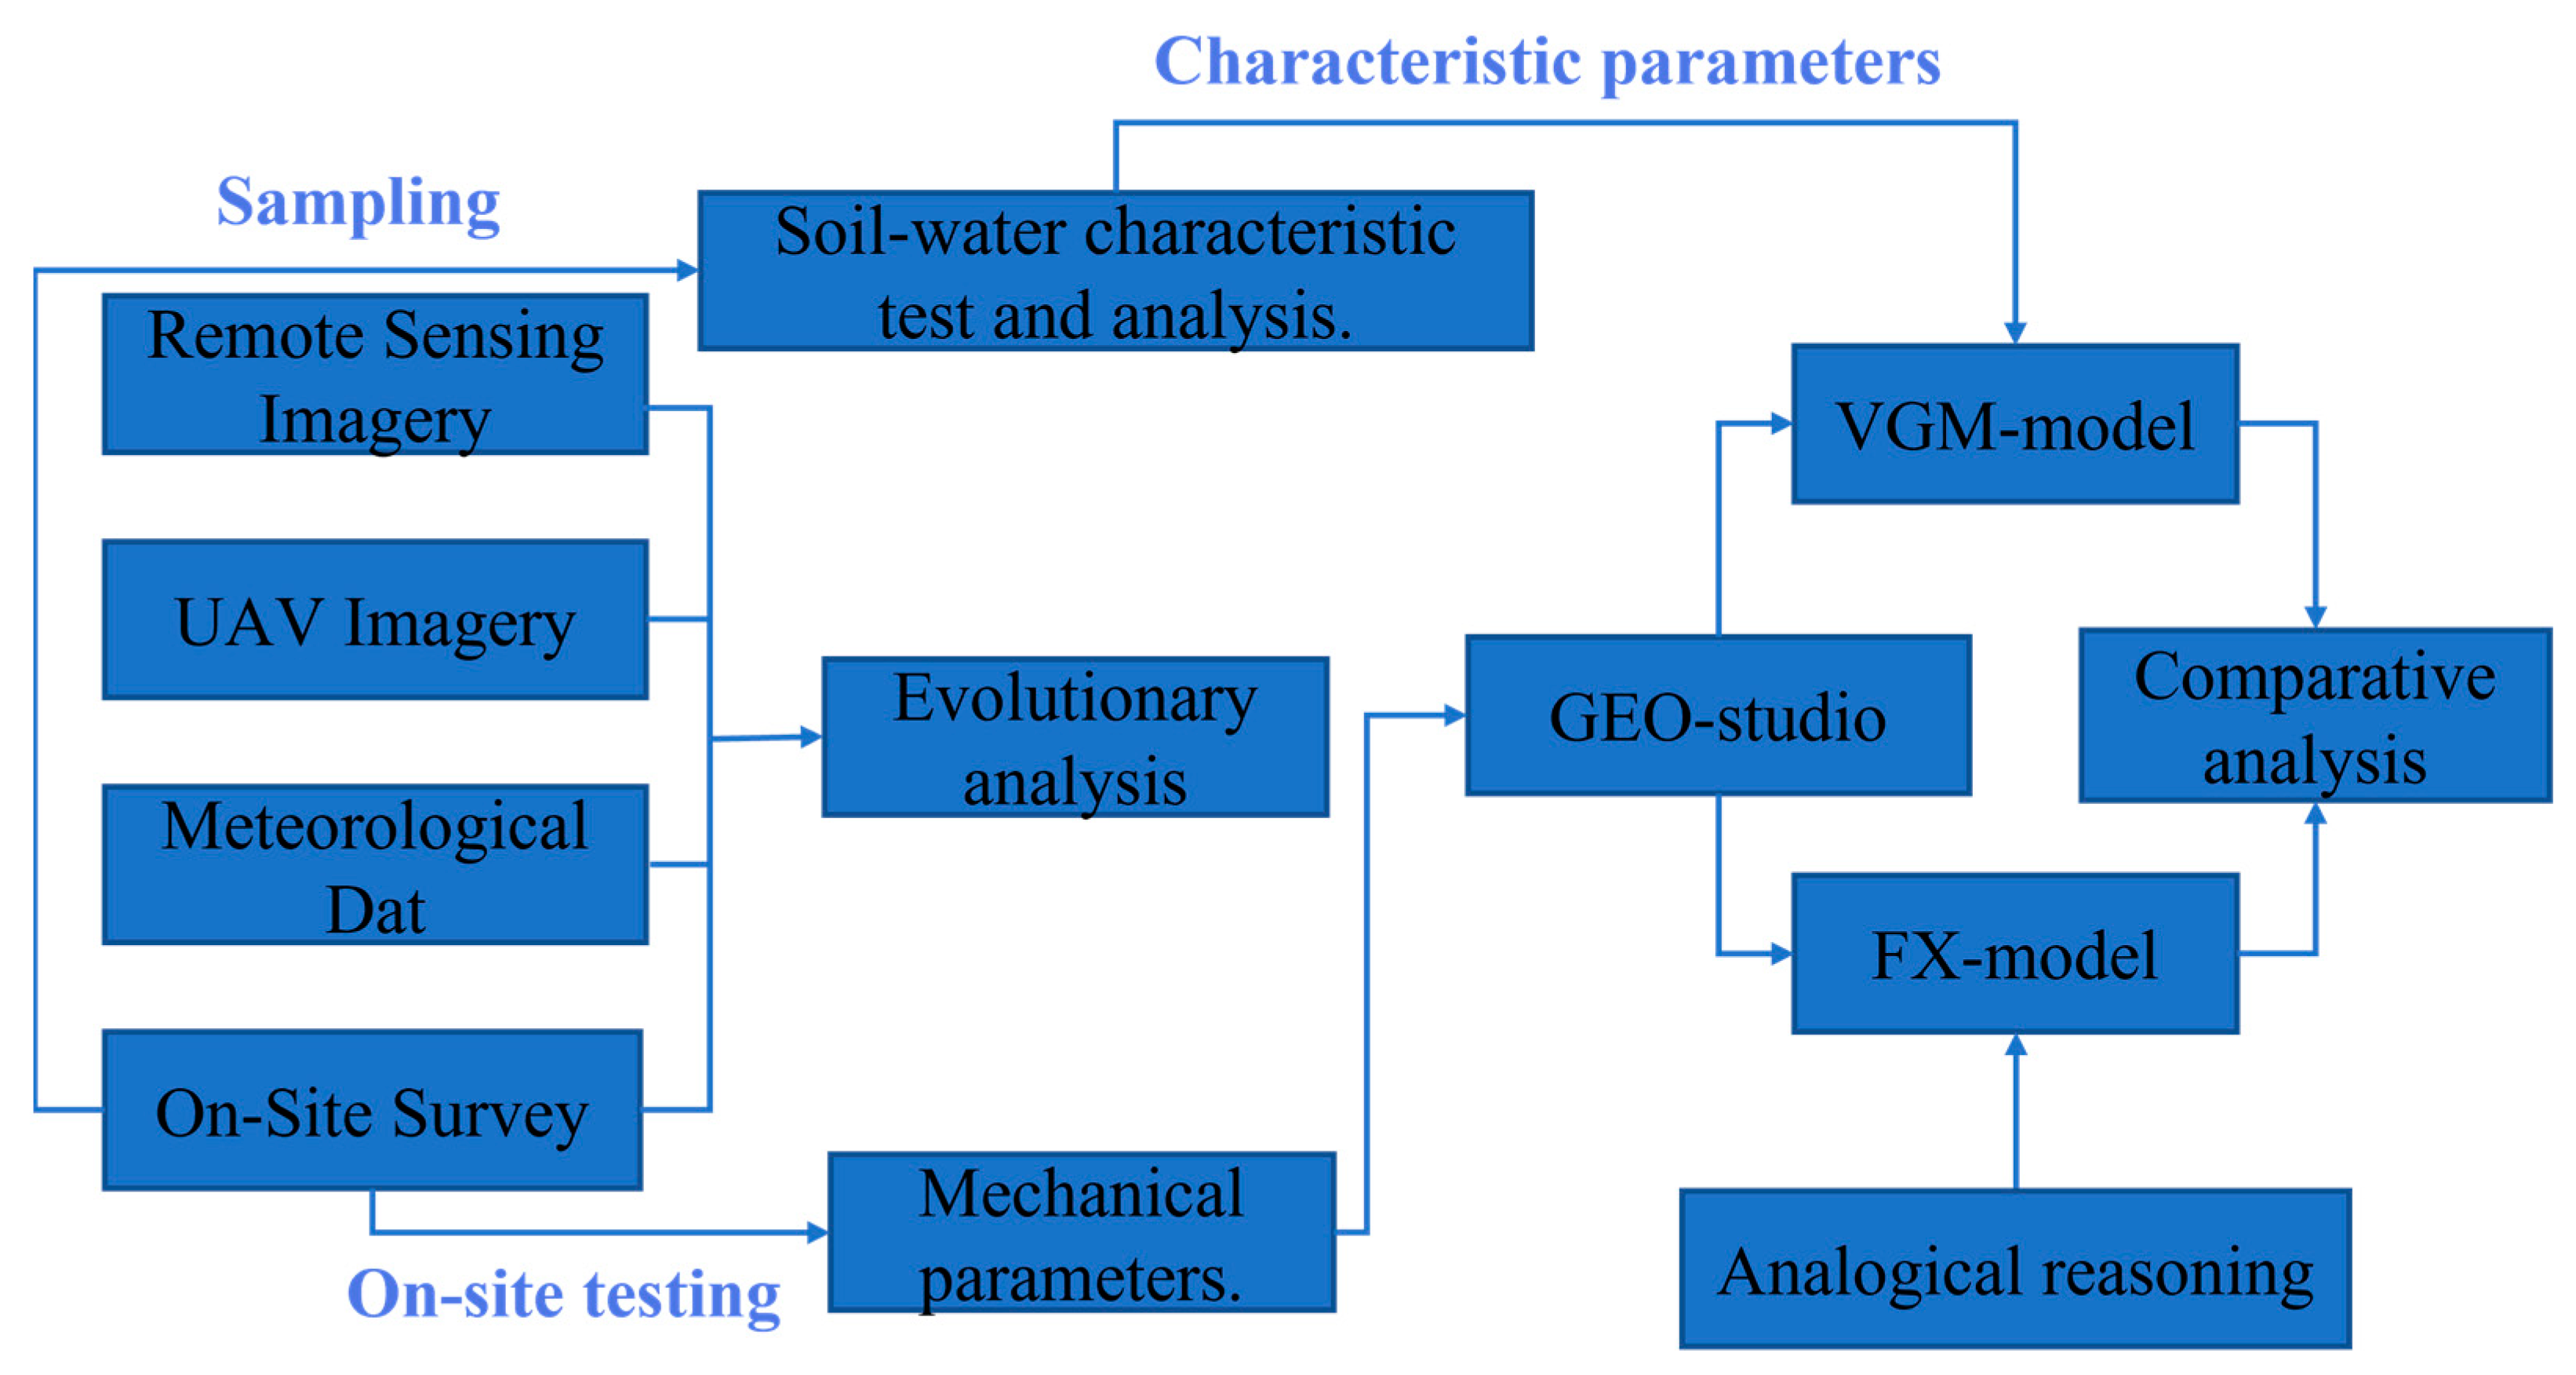
The fracture of the landslide area in the geological structure of the complex Daba Mountain arc-like folded belt is well developed. Under the action of tectonic spin–torsional stress, the rock near the fault zone is modified by tectonic and shallow epigenetic action, resulting in the complex rock structure, structural surface, fissure development, weathering, groundwater, and other kinds of external camp force that is active. The mechanical strength of the rock and soil is relatively weak. The landslide area is in the lower part of the “V” type river valley steep slope landform in Zhongshan, and the remote landform which is a “dish”-type negative geomorphology is the main channel of the upper slope drainage. The overall landform is steep, and the landform slope angle is above 30°–60°, overlying the fourth system collapse. The residual slope accumulation of the loose soil layer is about 20 m thick. The rock and soil interface controls the steep slope stability through the structural surface. The relative height difference between the landslide’s trailing edge and the slope’s foot is 125 m, with reasonable spatial proximity, slip space, and gravitational potential energy reserves. Under gravity conditions and tectonic stress field conditions dominated by horizontal stress, the maximum principal stress is parallel to the critical surface, causing a stress concentration zone (shear stress elevation zone) near the critical surface.
In July 2019, Chengkou County had a total rainfall amount of 193.7 mm for 20 days, including 12 consecutive days of rain from 15 July to 26 (Figure 3). The rainwater flowed over the Geomorphic negative slope, infiltrated the slope body, increased the slope body weight, and saturated and softened the soil. After sufficient rainwater infiltration through the pores of gravel soil, runoff is formed in the soil (the silty clay layer is a relatively waterproof layer), and some particles in the soil are carried and transported by osmotic water flow. Latent erosion earth–rock structure becomes loose, and its mechanical properties and intensity are reduced. There is the formation of dynamic water pressure and weak external agents in the active belt of groundwater. The stability of the slope is reduced. The shear creep of the slope soil occurred towards the sloping front, and the tension fracture developed from the slope to deep in the trailing edge. During the development of deformation, the powder clay layer (aquiclude) is the potential slip surface. With the further development of shear deformation, the lower part of the slope gradually rises, the trailing edge sinks significantly, the deformation enters the stage of progressive damage, and the potential slip surface is gradually sheared through. The first landslide event occurred at 9:00 am on 31 July; a thrust load caused the landslide.
Due to mass slippage in the middle and lower part of the slope, the upper rock mass has a large area of caving (the caving distance is about 20 m, with sufficient slip space), which destroys the original equilibrium state of the slope mass. The original stress state in the rock mass changes as the process progresses. It results in stress redistribution and stress concentration effects. When opening the overlying soil in the direction of the force that exceeds the shear resistance of the actual slip surface, the trailing edge cracking surface appeared to drop quickly. The creep process is concise; it is extremely sudden and concealed. On 14 August 2019, at 3:00, the upper slope in the starting zone soil slid along the geotechnical sliding interface; it belongs to the loose (retrogressive) type of landslide.
The formation process of the landslide can be divided into four stages, which are the first “7.31” sliding (front part of landslide area) + the second “8.14” loosening sliding (rear starting area of landslide) + mid–front pushing sliding + potential sliding area loosening sliding. The formation mechanism is complex.

3. Methodology

This paper mainly consists of three major modules, namely deformation and evolution analysis, soil–water characteristic tests, and numerical model comparative experiments. Figure 6 shows the flowchart of the entire article.

3.1. SWCC and HCF

The TRIM system integrates physical tests and numerical calculations, enabling real-time and accurate measurement of the volume of gas escaping from pore water. It is an optimal method for obtaining SWCC and HCF. The Van Genuchten–Mualem model is used in this system, and the calculation formula is as follows [31,32,33,34]:
Θ = θ θ r θ s θ r
Θ = [ 1 1 + { α p } n ] m p = 1 α [ 1 Θ 1 / m 1 ] 1 / n }
K r ( Θ ) = Θ q ( 0 Θ d Θ p ) 2 / ( 0 1 d Θ p ) 2 K ( Θ ) = K s K r ( Θ ) }
K r ( Θ ) = Θ q f ( Θ ) 2 / f ( 1 ) 2 f ( Θ ) = α { 1 ( 1 Θ 1 / m ) } m }
where, θ is the volumetric water content, θs is the saturated water content, and θr is the residual water content. Θ is the adequate saturation, α is the reciprocal of the intake pressure, and n is the aperture distribution parameter, m = 1−1/n. Ks is the saturated water conductivity, Kr is the relative hydraulic conductivity function, K is the unsaturated hydraulic conductivity function about Θ, and q is the empirical parameter of pore connectivity, usually assumed to be 0.5. The function F specified is a nonlinear function of soil moisture content (θ) used to describe the flow characteristics of water within the pores of soil.

3.2. Seepage

The SEEP/W module calculates soil moisture content using the soil–water characteristic curve, which estimates soil matrix suction since matrix suction is hard to measure (such as Equations (5) and (6). The soil–water characteristic curve and conductivity may be used to determine the permeability function curve of unsaturated soil. The fitting formula for the conductivity was developed by Fredlund et al. (such as Equation (7)) [35,36,37].
θ w θ s = C ( ψ ) 1 { l n [ e + ( ψ a ) n ] } m
C ( ψ ) = 1 - ln ( 1 + ψ C r ) ln ( 1 + 10 6 C r )
k w = k s i = j N θ w ( e y ) θ w ( ψ ) e y i θ ( e y i ) i = j N θ w ( e y ) θ s e y i θ ( e y i )
where, a —soil parameters of air entry value function, n—soil parameters controlling the slope of inflection point of volumetric water content function, m—soil parameters of residual water content function, ψ —matrix suction, Cr—constants related to matrix suction corresponding to residual water content, θw—volumetric water content, θs—saturated volumetric water content, kw—Conductivity, ks—saturated conductivity, y—virtual integral variable, θ —the first derivative of volumetric water content.

3.3. Stability

The SLOPE/W module is used for stability calculation, using the fully designated sliding surface method to determine the sliding surface position for landslides. Morgensten—Price method is used to calculate the stability coefficient under rainfall. The corresponding calculation formula is as follows [38,39]:
X = E λ f ( x )
s = c + ( σ n u z ) tan ϕ + ( u a u w ) [ ( θ w θ r θ s θ r ) tan ϕ ]
S m = s β F
F m = ( c β R + ( N u w β ) R tan ϕ ) W x N f ± D d
F f = ( c β cos α + ( N u w β ) tan ϕ cos α ) N sin α D cos ω
N = W + ( X R X L ) c β sin α + u w β sin α tan ϕ F cos α + sin α tan ϕ F
where, X is the interstrip shear force, E is the interstrip axial force, XL and XR refer to the left and right regular forces of the strip respectively, and f ( x ) is the interstrip force function; λ is the weight of interbar force function, c is the effective cohesive force, ϕ is the effective friction angle, u w is the pore water pressure; u a is pore gas pressure, θ w is volumetric water content, θ s is the saturated volumetric water content, θ r is the residual volumetric water content, Sm is the sliding shear force acting on the bottom of each block, N is the normal force at the bottom of inter-strip soil, σ n is the everyday stress on the shear surface, W is the dead weight of soil strip, D is the load at the concentration point, and F is equal to the stability coefficient Fm of the moment equilibrium or Ff of force equilibrium, β is the length of the bottom surface of the strip, R is the radius of the arc sliding surface, x is the horizontal distance from the center line of each block to the center of rotation or torque, F is the distance from the normal force to the center of rotation, D is the vertical distance between the point load and the center of rotation or torque, α is the angle between the center tangent of the bottom surface of the strip and the horizontal surface, and ω is the angle between point load and horizontal surface.

4. Results

4.1. Soil–Water Characteristics

4.1.1. TRIM Experiment

The TRIM equipment includes a pressure chamber for loading soil and controlling suction, a control panel with air pressure control and a water tank, a collecting bottle and electronic balance for measuring water flow, and computer software for graphic display and data recording. The main technical parameters are shown in Table 1 and Figure 7.
The soil samples of the sliding body and sliding zone were taken from the site of the Siwan village landslide to carry out a laboratory test on the soil–water characteristics. Soil samples were taken from the slip body and slip zone at profile 2-2 of ZK10. Firstly, the soil is dried for 24 h to ensure complete evaporation of water from it. The physical properties of the soil samples in their natural state are shown in Table 2. According to water content = (wet weight − soil particle weight)/soil particle weight × 100%, the dried soil was taken to restore the natural state by adding water according to the calculated amount; the water content was 23.92% after adding water.
The saturated soil samples were put into a pressure chamber (Figure 8) for exhaustion, and dehumidification and hygroscopy were carried out after the exhaustion. Table 3 shows the process of dehumidification and hygroscopy.

4.1.2. Analysis of SWCC and HCF

After the physical experiment on the soil samples at the Siwan village landslide site, the time series data of water outflow or inflow was obtained in the experiment. It can be used as the objective function of numerical simulation of inversion to obtain the unsaturated soil characteristics. For this purpose, SWR, LLC post-processing software Hydrus—TRIM was used. In the dehumidification state, the inversion of numerical simulation thus obtained data used to draw the soil–water characteristic curve (SWCC) and hydraulic conductivity function (HCF). As shown in Figure 8 below, α is the suction value related to the intake value, a = 1/α; n is a parameter related to aperture distribution, m = 1−1/n; θr is the residual water content, θs is the saturated water content, Ksat is the saturation hydraulic conductivity, and Mv is the volume compressibility coefficient, which is 1e−51 kpa.
Herbal plants have a reinforcement effect on slopes [40,41]. We conducted a study on the soil–water characteristics of soils with this property. Through the statistical analysis of the test results (Figure 9), the following results were obtained:
(1)
The matrix suction changes nonlinearly and reversely with the change of volumetric water content, and the change amplitude decreases with the increase of volumetric water content. The higher the water content is, the lesser the matrix suction, which leads to the decline of shear performance. In the case of the same volume of water content (for example, the water content of the natural state section marked 0.24 in the figure), the matric suction of the sliding zone is large, so the shear resistance of the sliding zone is vital. This is why the sliding body slides first with rainfall infiltration;
(2)
The hydraulic conductivity has a nonlinear positive change with the change of the volumetric water content, and it decreases with the increase of the volumetric water content. The change of the middle section (natural water content) is rapid. The hydraulic conductivity of both the sliding zone and the sliding body is the maximum in the dehumidification process, but the sliding body has a significant hydraulic conductivity. The extreme value is 0.43 m/d, while the extreme value of the sliding zone is 0.03 m/d. Therefore, the slip body has good permeability, which is caused by the rapid infiltration and seepage of rainwater;
(3)
The residual volumetric water content of dehumidification and hygroscopic sliding soil is 0.15, while the extreme value of saturated volumetric water content is 0.42. The residual volumetric water content of dehumidification and hygroscopic sliding soil is 0.098, while the extreme value of saturated volumetric water content is 0.39. The results indicate that the sliding body is saturated before the sliding zone, the shear resistance decreases first, and a landslide quickly occurs.

4.2. Landslide Stability Evolution

In this section, the parameters of the Van Genuchten—Mualem (VGM) model obtained from the soil–water characteristics test were input into the hydraulic function parameter module of GEO to calculate the SEEP seepage flow. Then, the Geo-Studio (SLOPE module) was adopted for stability analysis. At the same time, the engineering analogies of Fredlund and Xing (FX) model parameters were also used to calculate the stability.

4.2.1. Parameters and Numerical Model

The selection of the hydraulic function parameters (hydraulic boundary) shows that Siwan Village is a typical landslide induced by rainfall. The hydraulic boundary condition of rainfall is based on the daily precipitation data from 18 July to 14 August 2019; it is obtained from the China Meteorological Data Network (Figure 3).
Hydraulic function parameters (hydraulic conductivity and volumetric water content) are selected. The Van Genuchten—Mualem (VGM) model parameters were determined by testing the soil water characteristics of Siwan Village under the TRIM coefficient, as shown in Table 4. By engineering analogy [42,43,44,45], the parameters of the Fredlund and Xing (FX) model of the Siwan village landslide were determined as shown in Table 4. The model parameters obtained by these two methods were input and used, respectively, for numerical seepage flow calculation of the SEEP module and the stability evolution model are shown in Figure 10.
A typical 2-2 profile is taken as an example for verification. The 2-2 profile in CAD was imported into Geo-Studio to establish the finite element calculation model, and the slip surface was specified to overlap the slip zone (Figure 10). The physical and mechanical parameters of landslide rock and soil mass in Siwan Village are taken from the investigation report (Table 5). According to this section, a grid numerical model was constructed (Figure 10). X direction coordinates were set at 0–500 m, and Y direction coordinates were set at 685–985 m. After grid division, the model had 902 nodes and 846 cells.

4.2.2. Evolution Laws of Landslide Stability

Based on the abovementioned parameters, the VGM and FX model parameters in the SEEP module were used to calculate the seepage flow, respectively. The calculated results of rainwater infiltration are shown in Figure 11. It is indicated that the landslide evolution stability process simulated by the two methods is consistent with the actual landslide instability process (Figure 12).
The first slide: From 18 July to 31 July, rainwater infiltration and pore water pressure in the landslide area of Siwan village increased with accumulated rainfall. On 30 July, the rainfall reached 25.6 mm, which was the maximum rainfall of the month. However, there was no rainfall on days 27, 28, and 29, and the pore water seeped into the front edge of the landslide. The heavy rainfall at day 30 saturated the front soil, the front weight increased, the stability coefficient suddenly decreased, and the landslide slid.
The second slide: From 1 August to 4 August, rainwater infiltration and pore water pressure in the landslide area of Siwan village reached saturation with accumulated rainfall. During the continuous rainfall from 5 August to 9 August, the maximum value was 33.9 mm. The soil was saturated, and the continuous rainfall increased the rain buoyancy and the landslide stability coefficient.
From 10 August to 14 August, rainwater seepage led to the rapid reduction of pore pressure in the rear wall of the second landslide. The weight of the soil in front of the landslide was significant, and the rear wall was pulled apart. This resulted in tension cracks, which belonged to the loose (retrogressive) sliding.
With regards to soil landslides and under the condition of a single rainfall-induced model, further comprehensive analysis results (Figure 3 and Figure 12) show the following:
(1)
At the early stage of rainfall, the unsaturated degree of soil on the shallow surface of the landslide was high, and the infiltration capacity and water retention capacity of the soil are strong. The rainfall intensity was less than the infiltration capacity of the landslide soil, and all the rainwater was infiltrated. As the rainfall continued, the water content of the soil gradually increased, and the infiltration capacity and water retention capacity of the soil gradually decreased. This reduced the water content and pore water pressure. Therefore, the stability coefficient of the soil body decreased to a small extent;
(2)
At the mid-period of the rainfall, the stability coefficient rose temporarily due to the release of sliding stress in the early stage, but with the continuous rainfall, the front, middle, and trailing edge of the soil were saturated; the pore pressure increased, and the soil bubble in the water led to a downward trend of stability coefficient again. When the rain stopped, the soil water in the front edge penetrated the river channel, the pore water in the trailing edge penetrated the soil, and the pore pressure and shear strength of the trailing edge decreased, resulting in shear creep. When rainfall causes soil supersaturation, slope erosion increases, and soil is most prone to landslides;
(3)
In the late rainfall period, the soil’s pore water was distributed at the front edge, the trailing edge was in a less stable state, and the shear strength and sliding resistance were reduced. When there was heavy rainfall in the later period, the weight of the soil front increased, and the sliding force increased under the limit equilibrium; however, the anti-sliding force decreased, the soil could not be balanced, and there was a mutation of shear displacement.

5. Discussion

From the above results, it can be seen generally consistent for the landslide stability evolution of soil–water characteristics test (VGM model) and engineering analogy method (FX model) after the calculation of the seepage flow. Under the condition of rainfall, the stability coefficient of 2-2 section slump accumulated body is 1.008, and the whole accumulated body is in an understandable state. This is consistent with the situation in which the landslide has two large-scale slippages, and the overall status of the accumulated body tends to stop at present. However, the stability of the FX model calculated by engineering analogy is sensitive to rainfall. Soil–water characteristics test (VGM model) can better reflect the fundamental hydraulic changes in the field. Compared with the actual site, the FX model’s hysteretic effect is small, and the instability time is 1–2 days earlier than the actual site. The soil–water characteristic test (VGM model) is reasonable both in whole and part.
From the analysis of stability coefficients, daily rainfall, accumulated rainfall, and the occurrence time of the landslide, the landslide did not happen immediately after the rainfall. The first landslide occurred one day after the rainfall, and the second landslide occurred five days after the rainfall.
Previous studies have found that each landslide has different characteristic parameters. Therefore, this study found that in order to perform accurate and large-scale numerical simulations, it is necessary to determine the characteristic parameters and mechanical parameters based on experiments, rather than relying on engineering category acquisition methods. Using remote sensing images, field surveys, GIS, and drone images are the most intuitive methods for determining landslide forms, and cross-technology applications are necessary means to improve early warning. We compared our current research findings with those of previous studies and concluded that utilizing characteristic parameters obtained from soil–water characteristic tests for numerical simulations is a more precise method for early warning compared to relying on parameters obtained through direct engineering analogies. When we apply numerical models to a larger range, we face many technical challenges, but there are already many methods proposed to overcome these challenges. Some common methods include scaling models, statistical modeling, GIS-based modeling, and integrated modeling. This research belongs to a comprehensive model, which can generate more accurate and comprehensive prediction results and be used to guide decision-making in practice. We can evaluate it based on actual situations and apply it to specific landslides.
It is worth noting that the lag effect is a common issue with rainfall-induced landslides. To enhance early warning effectiveness, future research should consider the lag effect as a type of load and incorporate it into the boundary conditions by converting it into influence coefficients, for instance. In future research, we can also consider the effect of vegetation reinforcement and rainfall equivalence using a qualitative equivalence approach.

6. Conclusions

In this study, we combined the parameters of the Van Genuchten–Mualem (VGM) model obtained from soil–water characteristic tests with a numerical simulation method to analyze the stability of a landslide evolution. Our findings suggest the following conclusions:
  • Siwan village landslide is in an understandable state under natural conditions, with its deformation primarily concentrated in the front part of the sliding body, and closely tied to the intensity of rainfall. The deformation of the first initial tension-cracks landslide exacerbates the subsequent loose landslide;
  • During heavy rainfall, the stability of a landslide can suddenly decreases as the soil in the sliding zone becomes soaked and softened continuously. The infiltration of heavy rainfall through the cracks can also further damage the stability of the landslide. Therefore, it is essential to conduct a thorough investigation of the surface tension cracks of the landslide and implement appropriate sealing measures;
  • There is an inherent hysteretic relationship between rainfall and stability coefficients, as demonstrated by experiments which show that the reduction in landslide stability coefficients is most significant after rainfall. Studying the hysteretic phenomenon of landslides is thus crucial and plays a vital role in the early warning systems for landslides;
  • Numerical simulation based on the soil–water characteristics test results shows better agreement with the stability of the actual rainfall-induced landslide evolution than empirical soil–water characteristics obtained by the FX model. This highlights the importance of accurately reflecting the hysteretic effect on stability, which cannot be achieved through empirical soil–water characteristics alone.
The research results demonstrate a novel approach for the rapid analysis of the characteristics and causes, which can be referenced for the early identification, warning, and stability evaluation of landslides. It can help to minimize the damage caused by landslides and protect lives and property.

Author Contributions

Conceptualization, X.X.; data curation, X.W.; formal analysis, J.X.; investigation, X.W. and X.X.; methodology, X.X.; project administration, H.W.; resources, X.X.; supervision, H.W.; validation, J.X. and X.Z.; visualization, J.X. and X.Z.; writing—original draft, H.W.; writing—review and editing, H.W. All authors have read and agreed to the published version of the manuscript.

Funding

This research was funded by the Natural Science Foundation of Chongqing (Grant number: CSTB2022NSCQ-MSX0594).

Institutional Review Board Statement

Not applicable.

Informed Consent Statement

Not applicable.

Data Availability Statement

Data are contained within the article. The corresponding author can provide the necessary model upon request.

Acknowledgments

Special thanks to the Chongqing Institute of Geology and Mineral Resources for invaluable help.

Conflicts of Interest

The authors declare no conflict of interest.

References

  1. Sun, D.; Xu, J.; Wen, H.; Wang, Y. An Optimized Random Forest Model and its Generalization Ability in Landslide Susceptibility Mapping: Application in Two Areas of Three Gorges Reservoir, China. J. Earth Sci. 2020, 31, 1068–1086. [Google Scholar] [CrossRef]
  2. Zou, Z.; Tang, H.; Criss, R.E.; Hu, X.; Xiong, C.; Wu, Q.; Yuan, Y. A model for interpreting the deformation mechanism of reservoir landslides in the Three Gorges Reservoir area, China. Nat. Hazards Earth Syst. Sci. 2021, 21, 517–532. [Google Scholar] [CrossRef]
  3. Buma, B.; Pawlik, Ł. Post-landslide soil and vegetation recovery in a dry, montane system is slow and patchy. Ecosphere 2021, 12, e03346. [Google Scholar] [CrossRef]
  4. Wen, H.; Li, W.; Xu, C.; Daimaru, H. Landslides in Forests around the World: Causes and Mitigation. Forests 2023, 14, 629. [Google Scholar] [CrossRef]
  5. Jabro, J.D.; Stevens, W.B. Pore Size Distribution Derived from Soil–Water Retention Characteristic Curve as Affected by Tillage Intensity. Water 2022, 14, 3517. [Google Scholar] [CrossRef]
  6. Chen, L.; Zhang, K.; Zhang, Z.; Cao, Z.; Ke, Q. Response of soil water movement to rainfall under different land uses in karst regions. Environ. Earth Sci. 2023, 82, 50. [Google Scholar] [CrossRef]
  7. Wu, H.; Chen, S.; Pang, Y. Parametric Study of Effects of Rain Infiltration on Unsaturated Slopes. Rock Soil Mech. 1999, 1, 2–15. [Google Scholar]
  8. Wang, L.; Liu, F.; Zhang, Z. Research on Characteristics of Unsaturated Soil Water Characteristic Curve. Adhesion 2021, 46, 147–150. [Google Scholar]
  9. Bencheikh, K.; Messast, S. The Influence of Particle Separation Distance on the Behavior of Unsaturated Soils. Geotech. Geol. Eng. 2023, 41, 1353–1370. [Google Scholar] [CrossRef]
  10. Cui, K.; Lin, W. Research on Soil-water Characteristic Curve of Unsaturated Mixed-soil in Western Sichuan. China J. Highw. Transp. 2017, 30, 44–50. [Google Scholar]
  11. Yuan, K.F. Research on Soil-water Characteristic Curve of Unsaturated Soil in Jinnan. Shanxi Sci. Technol. Commun. 2021, 3, 13–15. [Google Scholar]
  12. Cai, G.; Liu, Q.; Yang, Y. Experimental study on seepage characteristics of dry and wet sandy loess under hydro-mechanical coupling. China Civ. Eng. J. 2022, 55, 74–82. [Google Scholar]
  13. Lu, H.D.; Chen, J.X.; Han, W.X.; Wu, Y.; Li, D.D. Centrifuge Model Tests and Numerical Simulations of the Landslide Evolution Process. KSCE J Civ Eng 2022, 26, 2588–2599. [Google Scholar] [CrossRef]
  14. Gatto, M.P.A.; Montrasio, L. X-SLIP: A SLIP-based multi-approach algorithm to predict the spatial–temporal triggering of rainfall-induced shallow landslides over large areas. Comput. Geotech. 2023, 154, 105175. [Google Scholar] [CrossRef]
  15. Salvatici, T.; Tofani, V.; Rossi, G.; D’Ambrosio, M.; Tacconi Stefanelli, C.; Masi, E.B.; Rosi, A.; Pazzi, V.; Vannocci, P.; Petrolo, M.; et al. Application of a Physically Based Model to Forecast Shallow Landslides at a Regional Scale. Nat. Hazards Earth Syst. Sci. 2018, 18, 1919–1935. [Google Scholar] [CrossRef] [Green Version]
  16. Zhang, X.; Chen, J.; Huang, R.Q. A study of deformation features of gapa landslide using FLAC-3D. Rock Soil Mech. 2005, 1, 131–134. [Google Scholar]
  17. Dai, C.; Feng, J.; Bu, C. Study on the influence of earthquake on slope stability based on Geo-Studio and stereographic projection method-A Case study of Mozhugongka Landslide. Henan Sci. Technol. 2022, 41, 127–130. [Google Scholar]
  18. Li, B.; Tang, H.; Gong, W. Numerical study of the runout behavior of the Kamenziwan landslide in the Three Gorges Reservoir region, China. Landslide 2022, 19, 963–976. [Google Scholar] [CrossRef]
  19. Hu, Q.; Wu, Y.; Miao, F. Stability analysis of concave slope based on Mein-Larson Infiltration Model. Chin. J. Geol. Hazards Prev. 2021, 32, 26–35. [Google Scholar]
  20. Che, T.; Gong, H.; Jian, B. Numerical Simulation analysis of bridge foundation bedding slope stability based on UDEC. Sichuan Archit. 2022, 42, 142–145. [Google Scholar]
  21. Mohanty, M.; Sarkar, R.; Das, S.K. Probabilistic assessment of effects of heterogeneity on the stability of coal mine overburden dump slopes through discrete element framework. Bull. Eng. Geol. Environ. 2022, 81, 228. [Google Scholar] [CrossRef]
  22. Zhou, L. Numerical simulation analysis of post-construction stability of high vertical slope based on FLAC3D. Inn. Mong. Coal Econ. 2021, 18, 1–4. [Google Scholar] [CrossRef]
  23. Wang, X.; Wu, Y.; Huang, Y. Slope stability analysis based on ABAQUS. Constr. Saf. 2022, 37, 50–53. [Google Scholar]
  24. Cheng, Y. Numerical simulation and monitoring analysis of bedding landslide. Chin. J. Rock Mech. Eng. 2008, 2, 3746–3752. [Google Scholar]
  25. Barkhordari, S.; Hashemy Shahdany, S.M. A systematic approach for estimating water losses in irrigation canals. Water Sci. Eng. 2022, 15, 161–169. [Google Scholar] [CrossRef]
  26. Zhou, Z.; Chen, H. Analysis stability of slope based on Geo-Studio. Henan Sci. Technol. 2022, 41, 63–66. [Google Scholar]
  27. Liu, H.C.; Huang, H.; Shuai, B.W.; Feng, Y. Study on Stability of East Slope of Shengli East No. 2 Mine Based on Geo-Studio Numerical Software. Front. Earth Sci. 2020, 10, 622–628. [Google Scholar] [CrossRef]
  28. Xiang, X.; Wen, H.; Xie, P. Study on the Multi-Field Characteristic Coupling of Single Landslide Caused by Heavy Rainfall. In Proceedings of 2015 National Engineering Geology Annual Conference, Changchun, China, 8–16 August 2015; Science Press: Beijing, China, 2015; pp. 428–436. [Google Scholar]
  29. Bračko, T.; Žlender, B.; Jelušič, P. Implementation of Climate Change Effects on Slope Stability Analysis. Appl. Sci. 2022, 12, 8171. [Google Scholar] [CrossRef]
  30. Sun, D.; Gu, Q.; Wen, H.; Shi, S.; Mi, C.; Zhang, F. A hybrid landslide warning model coupling susceptibility zoning and precipitation. Forests 2022, 13, 827. [Google Scholar] [CrossRef]
  31. Mualem, Y. A new model for predicting the hydraulic conductivity of unsaturated porous media. Water Resour. Res. 1976, 12, 513–522. [Google Scholar] [CrossRef] [Green Version]
  32. Van Genuchten, M.T. A Closed-form Equation for Predicting the Hydraulic Conductivity of Unsaturated Soils. Soil Sci. Soc. Am. J. 1980, 44, 892–898. [Google Scholar] [CrossRef] [Green Version]
  33. Fredlund, D.G.; Xing, A.; Huang, S. Predicting the permeability function for unsaturated soils using the soil-water characteristic curve. Can. Geotech. J. 1994, 31, 533–546. [Google Scholar] [CrossRef] [Green Version]
  34. Oh, S.; Kim, Y.; Kim, J.W. A Modified van Genuchten-Mualem Model of Hydraulic Conductivity in Korean Residual Soils. MDPI AG 2015, 10, 5487–5502. [Google Scholar] [CrossRef]
  35. Vanapalli, S.K.; Fredlund, D.G.; Pufahl, D.E. A model for the prediction of shear strength with respect to soil suction. Can. Sci. Publ. 1996, 33, 379–392. [Google Scholar] [CrossRef]
  36. Fredlund, D.G.; Morgenstern, N.R.; Widger, R. Shear Strength of Unsaturated Soils. Can. Geotech. J. 1978, 15, 313321. [Google Scholar] [CrossRef]
  37. Belew, A.Z.; Belay, S.K.; Wosenie, M.D.; Alebachew, D.H. A Comparative Evaluation of Seepage and Stability of Embankment Dams Using GeoStudio and Plaxis Models: The Case of Gomit Dam in Amhara Region, Ethiopia. Water Conserv. Sci. Eng. 2022, 7, 429–441. [Google Scholar] [CrossRef]
  38. Hassan, W.; Alshameri, B.; Nawaz, M.N.; Al-Tameemi, A.H.; Hussain, M. Experimental Study on Shear Strength Behavior and Numerical Study on Geo-Synthetic-Reinforced Cohesive Soil Slope. Innov. Infrastruct. Solut. 2022, 7, 349. [Google Scholar] [CrossRef]
  39. Soranzo, E.; Guardiani, C.; Saif, A.; Wu, W. A Reinforcement Learning Approach to the Location of the Non-Circular Critical Slip Surface of Slopes. Comput. Geosci. 2022, 166, 105182. [Google Scholar] [CrossRef]
  40. Tai, P.; Wu, F.; Chen, R.; Zhu, J.; Wang, X.; Zhang, M. Effect of herbaceous plants on the response of loose silty sand slope under rainfall. Bull. Eng. Geol. Environ. 2023, 82, 42. [Google Scholar] [CrossRef]
  41. Montrasio, L.; Gatto, M.P.A.; Miodini, C. The role of plants in the prevention of soil-slip: The G-SLIP model and its application on territorial scale through G-XSLIP platform. Landslides 2023, 9, 02031. [Google Scholar] [CrossRef]
  42. Li, Y.; Yang, Y.; Ye, Z. Treatment and stability analysis of collapse slope based on MIDAS-GTS /NX. Ind. Saf. Environ. Prot. 2022, 48, 15–19. [Google Scholar]
  43. Li, C.; Fu, Z.; Wang, Y. Susceptibility of reservoir-induced landslides and strategies for increasing the slope stability in the three gorges reservoir area: Zigui Basin as an example. Eng. Geol. 2019, 261, 105279. [Google Scholar] [CrossRef]
  44. Li, L. Simulation and stability analysis of Rainfall Infiltration in Soil landslide based on Geo-studio. Huabei Nat. Resour. 2021, 2, 100–101. [Google Scholar]
  45. Tozato, K.; Dolojan, N.L.J.; Touge, Y.; Kure, S.; Moriguchi, S.; Kawagoe, S.; Kazama, S.; Terada, K. Limit Equilibrium Method-Based 3D Slope Stability Analysis for Wide Area Considering Influence of Rainfall. Eng. Geol. 2022, 308, 106808. [Google Scholar] [CrossRef]
Figure 1. Location of Siwan village’s landslide events.
Forests 14 00808 g001
Figure 2. Remote sensing image of the landslide and surrounding damage (a UAV image is shown at the top-left).
Forests 14 00808 g002
Figure 3. Relationship between rainfall and accumulated rainfall and landslide occurrence.
Forests 14 00808 g003
Figure 4. Topography plan and local features of the landslide event.
Forests 14 00808 g004
Figure 5. The 2-2 profile and trailing edge tension crack of the landslide event.
Forests 14 00808 g005
Figure 6. The flowchart of the entire article.
Forests 14 00808 g006
Figure 7. TRIM System (a) Equipment, (b)control panels, and (c) pressure chambers.
Forests 14 00808 g007
Figure 8. Saturated soil sample.
Forests 14 00808 g008
Figure 9. Soil–water characteristic curve and hydraulic conductivity function: (a) sliding body, (b) sliding zone.
Forests 14 00808 g009
Figure 10. Grid model of two landslide events of the 2-2 profile.
Forests 14 00808 g010
Figure 11. Nephogram showing the evolution of pore water pressure accompanied by rainfall. (a) 2019-7-18 (b) 2019-7-24 (c) 2019-7-30 (d) 2019-8-5 (e) 2019-8-11 (f) 2019-8-14.
Forests 14 00808 g011
Figure 12. Landslide stability evolution curve of the 2-2 profile under rainfall conditions: (a) the first slide, (b) the second slide.
Forests 14 00808 g012
Table 1. Main technical parameters.
Clay plate130 mm diameterThe thickness of 7.14 mmAir intake value 500 kPa
BalanceMeasuring range ± 200 gPrecision is 0.01 g
The size of the cutting ringR = 5 cm and h = 2 cm
Table 2. Physical properties of the natural sliding zone and sliding body soil samples.
Natura Moisture Content
%
Natural Density kN/m3Saturated Density
kN/m3
Porosity
%
Liquid Limit
%
Plastic Limit
%
Sliding zone23.9219.319.642.8532.1518.93
Sliding body15.120.0020.5027.6625.518.2
Table 3. The operation flow of unsaturated soil transient in dehumidification and hygroscopic systems.
The system of saturatedThe clay plate, water storage area under the clay plate, gas collection cylinder, pipeline, and attached rubber hose should be saturated. Apply a certain amount of pressure and wait for the water to drain slowly into the collection bottle.
Water fillingOpen the two valves of the pressure chamber; the water level of the liquid collecting bottle is higher than that of the gas collecting bottle, adjust the flushing valve to fill with water, and close the vent and flushing valve after filling with water.
Sample saturatedPlace the specimen directly into the pressure chamber. Applying a vacuum at the top of the pressure chamber allows the water flow to enter the specimen through the clay plate.
Take off the wetThe pressure of 2 kPa (3 h) is first applied, and the water discharged at this stage is not counted. An additional pressure of 15 kPa (24 h) is applied, and the phase changes from saturated to unsaturated. Finally, 290 kPa pressure was applied to reach a stable state, and the Dehumidification process was completed.
HygroscopicAfter the line is saturated, the pressure is set to 0. Under a particular head of water, it flows into the pressure chamber through the clay plate and gradually wets the soil.
Table 4. Fredlund and Xing and Van Genuchten—Mualem model parameters of the Siwan Village landslide.
Parta
(kPa)
nmMv
(kPa)
Ksat (m/d)Sat.WC (%)
FX modelSliding body86.60.81 × 10−510.4338.6
Sliding zone8000.30.51 × 10−510.0341.6
VGM modelSliding body5.63.50.71 × 10−510.4339
Sliding zone12.51.950.51 × 10−510.0342
(a, n, m —FX and VGM model fitting parameters, Mv- Volume compressibility, Ksat—Saturated hydraulic conductivity, Sat.WC—saturated volumetric water content).
Table 5. Physical and mechanical parameters of rock and soil mass in the Siwan village landslide of Profile 2-2.
Landslide AreaBulk Density Gamma (kN/m3)Effective Cohesive Force of c’ (kPa)Internal Friction Angle φ (°)
Sliding body (gravel soil)20.018.4025.80
Sliding zone (silty clay)19.323.0113.60
Sliding bed (sandstone)27.12949.0041.84
Sliding bed (carbonaceous shale)26.31143.0037.17
Disclaimer/Publisher’s Note: The statements, opinions and data contained in all publications are solely those of the individual author(s) and contributor(s) and not of MDPI and/or the editor(s). MDPI and/or the editor(s) disclaim responsibility for any injury to people or property resulting from any ideas, methods, instructions or products referred to in the content.

