Article

Morphological, Physiological, and Biochemical Composition of Mulberry (Morus spp.) under Drought Stress

1
College of Forestry, Shenyang Agricultural University, Shenyang 110866, China
2
Research Station of Liaohe-River Plain Forest Ecosystem, Chinese Forest Ecosystem Research Network (CFERN), Shenyang Agricultural University, Tieling 112000, China
3
Institute of Modern Agricultural Research, Dalian University, Dalian 116622, China
4
Life Science and Technology College, Dalian University, Dalian 116622, China
*
Authors to whom correspondence should be addressed.
Forests 2023, 14(5), 949; https://doi.org/10.3390/f14050949
Submission received: 25 March 2023 / Revised: 1 May 2023 / Accepted: 2 May 2023 / Published: 4 May 2023
(This article belongs to the Special Issue Advances in Plant Photosynthesis under Climate Change)

Abstract

:
Drought is the most important environmental factor inhibiting plant photosynthesis. In this study, the morphological characteristics, biomass allocation, and physiological and biochemical characteristics of four potted mulberry plants under drought stress were analyzed. The study revealed the drought tolerance differences of four mulberry potted seedlings in semi-arid sandy areas of China. Combined with the results of two-way ANOVA, under normal growth conditions, Shensang No. 1 and Ji’an grew well and produced higher benefits, which was attributed to their larger leaf areas, biomass, and total Chl contents, and there were significant differences between their other traits (p < 0.05). Drought stress led to a decrease in the photosynthetic capacity of the mulberry leaves, and the drought resistance capabilities of the four mulberry trees were different. Among the trees, Aerxiang and Fujia were less affected by drought, and their cultivation in a naturally arid environment was able to achieve certain drought resistance effects. The branch length, total leaf area, and specific leaf area were significantly differently correlated with the biomass components’ dry leaf weight, dry branch weight, dry root weight, total biomass, and root-to-crown ratio (p < 0.05), and there was also a significant positive correlation with the photosynthetic fluorescence parameters GS, PIABS, ABS/RC, and TRo/RC and the biochemical parameters NSC (p < 0.05). Studies have shown that plant biomass and physiological and biochemical characteristics jointly affect plant growth. Our research results will help in the screening of mulberry trees, providing data support for the strategic planning of subsequent breeding, and maximizing the quality and resource benefits of mulberry trees.

1. Introduction

Plants cannot migrate from extreme environments as animals can; they tend to be hit harder by extreme climates [1]. Drought is one of the main limiting factors in the growth process of plants because cell expansion (the pressure exerted by a blocking liquid on the cell wall) requires water, which hinders photosynthesis, respiration, and stomatal movement, thus affecting plant growth and physiological metabolism [2,3]. In addition, drought stress also leads to a decrease in the activity of PSII and PSI in photosystems [4], resistance to photosynthetic electron transfer, and the accumulation of excess energy [5]. During stomatal regulation in plants, the photosynthetic products of leaves are the material basis of plant growth, and the net photosynthetic rate reflects the material productivity per unit of leaf area, which is a reliable indicator for measuring the production level of plants. With stomatal closure, CO2 uptake decreases, net photosynthetic rate decreases, plant productivity is consumed, fresh and dry weights are significantly reduced, and plants gradually die [6,7]. The above process depends on the severity and duration of drought and the developmental stage of the plant [8].
Therefore, plants have strategies to prevent water loss, balance the optimal water supply of all vital organs, maintain cellular water content, and survive dry periods. This ability to sense water scarcity signals and initiate coping strategies to respond to drought signals is defined as drought resistance [9]. The effect of stress on plant growth can be measured by a decrease in a plant’s growth rate or a decrease in its biomass accumulation [2]. When plants are short of water, phenotypic changes such as reduced plant height, leaf wilt, changes in leaf number and area, deformation of leaf chloroplast layer structure, and decreased chlorophyll content can be observed [10]. As the main organ of plant assimilation and transpiration, leaves are indicators that directly reflect the degree of water scarcity. A change in leaf area directly affects the photosynthesis and yield of a plant, which is one of the most easily observed characteristics of a plant under drought stress. Under stress induction, the growth of specific organs is usually achieved by sacrificing the growth of other parts of a plant. Therefore, in this case, the accumulation of whole plant biomass is a better reflection of the overall effects of stress [2].
One of the direct responses of plants under drought stress is osmoregulation through the accumulation of penetrants, which is an important way for plants to reduce osmotic potential and resist under-water stress [11]. Plants tend to do this at the cellular level by synthesizing and accumulating permeable molecules, such as soluble carbohydrates [12]. Among these, soluble sugars are involved in many metabolic processes in plant life and are an important source of energy and carbon for living organisms. Starch is the dominant form of unstructured carbon reservoirs and can be degraded into soluble sugars to maintain cell swelling and provide osmotic protection for cells to withstand environmental stresses [13]. Accelerated starch degradation may be associated with higher drought tolerance. The released sugars can act as osmomodulators to alleviate the adversity of abiotic stress [14]. The changes in plant osmoregulatory substances under drought stress are positively correlated with plant stress resistance, but they have certain limitations, and osmoregulation can only alleviate drought damage in plants to a certain extent. Long-drought resistance behavior requires both stomatal regulation and biochemical physiological regulation, and its efficiency, together with other factors, determines the drought tolerance of a plant.
As early as ancient China, many of the medicinal properties of Morus plants were described in the Compendium of Materia Medica [15]. Today, as an important biological resource, mulberry trees have formed a complete industrial chain in the fields of feed, food, medicine, and health care [16], which provides employment opportunities for millions of people in China. The genus Morus was found mainly in continental Asia, but also in Europe, North and South America, and Africa [17]. Its perennial cultivation over a wide geographical area is possible due to its high adaptability to various agroclimatic conditions [18], and it is a pioneer species that can be developed and grown on marginal lands [19]. To meet the growing economic and ecological needs of society, mulberry cultivation is expanding into areas with extreme climates. Located on the southern edge of China’s Horqin Sandy Land, Zhangwu County has concentrated precipitation from June to August, an arid climate, perennial windiness, water scarcity, and low vegetation coverage [20]. Here, seasonal or regional drought events can lead to decreases in mulberry yields and deteriorated plant quality [21,22]. Therefore, it is important to study the drought-resistant mechanisms of mulberry trees in semi-arid sandy areas.
In this study, the drought resistance of four mulberry trees, Aerxiang (ARX), Fujia (FJ), Ji’an (JA), and Shensang 1 (SS), was evaluated by the pot method. Net photosynthetic rate, transpiration, stomatal conductance, chlorophyll fluorescence parameters, soluble sugars and starches, morphological parameters, and biomass were comprehensively measured for each type of tree. The study of plant strategies to cope with drought stress can help us make better use of scientific means to improve the adaptability of plants to water-scarce environments, increase crop yields, and play a more important role. The systematic analysis and summary of the differences in coping with the arid climate of these mulberry trees further explore the drought-resistant characteristics of mulberry trees in semi-arid sandy areas, which is expected to provide data support and a theoretical basis for the cultivation, improvement, and scientific promotion of mulberry germplasm resources in sandy areas in the future.

2. Materials and Methods

2.1. Experimental Site

The study was conducted at the mulberry experiment site (122°49′ E, 42°35′ N) in Zhangwu County, Fuxin City, which has an altitude of approximately 87.7 m, annual average temperature of 7.2 °C, annual average sunshine hours of 2822.6 h, annual average relative humidity of 61%, annual total precipitation of 464.9 mm, annual average rainfall time of 44 days, annual average snowfall time of 8 days, and annual average wind speed of 11.6 km/h. The rainfall is concentrated in July and August. The area has a temperate monsoon climate, and southwesterly winds dominate throughout the year.

2.2. Experimental Design

Few mulberry cultivars are suitable for cultivation in northern China. In this study, based on the climatic conditions of the semi-arid aeolian sandy area in northwest Liaoning, the standard mulberry cultivar Shensang 1 (variety certified by Shenyang Agricultural University, abbreviated as SS) and 3 mulberry genotypes were selected, including Aerxiang (abbreviated ARX), Fujia (abbreviated FJ) and Ji’an (abbreviated JA). We pruned the above four mulberry seedlings in December 2021. In the spring of 2022, these experimental seedlings were bred from mulberry trees by grafting in Zhangwu County, Fuxin City. After the grafted body healed, in mid-May, they were uniformly planted in plastic pots with diameters of 26 cm and heights of 30 cm. The culture medium was aeolian sand soil from a forest farm in Zhangwu County. Continuous drought treatments were applied to the potted seedlings in July. A total of 32 pots of seedlings with relatively identical growth statuses were selected as the control (recorded as CK, with a maximum water-holding capacity of 28%) and severe drought stress samples (recorded as T, with a maximum water-holding capacity of 10%), with four pots per treatment. The water-holding capacity of the field was determined by the drying method to be 28%, which was used as the normal growth condition for the mulberry seedlings. The soil water content (SWC) was monitored daily with a soil moisture sensor, and the SWC was maintained at a set level by timely replenishment. After differences were observed in the plants for each treatment, leaves were selected from the same orientation and leaf position in the canopy of the plants on a sunny morning from 9:00 to 11:00 a.m. for the measurement of each index.

2.3. Evaluation of Growth

2.3.1. Morphological and Biomass Indicators

The four mulberry seedlings are shown in Figure 1. The basal diameters of the individual trees were measured using digital calipers (MCD-6CSX; Mitutoyo Co., Ltd., Kawasaki, Japan), and growth indicators such as plant height (PH) were measured with a measuring tape. After the end of the natural drought stress, the whole seedlings were harvested, and the branch lengths and total leaf areas were determined. The test seedlings were dried to a constant weight in an 85 °C oven, and the biomass of each part, the specific leaf area (SLA), and the root-to-crown ratio (RCR) were measured. The sum of the fresh leaf weight (FLW), fresh shoot weight (FSW), and fresh root weight (FRW) was determined to be the fresh biomass (FB, excluding the plant perennial stump bits), and the dry biomass (DB) was estimated in the same way.

2.3.2. Photosynthetic and Chlorophyll Fluorescence

The photosynthetic parameters of the third (fully expanded) leaves of the experimental seedling were measured from 9 to 11 a.m., with four experimental seedlings measurements repeated per genotype. The leaf levels gas exchange parameters such as net photosynthetic rate (Pn, μmol (CO2) m−2·s−1), stomatal conductance (Gs, mol m−2·s−1), transpiration rate (Tr, mmol (H2O) m−2·s−1) and intrinsic water-use efficiency (IWUE, μmol (CO2) mmol−1 (H2O)) were measured using a Portable Photosynthesis System LI−6400 (LiCor Inc., Lincoln, NE, USA).
After dark adaptation for 30 min, using the third fully expanded functional leaves of mulberry seedlings, the chlorophyll fluorescence parameters of the leaves were determined by an OS−5P+ portable pulse-modulated chlorophyll fluorescence instrument, including the PSII (the maximum photochemical efficiency (Fv/Fm)), the potential photochemical activity of the PSII (Fv/Fo), the relative variable fluorescence (Vj) at 2 ms on the OJIP curve, the initial slope (Mo) of the fluorescence rise, and the light energy absorbed per unit reaction center (ABS/RC). The energy captured by the unit reaction center for reducing the QA (TRo/RC), the energy captured by the unit reaction center for the electron transfer (ETo/RC), and the energy dissipated by the unit reaction center (DIo/RC) were automatically provided by the instrument.

2.3.3. Biochemical Indices

The dried leaf samples of the four mulberry seedlings were collected and ground into a fine powder for biochemical evaluation. Soluble sugars, starches, and NSC were determined in triplicate by an anthrone colorimetric method using the dried leaf samples [23]. The fresh leaves of the four mulberry geneotypes were collected, and the absorbance values of the 96% alcohol chlorophyll extracts at 665, 649, and 470 nm were determined spectrophotometrically according to the method of Lichtenthaler and Wellburn [24]. The three absorbance values (A665, A649, and A470) were substituted into the corresponding equations to calculate the content of chlorophyll a (Chl a), chlorophyll b (Chl b), and total chlorophyll (Chl [a + b]).

2.4. Statistical Analysis

There were four replicates analyzed in this study, and the data are expressed as the means ± standard deviations. Analysis of variance (ANOVA) was used to evaluate the statistical differences between the treatments and the varieties, and the least significant difference (LSD 0.05) test was used for the mean separation. Two-way ANOVA was used to compare the mean differences in the morphological, physiological, and biochemical parameters of the different varieties and water treatments. Principal component analysis (PCA) was performed using Origin 2021 to assess the differences between the mulberry trees. Based on the parameter test, SPSS 25 software (IBM Corp., Armonk, NY, USA) was used for the statistical analysis, and p < 0.05 was determined to be the significant difference level.

3. Results

3.1. Effects of Drought Stress on Photosynthetic Parameters

After the phenotypic differences were observed in the seedlings in the experimental group under drought stress, the photosynthetic parameters of the four mulberry trees were determined. As shown in Figure 2, drought stress significantly affected the photosynthetic parameters of the mulberry trees, and the photosynthetic parameters of the mulberry trees of the different genotypes changed. Under the field holding conditions, the Pn values of SS and JA were significantly higher than those of ARX and FJ. The Pn values of SS, ARX, FJ, and JA under drought decreased by 62.36%, 38.95%, 43.09%, and 45.27%, respectively, at which point, the Pn value of SS (5.47 μmol·m−2s1) was significantly the lowest and the Pn value of ARX (8.32 μmol·m−2s1) was significantly the highest. Under the field holding conditions, the Tr values of SS and JA were significantly higher than those of ARX and FJ. The Tr values of SS, ARX, FJ, and JA under drought decreased by 61.97%, 46.88%, 49.79%, and 50.40%, respectively. Among them, the Tr value of SS (1.79 mmol·m−2s1) was significantly the lowest while those of ARX (2.72 mmol·m−2s1) and JA (3.12 mmol·m−2s1) were significantly higher. Under the field holding conditions, the Gs values of SS and JA were significantly higher than those of ARX and FJ. The Gs values of SS, ARX, FJ, and JA under drought decreased by 88.55%, 65.42%, 74.81%, and 77.90%, respectively, and the Gs value of SS (0.06 mol·m−2s1) was significantly the lowest while those of ARX (0.1 mol·m−2s1) and JA (0.08 mol·m−2s1) were significantly higher. Under the field holding conditions, there were no significant differences in the IWUE values of the four mulberry trees. The IWUE values of SS, ARX, FJ, and JA under drought stress increased by 6.11%, 10.07%, 15.06%, and 8.80%, respectively, at which time, the IWUE value of SS (3.31 μmol·mmol−1) was significantly higher.

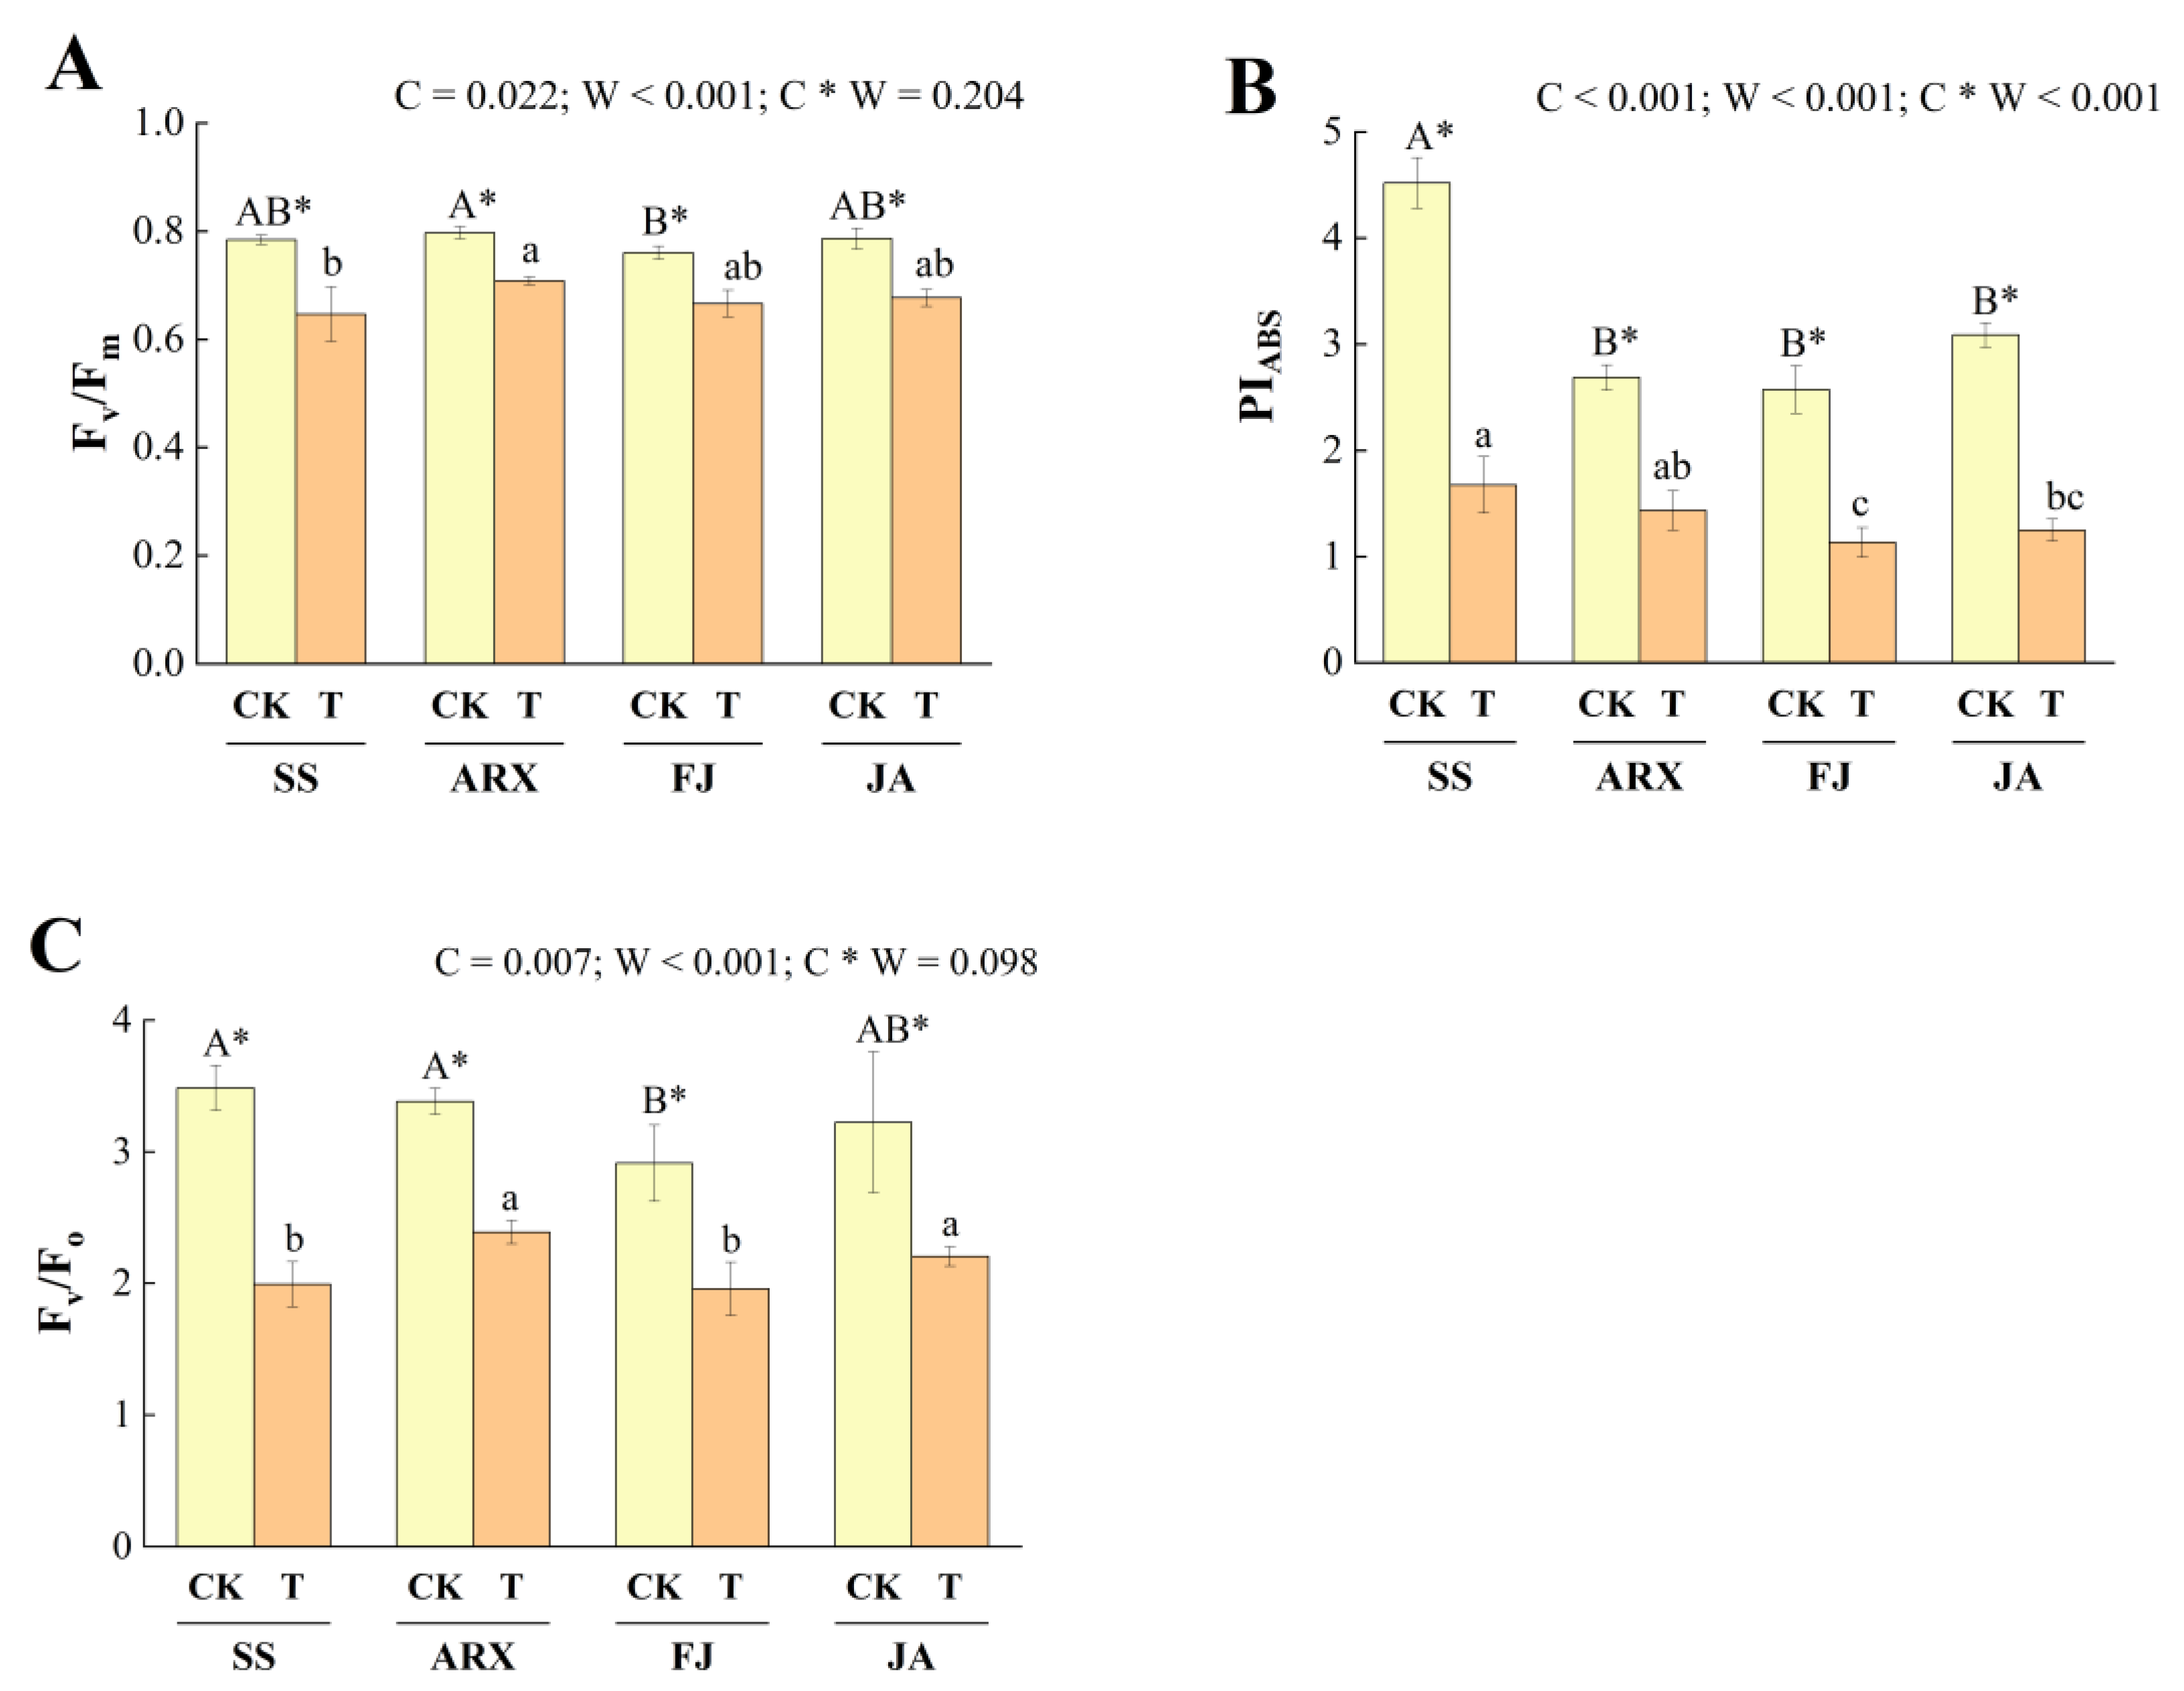
3.2. Effects of Drought Stress on Fluorescence Parameters

Drought stress significantly affected the plants’ fluorescence parameters (Figure 3). The Fv/Fm values of SS, ARX, FJ, and JA decreased by 17.55%, 11.19%, 12.37%, and 13.93%, respectively. Under normal and arid conditions, there were no significant differences between the four tree species. The PIABS values of SS, ARX, FJ, and JA decreased by 62.97%, 46.65%, 55.97%, and 59.57%, respectively. Under normal growth conditions, the PIABS values of SS were significantly higher than those of the others, and the PIABS values of FJ and JA were significantly lower than those of the others after drought stress. The Fv/Fo values of SS, ARX, FJ, and JA were decreased by 42.77%, 29.35%, 32.77%, and 31.59%, respectively. Under normal and arid conditions, there were no significant differences between the four mulberry genotypes.
The Vj values of SS, ARX, FJ, and JA increased by 14.17%, 9.09%, 12.53%, and 13.46%, respectively. Under normal and arid conditions, the Vj value of SS was minimal and that of FJ was maximal (Figure 4). The Mo values of SS, ARX, FJ, and JA increased by 25.04%, 11.92%, 16.45%, and 18.31%, respectively. Under normal and arid conditions, the Mo values of ARX were minimal and those of FJ were maximal.
The ABS/RC values of SS, ARX, FJ, and JA increased by 42.76%, 28.52%, 30.64%, and 42.76%, respectively. Under normal growth conditions, the ABS/RC values of ARX and JA were significantly lower than those of the others, and the ABS/RC value of SS was significantly higher than that of the others after drought stress. The TRo/RC values of SS, ARX, FJ, and JA increased by 32.46%, 18.8%, 26.31%, and 45.7%, respectively. Under normal growth conditions, the TRo/RC values of ARX were significantly lower than those of others, and the TRo/RC values of SS and JA were significantly higher than those of the others after drought stress. The ETo/RC values of SS, ARX, FJ, and JA increased by 25.39%, 21.08%, 23.79%, and 36.54%, respectively. Under normal growth conditions, the ETo/RC values of JA were significantly lower than those of others, and the ETo/RC values of SS were significantly higher than those of others after drought stress (Figure 5).

3.3. Effects of Drought Stress on Biochemical Composition

As shown in Table 1, the soluble sugar contents of SS, ARX, FJ, and JA under drought stress increased significantly by 5.00%, 13.52%, 9.00%, and 16.53%, respectively. The soluble sugar content of JA under normal growth conditions and drought stress was significantly higher than that of the other mulberry trees, and the soluble sugar content of ARX was significantly lower than that of the other mulberry trees. The starch contents of SS, FJ, and JA under drought decreased significantly by 43.28%, 15.13%, and 12.64%, respectively. The starch content of ARX increased significantly by 7.71%. Under normal growth conditions, the starch content of SS was significantly higher than that of the other mulberry trees, and the starch content of ARX after drought stress was significantly higher than that of the other mulberry trees. The NSC values of SS, FJ, and JA under drought decreased significantly by 22.04%, 2.31, and 1.23%, respectively, and the NSC values of ARX increased by 9.98%. Under normal conditions, the NSC values were significantly higher for SS. The total chlorophyll content (Chl[a + b]) of SS, ARX, FJ, and JA decreased significantly by 35.74%, 19.76%, 19.81%, and 27.58%, respectively. Under normal growth conditions, SS had the significantly the greatest total chlorophyll content. After drought stress, the total chlorophyll content of ARX was significantly the largest, and the total chlorophyll content of JA was significantly the lowest.

3.4. Effects of Drought Stress on Biomass

Drought stress significantly affected the biomass of the mulberry trees (Table 2). After stress, the biomass of each organ of the four mulberry trees decreased to varying degrees. Among them, the proportion of root biomass in the four mulberry genotypes showed an upward trend. Under the field water holding conditions, the BL (78 ± 1.15 cm), DBW (7.41 ± 0.53 g), DRW (51.83 ± 2.5 g), and TB (65.01 ± 3.31 g) of SS were significantly higher than those of the others. The TLA (1402.25 ± 53.91 cm2) and DLW (10.44 ± 0.21 g) of JA were significantly larger than those of the others. The RCR of ARX (4.14 ± 0.25) was significantly higher than that of the others. The SLA of FJ (146.19 ± 2.49) was significantly higher than that of the others. After drought stress, the TLA, DLW, DBW, DRW, and TB of JA and SS decreased the most. The RCR of SS decreased the most. The SLA of JA decreased the most.

3.5. Correlation Coefficients of Growth Morphology with Photosynthesis, Fluorescence, Biochemical Index, and Biomass

The correlation coefficients of the morphological traits and biomass components of the four mulberry trees during the whole drought process are shown in Table 3. Among them, the SLA was significantly positively correlated with the DBW and significantly positively correlated with the DRW and TB; the BL and DLW were significantly positively correlated with the DBW, DRW, and TB; the TLA was positively correlated with the DLW, DBW, DRW, and TB; and the TLA was negatively correlated with the RCR.
Table 4 shows the correlation coefficients of the morphological traits with the photosynthetic, fluorescence, and biochemical indexes of the four mulberry trees during the whole drought process. Among them, the BL was highly significantly positively correlated with the PIABS and ABS/RC values (p < 0.01), and it was significantly positively correlated with the TR/RC, CHl (a + b), and Gs values (p < 0.05). The TLA was significantly positively correlated with the NSC and CHL values (p < 0.05).

3.6. Principal Components Analysis

The principal component analysis (PCA) provided an additional method for quantifying the relationship between the genotypes using morphological and photosynthetic parameters [25]. In the PCA of the biomass allocation, the first two components (PC1 and PC2) explained 86.3% of the variation, with PC1 alone explaining 63.9% of the total variation (Figure 6A). According to the eigenvector values, PC1 was associated with the traits TB, DBW, DRW, BL, TLA, and DLW (Table 5). PC2 (22.4%) was associated with the traits RCR, DLW, and TLA (Table 5). Most morphological traits were clustered together except for the RCR, indicating that most of the characters contribute to growth (Figure 6A). In the PCA of the photosynthetic and fluorescence parameters, the first two components accounted for a total variation of 80.2% of which PC1 accounted for 66.0% and PC2 accounted for the rest (14.2%) (Figure 6B). PC1 was associated with the traits Pn, Fv/Fm, Fv/Fo, TRo/RC, Tr, Gs, and ABS/RC, whereas PC2 was associated with IWUE, Vj, and PIABS (Table 5).

4. Discussion

Drought stress can greatly impair the growth of woody plants and limit the geographical distribution of many tree species [26]. When plants are damaged by water stress, they respond to adverse environments by altering different morphological structures and physiological metabolisms, such as leaves, root morphology, photosynthesis, etc. [27,28]. The growth and biological yield of different species of mulberry trees vary greatly, providing the possibility of selecting cultivars or genotypes that have increased biological yields [29]. The results of this study showed that the photosynthetic responses (Pn and Gs) of SS and JA were superior to those of ARX and FJ under well-irrigated conditions, which was attributed to their greater leaf area, biomass, and total Chl contents, similar to the results of the study by Narayan et al. [30]. To maintain photosynthesis, plants develop a series of defense mechanisms to protect their photosynthetic organs from damage during adaptation to water stress [31,32]. In the results of this study, the photosynthetic and fluorescence parameters changed significantly after drought stress in the mulberry trees. As soil moisture decreases, the transpiration rate and net photosynthetic rate of mulberry leaves become synchronized because the stomata are the common transport channels for CO2 and water vapor, and both of these rates rely on solar radiation and light energy capture. This kind of defense mode simultaneously limits the absorption of CO2 and inhibits plant photosynthesis. In our results, the photosynthetic parameters of ARX decreased the least and those of SS decreased the most, indicating that ARX was the least affected by drought stress and SS was the most affected by drought stress. The decrease in Pn values under drought stress was mainly caused by non-stomatal factors. Most non-stomatal factors, including chlorophyll content, photosynthesis activity, and reactive oxygen species metabolism, are induced by moderate and severe drought stress [33,34]. BHusal et al. concluded that the total CHL concentrations in drought-stressed Sargent cherry trees were significantly reduced, resulting in higher limits in light capture and energy conservation, which resulted in a greater reduction in photosynthesis under drought [35].
IWUE values were significantly increased under drought stress in the four mulberry genotypes, and this response mechanism is an effective physiological response to drought stress, indicating that the plants can maintain adequate carbon dioxide absorption, reduce water consumption per unit biomass production, and minimize water loss [22]. Chloroplasts consume absorbed light energy through three pathways: photosynthetic electron transport, chlorophyll fluorescence, and heat dissipation, and the trade-off relationship between the pathways makes the fluorescence change reflect the photosynthesis of plants [36,37]. PSII, as a sensitive component of photosynthetic machinery, is usually subjected to stress conditions [38]. Fv/Fo and Fv/Fm represent the main photochemical conversion efficiency and maximum quantum efficiency, respectively, of photosystem II (PSII), and they are positively correlated with the primary photochemical activity of PSII [39]. In plants subjected to drought stress, Fv/Fo and Fv/Fm differ due to different levels of resistance. In this experiment, the Fv/Fo and Fv/Fm values of the mulberry leaves decreased to varying degrees after drought stress, and the decreases were roughly in the order of ARX < FJ < JA < SS. The results showed that the light energy absorbed by the PSII reaction center under drought stress may not have been fully utilized, and the photosynthetic electron transport and photosynthetic primary reaction processes of the plants were inhibited [40]. Some studies have shown that Fv/Fm is a useful measure for drought-sensitive species or when subjected to severe drought, but it is less useful for drought-tolerant or mildly drought-tolerant species [41]. It had also been reported that photosystem II is highly resistant to water stress [42], as opposed to relying only on Fv/Fm parameters to study resistance [43,44]. Most researchers have commonly used the multiparametric performance index (PIABS) to describe the change between Fo and Fm, which are sensitive to drought stress and more responsive than Fv/Fm [45], similar to the results of this study. Drought stress caused the fluorescence parameter Mo to increase, that is, the QA decreased rapidly, indicating that water stress reduced the activity of the reaction center. The increase in VJ values indicated that the decrease in the photochemical activity of PSII under drought stress was due to the obstruction of electron transport on the donor side and the receptor side of PSII [4]. After drought stress, the Vj and Mo values of the four mulberry trees were significantly higher than those of the control, and the Vj values of ARX, FJ, JA, and SS increased one by one. After stress, the Mo values of ARX and FJ increased by 11.92% and 16.45%, respectively, while the Mo values of JA and SS increased by 18.31% and 25.04%, respectively, indicating that the drought stress inhibited the photosynthetic electron transport in the SS and JA mulberry leaves more than it did in the ARX and FJ leaves.
Severe drought can destroy plant cell chloroplasts, reduce PSII activity, destroy electron transport chains, hinder electron transport and QA accumulation, prevent electron transport from QA to QB on the PSII receptor side, and reduce the electron transport ability of PSII, which was the cause of the decreases in the photosynthetic rates [46,47]. The light energy absorbed by the unit reaction center, the energy captured by the unit reaction center for reducing QA, and the energy captured by the unit reaction center for electron transfer were the specific activity parameters of the reaction center per unit of PSII of the leaves after drought stress, which were expressed using the ABS/RC, TRo/RC, ETo/RC, respectively, and the increase in specific activity parameters indicated that the reaction center was partially inactivated. When drought stress occurred, the specific activity parameters of ARX and FJ increased less than those of SS and JA, which showed that ARX and FJ could allocate more light energy for photosynthetic electron transfer than SS and JA after drought stress, maintaining normal photosynthesis and a normal energy supply in the process [48]. While SS and JA could not consume too much energy on the photosynthetic electron transport chain, more energy was wasted, causing the drought stress to harm their PSII, and so, to a greater extent, the plants were inhibited or destroyed by light.
The leaves are the organs that adapt the most to an environment over time [49]. The morphological characteristics of the leaves adjust the photosynthetic performance and water balance of plants [50], and they respond similarly to drought stress, with atrophy, curl, and decreased chlorophyll contents [51,52]. Tree growth is closely related to leaf morphological characteristics, and the allocation of biomass reflects the resource status of plant habitats, indicating that these characteristics help predict plant biomass [53]. Marron et al. concluded that total leaf area and specific leaf area (SLA) are better indicators of biomass production than leaf growth traits [54]. Stress leads to leaf growth retardation and a decrease in leaf number and area [23]. Water deficits in early nutrition inhibit cell expansion, resulting in reduced leaf area, internode elongation, and reduced plant height [55]. This study revealed the correlations between these morphological traits, and we found that BL, TLA, and SLA were highly correlated with the biomass components’ DLW, DBW, DRW, TB, and RCR (p < 0.01) (Table 2), and BL, TLA, and SLA were positively correlated with the photosynthetic fluorescence parameters GS, PIABS, ABS/RC, and TRo/RC and the biochemical parameters NSC and CHL (p < 0.05) (Table 3). The results have shown that plant biomass and physiological and biochemical characteristics jointly affect plant growth. Under normal growth conditions, the branch length, stem weight, root stem weight, and total biomass of SS performed well, and the leaf area and leaf stem weight of JA were outstanding. The inhibition of photosynthesis in plant leaves by drought was the main reason for the slowed growth [45]. After drought stress, the biomass decreases in ARX and FJ were less than those in SS and JA, and the root-to-head ratios of SS, FJ, and JA increased, indicating that the degree of damage to ARX and FJ by drought stress was less than that of SS and JA. Drought stress affected biomass distribution to the underground plant parts, reduced the allocation to the aboveground parts, and changed the biomass distribution patterns.

5. Conclusions

In extreme climates, the scientific selection of tree species is an important step in afforestation. We studied the morphological, biomass, physiological, and biochemical characteristics that determined the drought tolerance of four types of mulberry trees. Overall, the current findings supported the direction of extreme environmental science to promote the cultivation of mulberry varieties. The results showed that the photosynthetic responses of SS and JA were better than those of ARX and FJ under good irrigation, which was attributed to their greater leaf area, biomass, and total Chl contents. After drought stress, the tree species’ morphology, physiology, and biochemical indexes changed little, which was the basic condition for withstanding drought stress. The growth form of the tree species was significantly related to their physiology and biochemistry, and thus, growth form needs to be considered comprehensively when selecting and breeding. In the genotype development selection scheme of mulberry trees in the semi-arid sandy areas of northwest Liaoning, the excellent properties of ARX and FJ led to good natural growth prospects for them under drought conditions. Breeders should pay attention to the improvement in the above genotypes and traits to improve the drought tolerance of mulberry trees. This study revealed the coping strategies of mulberry trees under drought stress during growth in semi-arid and aeolian areas, and it provides a data basis for the subsequent screening and improvement of mulberry varieties in semi-arid sandy areas.

Author Contributions

W.Z., Y.Y. and Y.Z. designed the experiments and revised the manuscript. Z.S. completed the experiment and wrote the manuscript. W.Z. completed the revision of the manuscript. All authors have read and agreed to the published version of the manuscript.

Funding

This research was supported jointly by the Liaoning Province Scientific Research Funding Project, grant numbers LSNZD202002, the Science and Technology Program of Liaoning Province, grant number 2020020287-JH1/103-05-02.

Data Availability Statement

The data presented in this study are available on request from the corresponding author. The data are not publicly available due to the policy of the institute.

Conflicts of Interest

The authors declare no conflict of interest.

References

  1. Mukarram, M.; Choudhary, S.; Kurjak, D.; Petek, A.; Khan, M.M.A. Drought: Sensing, signaling, effects and tolerance in higher plants. Physiol. Plant. 2021, 172, 1291–1300. [Google Scholar] [CrossRef] [PubMed]
  2. Zhang, H.; Zhao, Y.; Zhu, J.K. Thriving under stress: How plants balance growth and the stress response. Dev. Cell. 2020, 55, 529–543. [Google Scholar] [CrossRef] [PubMed]
  3. Yang, X.; Lu, M.; Wang, Y.; Wang, Y.; Chen, S. Response mechanism of plants to drought stress. Horticulture 2021, 7, 50. [Google Scholar] [CrossRef]
  4. Liu, X.; Zhang, H.; Wang, J.; Wu, X.; Ma, S.; Xu, Z.; Zhou, T.; Xu, N.; Tang, X.; An, B. Increased CO2 concentrations increasing water use efficiency and improvement PSII function of mulberry seedling leaves under drought stress. J. Plant Interact. 2019, 14, 213–223. [Google Scholar] [CrossRef]
  5. Zhang, H.H.; Xu, N.; Sui, X.; Zhong, H.X.; Yin, Z.P.; Li, X.; Sun, G.Y. Photosynthesis response to drought stress in leaves of two alfalfa (Medicago sativa) varieties. Int. J. Agric. Biol. 2018, 20, 1012–1020. [Google Scholar]
  6. Liu, L.; Cao, X.; Zhai, Z.; Ma, S.; Tian, Y.; Cheng, J. Direct evidence of drought stress memory in mulberry from a physiological perspective: Antioxidative, osmotic and phytohormonal regulations. Plant Physiol. Biochem. 2022, 186, 76–87. [Google Scholar] [CrossRef]
  7. Reddy, K.S.; Sekhar, K.M.; Sreeharsha, R.V.; Reddy, A.R. Hydraulic dynamics and photosynthetic performance facilitate rapid screening of field grown mulberry (Morus spp.) genotypes for drought tolerance. Environ. Exp. Bot. 2019, 157, 320–330. [Google Scholar] [CrossRef]
  8. Tardieu, F.; Simonneau, T.; Muller, B. The physiological basis of drought tolerance in crop plants: A scenario-dependent probabilistic approach. Annu. Rev. Plant Biol. 2018, 69, 733–759. [Google Scholar] [CrossRef]
  9. Gupta, A.; Rico-Medina, A.; Caño-Delgado, A.I. The physiology of plant responses to drought. Science 2020, 368, 266–269. [Google Scholar] [CrossRef]
  10. Zhuang, J.; Wang, Y.; Chi, Y.; Zhou, L.; Chen, J.; Zhou, W.; Ding, J.; Song, J.; Zhao, N. Drought stress strengthens the link between chlorophyll fluorescence parameters and photosynthetic traits. PeerJ 2020, 8, e10046. [Google Scholar] [CrossRef]
  11. Mahmood, T.; Abdullah, M.; Ahmar, S.; Yasir, M.; Iqbal, M.S.; Yasir, M.; Mora-Poblete, F.; Ur Rehman, S.; Ahmed, S.; Rana, R.M.; et al. Incredible role of osmotic adjustment in grain yield sustainability under water scarcity conditions in wheat (Triticum aestivum L.). Plants 2020, 9, 1208. [Google Scholar] [CrossRef] [PubMed]
  12. Ozturk, M.; Turkyilmaz Unal, B.; García-Caparrós, P.; Khursheed, A.; Gul, A.; Hasanuzzaman, M. Osmoregulation and its actions during the drought stress in plants. Physiol. Plant. 2021, 172, 1321–1335. [Google Scholar] [CrossRef] [PubMed]
  13. Dong, S.Y.; Beckles, D.M. Dynamic changes in the starch-sugar interconversion within plant source and sink tissues promote a better abiotic stress response. J. Plant Physiol. 2019, 234, 80–93. [Google Scholar] [CrossRef]
  14. Martínez-Noël, G.M.; Tognetti, J.A. Sugar signaling under abiotic stress in plants. In Plant Metabolites and Regulation under Environmental Stress; Academic Press: New York, NY, USA, 2018; pp. 397–406. [Google Scholar] [CrossRef]
  15. Wen, P.; Hu, T.G.; Linhardt, R.J.; Liao, S.T.; Wu, H.; Zou, Y.X. Mulberry: A review of bioactive compounds and advanced processing technology. Trends Food Sci. Technol. 2019, 83, 138–158. [Google Scholar] [CrossRef]
  16. Dhiman, S.; Kumar, V.; Mehta, C.M.; Gat, Y.; Kaur, S. Bioactive compounds, health benefits and utilization of Morus spp.—A comprehensive review. J. Hortic. Sci. Biotechnol. 2020, 95, 8–18. [Google Scholar] [CrossRef]
  17. Awasthi, A.K.; Nagaraja, G.M.; Naik, G.V.; Kanginakudru, S.; Thangavelu, K.; Nagaraju, J. Genetic diversity and relationships in mulberry (genus Morus) as revealed by RAPD and ISSR marker assays. BMC Genet. 2004, 5, 1. [Google Scholar] [CrossRef]
  18. Sarkar, T.; Mogili, T.; Sivaprasad, V. Improvement of abiotic stress adaptive traits in mulberry (Morus spp.): An update on biotechnological interventions. 3 Biotech. 2017, 7, 214. [Google Scholar] [CrossRef]
  19. Lu, L.; Tang, Y.; Xie, J.-S.; Yuan, Y.L. The role of marginal agricultural land-based mulberry planting in biomass energy production. Renew. Energy 2009, 34, 1789–1794. [Google Scholar] [CrossRef]
  20. Deng, J.; Zhang, Y.; Yin, Y.; Zhu, X.; Zhu, W.; Zhou, Y. Comparison of soil bacterial community and functional characteristics following afforestation in the semi-arid areas. PeerJ 2019, 7, e7141. [Google Scholar] [CrossRef]
  21. Reddy, K.S.; Sekhar, K.M.; Reddy, A.R. Genotypic variation in tolerance to drought stress is highly coordinated with hydraulic conductivity-photosynthesis interplay and aquaporin expression in field-grown mulberry (Morus spp.). Tree Physiol. 2017, 37, 926–937. [Google Scholar] [CrossRef]
  22. Cao, X.; Shen, Q.; Liu, L.; Cheng, J. Relationships of growth, stable carbon isotope composition and anatomical properties of leaf and xylem in seven mulberry cultivars: A hint towards drought tolerance. Plant Biol. 2020, 22, 287–297. [Google Scholar] [CrossRef] [PubMed]
  23. Bhusal, N.; Lee, M.; Lee, H.; Adhikari, A.; Han, A.R.; Han, A.; Kim, H.S. Evaluation of morphological, physiological, and biochemical traits for assessing drought resistance in eleven tree species. Sci. Total Environ. 2021, 779, 146466. [Google Scholar] [CrossRef] [PubMed]
  24. Lichtenthaler, H.K.; Wellburn, A.R. Determinations of total carotenoids and chlorophylls a and b of leaf extracts in different solvent. Biochem. Soc. Trans. 1983, 11, 591–592. [Google Scholar] [CrossRef]
  25. Rukmangada, M.S.; Sumathy, R.; Kruthika, H.S.; Naik, V.G. Mulberry (Morus spp.) growth analysis by morpho-physiological and biochemical components for crop productivity enhancement. Sci. Hortic. 2020, 259, 108819. [Google Scholar] [CrossRef]
  26. Lei, P.; Liu, Z.; Li, J.; Jin, G.; Xu, L.; Ji, X.; Zhao, X.; Tao, L.; Meng, F. Integration of the Physiology, Transcriptome and Proteome Reveals the Molecular Mechanism of Drought Tolerance in Cupressusgigantea. Forests 2022, 13, 401. [Google Scholar] [CrossRef]
  27. Khaleghi, A.; Naderi, R.; Brunetti, C.; Maserti, B.E.; Salami, S.A.; Babalar, M. Morphological, physiochemical and antioxidant responses of Maclura pomifera to drought stress. Sci. Rep. 2019, 9, 19250. [Google Scholar] [CrossRef]
  28. Ren, B.; Zhang, J.; Dong, S.; Liu, P.; Zhao, B. Responses of carbon metabolism and antioxidant system of summer maize to waterlogging at different stages. J. Agron. Crop Sci. 2018, 204, 505–514. [Google Scholar] [CrossRef]
  29. Li, Y.; Li, H.; Li, Y.; Zhang, S. Improving water-use efficiency by decreasing stomatal conductance and transpiration rate to maintain higher ear photosynthetic rate in drought-resistant wheat. Crop. J. 2017, 5, 231–239. [Google Scholar] [CrossRef]
  30. Bhusal, N.; Han, S.G.; Yoon, T.M. Impact of drought stress on photosynthetic response, leaf water potential, and stem sap flow in two cultivars of bi-leader apple trees (Malus × domestica Borkh.). Sci. Hortic. 2019, 246, 535–543. [Google Scholar] [CrossRef]
  31. Yang, X.; Li, Y.; Chen, H.; Huang, J.; Zhang, Y.; Qi, M.; Liu, Y.; Li, T. Photosynthetic response mechanism of soil salinity-induced cross-tolerance to subsequent drought stress in tomato plants. Plants 2020, 9, 363. [Google Scholar] [CrossRef]
  32. Sharma, A.; Kumar, V.; Shahzad, B.; Ramakrishnan, M.; Sidhu, G.S.; Bali, A.S.; Handa, N.; Kapoor, D.; Yadav, P.; Khanna, K. Photosynthetic response of plants under different abiotic stresses: A review. J. Plant Growth Regul. 2020, 39, 509–531. [Google Scholar] [CrossRef]
  33. Li, P.D.; Zhu, Y.F.; Song, X.L.; Song, F.P. Negative effects of long-term moderate salinity and short-term drought stress on the photosynthetic performance of Hybrid Pennisetum. Plant Physiol. Biochem. 2020, 155, 93–104. [Google Scholar] [CrossRef] [PubMed]
  34. Tian, L.X.; Li, J.; Bi, W.S.; Zuo, S.Y.; Li, L.J.; Li, W.L.; Sun, L. Effects of waterlogging stress at different growth stages on the photosynthetic characteristics and grain yield of spring maize (Zea mays L.) under field conditions. Agric. Water Manag. 2019, 218, 250–258. [Google Scholar] [CrossRef]
  35. Bhusal, N.; Lee, M.; Han, A.R.; Han, A.; Kim, H.S. Responses to drought stress in Prunus sargentii and Larix kaempferi seedlings using morphological and physiological parameters. For. Ecol. Manag. 2020, 465, 118099. [Google Scholar] [CrossRef]
  36. Porcar-Castell, A.; Tyystjärvi, E.; Atherton, J.; Van der Tol, C.; Flexas, J.; Pfündel, E.E.; Berry, J.A.; Moreno, J.; Frankenberg, C. Linking chlorophyll a fluorescence to photosynthesis for remote sensing applications: Mechanisms and challenges. J. Exp. Bot. 2014, 65, 4065–4095. [Google Scholar] [CrossRef]
  37. Murchie, E.H.; Lawson, T. Chlorophyll fluorescence analysis: A guide to good practice and understanding some new applications. J. Exp. Bot. 2013, 64, 3983–3998. [Google Scholar] [CrossRef]
  38. Demmig-Adams, B.; Adams, W.W. An integrative approach to photoinhibition and photoprotection of photosynthesis. Environ. Exp. Bot. 2018, 154, 1–3. [Google Scholar] [CrossRef]
  39. Stirbet, A.; Lazar, D.; Kromdijk, J.; Govindjee. Chlorophyll a fluorescence induction: Can just a one-second measurement be used to quantify abiotic stress responses? Photosynthetica 2018, 56, 86–104. [Google Scholar] [CrossRef]
  40. Alemu, S.T. Photosynthesis limiting stresses under climate change scenarios and role of chlorophyll fluorescence: A review article. Cogent Food Agric. 2020, 6, 1785136. [Google Scholar] [CrossRef]
  41. Rosanna, D.; Martina, P.; Chiara, C.; Giacomo, G.; Riccardo, M.; Filippo, B. Chlorophyll a fluorescence analysis along a vertical gradient of the crown in a poplar (Oxford clone) subjected to ozone and water stress. Tree Physiol. 2012, 32, 8. [Google Scholar] [CrossRef]
  42. Force, L.; Critchley, C.; Rensen, J.J.S.V. New fluorescence parameters for monitoring photosynthesis in plants. Photosynth. Res. 2003, 78, 17–33. [Google Scholar] [CrossRef] [PubMed]
  43. Menezes-Silva, P.E.; Sanglard, L.M.V.P.; Ávila, R.T.; Morais, L.E.; Martins, S.C.V.; Nobres, P.; Patreze, C.M.; Ferreira, M.A.; Araújo, W.L.; Fernie, A.R.; et al. Photosynthetic and metabolic acclimation to repeated drought events play key roles in drought tolerance in coffee. J. Exp. Bot. 2017, 68, 4309–4322. [Google Scholar] [CrossRef]
  44. Živčák, M.; Brestič, M.; Olšovská, K.; Slamka, P. Performance index as a sensitive indicator of water stress in Triticum aestivum L. Plant Soil Environ. 2008, 54, 133–139. [Google Scholar] [CrossRef]
  45. Li, Y.; Fang, A.; Zhang, T.; Zhang, S.; Zhu, W.; Zhou, Y. Exogenous Calcium Improves Photosynthetic Capacity of Pinus sylvestris var. mongolica under Drought. Forests 2022, 13, 2155. [Google Scholar] [CrossRef]
  46. Strasser, B.J.; Strasser, R.J. Measuring Fast Fluorescence Transients to Address Environmental Questions: The JIP-Test. Photosynth. Light Biosph. 1995, 5, 977–980. [Google Scholar] [CrossRef]
  47. Thomas, F.M.; Yu, R.; Schaefer, P.; Zhang, X.; Lang, P. How diverse are Populus “diversifolia” leaves? Linking leaf morphology to ecophysiological and stand variables along water supply and salinity gradients. Flora 2017, 233, 68–78. [Google Scholar] [CrossRef]
  48. Paunov, M.; Koleva, L.; Vassilev, A.; Vangronsveld, J.; Goltsev, V. Effects of different metals on photosynthesis: Cadmium and zinc affect chlorophyll fluorescence in durum wheat. Int. J. Mol. Sci. 2018, 19, 787. [Google Scholar] [CrossRef]
  49. Wu, J.; Wang, J.; Hui, W.; Zhao, F.; Wang, P.; Su, C.; Gong, W. Physiology of plant responses to water stress and related genes: A Review. Forests 2022, 13, 324. [Google Scholar] [CrossRef]
  50. Pellis, A.; Laureysens, I.; Ceulemans, R. Growth and production of a short rotation coppice culture of poplar I. Clonal differences in leaf characteristics in relation to biomass production. Biomass Bioenergy 2004, 27, 9–19. [Google Scholar] [CrossRef]
  51. Patharkar, O.R.; Walker, J.C. Connections between abscission, dehiscence, pathogen defense, drought tolerance, and senescence. Plant Sci. 2019, 284, 25–29. [Google Scholar] [CrossRef]
  52. Bhusal, N.; Kim, H.S.; Han, S.G.; Yoon, T.M. Photosynthetic traits and plant-water relations of two apple cultivars grown as bi-leader trees under long-term waterlogging conditions. Environ. Exp. Bot. 2020, 176, 104111. [Google Scholar] [CrossRef]
  53. Marron, N.; Villar, M.; Dreyer, E.; Delay, D.; Boudouresque, E.; Petit, J.-M.; Delmotte, F.M.; Guehl, J.-M.; Brignolas, F. Diversity of leaf traits related to productivity in 31 Populus deltoides × Populus nigra clones. Tree Physiol. 2005, 25, 425–435. [Google Scholar] [CrossRef] [PubMed]
  54. Wei, W.L.; Li, D.H.; Wang, L.H.; Ding, X.; Zhang, Y.X.; Gao, Y.; Zhang, X.R. Morpho-anatomical and physiological responses to waterlogging of sesame (Sesamum indicum L.). Plant Sci. 2013, 208, 102–111. [Google Scholar] [CrossRef] [PubMed]
  55. Zia, R.; Nawaz, M.S.; Siddique, M.J.; Hakim, S.; Imran, A. Plant survival under drought stress: Implications, adaptive responses, and integrated rhizosphere management strategy for stress mitigation. Microbiol. Res. 2021, 242, 126626. [Google Scholar] [CrossRef]
Figure 1. Images of four mulberry genotypes.
Forests 14 00949 g001
Figure 2. Photosynthetic rate (Pn, (A)), transpiration rate (Tr, (B)), stomatal conductance (Gs, (C)), and intrinsic water use efficiency (IWUE, (D)) of the four mulberry genotypes. Uppercase letters indicate significant differences between different mulberry genotypes under normal watering (p < 0.05), lowercase letters indicate significant differences between different mulberry genotypes after drought (p < 0.05), * indicate significant differences between the same genotypes before and after drought stress (p < 0.05).
Forests 14 00949 g002
Figure 3. Maximum photochemical efficiency (Fv/Fm, (A)), performance index on absorption basis (PIABS, (B)), and potential activities (Fv/Fo, (C)) in leaves of mulberry genotypes under drought stress. Uppercase letters indicate significant differences between different mulberry genotypes under normal watering (p < 0.05), lowercase letters indicate significant differences between different mulberry genotypes after drought (p < 0.05), * indicate significant differences between the same genotypes before and after drought stress (p < 0.05).
Forests 14 00949 g003
Figure 4. Vj (A) and Mo (B) in leaves of mulberry genotypes under drought stress. Uppercase letters indicate significant differences between different mulberry genotypes under normal watering (p < 0.05), lowercase letters indicate significant differences between different mulberry genotypes after drought (p < 0.05), * indicate significant differences between the same genotypes before and after drought stress (p < 0.05).
Forests 14 00949 g004
Figure 5. ABS/RC (A), ETo/RC (B), and TRo/RC (C) in leaves of mulberry genotypes under drought stress. Uppercase letters indicate significant differences between different mulberry genotypes under normal watering (p < 0.05), lowercase letters indicate significant differences between different mulberry genotypes after drought (p < 0.05), * indicate significant differences between the same genotypes before and after drought stress (p < 0.05).
Forests 14 00949 g005
Figure 6. The PCA of four mulberry genotypes under drought stress: (A) biomass and morphology, (B) photosynthesis and fluorescence.
Forests 14 00949 g006
Table 1. Soluble sugar, starch, NSC, and total chlorophyll content (Chl[a + b]) of four mulberry genotypes.
GenotypesSoluble Sugar (mg·g−1)Starch (mg·g−1)NSC (mg·g−1)Chl (a + b) (mg·g−1)
SSCK68.03 ± 1.02 B86.65 ± 1.16 B *154.68 ± 1.68 A *2.40 ± 0.04 A*
T71.43 ± 0.43 c49.15 ± 1.03 c120.58 ± 0.76 c1.54 ± 0.10 a
ARXCK48.28 ± 0.44 C *75.51 ± 2.17 C123.79 ± 2.43 C *2.11 ± 0.03 B *
T54.81 ± 1.13 d81.33 ± 1.63 d136.14 ± 2.46 ab1.69 ± 0.07 a
FJCK69.16 ± 0.56 B *61.02 ± 1.31 B *130.18 ± 1.57 C1.83 ± 0.09 C *
T75.38 ± 0.49 b51.79 ± 1.82 b127.18 ± 2.19 bc1.47 ± 0.01 a
JACK77.44 ± 1.96 A *64.24 ± 0.88 A *141.68 ± 1.73 B1.98 ± 0.12 BC *
T90.25 ± 0.80 a49.70 ± 2.41 a139.94 ± 3.13 a1.43 ± 0.10 a
C****
W****
C × W****
Results are expressed as mean ± standard deviation (n = 4). Abbreviations: SS, Shensang 1; ARX, Aerxiang; FJ, Fujia; JA, Ji’an. Uppercase letters indicate significant differences between different mulberry genotypes under normal watering (p < 0.05), lowercase letters indicate significant differences between different mulberry genotypes after drought (p < 0.05), * indicate significant differences between the same genotypes before and after drought stress (p < 0.05).
Table 2. Biomass allocation of four mulberry genotypes under drought stress.
GenotypesMorphology TraitsDistribution of Biomass
BLTLASLADLWDBWDRWTBRCR
SSCK78 ± 1.15 A1034.93 ± 54.24 B125.89 ± 1.63 B8.21 ± 0.33 B7.41 ± 0.53 A51.83 ± 2.5 A65.01 ± 3.31 A3.23 ± 0.06 B
T58 ± 1.15 a415.08 ± 16.12 b127.25 ± 5.33 a3.47 ± 0.3 b4.65 ± 0.41 a31.25 ± 4.16 a39.37 ± 4.87 a3.82 ± 0.19 ab
ARXCK44.33 ± 3.18 B620.18 ± 11.1 C131.97 ± 4.81 B4.72 ± 0.24 C2.56 ± 0.08 C30.25 ± 3.15 C37.52 ± 3.47 C4.14 ± 0.25 A
T32.33 ± 1.45 c405.42 ± 11.51 b111.71 ± 3.04 bc3.63 ± 0.13 b1.71 ± 0.18 bc20.86 ± 1.43 bc26.2 ± 1.7 bc3.9 ± 0.1 a
FJCK52 ± 3.46 B1137.38 ± 65.15 B146.19 ± 2.49 A7.8 ± 0.58 B4.34 ± 0.36 B39.72 ± 2.12 B51.86 ± 3.03 B3.28 ± 0.07 B
T39 ± 1.53 b586.93 ± 25.06 a125.73 ± 5.86 ab4.69 ± 0.34 a2.86 ± 0.38 b27.56 ± 1.54 ab35.11 ± 2.25 ab3.67 ± 0.14 a
JACK47 ± 1.73 B1402.25 ± 53.91 A134.28 ± 2.46 B10.44 ± 0.21 A4.35 ± 0.19 B32.82 ± 0.86 BC47.6 ± 1.26 B2.22 ± 0.01 C
T34 ± 2.08 bc565.24 ± 27.3 a100.89 ± 3.26 c5.63 ± 0.44 a1.27 ± 0.43 c16.75 ± 2 c23.65 ± 2.87 c2.43 ± 0.02 b
C********
W********
C × W **** *
Results are expressed as mean ± standard deviation (n = 4). Abbreviation: SS, Shensang 1; ARX, Aerxiang; FJ, Fujia; JA, Ji’an; BL, branch length; TLA, total leaf area; SLA, specific leaf area; DLW, dry leaf weight; DBW, dry branch weight; DRW, dry root weight; TB, total biomass; RCR, root-to-crown ratio. Uppercase letters indicate significant differences between different mulberry genotypes under normal watering (p < 0.05), lowercase letters indicate significant differences between different mulberry genotypes after drought (p < 0.05), * indicate significant differences between the same genotypes before and after drought stress (p < 0.05).
Table 3. The correlation coefficient among biomass components (dependent variables) and morphological traits.
DLWDBWDRWTBRCR
BL0.42 *0.95 **0.90 **0.89 **--
TLA0.97 **0.58 **0.62 **0.72 **−0.59 **
SLA--0.45 *0.52 **0.52 **--
* Showed a significance at p < 0.05, ** showed a significance at p < 0.01. Abbreviation: BL, branch length; TLA, total leaf area; SLA, specific leaf area; DLW, dry leaf weight; DBW, dry branch weight; DRW, dry root weight; TB, total biomass; RCR, root-to-crown ratio.
Table 4. The correlation coefficient among photosynthesis, fluorescence, biochemical indexes, and morphological traits.
PIABSABS/RCTRo/RCGsNSCChl (a + b)
SLA------------
BL0.43 **0.49 **0.31 *0.32 *--0.62 *
TLA--------0.47 *0.53 *
* Showed a significance at p < 0.05, ** showed a significance at p < 0.01. Abbreviation: BL, branch length; TLA, total leaf area; SLA, specific leaf area.
Table 5. Linear combination with a maximal variance of morphological and biomass based on eigenvector values of principal components.
GenotypesPC1 63.9%PC2 22.4%SpeciesPC1 66.0%PC2 14.2%
Morphology
traits
BL0.370.28Photosynthetic
parameters
Pn0.33−0.03
TLA0.37−0.37Gs 0.300.21
SLA0.260.11Tr0.31−0.23
Distribution of
biomass
DLW0.35−0.44IWUE−0.130.63
DBW0.410.20Fluorescence parametersPIABS0.280.37
DRW0.410.24Fv/Fm0.330.06
TB0.430.13Fv/Fo0.320.15
RCR−0.110.68Vj−0.22−0.46
Mo−0.25−0.08
ABS/RC−0.300.24
TRo/RC−0.320.18
ETo/RC0.200.20
Abbreviation: BL, branch length; TLA, total leaf area; SLA, specific leaf area; DLW, dry leaf weight; DBW, dry branch weight; DRW, dry root weight; TB, total biomass; RCR, root-to-crown ratio.
Disclaimer/Publisher’s Note: The statements, opinions and data contained in all publications are solely those of the individual author(s) and contributor(s) and not of MDPI and/or the editor(s). MDPI and/or the editor(s) disclaim responsibility for any injury to people or property resulting from any ideas, methods, instructions or products referred to in the content.

