
Seasonal Variation of Emission Fluxes of CO2, CH4, and N2O from Different Larch Forests in the Daxing’An Mountains of China

 ,
,
Abstract
:1. Introduction
2. Materials and Methods
2.1. Site Description
2.2. Gas Sampling and Flux Measurement
2.3. Soil Sampling and Measurement
2.4. Statistical Analyses
3. Results and Analysis
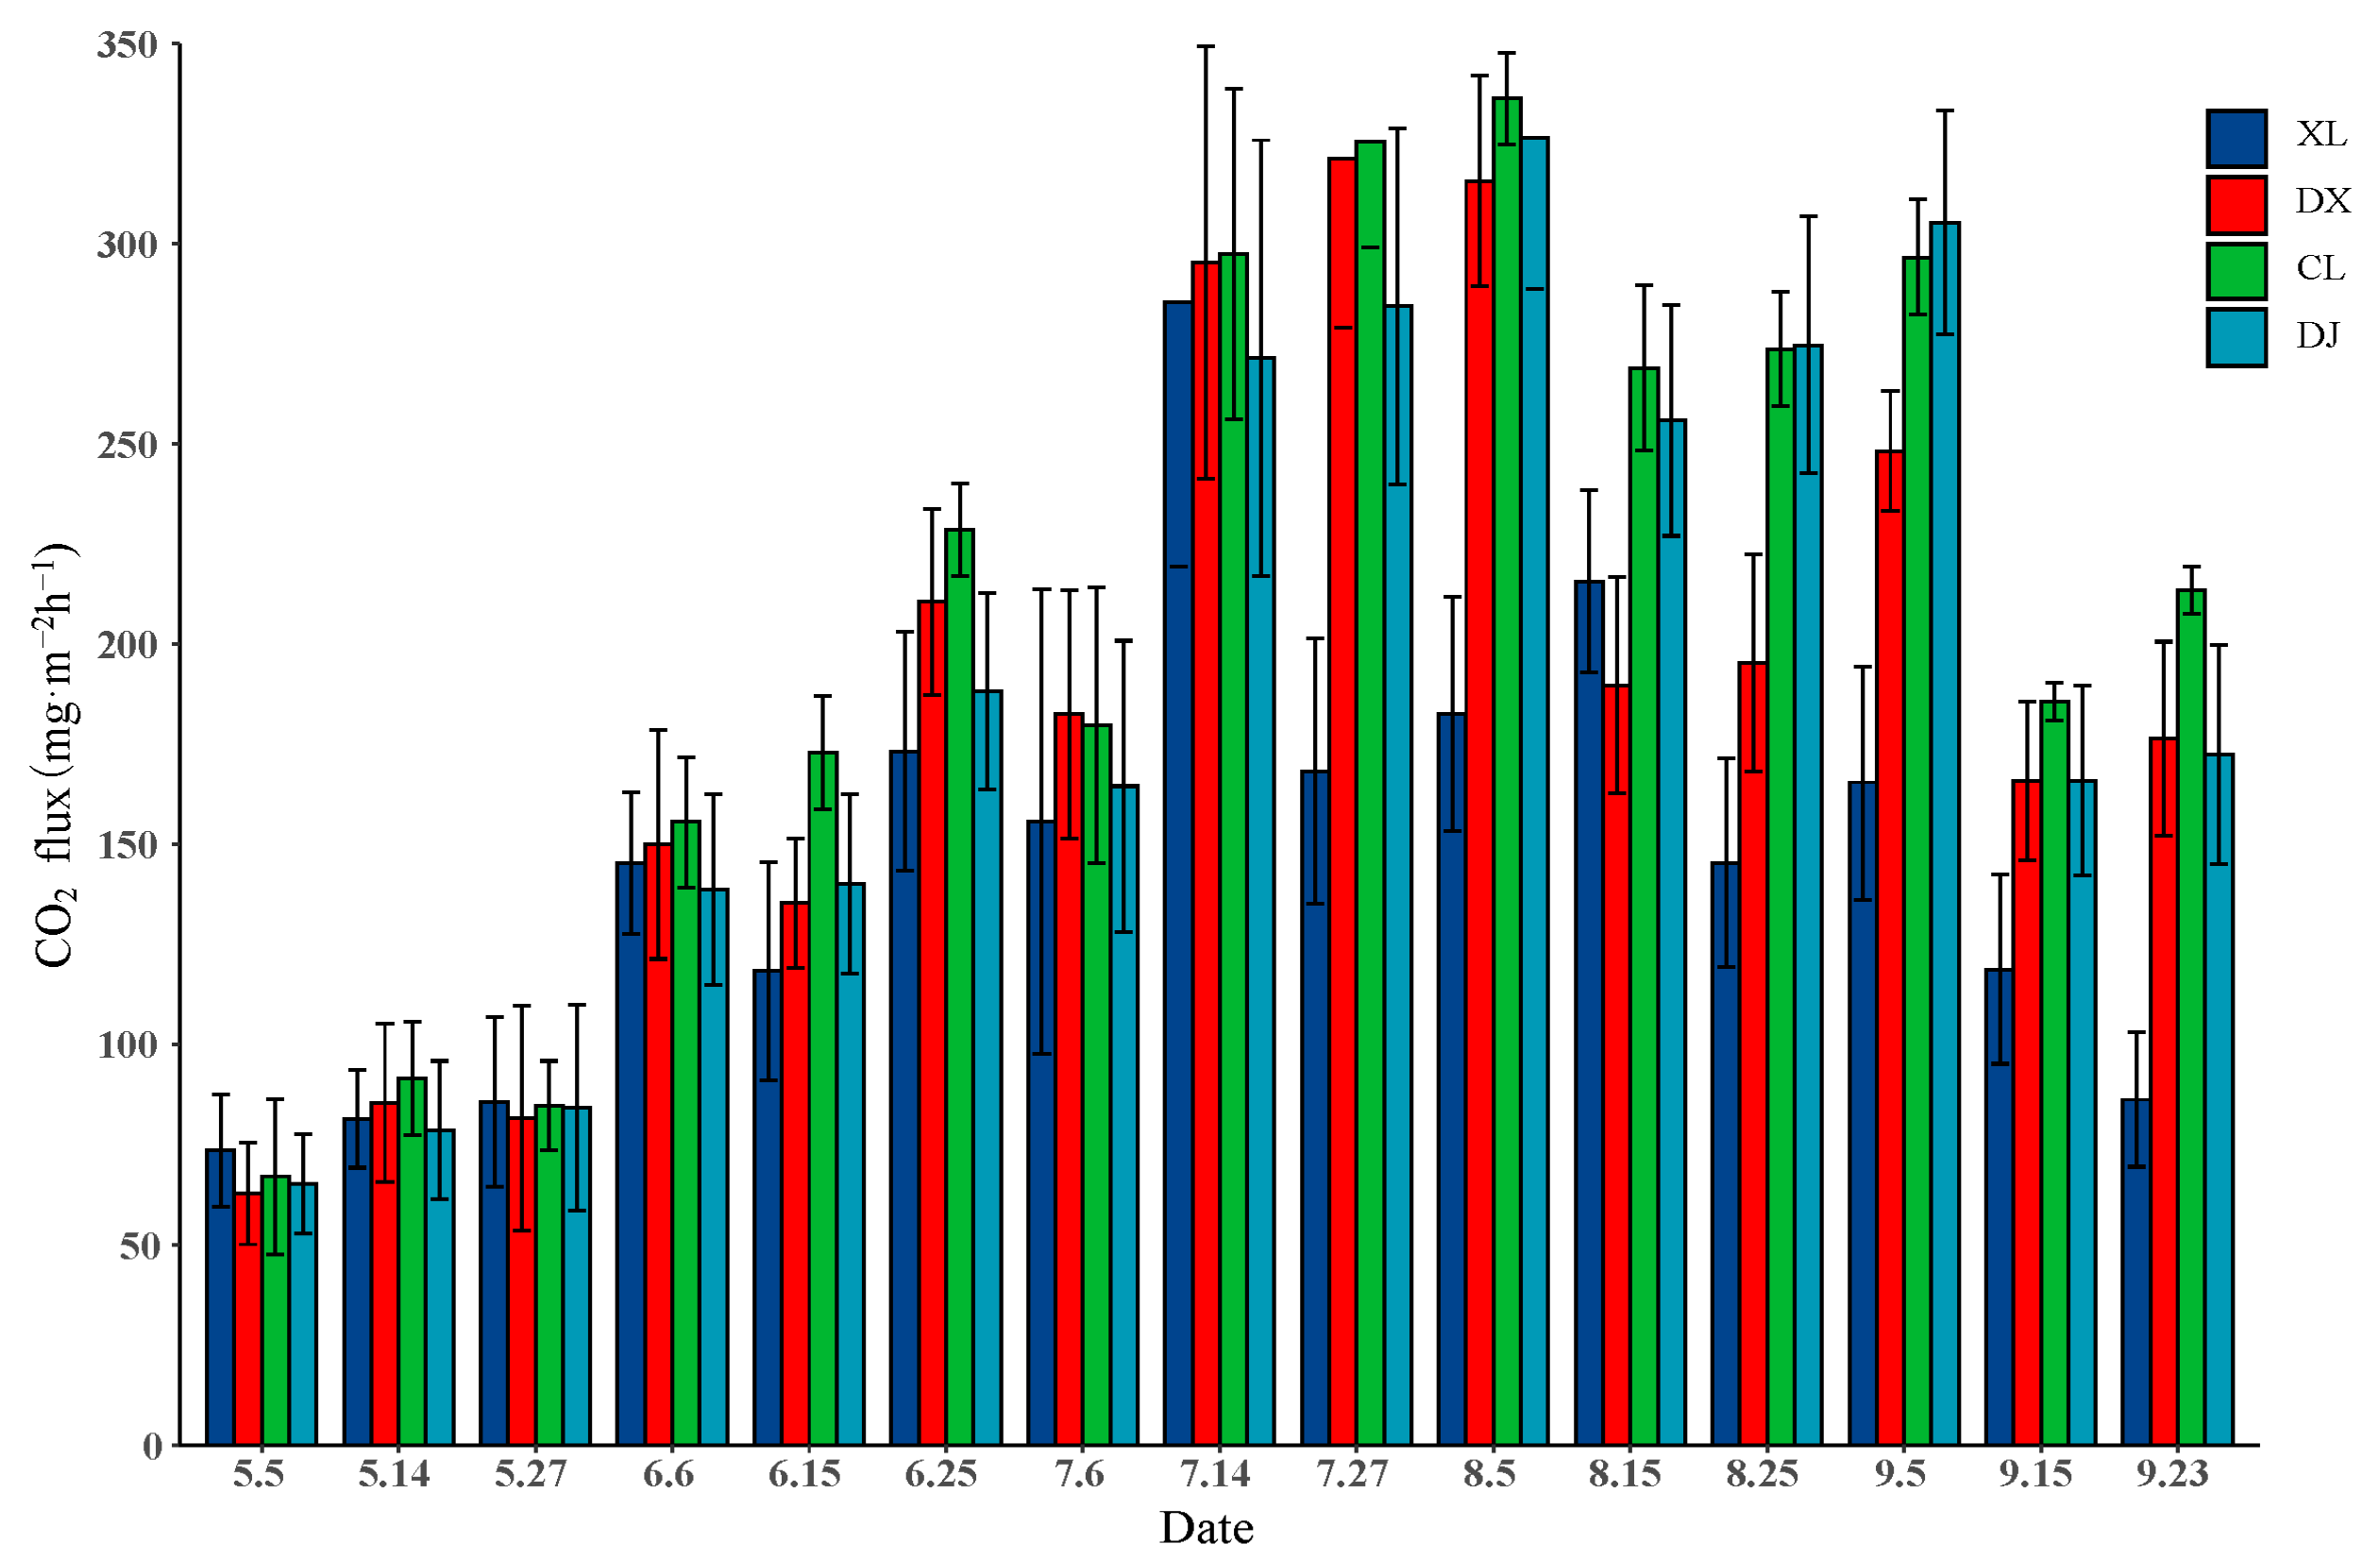
3.1. CO2 Flux
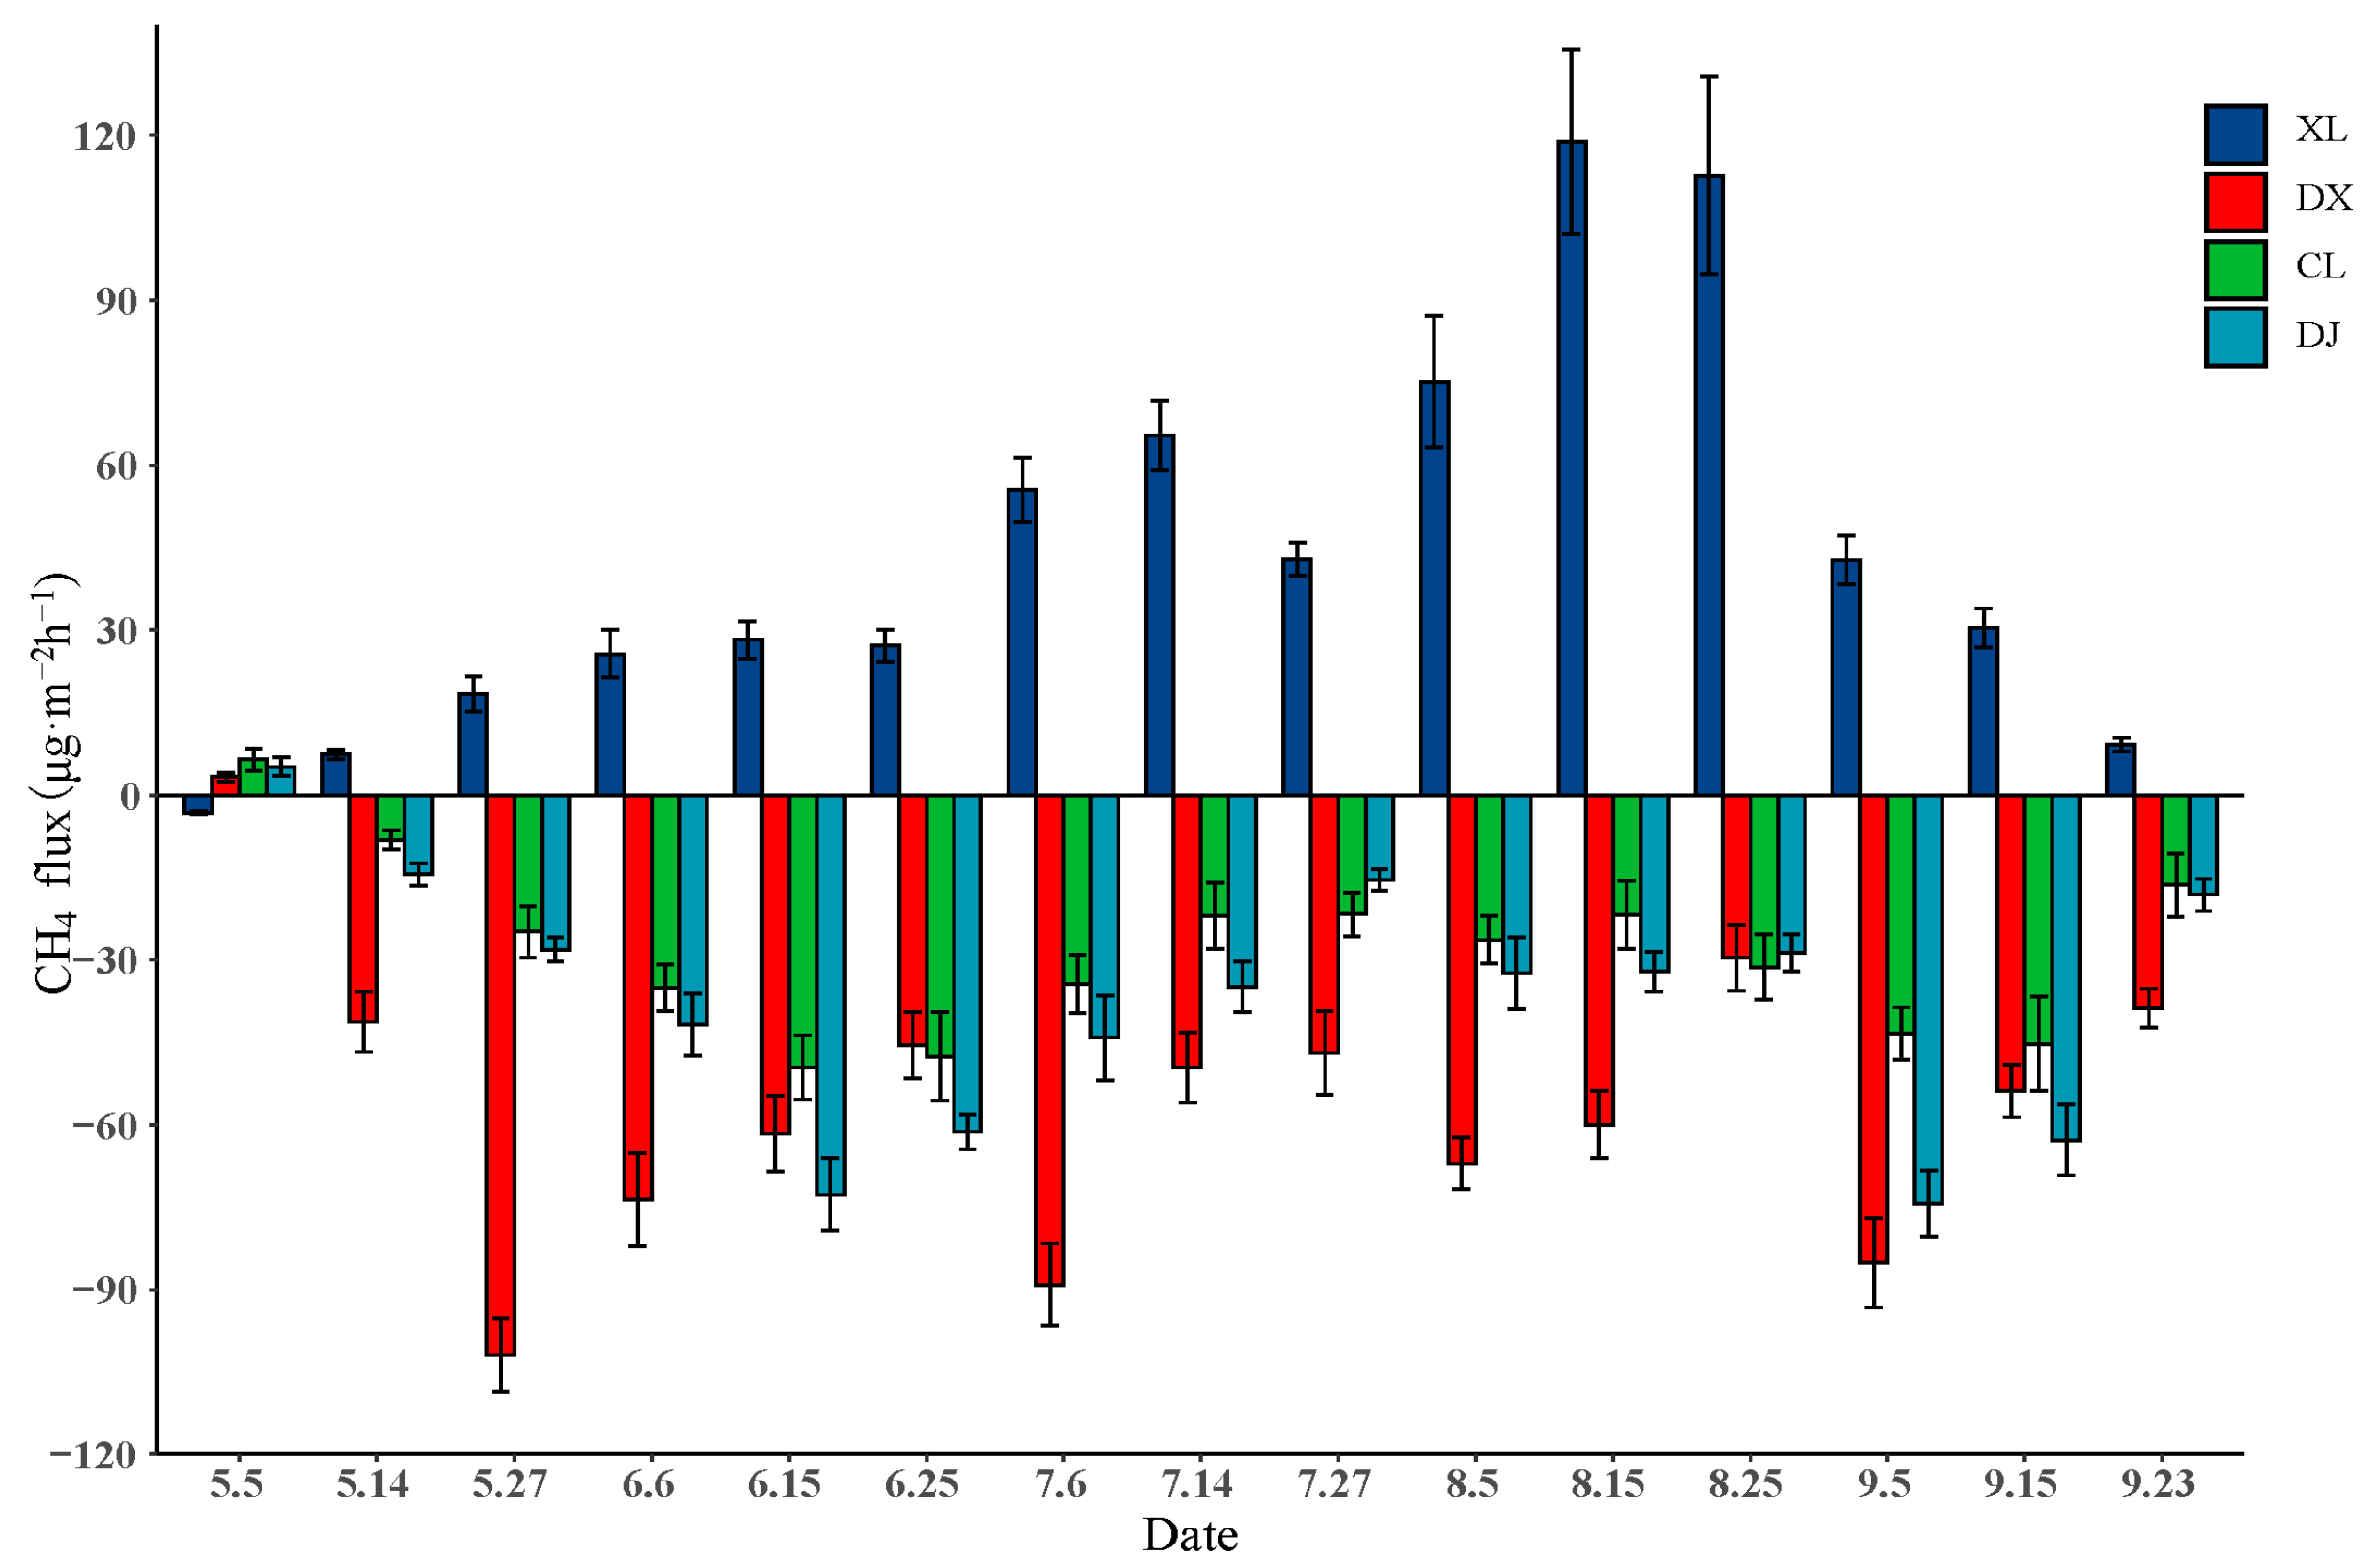
3.2. CH4 Flux
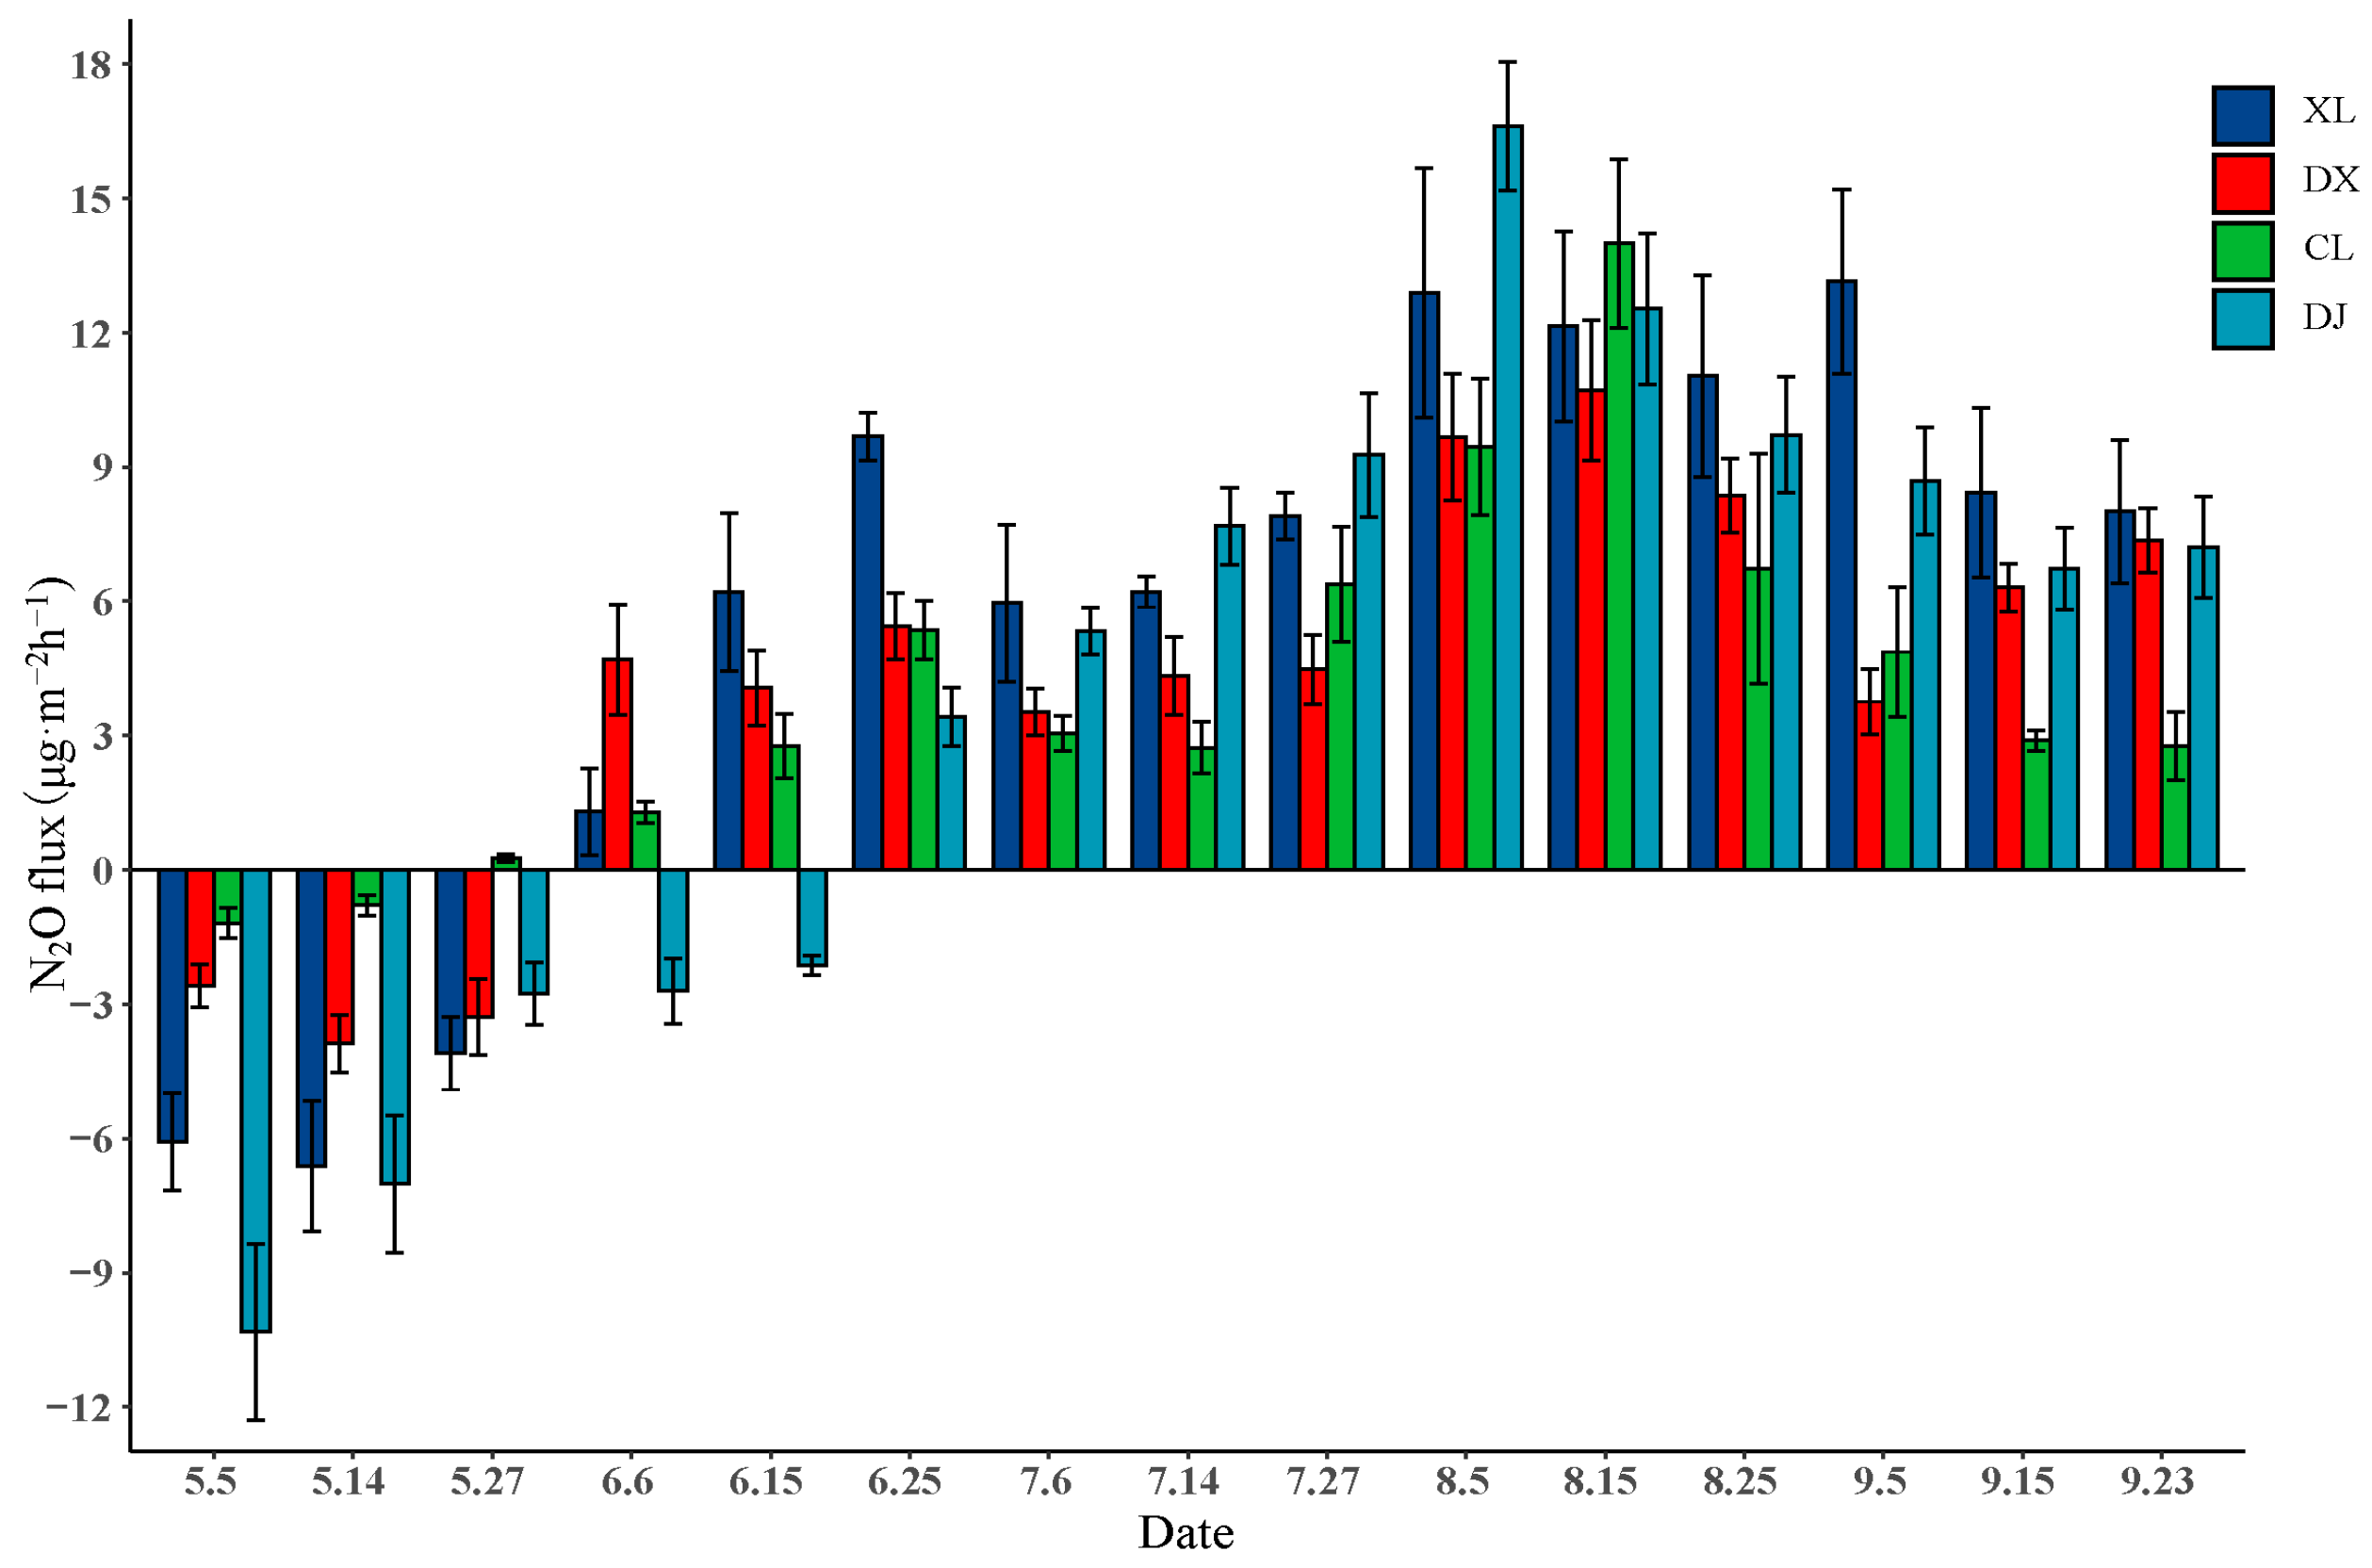
3.3. N2O Flux
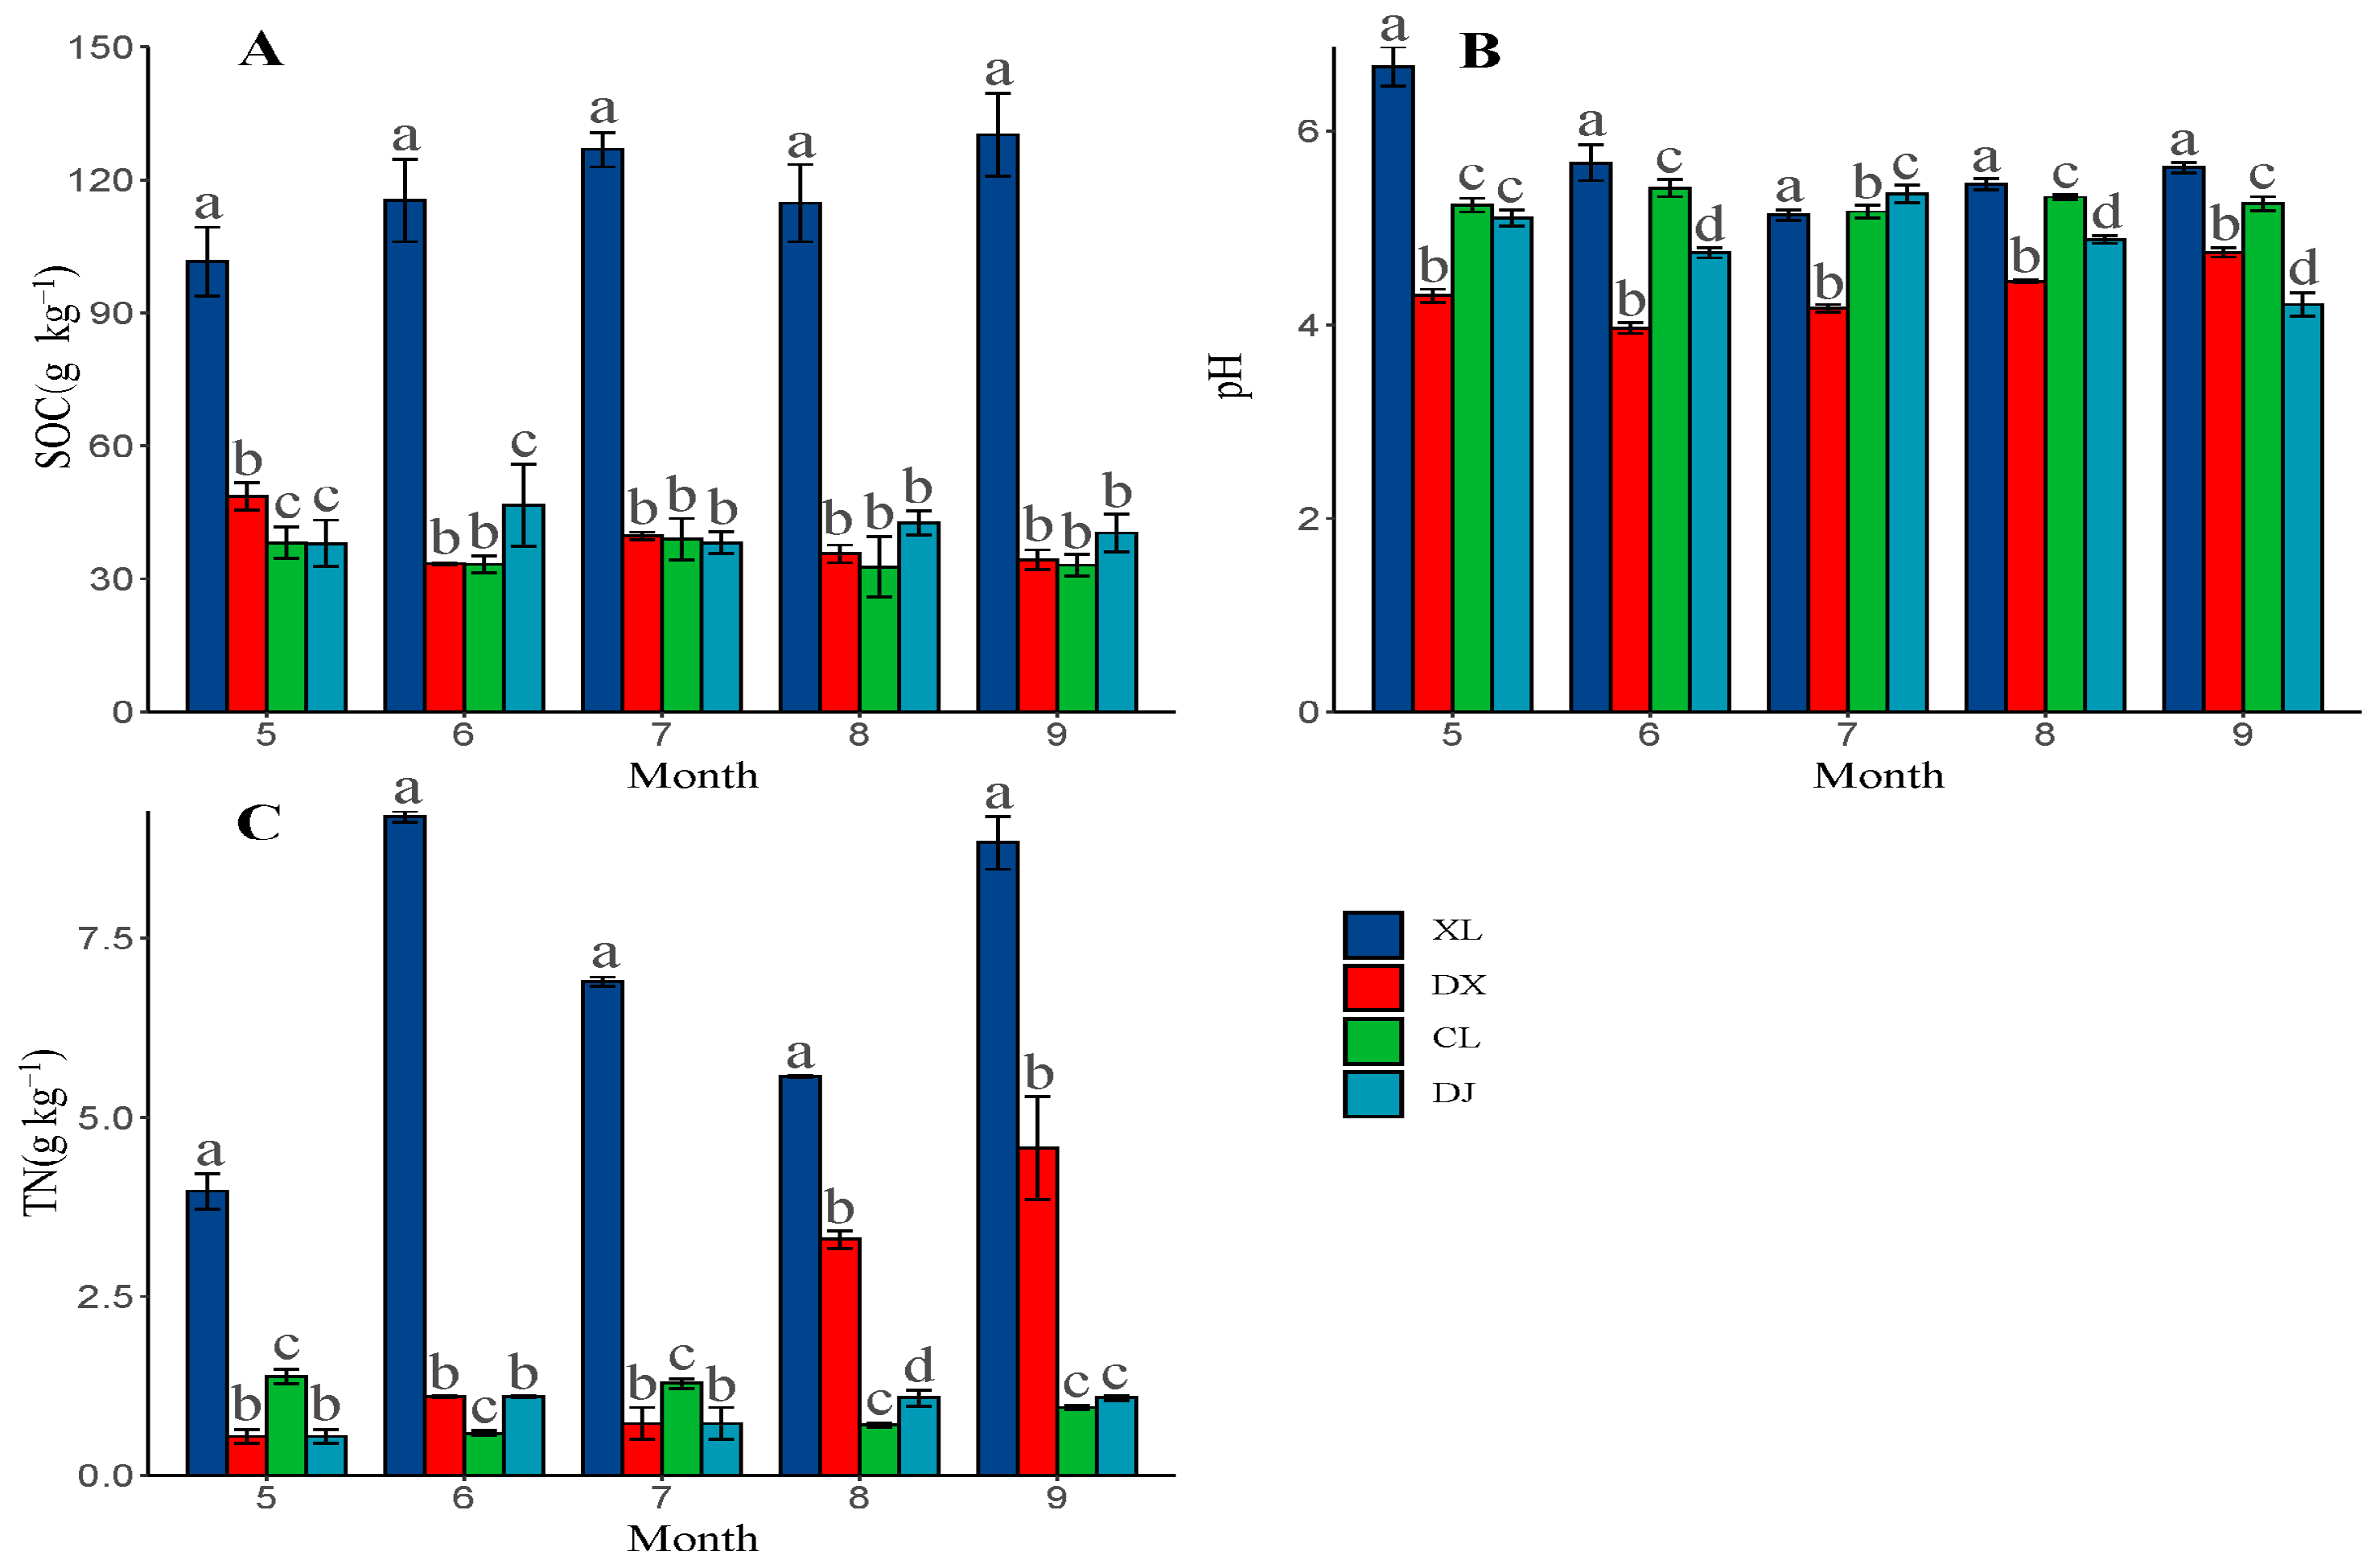
3.4. Soil Indicators
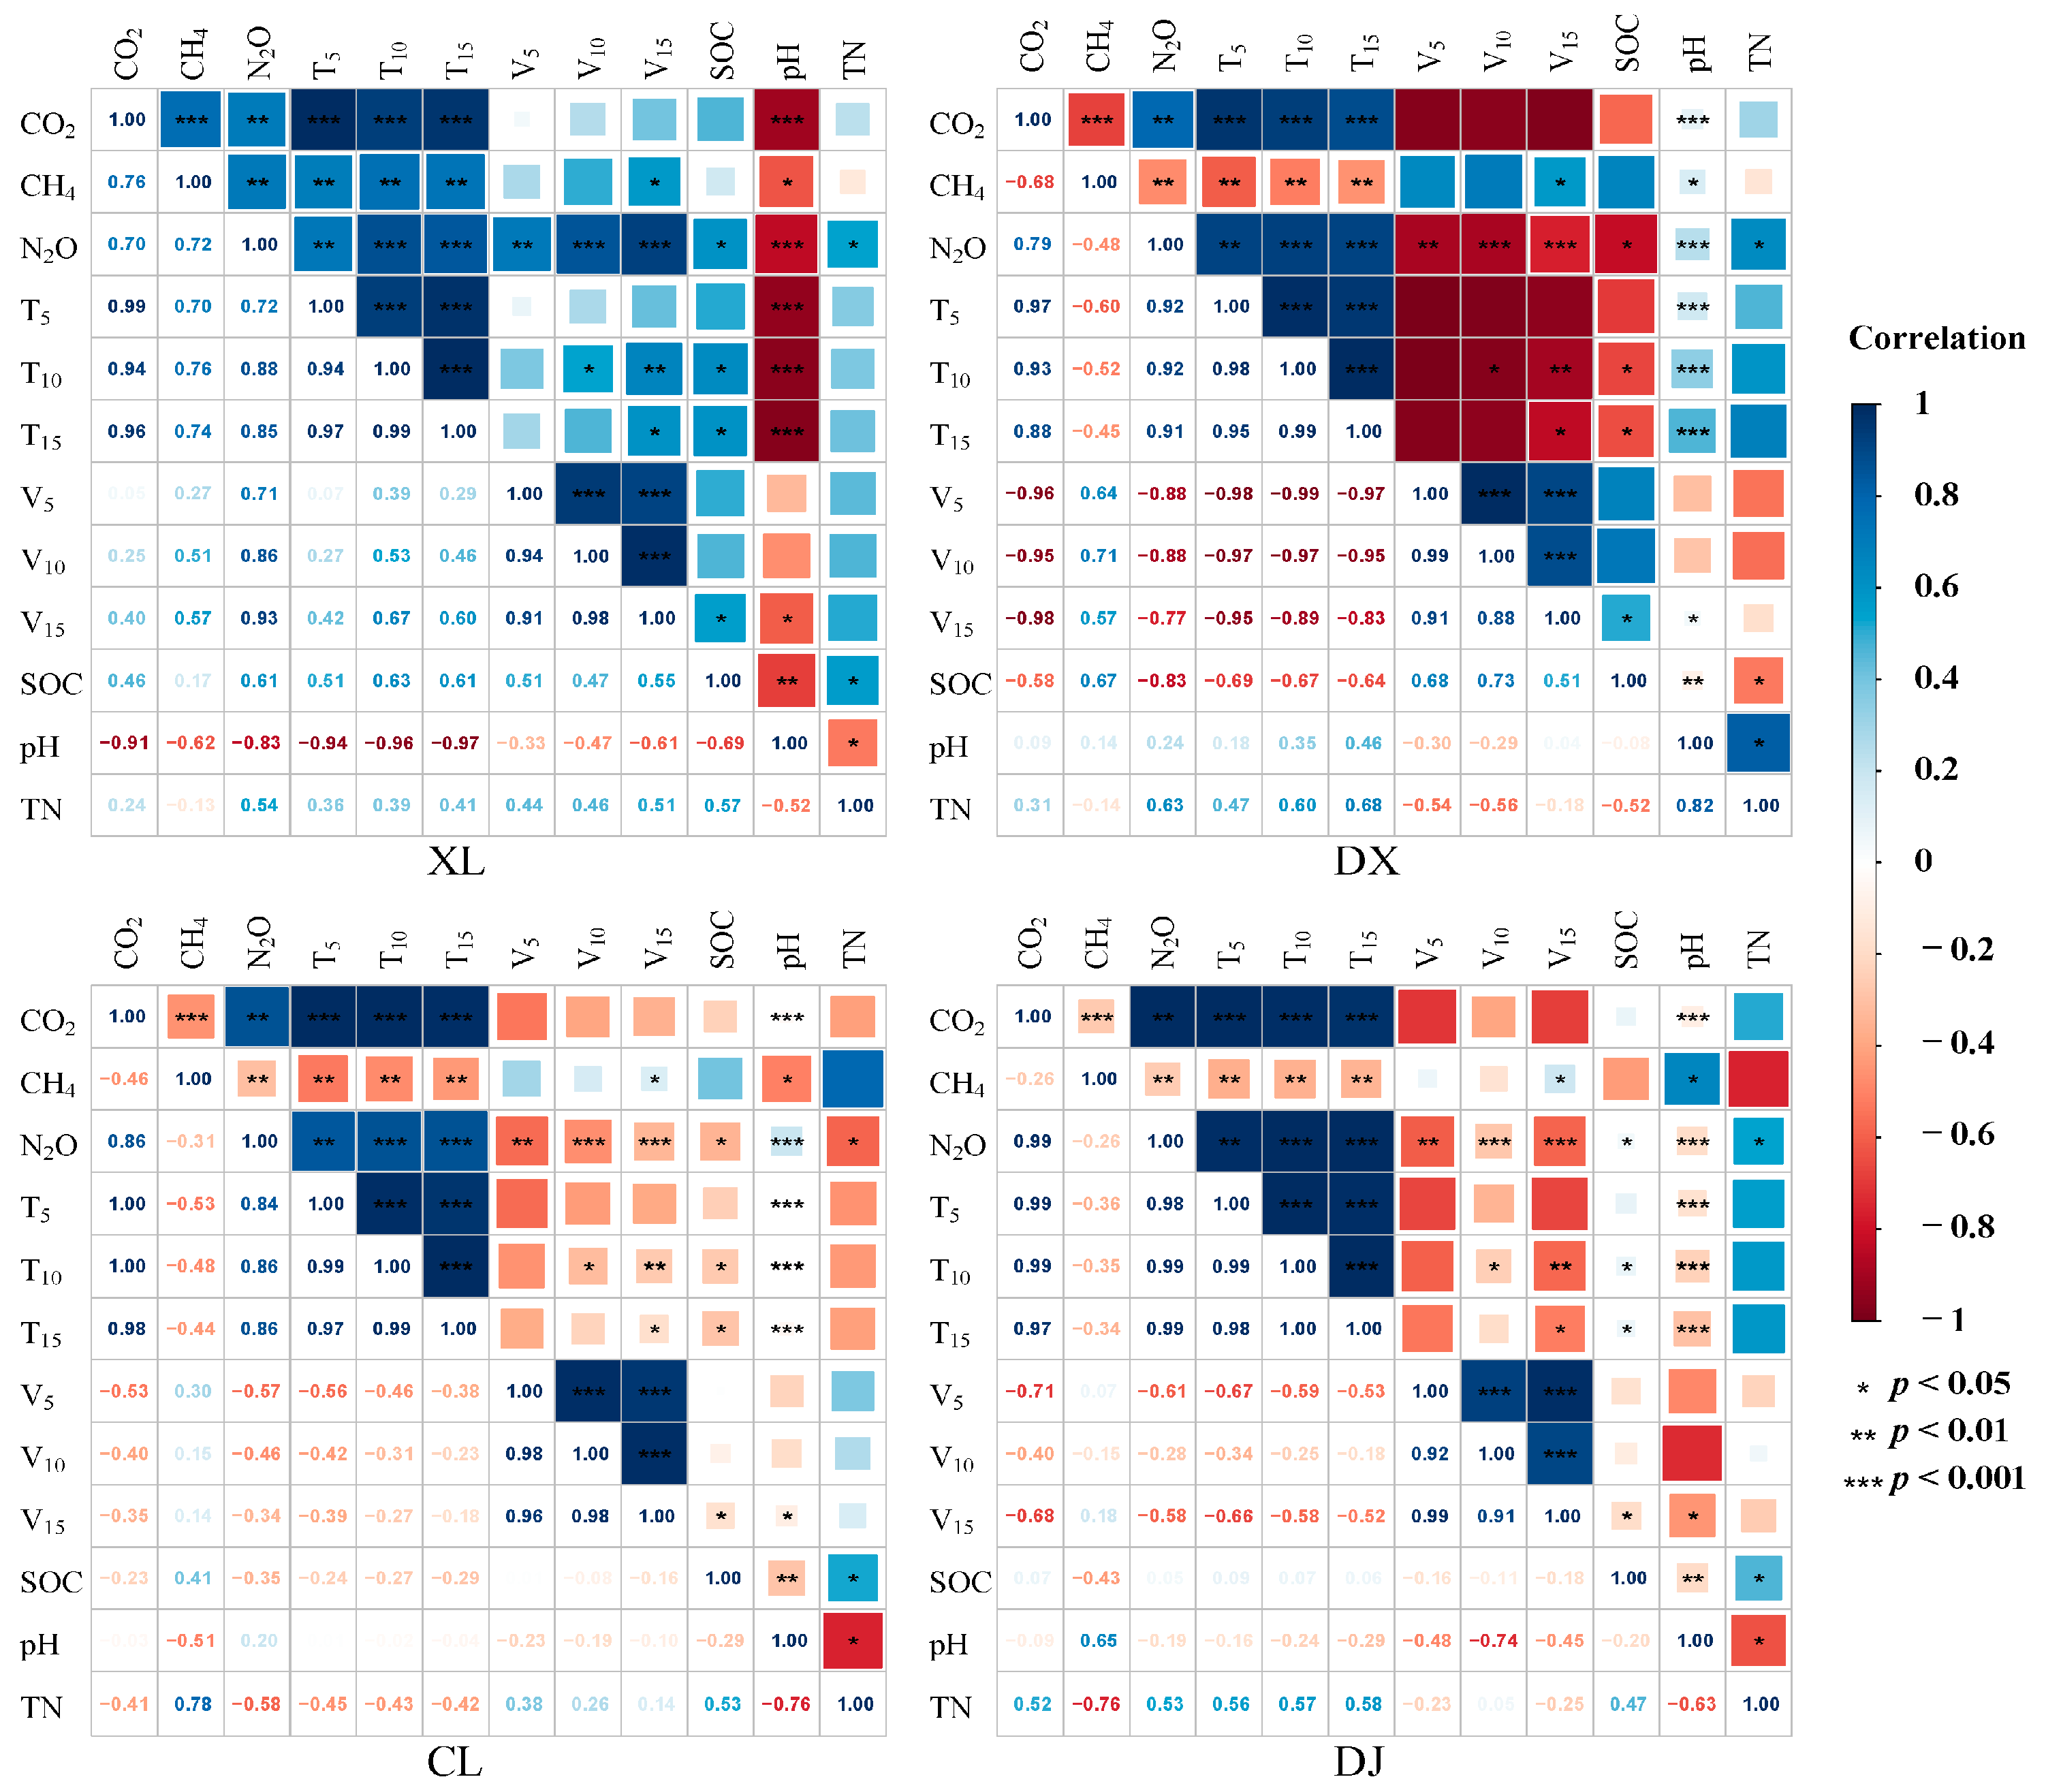
3.5. Relationship between Greenhouse Gas Flux and Environmental Factors
3.6. Temperature Sensitivity of Soil Respiration and Global Warming Potential
4. Discussion
4.1. Differences in Greenhouse Gas Flux between Different Forest Types during the Growing Season
4.2. Selection of Factors Influencing Greenhouse Gas Fluxes
4.3. Temperature Sensitivity of Soil Respiration and Global Warming Potential in Different Forest Types
5. Conclusions
Author Contributions
Funding
Data Availability Statement
Conflicts of Interest
References
- Stocker, T.F.; Qin, D.; Plattner, G.-K.; Tignor, M.; Allen, S.K.; Boschung, J.; Nauels, A.; Xia, Y.; Bex, V.; Midgley, P.M. IPCC, Climate Change 2013: The Physical Science Basis. Contribution of Working Group I to the Fifth Assessment Report of the Intergovernmental Panel on Climate Change; Cambridge University Press: Cambridge, UK; New York, NY, USA, 2013; Volume 1535. [Google Scholar]
- Schuur, E.A.G.; McGuire, A.D.; Schädel, C.; Grosse, G.; Harden, J.W.; Hayes, D.J.; Hugelius, G.; Koven, C.D.; Kuhry, P.; Lawrence, D.M.; et al. Climate change and the permafrost carbon feedback. Nature 2015, 520, 171–179. [Google Scholar] [CrossRef] [PubMed]
- Pörtner, H.O.; Roberts, D.C.; Masson-Delmotte, V.; Zhai, P.; Tignor, M.; Poloczanska, E.; Mintenbeck, K.; Alegría, A.; Nicolai, M.; Okem, A.; et al. IPCC. Special Report on the Ocean and Cryosphere in a Changing Climate; Cambridge University Press: Cambridge, UK; New York, NY, USA, 2019; p. 755. [Google Scholar] [CrossRef]
- Wang, L.; Jiang, Y.L. Advances in Greenhouse Gases Emission in Farmland Soils. Agric. Sci. Technol. 2012, 13, 1738–1743. [Google Scholar]
- Jones, S.K.; Rees, R.M.; Skiba, U.M.; Ball, B.C. Greenhouse gas emissions from a managed grassland. Global Planet. Change 2005, 47, 201–211. [Google Scholar] [CrossRef]
- Page, K.L.; Dalal, R.C. Contribution of natural and drained wetland systems to carbon stocks, CO2, N2O and CH4 fluxes: An Australian perspective. Soil Res. 2011, 49, 377–388. [Google Scholar] [CrossRef]
- Hangs, R.D.; Schoenau, J.J.; Lafond, G.P. The effect of nitrogen fertilization and no-till duration on soil nitrogen supply power and post-spring thaw greenhouse-gas emissions. J. Plant Nutr. Soil Sci. 2013, 176, 227–237. [Google Scholar] [CrossRef]
- Fearnside, P.M. Global Warming and Tropical Land-Use Change: Greenhouse Gas Emissions from Biomass Burning, Decomposition and Soils in Forest Conversion, Shifting Cultivation and Secondary Vegetation. Clim. Chang. 2000, 46, 115–158. [Google Scholar] [CrossRef]
- Kutsch, W.L.; Kappen, L. Aspects of carbon and nitrogen cycling in soils of the Bornhoved Lake district II. Modelling the influence of temperature increase on soil respiration and organic carbon content in arable soils under different managements. Biogeochemistry 1997, 39, 207–224. [Google Scholar] [CrossRef]
- Lal, R.; Follett, R.F.; Stewart, B.A.; Kimble, J.M. Soil carbon sequestration to mitigate climate change and advance food security. Soil Sci. 2007, 172, 943–956. [Google Scholar] [CrossRef]
- Duan, B.X.; Man, X.L.; Song, H.; Liu, J.L. Soil respiration and its component characteristics under different types of Larix gmelinii forests in the north of Daxing’an Mountains of northeastern China. J. Beijing For. Univ. 2018, 40, 40–50. [Google Scholar]
- Lu, R.K. Soil and Agro-Chemical Analytical Methods; China Agricultural Science and Technology Press: Beijing, China, 1999; pp. 146–195. [Google Scholar]
- Rayment, G.E.; Higginson, F.R. The Australian Handbook of Soil and Water Chemical Methods; Inkata Press Pty Ltd.: Melbourne, Australia, 1992. [Google Scholar]
- Zobitz, J.; Aaltonen, H.; Zhou, X.; Berninger, F.; Pumpanen, J.; Köster, K. Comparing an exponential respiration model to alternative models for soil respiration components in a Canadian wildfire chronosequence (FireResp v1.0). Geosci. Model Dev. 2021, 14, 6605–6622. [Google Scholar] [CrossRef]
- Jia, B.; Zhou, G. Integrated diurnal soil respiration model during growing season of a typical temperate steppe: Effects of temperature, soil water content and biomass production. Soil Biol. Biochem. 2009, 41, 681–686. [Google Scholar] [CrossRef]
- Lee, H.H.; Kim, S.U.; Han, H.R.; Hur, D.Y.; Owens, V.N.; Kumar, S.; Hong, C.O. Mitigation of global warming potential and greenhouse gas intensity in arable soil with green manure as source of nitrogen. Environ. Pollut. 2021, 288, 117724. [Google Scholar] [CrossRef] [PubMed]
- Wang, M.; Li, Q.R.; Xiao, D.M.; Dong, B.L. Effects of soil temperature and soil water content on soil respiration in three forest types in Changbai Mountain. J. For. Res. 2004, 2004, 113–118+84. [Google Scholar]
- Li, Y.J.; Ma, J.W.; Li, Y.Q.; Shen, X.Y.; Xia, X.H. Responses of soil microbial community to global climate change: A review. Microbiol. China 2023, 50, 1700–1719. [Google Scholar]
- Zheng, P.F.; Yu, X.X.; Jia, G.D.; Li, H.J.; Wang, Y.S.; Zhu, X.H. Soil respiration and its temperature sensitivity among different vegetation types in Beijing mountain area, China. Chin. J. Appl. Ecol. 2019, 30, 1726–1734. [Google Scholar]
- Conrad, R. Contribution of hydrogen to methane production and control of hydrogen concentrations in methanogenic soils and sediments. FEMS Microbiol. Ecol. 1999, 28, 193–202. [Google Scholar] [CrossRef]
- Liu, Z.G.; Chen, Z.; Yu, G.R.; Zhang, W.K.; Zhang, T.Y.; Han, L. The role of climate, vegetation, and soil factors on carbon fluxes in Chinese drylands. Front. Plant Sci. 2023, 14, 1060066. [Google Scholar] [CrossRef]
- Thauer, R.K. Functionalization of methane in anaerobic microorganisms. Angew. Chem. Int. Ed. 2010, 49, 6712–6713. [Google Scholar] [CrossRef]
- McDonald, I.R.; Bodrossy, L.; Chen, Y.; Murrell, J.C. Molecular ecology techniques for the study of aerobic methanotrophs. Appl. Environ. Microb. 2008, 74, 1305–1315. [Google Scholar] [CrossRef] [Green Version]
- Semrau, J.D.; Dispirito, A.A.; Sukhwan, Y. Methanotrophs and copper. FEMS Microbiol. Rev. 2010, 34, 496–531. [Google Scholar] [CrossRef] [Green Version]
- Morishita, T.; Aizawa, S.; Yoshinaga, S.; Kaneko, S. Seasonal change in N2O flux from forest soils in a forest catchment in Japan. J. For. Res. 2011, 16, 386–393. [Google Scholar] [CrossRef]
- Schimel, J.P.; Weintraub, M.N. Interactions between Carbon and Nitrogen Mineralization and Soil Organic Matter Chemistry in Arctic Tundra Soils. Ecosystems 2003, 6, 129–143. [Google Scholar]
- Harden, J.W.; Koven, C.D.; Ping, C.L.; Hugelius, G.; David, M.A.; Camill, P.; Jorgenson, T.; Kuhry, P.; Michaelson, G.J.; O’Donnell, J.A.; et al. Field information links permafrost carbon to physical vulnerabilities of thawing. Geophys. Res. Lett. 2012, 39, L15704. [Google Scholar] [CrossRef] [Green Version]
- Qi, Y.C.; Dong, Y.S.; Zhang, S. Methane Fluxes of Typical Agricultural Soil in the North China Plain. J. Ecol. Rural. Environ. 2002, 18, 56–58. [Google Scholar]
- Li, Z.L.; Zeng, Z.Q.; Tian, D.S.; Wang, J.S.; Fu, Z.; Zhang, F.Y.; Zhang, R.Y.; Chen, W.N.; Luo, Y.Q.; Niu, S.L. Global patterns and controlling factors of soil nitrification rate. Glob. Chang. Biol. 2020, 26, 4147–4157. [Google Scholar] [CrossRef]
- Li, J.B.; Zhu, D.G.; Wu, Y.N.; Xu, N.; Song, J.F. Seasonal variation of emission fluxes of CO2, N2O and CH4 from four typical larch forests in Daxing’anling mountains of China. J. Cent. South Univ. For. Technol. 2018, 38, 95–102. [Google Scholar]
- Cao, Y.; Wang, L. How to Statistically Disentangle the Effects of Environmental Factors and Human Disturbances: A Review. Water 2023, 15, 734. [Google Scholar] [CrossRef]
- Wei, S.J.; Luo, B.Z.; Sun, L.; Wei, S.W.; Liu, F.F.; Hu, H.Q. Spatial and temporal heterogeneity and effect factors of soil respiration in forest ecosystems: A review. Ecol. Environ. Sci. 2013, 22, 689–704. [Google Scholar]
- Yang, Y.; Li, T.; Pokharel, P.; Liu, L.X.; Qiao, J.B.; Wangm, Y.Q.; An, S.S.; Chang, S.X. Global effects on soil respiration and its temperature sensitivity depend on nitrogen addition rate. Soil Biol. Biochem. 2022, 174, 108814. [Google Scholar] [CrossRef]
- Davidson, E.A.; Janssens, I.A.; Luo, Y.Q. On the variability of respiration in terrestrial ecosystems: Moving beyond Q10. Glob. Chang. Biol. 2010, 12, 154–164. [Google Scholar] [CrossRef]
- Davidson, E.A.; Belk, E.; Boone, R.D. Soil water content and temperature as independent or confounded factors controlling soil respiration in a temperate mixed hardwood forest. Glob. Chang. Biol. 1998, 4, 217–227. [Google Scholar] [CrossRef] [Green Version]
- Chen, Z.; Han, R.Y.; Yang, S.Q.; Zhang, A.P.; Zhang, Q.W.; Mi, Z.R.; Wang, Y.S.; Yang, Z.L. Fluxes of CO2, CH4 and N2O from seasonal freeze-thaw arable soils in Northeast China. J. Agro-Environ. Sci. 2016, 35, 387–395. [Google Scholar]
- Zheng, J.J.; Huang, S.Y.; Jia, X.; Tian, Y.; Mu, Y.; Liu, P.; Zha, T.S. Spatial variation and controlling factors of temperature sensitivity of soil respiration in forest ecosystems across China. Chin. J. Plant Ecol. 2020, 44, 687–698. [Google Scholar] [CrossRef]
- Janssens, I.A.; Pilegaard, K. Large seasonal changes in Q10 of soil respiration in a beech forest. Glob. Chang. Biol. 2010, 9, 911–918. [Google Scholar] [CrossRef]
- You, G.Y.; Zhang, Z.Y.; Zhang, R.D. Temperature sensitivity of photosynthesis and respiration in terrestrial ecosystems globally. Acta Ecol. Sin. 2018, 38, 8392–8399. [Google Scholar]
- Chen, H.; Han, Q.T. Does a General Temperature-Dependent Q10 Model of Soil Respiration Exist at Biome and Global Scale? J. Integr. Plant Biol. 2005, 47, 1288–1302. [Google Scholar] [CrossRef]


| Forest Type | CO2 Cumulative Emissions (kg ha−1) | CH4 Cumulative Emissions (kg ha−1) | N2O Cumulative Emissions (kg ha−1) | GWP (kg ha−1) |
|---|---|---|---|---|
| XL | 4999.88 | 1.16 | 0.196 | 5087.29 |
| DX | 6396.48 | −1.91 | 0.143 | 6391.34 |
| CL | 7218.48 | −0.96 | 0.137 | 7259.31 |
| DJ | 6625.15 | −1.26 | 0.141 | 6635.67 |
| Forest Type | Gas | Equation | Adj R2 | p | AIC |
|---|---|---|---|---|---|
| XL | CO2 | CO2 = 36.27T − 0.28V − 2.02TN + 113.72 | 0.995 | <0.001 | 83.15 |
| CO2 = 23.48T − 1.29V + 0.4T × V + 97.37 | 0.998 | <0.01 | 72.17 | ||
| CH4 | CH4 = 23.25T + 0.84V − 0.87SOC − 9.37TN + 120.06 | 0.912 | <0.001 | 117.97 | |
| CH4 = −30.1T − 3.37V + 2.48TN + 1.69 T × V + 51.89 | 0.998 | <0.001 | 52.85 | ||
| N2O | N2O = 2.71T + 0.19V − 0.05SOC − 4.55 | 0.987 | <0.001 | 38 | |
| N2O = −0.09V + 0.99TN + 0.11 T × V − 9.07 | 0.998 | <0.001 | 5.72 | ||
| DX | CO2 | CO2 = 24.33T − 16.84TN + 8.43 | 0.948 | <0.001 | 130.43 |
| CO2 = −24.38V − 6.18TN + 384.45 (T × V Insignificant) | 0.997 | <0.001 | 89.91 | ||
| CH4 | CH4 = 0.68SOC − 81.98 | 0.413 | <0.01 | 92.7 | |
| CH4 = 1.34V − 69.68 (T × V Insignificant) | 0.387 | <0.01 | 92.99 | ||
| N2O | N2O = − 0.79V + 1.6TN + 39.37 | 0.892 | <0.001 | 59.53 | |
| N2O = 0.9T − 6pH + 1.22 TN − 26.11 (T × V Insignificant) | 0.939 | <0.001 | 50.51 | ||
| CL | CO2 | CO2 = 21.4T − 2.26V + 9.67TN + 68.72 | 0.99 | <0.001 | 38.78 |
| CO2 = 22.27T − 1.7V + 8.7TN + 63.55 (T × V Insignificant) | 0.99 | <0.001 | 35.88 | ||
| CH4 | CH4 = −0.53T − 0.25V − 0.12SOC + 30.31TN + 10.07pH − 99.61 | 0.44 | >0.05 | 114.9 | |
| CH4 = 20.31T + 13.34V + 6.99TN − 1.5 T × V − 223.53 | 0.998 | <0.001 | 26.07 | ||
| N2O | N2O = 0.71T − 1.7 | 0.715 | <0.01 | 67.99 | |
| N2O = 4.98T + 2.95V − 6.57 TN − 0.31T × V − 27.04 | 0.984 | <0.001 | 24.76 | ||
| DJ | CO2 | CO2 = 21.18T + 5.49 | 0.994 | <0.001 | 101.09 |
| CO2 = 27.76T + 1.9V − 0.73T × V + 51.64 | 0.999 | <0.001 | 35.16 | ||
| CH4 | CH4 = 3.07T + 6.32V + 55.37pH − 370.62 | 0.757 | <0.01 | 112.69 | |
| CH4 = 12.25T + 11.22V + 15.18pH − 1.37 T × V − 205.64 | 0.991 | <0.001 | 64.33 | ||
| N2O | N2O = 2.22T − 21.45 | 0.984 | <0.001 | 45.83 | |
| N2O = 3.26T + 0.79V − 0.82pH − 0.12T × V − 14.16 | 0.999 | <0.001 | −14.49 |
| Forest Type | Soil Depth | Equation | R2 | p | b | Q10 |
|---|---|---|---|---|---|---|
| 5 cm | CO2 = 87.7e0.167t | 0.947 | <0.001 | 0.167 | 5.31 | |
| XL | 10 cm | CO2 = 85.5e0.247t | 0.868 | <0.001 | 0.247 | 11.82 |
| 15 cm | CO2 = 84.7e0.223t | 0.921 | <0.001 | 0.223 | 9.3 | |
| 5 cm | CO2 = 62.7e0.12t | 0.876 | <0.001 | 0.12 | 3.32 | |
| DX | 10 cm | CO2 = 81.3e0.115t | 0.814 | <0.001 | 0.115 | 3.16 |
| 15 cm | CO2 = 95.1e0.111t | 0.73 | <0.001 | 0.111 | 3.03 | |
| 5 cm | CO2 = 71.3e0.118t | 0.959 | <0.001 | 0.118 | 3.25 | |
| CL | 10 cm | CO2 = 80.9e0.115t | 0.952 | <0.001 | 0.115 | 3.16 |
| 15 cm | CO2 = 90e0.112t | 0.917 | <0.001 | 0.112 | 3.06 | |
| 5 cm | CO2 = 71.2e0.128t | 0.988 | <0.001 | 0.128 | 3.6 | |
| DJ | 10 cm | CO2 = 78.7e0.127t | 0.965 | <0.001 | 0.127 | 3.56 |
| 15 cm | CO2 = 86.5e0.124t | 0.926 | <0.001 | 0.124 | 3.46 |
Disclaimer/Publisher’s Note: The statements, opinions and data contained in all publications are solely those of the individual author(s) and contributor(s) and not of MDPI and/or the editor(s). MDPI and/or the editor(s) disclaim responsibility for any injury to people or property resulting from any ideas, methods, instructions or products referred to in the content. |
© 2023 by the authors. Licensee MDPI, Basel, Switzerland. This article is an open access article distributed under the terms and conditions of the Creative Commons Attribution (CC BY) license (https://creativecommons.org/licenses/by/4.0/).
Share and Cite
Li, J.; Wu, Y.; Wang, J.; Liang, J.; Dong, H.; Chen, Q.; Zhong, H. Seasonal Variation of Emission Fluxes of CO2, CH4, and N2O from Different Larch Forests in the Daxing’An Mountains of China. Forests 2023, 14, 1470. https://doi.org/10.3390/f14071470
Li J, Wu Y, Wang J, Liang J, Dong H, Chen Q, Zhong H. Seasonal Variation of Emission Fluxes of CO2, CH4, and N2O from Different Larch Forests in the Daxing’An Mountains of China. Forests. 2023; 14(7):1470. https://doi.org/10.3390/f14071470
Chicago/Turabian StyleLi, Jinbo, Yining Wu, Jianbo Wang, Jiawen Liang, Haipeng Dong, Qing Chen, and Haixiu Zhong. 2023. "Seasonal Variation of Emission Fluxes of CO2, CH4, and N2O from Different Larch Forests in the Daxing’An Mountains of China" Forests 14, no. 7: 1470. https://doi.org/10.3390/f14071470
APA StyleLi, J., Wu, Y., Wang, J., Liang, J., Dong, H., Chen, Q., & Zhong, H. (2023). Seasonal Variation of Emission Fluxes of CO2, CH4, and N2O from Different Larch Forests in the Daxing’An Mountains of China. Forests, 14(7), 1470. https://doi.org/10.3390/f14071470