Article

Impact of Downed Logs of Masson Pine (Pinus massoniana Lamb.) on Soil Microbial Community in a Climate Transitional Forest of Central China

1
International Joint Research Laboratory for Global Change Ecology, School of Life Sciences, Henan University, Kaifeng 475004, China
2
College of Resources and Environmental Science and Engineering, Hubei University of Science and Technology, Xianning 437000, China
3
State Key Laboratory of Subtropical Silviculture, College of Forestry and Biotechnology, Zhejiang A&F University, Hangzhou 311300, China
*
Author to whom correspondence should be addressed.
Forests 2023, 14(5), 955; https://doi.org/10.3390/f14050955
Submission received: 2 March 2023 / Revised: 14 April 2023 / Accepted: 30 April 2023 / Published: 6 May 2023
(This article belongs to the Section Forest Soil)

Abstract

:
Downed woody debris (DWD) can alter the chemical and biological properties of forest soils, and this process is affected by the degree of DWD decay. Our aim was to assess the effects of the entire decay process of DWD on the associated soil microbial communities. Here, we examined the differences in soil microbial community size and composition among five decay stages (DC Ⅰ–Ⅴ) of Masson pine (Pinus massoniana Lamb.) at two soil depths in a climate transitional forest and then linked these differences to soil chemical properties. The decay of DWD increased soil total PLFAs, and the complexity of soil microbial networks was highest in stage Ⅱ and then decreased with the decay stage. The relative abundance of fungi increased with the decay stage, while the relative abundance of gram-positive bacteria decreased with the decay stage. The microbial community composition at a soil depth of 0–10 cm was mainly driven by soil pH and organic C (SOC), and at a depth of 10–20 cm, soil pH was the primary determinant of microbial community composition. Our findings suggest that DWD decomposition reduces microbial physiological stress, promotes fungal growth, and stimulates microbial biomass, highlighting the positive impact of DWD on forest soils. Future research is needed to elucidate the universal effects of DWD decomposition on soil properties, especially focusing on the response of soil microbial processes to the decomposition time of DWD.

1. Introduction

Downed logs (or downed woody debris (DWD)) are abundant in forest ecosystems and account for approximately 20% of the total biomass of forest plants [1]. The biomass of DWD is expected to increase due to the frequency and severity of extreme climate events and human disturbances (e.g., droughts, storms, fire, and disafforestation) [2,3]. Given that it provides a habitat and food supply for a variety of creatures [4] and is an active participant in the carbon (C) and nutrient cycles of forests [5,6], DWD has a major effect on the structure and function of forests. The production of DWD alters forest canopy openings [7], the formation of soil microclimates [8], and soil physicochemical properties [9], all of which affect the growth and activity of the soil microbial community [10]. Numerous studies suggest that soil quality and health improve with the decomposition of DWD [9,11]. However, the effect of DWD decomposition on soil microbial community composition and function has received little attention.
Soil microbes play an essential ecological role in regulating ecosystem processes and function, including improving soil fertility [12] and driving biogeochemical cycles [6]. Previous studies have stated the importance of soil nutrients in the soil microbial community during DWD decomposition [10,13,14]. DWD resembles a nutrient reservoir in forest ecosystems, and the organic C and nutrients produced by decomposing DWD can stimulate the growth and reproduction of soil decomposers and alter microbial community composition [15,16,17]. The decay of DWD increases microbial biomass [9,18] and the ratio of fungi to bacteria (F/B) in forest soils [18]. Fast-growing bacteria are more competitive in substrates with high-quality litter, and fungi are more competitive in substrates with low-quality litter [19,20]. Low-quality woody litter imports more organic matter into the soil and may have a longer-lasting effect on microorganisms [8]. In addition, changes in organic C and nutrients in the soil may affect the abundance of microbial taxa under different nutrient strategies, and drive changes in microbial life-history traits [21]. For example, oligotrophic taxa favor low-nutrient environments, whereas copiotrophic communities dominate when nutrients are abundant [22]. Furthermore, it has been observed that the DWD-derived compounds generally result in a decrease in soil pH [23,24], which may have a profound impact on the soil microbial communities [25]. The increase in soil acidity has different effects on microorganisms depending on the adaptation of microbial taxa to acidic environments [25,26]. A decrease in soil pH generally increases the F/B ratios [27]. Changes in soil microbial community composition, especially in the F/B ratios, are directly related to the accumulation and stability of the soil C pool [28].
In general, the dynamics of soil microbial communities are parallel to changes in soil chemistry [12]. However, the degree of DWD decay and soil depth affect changes in soil properties caused by downed logs [23,29]. The effects of downed logs on the soil environment and nutrients increase with the degree of decomposition [30]. For example, the soil N concentration increases with the decay stage, which may be related to the fixation of N by microorganisms [24]. Importantly, an increase in soil N directly affects microbial activity and function [31]. Therefore, the soil microbial community composition varies with the decay stage of plant residues [32]. Some fungal species appear in the soil only in the presence of severely decayed wood [33]. Additionally, the accumulation of plant residues on the soil surface and the leaching process of soil lead to vertical gradient changes in soil chemical properties [8,34], and the response of soil microorganisms to DWD decay may show strong spatial heterogeneity [35]. Thus, soil microbial composition may vary with soil depth and by interaction with the decay stage of DWD [9]. However, the possible interaction of the decay stage of DWD and soil depth with the soil microbial community has not been thoroughly studied.
Here, we carried out a study in mixed broadleaf–conifer forests in Central China. This mixed forest is the dominant forest type in the transition belt of the warm temperate to subtropical regions; it is sensitive to climate change and features complex biogeochemical cycles [36]. Masson pine (Pinus massoniana Lamb.) is mostly in decline during the forest succession process [37]; there are, thus, many downed logs and fragments of Masson pine in a mixed forest. However, vast studies have focused on the effects of leaves and fine roots on soil microbial composition and function, whereas there is little information on the effects of DWD decomposition on belowground microbial communities [8,38,39], especially throughout the entire decay process [10,13]. By tracking the effects of different decay stages of DWD on microbial community dynamics at two soil depths and linking the adaptability of microbial communities to soil properties [21], we attempted to provide new insights into forest soil systems. Given the decay and leaching processes of downed logs, we hypothesize that (1) the effect of DWD on the size and composition of the soil microbial community will increase with the decay stage, and the influence of DWD on soil microorganisms at 0–10 cm soil depth is greater than that at a 10–20 cm soil depth. In addition, previous studies have shown that downed logs generally increase soil C and nutrients [10,14], as well as decrease soil pH [23,24]. Therefore, we also hypothesize that (2) DWD decomposition will lead to the transformation of the soil microbial community to one that prefers eutrophication and is more acid-tolerant, such as an increased relative abundance of fungi and decreased relative abundance of GP. This is because fungi are not only more adaptable to acidic environments [27] but the accumulation of SOC may increase F/B [40], while GP bacteria prefer low-nutrient environments [21,41]. Based on the above hypotheses, our objective is to explore the variations in soil microbial biomass and community composition at both soil depths during the decay process of DWD and to determine the factors that regulate the responses of microbial communities to DWD decay.

2. Materials and Methods
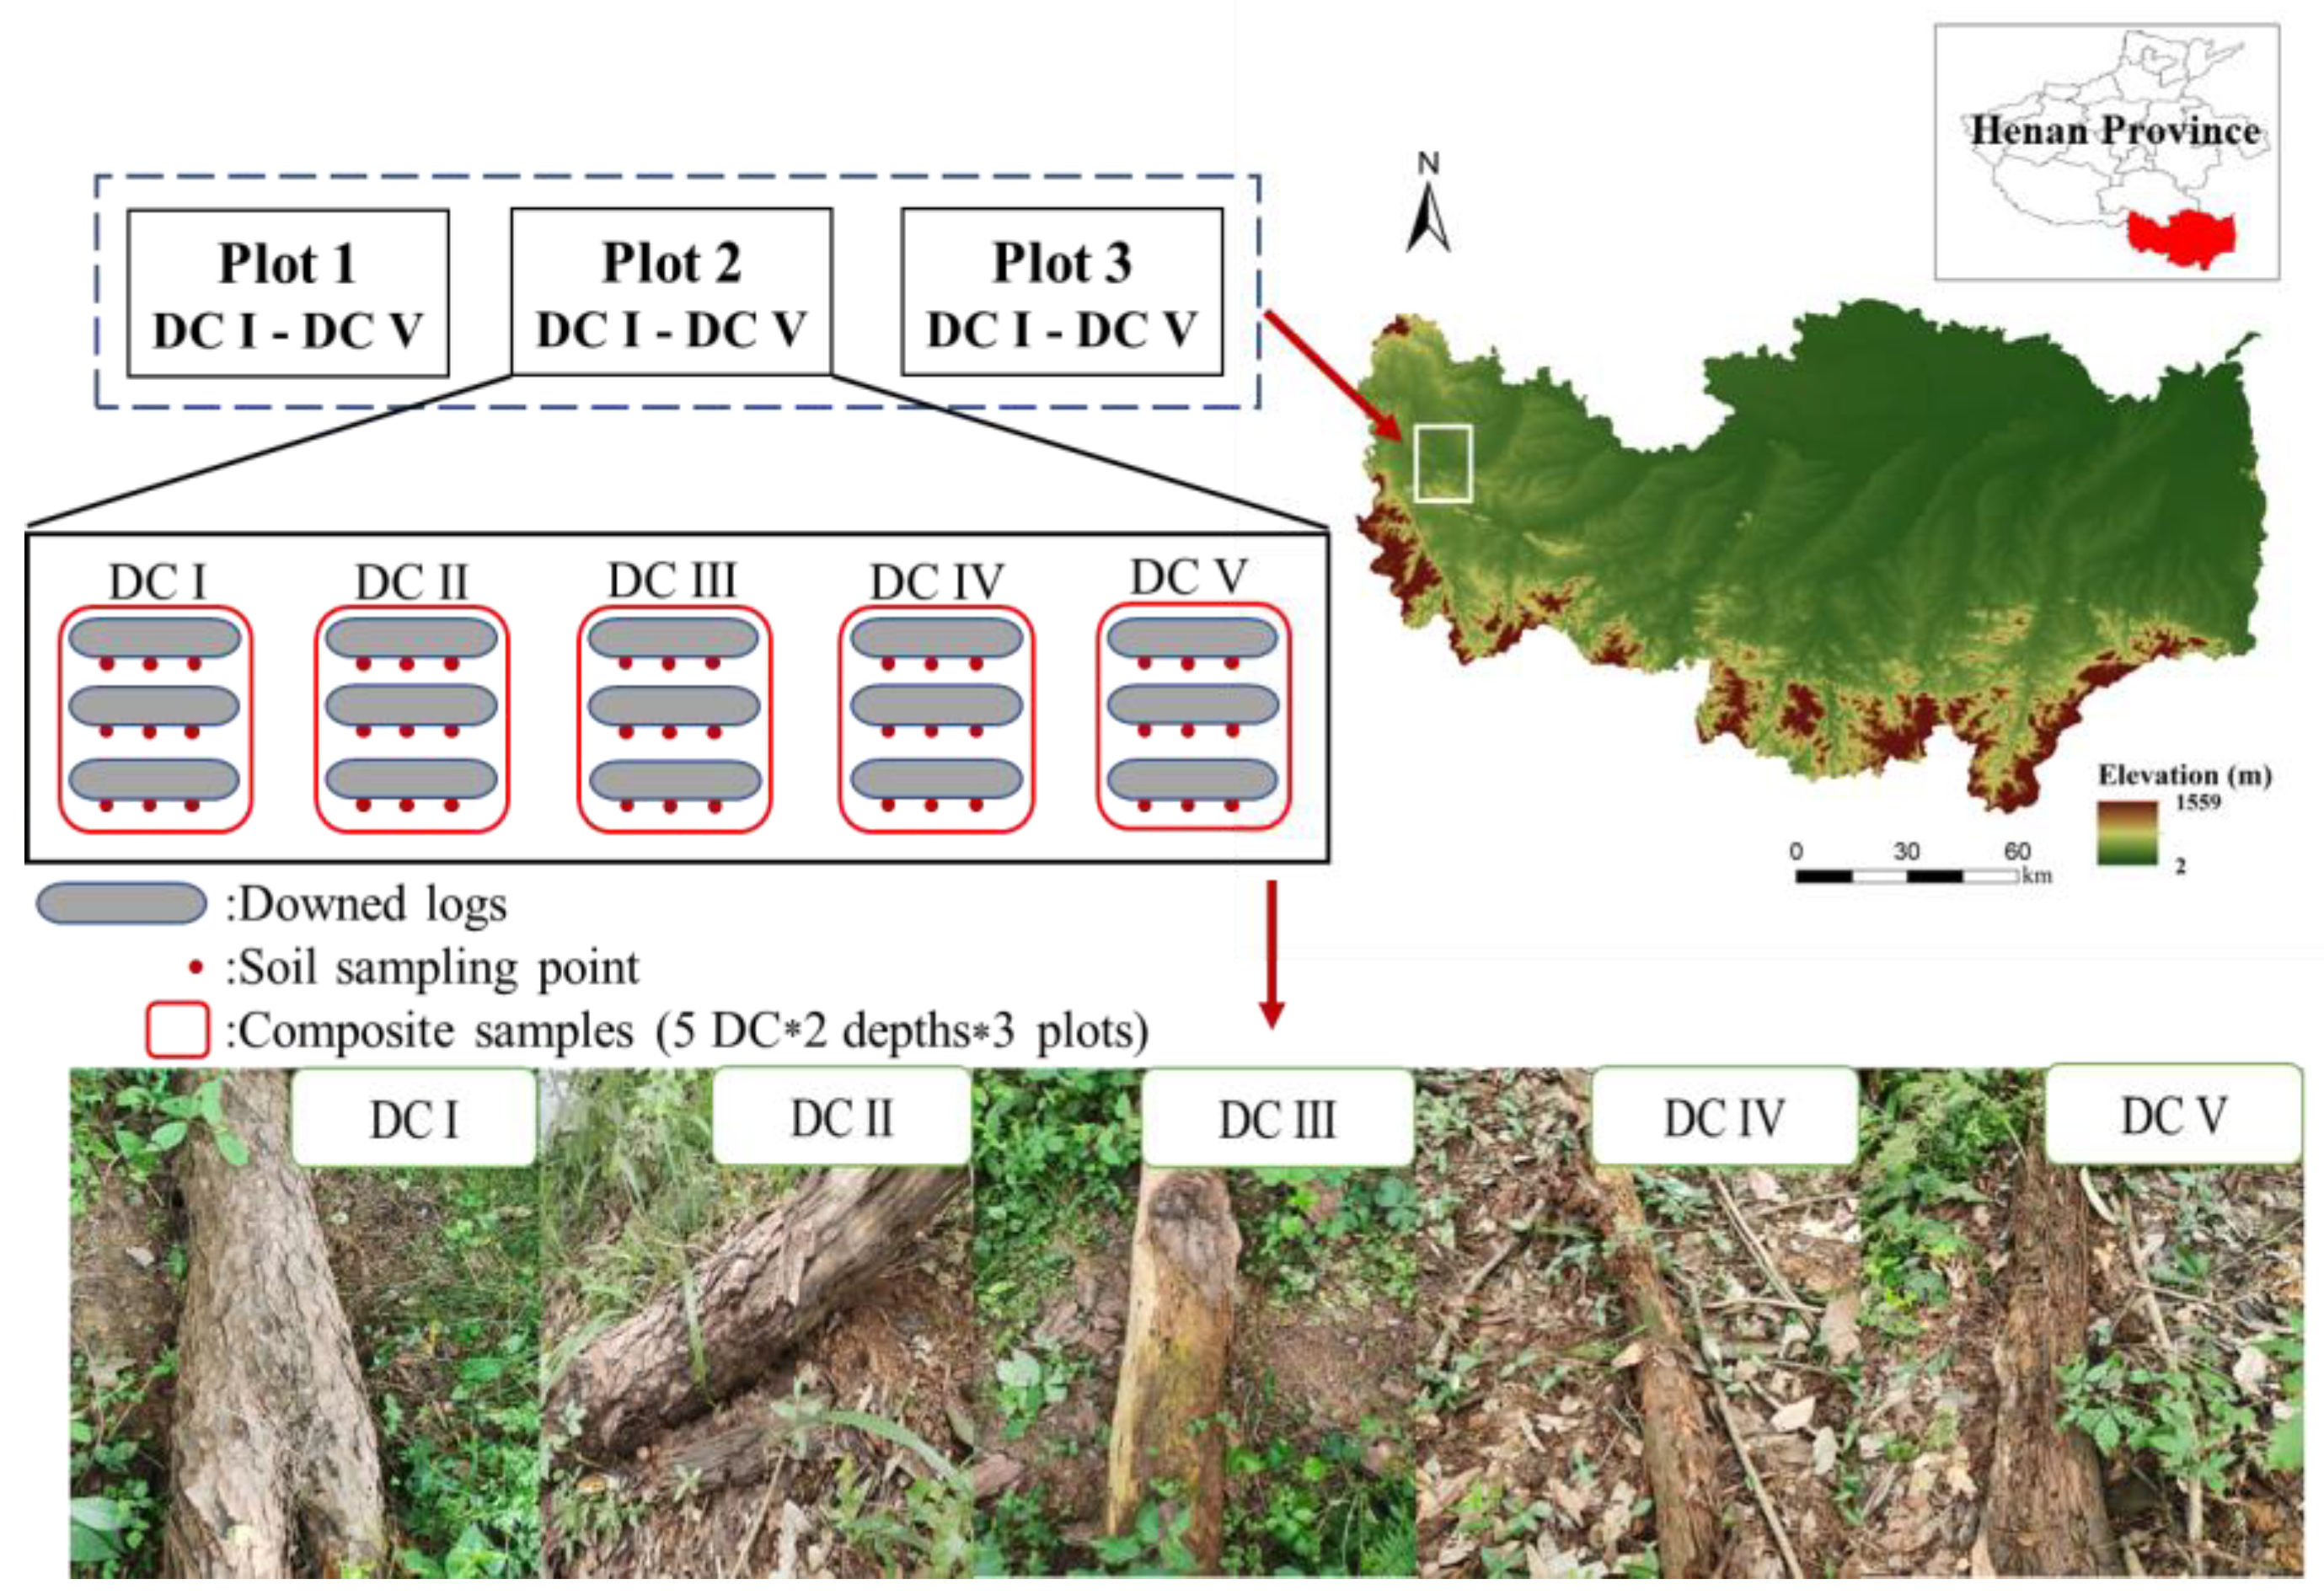
2.1. Study Area

The research area was located at Mountain Xian National Nature Reserve (32°06′–32°12′ N, 114°01′–114°05′ E, 188 m a.s.l.), Henan, China (Figure 1). Mean annual temperature and precipitation are 15.2 °C and 1063 mm, respectively. The parent material is granite bedrock, and the soil is classified as Haplic Luvisol according to FAO classification or yellow–brown soil (Chinese classification). This mixed forest’s canopy species are composed of Masson pine and German oak (Quercus acutissima Carruth.). Woody shrubs include Trachelospermum jasminoides (Lindl.) Lem., Vitex negundo L., and Lindera glauca (Sieb.et Zucc.) BI. The dominant herb species include Lygodium japonicum (Thunb.) Sw., and perennial grass Carex rigescens (Franch.). More details are provided by Hu et al. [36].

2.2. Experimental Design and Soil Collection

In July 2021, we observed many downed logs in the area during our forestry investigation, and the downed logs were mainly Masson pine. Three sample plots (150 m × 150 m) were randomly established on the southern slope of Mountain Xian (Figure 1), and the elevation, understory vegetation, slope, and aspect of these plots were similar (Table S1). The distance between any two adjacent plots was at least 100 m.
The DWD in this study was defined as downed logs (minimum diameter ≥ 10 cm) lying on the ground. The species of downed logs with severe decay were determined by experienced forest technicians. We measured the length and diameter of each downed log and then adopted the method of space-for-time substitution to determine the decay stage of different downed logs based on how deep the knife blade penetrated the downed logs. The DWD was classified into five decay stages according to the empirical criteria of Rouvinen et al. [42], and the five decay classes were as follows: DC I, cambium is still fresh; DC Ⅱ, cambium is decayed, and the knife blade penetrates the stem by several millimeters; DC Ⅲ, the knife blade penetrates the stem less than 2 cm; DC Ⅳ, the knife blade penetrates stem 2–5 cm; and DC V, the knife blade penetrates the entire stem. In each plot, we selected three downed logs at each decay stage; thus, 45 logs (3 samples × 5 decay stages × 3 plots) were sampled.
Soil samples were collected from the area where the downed logs and the ground make contact (away from the roots). The downed logs were carefully removed; then, soil cores at two soil depths (0–10 cm and 10–20 cm) were collected using a soil core sampler (10 cm depth with diameter of 5 cm). In each plot, three soil cores were collected under each downed log; then, the cores of three downed logs at the same decay stage were mixed into a composite sample by soil depth (Figure 1). Therefore, three composite samples (n = 3; one replicate for each plot) were collected at different soil depths for each decay stage. After removing stones and fine roots with a sieve (2 mm), each soil sample was divided into two subsamples: (1) for analysis of soil-available N (NH4+-N, NO3-N) and phospholipid fatty acids (PLFAs) (stored at −20 °C); (2) for analysis of soil organic C (SOC), total N (TN), available P, and pH (naturally air-dried).

2.3. Laboratory Analysis

Soil pH at a deionized water/air-dried soil ratio of 2.5:1 was measured using a pH meter (PB-10, Sartorius, Göttingen, Germany). The contents of SOC and TN were determined by a CN elemental analyzer (elementar vario Macro, Elementar Co., Langenselbold, Germany). The soil-available P content was measured using an ultraviolet spectrophotometer (UV-1900, Daojin, Kyoto, Japan) after extraction with a 0.03 M NH4F (Hushi)/0.025 M HCl (Hushi) solution. Soil-available N was extracted from fresh soil with 2 M KCl (Hushi) and determined using an automated discrete analyzer (SmartChem 200, AMS-Alliance, Guidonia, Italy).
Analysis of PLFAs was performed to analyze soil microbial community composition [43,44]. Briefly, PLFA extracts were obtained from a fresh soil sample using a chloroform–methanol–phosphate (Sigma-Aldrich, St. Louis, MO, USA) mixture (volume ratio 1:2:0.8), and measurements were conducted using a gas chromatograph (GC6890, Agilent Technologies, Bracknell, UK). The PLFAs were assigned to six microbial guilds (Table S2), which corresponded to different functional groups of microorganisms. Bacterial PLFAs were the sum of the PLFAs of gram-positive (GP), gram-negative (GN), and general bacteria (GB), and total PLFAs were the sum of the PLFAs of bacteria, fungi, arbuscular mycorrhizal fungi (AMF), and actinomycetes. To assess the response of microorganisms to environmental conditions, we calculated a ratio (cy/pre, Table S2) as an indicator of microbial physiological stress [45].

2.4. Statistical Analysis

Shapiro–Wilks test was used to confirm the normality of all data; finally, none of them were transformed, as all variables followed the normal distribution. Two-way analysis of variance (ANOVA) was conducted to examine the effects of decay stage of DWD, soil depth, and their interactions on response variables (soil chemical properties, PLFAs, and physiological stress indicator (cy/pre)) using SAS (V.9.0, SAS Institute, Cary, NC, USA). One-way ANOVA with Tukey’s honest significant difference (HSD) was then conducted to analyze differences in variables among decay stages of DWD at the same soil depth. Principal component analysis (PCA) and permutation multivariate analysis of variance (PERMANOVA) with the vegan package in R (V.3.5.3, http://www.Rproject.org accessed on 1 March 2022) were used to examine variations in the microbial community among decay stages and soil depths. We calculated the co-occurrence network by using the fdrtool package in R (V.3.5.3) [46] and used Gephi (V.0.9.2) to build and visualize the network structure. The correlations between soil PLFAs and chemical properties were determined by Pearson’s correlation and redundancy analysis (RDA) in R (V.3.5.3). Subsequently, forward selection of explanatory variables was performed in the RDA, and the most significant explanatory variables (p < 0.05) for microbial community composition were determined using permutation tests (999 permutations). Stepwise multiple regression analysis was performed using SAS (V.9.0) to determine which factors were associated with changes in soil microbial PLFAs.

3. Results

3.1. Soil Properties

The soil pH, SOC, TN, NO3-N, NH4+-N, and available P varied with the decay stage of DWD and soil depth (p < 0.05, Table S3). In general, soil pH decreased significantly as the decay stage advanced, and the lowest pH was observed in stage Ⅳ at both soil depths (Table 1). SOC increased with the decay stage at both soil depths, and SOC was 86.4% and 81.6% higher at 0–10 cm and 10–20 cm soil depth in stage V than in stage I, respectively. Soil TN and NO3-N increased with decomposition time at 0–10 cm soil depth but did not change at 10–20 cm soil depth. Additionally, soil NH4+-N and available P peaked in stage Ⅳ and Ⅲ at both soil depths, respectively. The concentrations of SOC, TN, NO3-N, NH4+-N, and available P tended to be higher at the 0–10 cm soil layer than at 10–20 cm.

3.2. Soil Microbial Biomass and Community Composition

Soil total PLFAs at both soil depths increased with the decay stage of DWD and peaked in stage V (p < 0.05, Figure 2a and Table S4). Soil total PLFAs were 14.51 and 11.49 nmol g−1 dry soil higher in stage V than in stage I at both soil depths, respectively. In addition, total PLFAs were greater at 0–10 cm soil depth than at 10–20 cm.
The effects of DWD on the relative abundances of microbial guilds varied with the decay stage, except for bacteria and GB (all p < 0.05, Table S4). In the 0–10 cm soil layer, the relative abundance of fungi and F/B ratios continued to increase with time since decay, and they were 28.2% and 29.3% higher in stage Ⅴ than in stage Ⅰ, respectively (Figure 2c,i). However, the relative abundance of GP, GP/GN ratios, and stress indicator cy/pre ratios decreased with the decomposition time (Figure 2e,j,k). In addition, the relative abundance of AMF was lower in stages Ⅲ–V (Figure 2g). In 10–20 cm soil depth, GP/GN ratios decreased with the decay stage of DWD (Figure 2j). Moreover, the relative abundance of bacteria did not change with the decomposition time at both soil depths (Figure 2b).

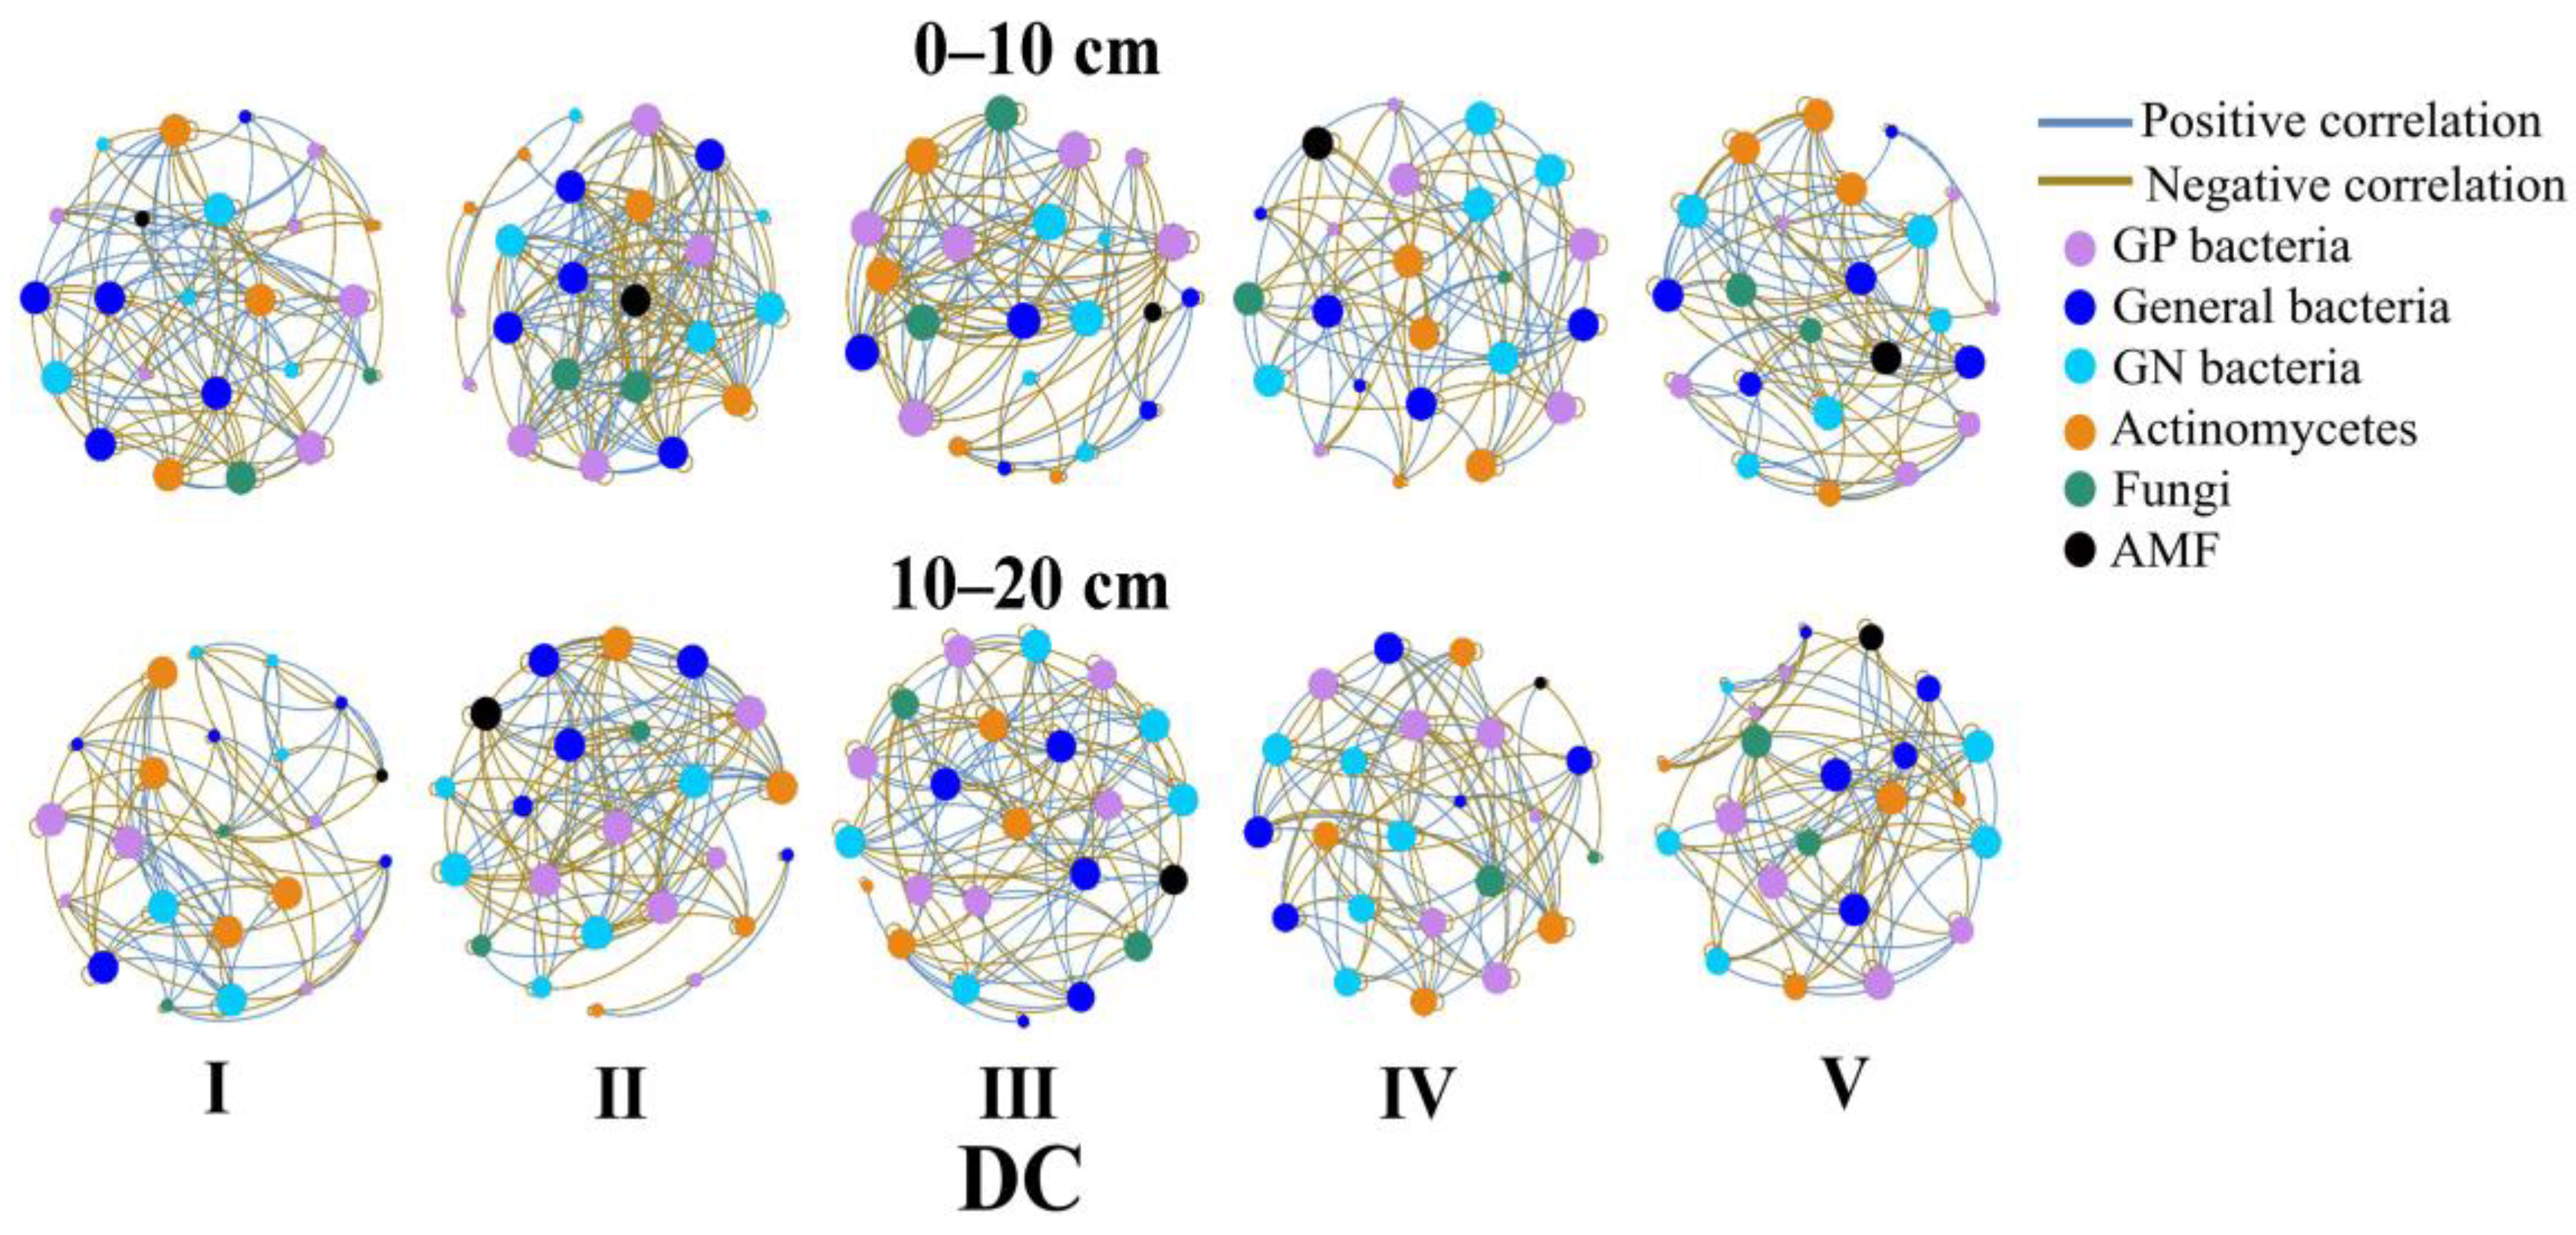
3.3. Soil Microbial Network Analysis

Based on the principal component analysis, axes 1 and 2 accounted for 49.9% and 20.9% of the variance, respectively (Figure 3). We observed variations in soil microbial community composition at different stages of decay (Figure 3a) and between the two soil depths (Figure 3b). Then, in combination with the PERMANOVA test, we further revealed significant differences in microbial community composition across decay stages (0–10 cm, R2 = 0.54, p < 0.01; 10–20 cm, R2 = 0.47, p < 0.05, Table S5) and soil depths (R2 = 0.24, p < 0.001, Table S5).
The complexity of the microbial networks at 0–10 cm soil depth was highest in stage Ⅱ and, subsequently, decreased with the decomposition stage. For example, the microbial networks had the highest average degree (14.35) in stage Ⅱ, and the average degrees in stage Ⅰ, Ⅲ, Ⅳ, and Ⅴ were 9.91, 10.61, 8.70, and 9.74, respectively. The complexity of microbial networks at the 10–20 cm soil layer changed little with the decomposition time (Figure 4 and Table S6).

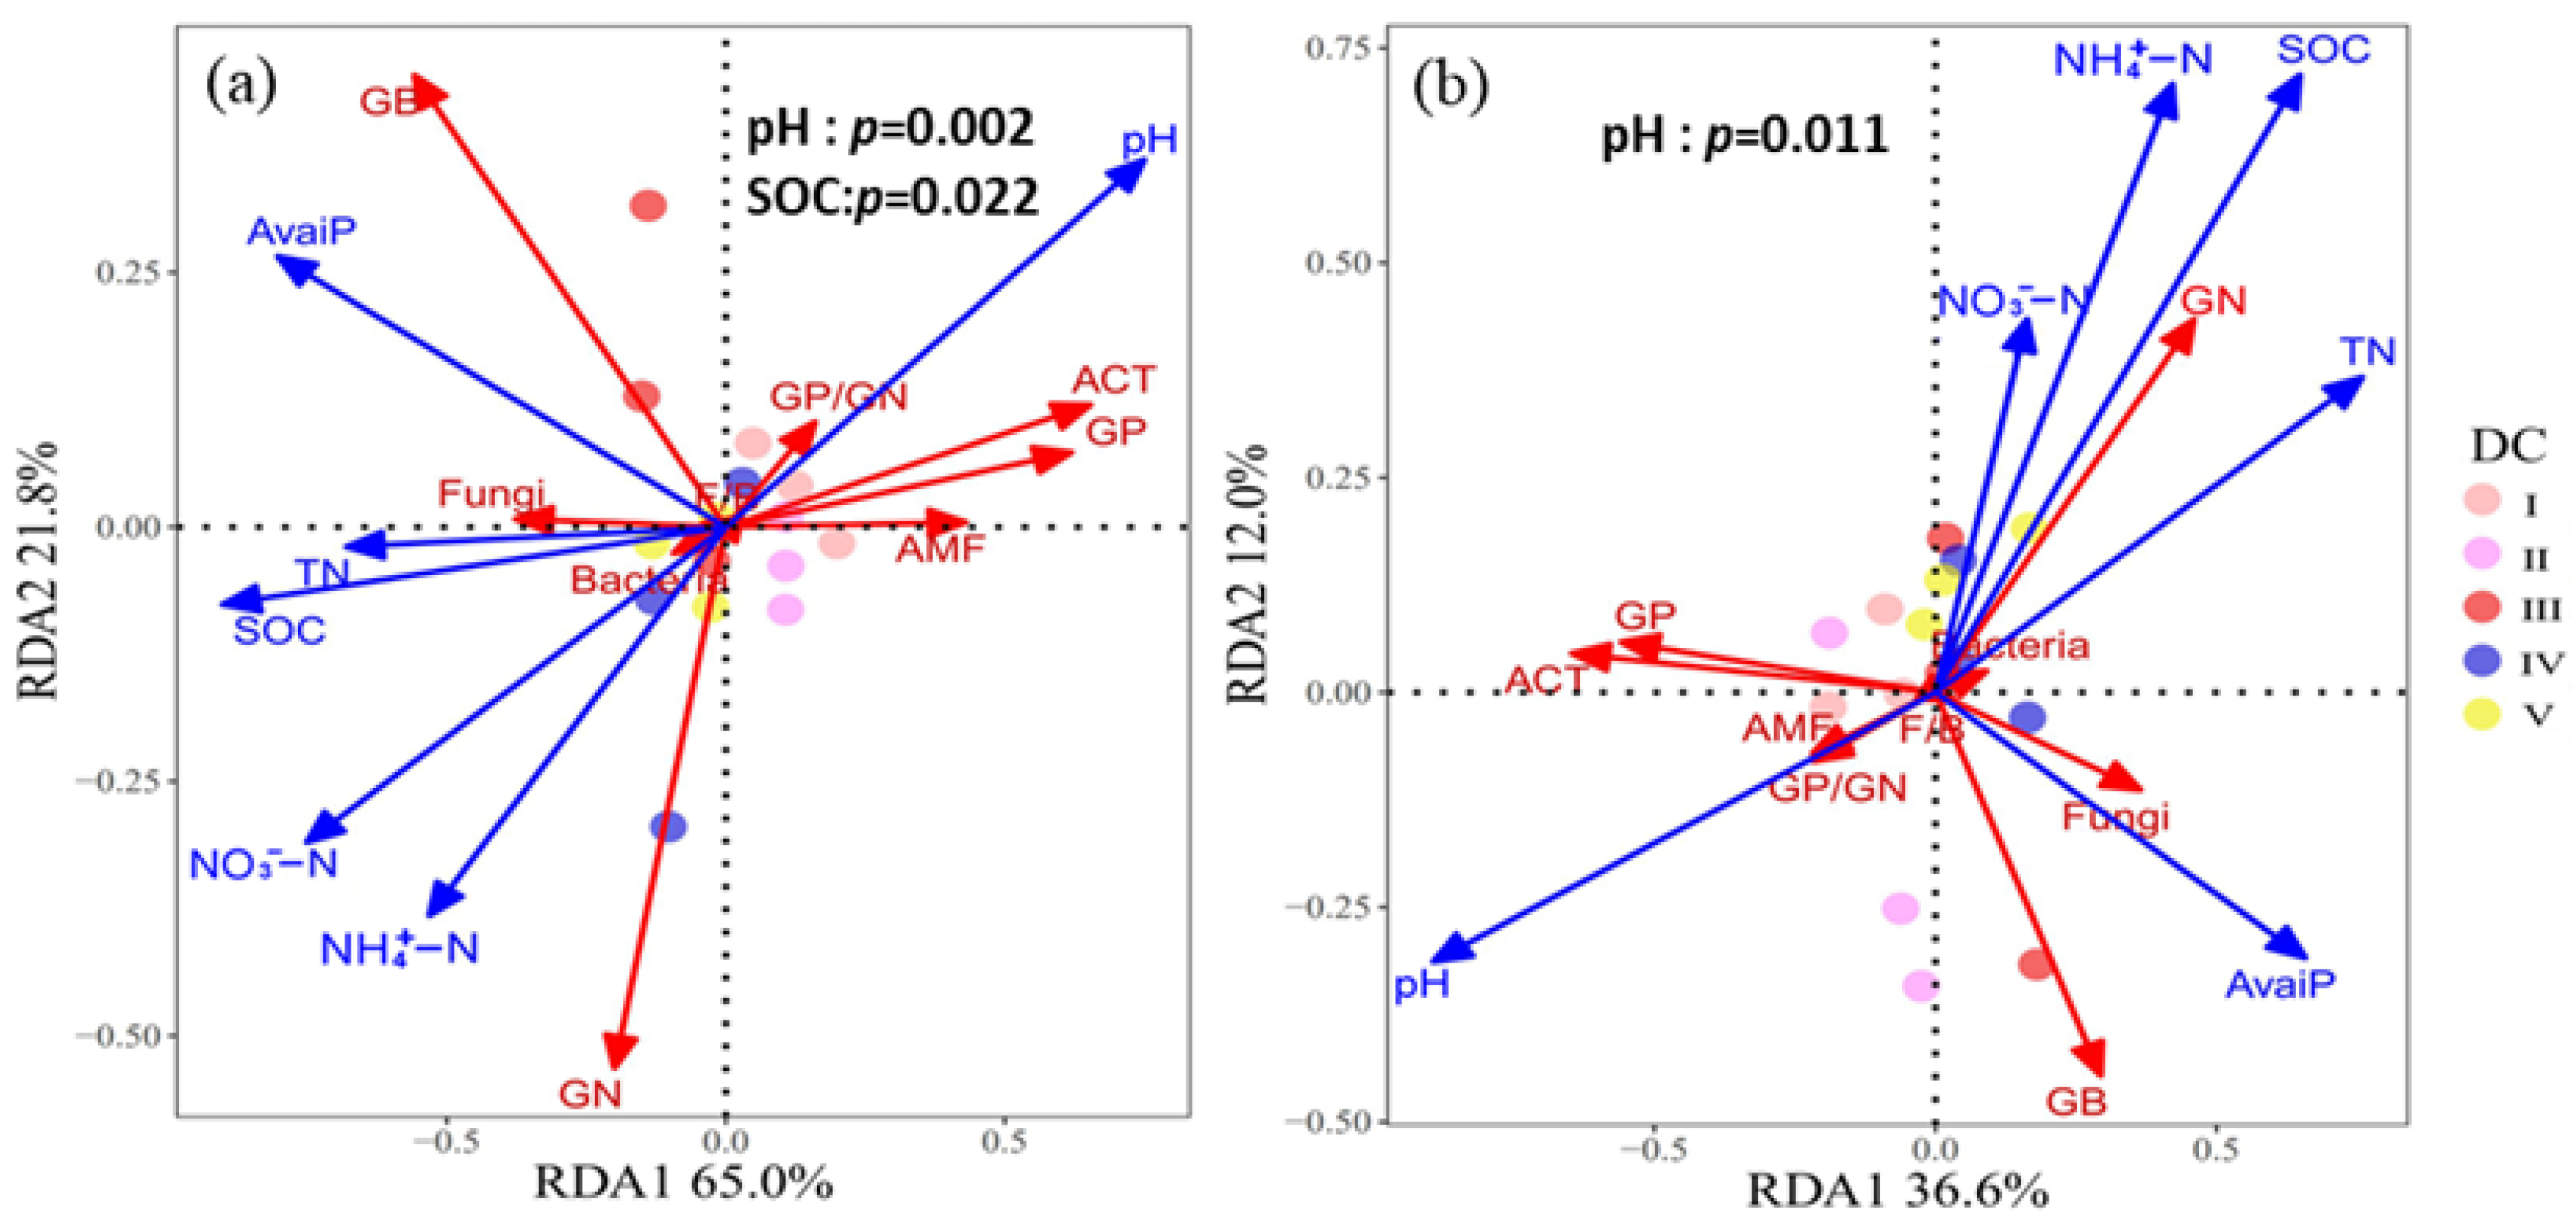
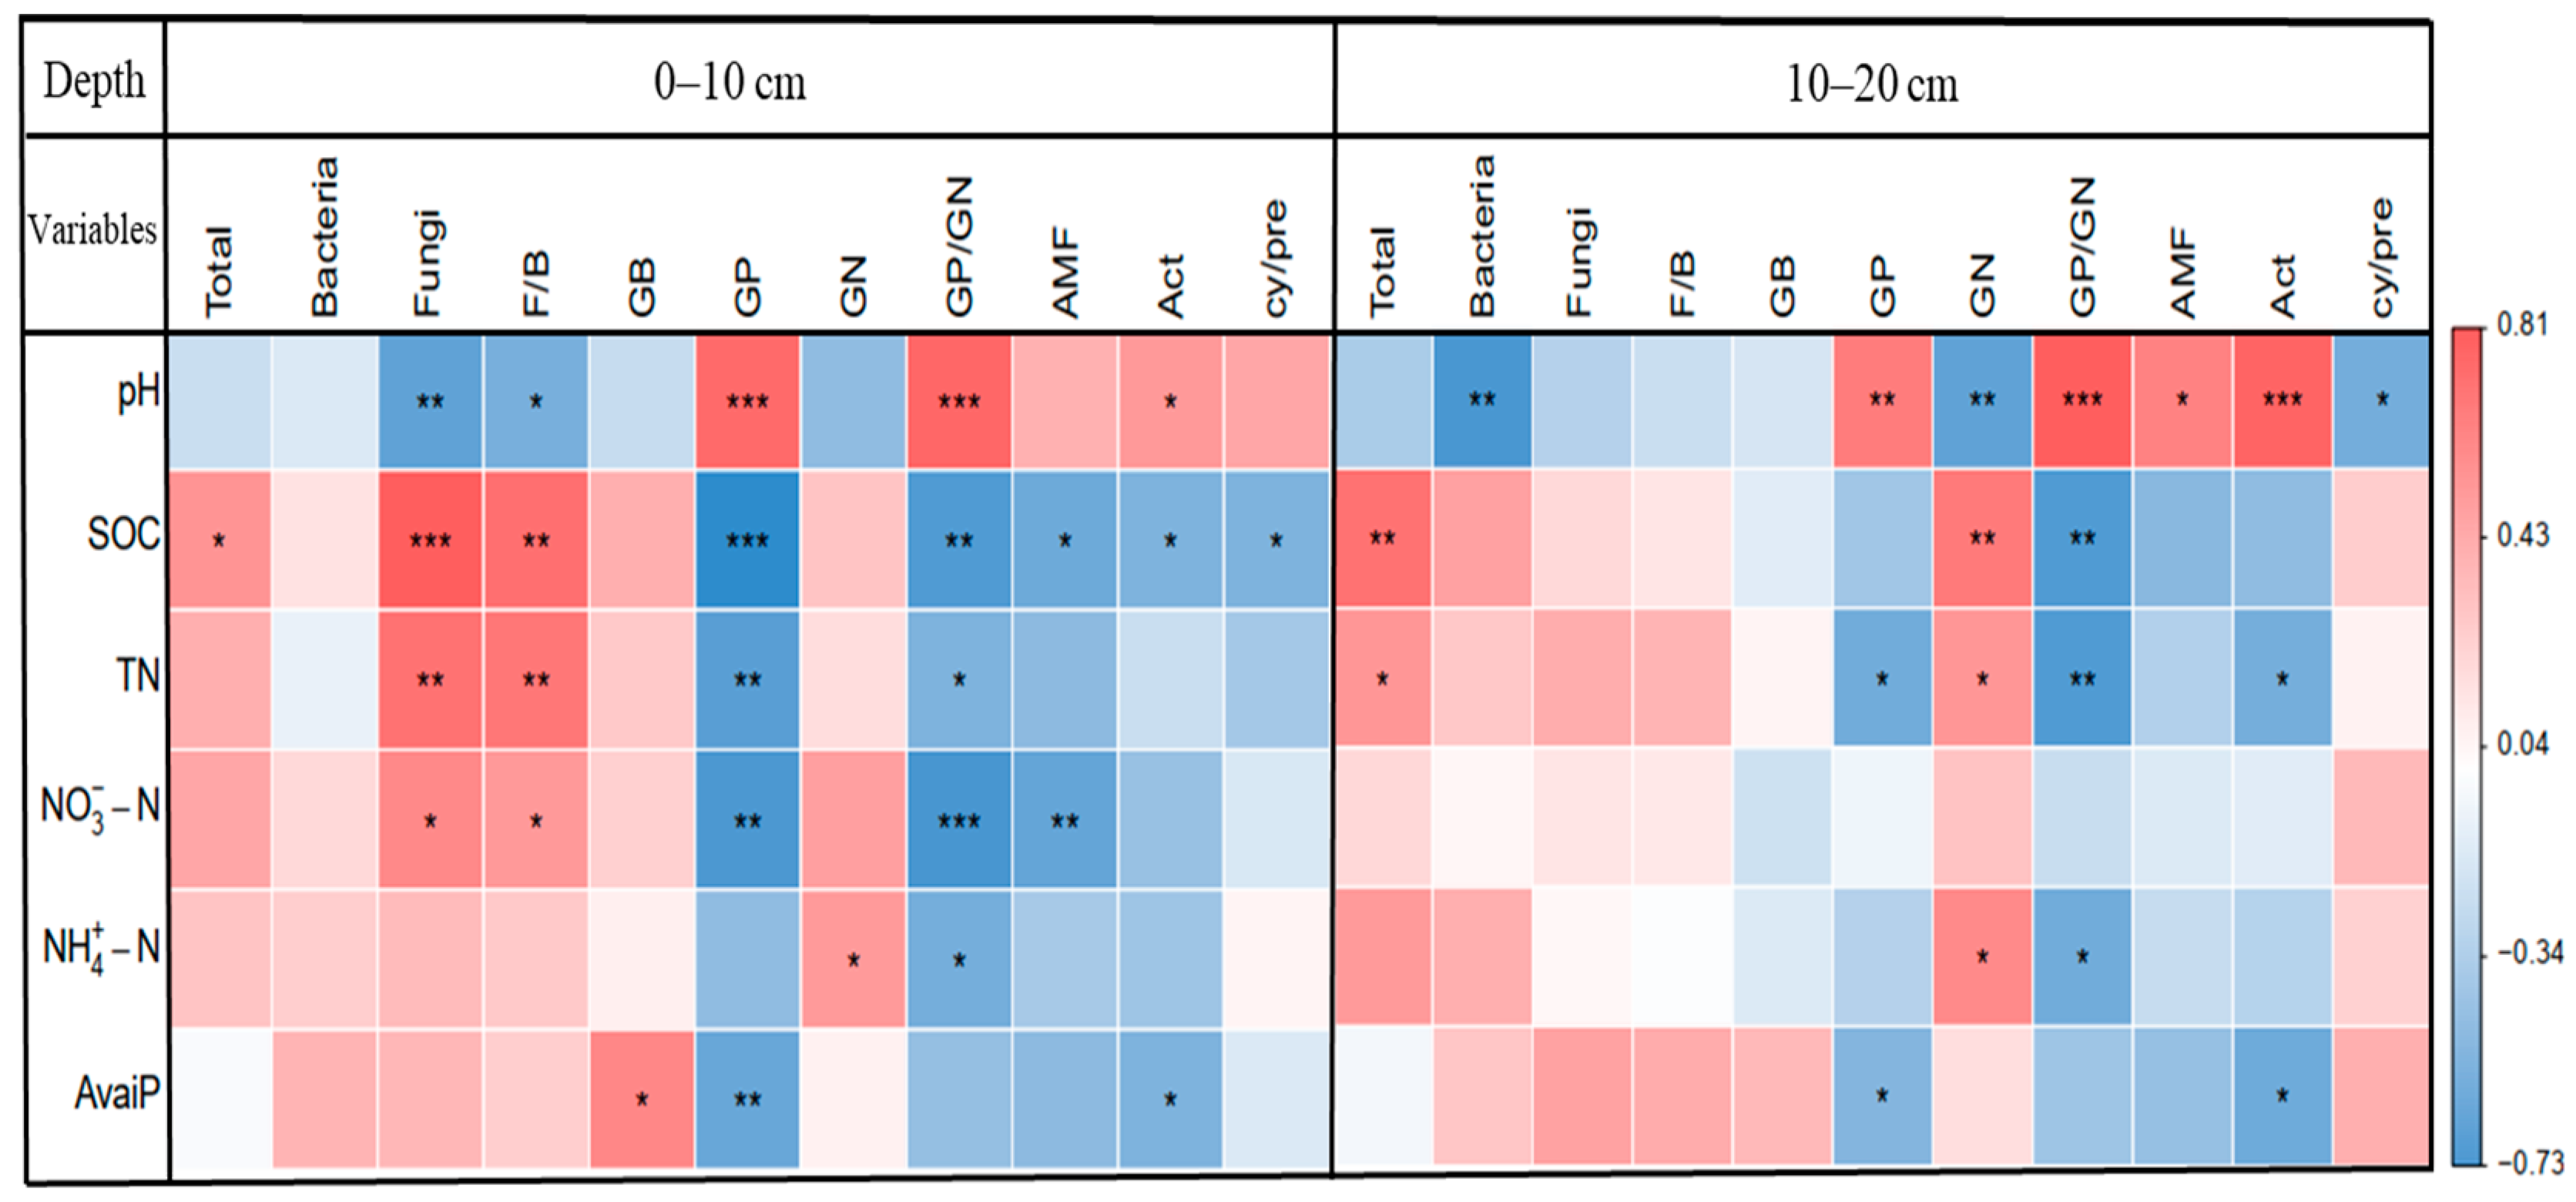
3.4. Factors Affecting the Soil Microbial Community

RDA analyses showed that axes 1 and 2 captured 65.0% and 21.8% of the variance in microbial community composition, respectively, at 0–10 cm soil depth (Figure 5a). Permutation tests revealed that pH (p < 0.01) and SOC (p < 0.05) significantly influenced variation in microbial community composition (Table S7). In the 10–20 cm soil layer, soil properties explained 48.6% of the variance in microbial community composition (Figure 5b), and soil pH (p < 0.05) had significant effects on changes in microbial composition (Table S7).
In the 0–10 cm soil layer, stepwise multiple regression analysis (Table 2) revealed that soil pH (partial R2 = 0.625) explained 62.5% of the variation in GP/GN ratios, and SOC was the major factor affecting the relative abundance of fungi (partial R2 = 0.716), GP (partial R2 = 0.703), actinomycetes (partial R2 = 0.321), and F/B ratios (partial R2 = 0.575). The relative abundance of GB and GN was mainly affected by soil-available P (partial R2 = 0.399) and NH4+-N (partial R2 = 0.278), respectively, and NO3-N (partial R2 = 0.435) explained 43.5% of the variation in the relative abundance of AMF. Additionally, SOC (partial R2 = 0.325) and NH4+-N (partial R2 = 0.215) contributed to 54.0% of the variation in cy/pre ratios. In the 10–20 cm soil layer, soil pH contributed to most of the variation in the relative abundance of GP (partial R2 = 0.444), actinomycetes (partial R2 = 0.599), GP/GN ratios (partial R2 = 0.661), and cy/pre (partial R2 = 0.345), and SOC (partial R2 = 0.446) explained 44.6% of the variation in the relative abundance of GN.
Pearson’s correlation analysis revealed that the relative abundance of fungi and F/B ratios were negatively correlated with soil pH (both p < 0.05) and positively correlated with SOC (both p < 0.01) at 0–10 cm soil depth (Figure 6). The relative abundance of GN was negatively correlated with pH (p < 0.01) and positively correlated with SOC (p < 0.01) at 10–20 cm soil depth. The relative abundance of GP and GP/GN ratios were correlated positively with soil pH (both p < 0.001) and correlated negatively with SOC (both p < 0.01) at both soil depths. Soil total PLFAs were positively correlated with SOC at both soil depths (p < 0.05). Additionally, the cy/pre ratios were negatively correlated with SOC at a soil depth of 0–10 cm and negatively correlated with pH at 10–20 cm (all p < 0.05).

4. Discussion

4.1. Effects of DWD on Soil Microbial Biomass and Composition

The decay of DWD drives changes in soil microbial growth and community composition [8]. As hypothesized, our work shows that soil microbial biomass increased along a decay stage in mixed broadleaf–conifer forests. This was consistent with reports by Moghimian et al. [9] and Minnich et al. [47], who also observed stimulations of microbial biomass in broad-leaf forests and mixed coniferous forests, suggesting that the positive effects of DWD decomposition on soil microbial community are prevalent in different forest types. In addition, the increase in soil F/B ratios after the decomposition of DWD was consistent with the findings of Brant et al. [18] but different from the results of Perreault et al. [10], in which soil F/B ratios did not change significantly over the decomposition time. These independent results may vary depending on the decay stage, species of the tree log, and soil type [47,48].
The extent of DWD decay may help explain the changes we observed in soil microbial communities during the decomposition of DWD. In addition to increasing soil organic matter (SOM) and nutrients through leaching [14,49], DWD improves soil fertility via increasing the residues of detritivores and microbial decomposers [50], thus altering microbial nutrient utilization strategies [9,10]. SOM and nutrient availability increase with the decay stage of DWD, especially C accumulation [30,51]; the late decay stages of DWD, thus, may have a greater impact on microbial growth and community composition [9,13]. Consistent with our first hypothesis, our data showed that compared with decay stage Ⅰ, the GP/GN ratios and physiological stress indicators decreased significantly in decay stages Ⅳ–Ⅴ and stage Ⅴ, respectively, while the total PLFAs increased with decay stage to a certain extent (Figure 2), indicating that the soil nutrient environment improved with the decomposition time [41,52]. Indeed, we observed higher concentrations of SOC, TN, and NO3-N in the late decay stages (Table 1). In addition, DWD releases acidic organic matter into the soil [53] or increases the exchange of aluminum in soil [23], thereby reducing soil pH. The increase in soil acidity generally occurs in the early decay stages [9,23], which may explain the increase in the relative abundance of fungi adapted to the acidic environment [27] in decay stage Ⅲ (Figure 2c). The complexity of soil microbial networks was highest in stage Ⅱ, which may be related to the rapid increase in SOM [54,55]. However, with the further increase in SOC and nutrients, the complexity of microbial networks decreased in the late stages of decomposition. Our results are similar to those that suggest higher litter decomposition efficiency in soil promotes the microbial formation of less complex but more specialized networks [20], suggesting that microbes are biased toward “simple efficiency” when they break down and use nutrients more efficiently. Additionally, the connections and interactions among soil microbes are also affected by precipitation, temperature, and soil management activities [55], which complicate the inference of the complexity of microbial networks.
Changes in the soil microbial community at different decay stages of DWD may vary with the species of the tree log. Previous studies have shown that deciduous tree species may give rise to the rapid growth of soil microorganisms in the early decay stages, and soil microbial biomass continues to increase with decomposition [9]. However, we observed that total PLFAs remained stable in decay stages I–Ⅳ and increased in stage V (compared with stage Ⅰ). Compared with broad-leaved trees, conifers have a higher content of cellulose, lignin, and other substances that are difficult to decompose [47]; they, thus, require more extended periods to decompose. In addition, the wood of conifers contains toxic substances that may inhibit the growth and reproduction of soil organisms in the early decay stages [8]. Furthermore, we found that soil F/B ratios increased with the decay stage of DWD. This finding is consistent with the results of a previous study examining the decomposition of coniferous tree species [18], but no increase in soil F/B was observed during the decomposition of deciduous tree species [10], indicating that coniferous tree species may be more conducive to increasing fungi in the soil. This may be due to the fact that more difficult-to-decompose substances in conifers promote the growth of fungi relative to bacteria [18,47].

4.2. Controlling Factors of Soil Microbial Community Response to DWD

In line with our second hypothesis, soil pH and SOC played significant roles in structuring soil microbial community composition (Figure 5, Table 2 and Table S6). Specifically, the GP/GN ratios were closely correlated with soil pH at two soil depths, and the relative abundance of GP was strongly linked with soil pH at 10–20 cm soil depth (Table 2). The decrease in soil pH reduces the relative abundance of GP and GP/GN ratios (Figure 6), which can be attributed to the fact that GP bacteria tend to be adapted to neutral conditions [56], whereas GN bacteria are less sensitive to pH reduction [57,58]. The negative correlation between the F/B ratios and soil pH (Figure 6) may stem from the fact that fungi are better adapted to acidic environments than some bacteria (e.g., GP bacteria) [27,56]. In addition, the relative abundance of AMF and actinomycetes was closely associated with soil pH at 10–20 cm soil depth (Table 2). The relative abundance of AMF and actinomycetes was strongly positively correlated with soil pH (Figure 6), indicating that decreases in soil pH are not conducive to the growth of AMF and actinomycetes, which tend to grow best at neutral pH [59,60]. These results suggest that the different adaptations of microbial taxa to the increase in soil acidity caused by DWD drive the variation in soil microbial community composition.
We identified that SOC had a strong explanatory effect on changes in fungi and F/B ratios (Table 2), and there was a significant positive correlation of SOC with fungi and F/B ratios (Figure 6). Decomposing organic matter is dominated by bacteria when SOM is readily decomposed [61], whereas SOM decomposition is dominated by fungi in soils with a high content of refractory organic matter [62]. In addition to the input of labile C into the soil, the decomposition of DWD provides more refractory organic matter, which may create plenty of suitable niches for fungi [18,63]. As the SOC content increases, fungal biomass increases more than bacterial biomass at 0–10 cm soil depth. This is manifested by an increase in the F/B ratios along the SOC gradient [40]. Additionally, we found that the relative abundance of GP and GN was closely related to SOC (Table 2). GP bacteria are generally oligotrophic (i.e., preference for low nutrients) [21,41]. In contrast, GN bacteria are generally copiotrophic (i.e., dominating under high nutrients) [28,64], and shifts from GP bacteria to GN bacteria are generally interpreted as the transition of soils from oligotrophic to eutrophic conditions [22,27]. In this study, the relative abundance of GP and SOC were significantly negatively correlated at 0–10 cm soil depth, while the relative abundance of GN and SOC was significantly positively correlated at 10–20 cm soil depth (Figure 6), indicating that the increase in SOC from DWD promoted the growth of GN and inhibited the growth of GP, which is consistent with our second hypothesis. Soil total PLFAs were significantly positively correlated with SOC (Figure 6), suggesting that organic C stimulated the growth of microorganisms, and the distribution of most microorganisms depended on the amount of organic matter [65,66]. Similarly, the increase in organic C provides the impetus for microbial functional activity and slows down the survival pressure of microorganisms, which explains the significant negative correlation between SOC and cy/pre ratios (Table 2 and Figure 6). These relationships indicate that the quality and quantity of SOC are important factors driving changes in soil microbial community composition.
The relative abundance of GB and GN bacteria was directly related to available P and NH4+-N, respectively, at 0–10 cm soil depth (Table 2). Studies state that available P is closely related to the size of the microbial population [67] and may increase soil microbial biomass and diversity [62], especially bacterial biomass [68]. Our study further verified that soil-available P can stimulate the growth of GB bacteria (Figure 6). In addition, GN bacteria are highly dependent on soil inorganic N [69], which explains the positive correlation between GN bacteria abundance and NH4+-N (Figure 6). However, we found that the relative abundance of AMF was significantly correlated negatively with NO3-N at the 0–10 cm soil layer (Figure 6). Part of the reason may be that AMFs are sensitive to the availability of soil N [70], and the increase in NO3-N by DWD may reduce the infection rate of plant roots. Similarly, Li et al. [71] reported that understory N addition reduced fine root biomass.

4.3. Effects of DWD Decay Vary with Soil Depth

Due to the difference in soil chemical characteristics between the two soil layers due to the DWD leaching process, the effect of the DWD decay stage on the microbial community at a soil depth of 0–10 cm was greater than that at 10–20 cm (Figure 2). It is foreseeable that the effect of DWD decomposition on soil chemical and biological properties decreases with increasing soil depth [72]. However, an interesting point in our study was that pH and SOC jointly affected the microbial community composition at a soil depth of 0–10 cm, whereas the microbial community composition at 10–20 cm was primarily driven by pH (Figure 5 and Table S7). A recent study on grassland restoration found that soil pH and organic C significantly control microbial life history traits [21]. Additionally, Siciliano et al. [63] suggested that soil pH determines the composition of the microorganisms in soil ecosystems, and fertility (SOC and nutrients) controls the abundance of different microbial guilds. Similar studies have shown that in soils with low organic C, microorganisms are more directly controlled by soil pH, and the effect of soil pH diminishes as organic C accumulates [40,62,73]. In our field experiments, the pH of the two soil depths decreased with the decomposition of DWD. However, DWD decomposition provided sufficient substrates in the surface soil for microbial metabolism, especially the accumulation of SOC, whereas the accumulation of organic C was less at the 10–20 cm soil layer. These findings indicate that the values for soil pH and SOC determine their dominant role in microbial community composition and abundance in particular environmental conditions.

4.4. Implications of DWD for Soil Function

Changes in soil function can be effectively evaluated long-term by soil microbial biomass, composition, and activity [74]. In this study, severely decayed DWD increased soil microbial biomass to some extent. Microbial C accounts for 0.3%–7% of SOC and plays a strong part in the soil-stable C pool [75]. Previous studies have shown that approximately one-third of the wood mass is eventually converted to fungal biomass [76], suggesting that a portion of the C in DWD is incorporated into microbial biomass. Similarly, we found that the decomposition of DWD increased the soil F/B ratios, which would be beneficial to the stability of the soil C pool to some extent. This can be attributed to the fact that fungal residues are more persistent in the soil than bacterial residues, and fungi contribute more to SOC [28]. Additionally, leached DOM and decomposed residues from DWD can be converted into complex compounds by microorganisms. These compounds are adsorbed on mineral soils, reducing enzyme accessibility and, thus, increasing the stable C pool in forest soils [30].
A recent study suggested that a reduction in environmental stress may enhance the stability of ecosystem services provided by the soil microbial community [54]. Our field experiments found that downed logs decomposition can improve the soil nutrient environment and reduce the physiological stress of soil microorganisms. Improvements in the soil environment may be accompanied by an increase in heterotrophic activities and the acceleration of organic turnover [10]. Gonzalez-Polo et al. [13] and Khan et al. [24] confirmed to some extent that soil microbial activity and nutrient cycling were enhanced under DWD decay. Notably, soil acidification may increase microbial stress [45]. Indeed, we found a significant negative correlation between cy/pre and soil pH at a depth of 10–20 cm (Figure 6); however, we did not observe an increase in cy/pre. In addition, combined with the increase in total PLFAs, we could infer that the increased soil acidity due to DWD did not place excessive environmental pressure on microorganisms. An important reason may be that the SOM and nutrients released by DWD improve the living environment of soil microorganisms. Overall, DWD decay may tend to favor soil nutrient condition, C accumulation, and microbial characteristics, contributing to the sustainability of forest soil function [77].

5. Conclusions

In summary, our results provide new insights into variations in soil microbial community composition and size throughout the decomposition process of downed logs of Masson pine. The effect of DWD decomposition on the soil microbial community depends on the decay stage and soil depth. The soil microbial community showed a trend of increasing fungi and decreasing GP bacteria with the decay stage of DWD, highlighting the control effect of soil pH and organic C on microbial community composition. We also found that the reduction in cy/pre ratios is mainly driven by SOC, and SOC increased microbial biomass. These results provide a fundamental understanding of the response of the soil environment to the entire process of DWD decay and, importantly, identify significant predictors that drive microbial community changes during this process. Future research on DWD decomposition should focus on more tree species, multiple decay stages, and a range of climatic zones to further assess the impact of downed logs on forest soil systems and to inform forest management decisions.

Supplementary Materials

The following supporting information can be downloaded at: https://www.mdpi.com/article/10.3390/f14050955/s1, Table S1: General description of the three plots; Table S2: The microbial PLFAs were grouped into six microbial guilds and one physiological stress ratio; Table S3: Two-way ANOVA statistics for effects of decay stage of DWD, soil depth, and their interactions on the soil chemical properties; Table S4: Two-way ANOVA statistics for effects of decay stage of DWD, soil depth, and their interactions on soil microbial PLFAs; Table S5: Statistical results of PERMANOVA testing variances in microbial community composition across decay stage and soil depth; Table S6: Basic parameters of co-occurrence networks across decay stage of DWD and soil depth; Table S7: The explanatory effects of environmental factors on soil microbial community composition derived from RDA.

Author Contributions

Conceptualization, L.L. and M.H.; methodology, M.H., L.L. and J.W.; software, L.L., X.X. and H.G.; validation, M.H., S.H. and L.L.; formal analysis, L.L. and J.W.; investigation, L.L., M.H. and X.Y.; data curation, L.L., M.H. and S.H.; writing—original draft preparation, L.L. and M.H.; writing—review and editing, M.H., X.X., Y.M. and W.W.; visualization, L.L., H.G. and J.W.; supervision, M.H. and S.H.; project administration, M.H. and S.H.; funding acquisition, S.H. All authors have read and agreed to the published version of the manuscript.

Funding

This work was supported by the Major Public Welfare Projects in Henan Province (201300311300) and the National Natural Science Foundation of China (32201362, 42107225).

Institutional Review Board Statement

Not applicable.

Informed Consent Statement

Not applicable.

Data Availability Statement

Research data are available on demand and can be requested from the authors.

Acknowledgments

We thank Hekai Song for his help in the field.

Conflicts of Interest

The authors declare no conflict of interest.

References

  1. Pan, Y.; Birdsey, R.A.; Fang, J.; Houghton, R.; Kauppi, P.E.; Kurz, W.A.; Phillips, O.L.; Shvidenko, A.; Lewis, S.L.; Canadell, J.G.; et al. A large and persistent carbon sink in the world’s forests. Science 2011, 333, 988–993. [Google Scholar] [CrossRef] [PubMed]
  2. Reichstein, M.; Bahn, M.; Ciais, P.; Frank, D.; Mahecha, M.D.; Seneviratne, S.I.; Zscheischler, J.; Beer, C.; Buchmann, N.; Frank, D.C.; et al. Climate extremes and the carbon cycle. Nature 2013, 500, 287–295. [Google Scholar] [CrossRef]
  3. Hu, Z.; Michaletz, S.T.; Johnson, D.J.; McDowell, N.G.; Huang, Z.; Zhou, X.; Xu, C. Traits drive global wood decomposition rates more than climate. Glob. Chang. Biol. 2018, 24, 5259–5269. [Google Scholar] [CrossRef]
  4. Jabin, M.; Mohr, D.; Kappes, H.; Topp, W. Influence of deadwood on density of soil macro-arthropods in a managed oakbeech forest. For. Ecol. Manag. 2004, 194, 61–69. [Google Scholar] [CrossRef]
  5. Creed, I.F.; Morrison, D.L.; Nicholas, N.S. Is coarse woody debris a net sink or source of nitrogen in the red spruce-Fraser fir forest of the southern Appalachians, USA? Can. J. For. Res. 2004, 34, 716–727. [Google Scholar] [CrossRef]
  6. Lassauce, A.; Paillet, Y.; Jactel, H.; Bouget, C. Deadwood as a surrogate for forest biodiversity: Meta-analysis of correlations between deadwood volume and species richness of saproxylic organisms. Ecol. Indic. 2011, 11, 1027–1039. [Google Scholar] [CrossRef]
  7. Perreault, L.; Forrester, J.A.; Mladenoff, D.J.; Lewandowski, T.E. Deadwood Reduces the Variation in Soil Microbial Communities Caused by Experimental Forest Gaps. Ecosystems 2021, 24, 1928–1943. [Google Scholar] [CrossRef]
  8. Magnússon, R.Í.; Tietema, A.; Cornelissen, J.H.C.; Hefting, M.M.; Kalbitz, K. Tamm Review: Sequestration of carbon from coarse woody debris in forest soils. For. Ecol. Manag. 2016, 377, 1–15. [Google Scholar] [CrossRef]
  9. Moghimian, N.; Jalali, S.G.; Kooch, Y.; Rey, A. Downed logs improve soil properties in old-growth temperate forests of Northern Iran. Pedosphere 2017, 30, 378–389. [Google Scholar] [CrossRef]
  10. Perreault, L.; Forrester, J.A.; Wurzburger, N.; Mladenoff, D.J. Emergent properties of downed woody debris in canopy gaps: A response of the soil ecosystem to manipulation of forest structure. Soil Biol. Biochem. 2020, 151, 108053. [Google Scholar] [CrossRef]
  11. Perron, T.; Kouakou, A.; Simon, C.; Mareschal, L.; Frederic, G.; Soumahoro, M.; Kouassi, D.; Rakotondrazafy, N.; Rapidel, B.; Laclau, J.P.; et al. Logging residues promote rapid restoration of soil health after clear-cutting of rubber plantations at two sites with contrasting soils in Africa. Sci. Total Environ. 2022, 816, 151526. [Google Scholar] [CrossRef]
  12. Shao, P.; Liang, C.; Rubert-Nason, K.; Li, X.; Xie, H.; Bao, X. Secondary successional forests undergo tightly-coupled changes in soil microbial community structure and soil organic matter. Soil Biol. Biochem. 2019, 128, 56–65. [Google Scholar] [CrossRef]
  13. Gonzalez-Polo, M.; Fernández-Souto, A.; Austin, A.T. Coarse woody debris stimulates soil enzymatic activity and litter decomposition in an Old-Growth temperate forest of Patagonia, Argentina. Ecosystems 2013, 16, 1025–1038. [Google Scholar] [CrossRef]
  14. Błońska, E.; Kacprzyk, M.; Spólnik, A. Effect of deadwood of different tree species in various stages of decomposition on biochemical soil properties and carbon storage. Ecol. Res. 2017, 32, 193–203. [Google Scholar] [CrossRef]
  15. Kwak, J.H.; Chang, S.; Naeth, M.A.; Schaaf, W. Coarse woody debris increases microbial community functional diversity but not enzyme activities in reclaimed oil sands soils. PLoS ONE 2015, 10, e0143857. [Google Scholar] [CrossRef]
  16. Persoh, D.; Borken, W. Impact of woody debris of different tree species on the microbial activity and community of an underlying organic horizon. Soil Biol. Biochem. 2017, 115, 516–525. [Google Scholar] [CrossRef]
  17. Lagomarsino, A.; De Meo, I.; Agnelli, A.E.; Paletto, A.; Mazza, G.; Bianchetto, E.; Pastorelli, R. Decomposition of black pine (Pinus nigra J. F. Arnold) deadwood and its impact on forest soil components. Sci. Total Environ. 2021, 754, 142039. [Google Scholar] [CrossRef]
  18. Brant, J.B.; Sulzman, E.W.; Myrold, D.D. Microbial community utilization of added carbon substrates in response to long-term carbon input manipulation. Soil Biol. Biochem. 2006, 38, 2219–2232. [Google Scholar] [CrossRef]
  19. Kaiser, C.; Franklin, O.; Dieckmann, U.; Richter, A. Microbial community dynamics alleviate stoichiometric constraints during litter decay. Ecol. Lett. 2014, 17, 680–690. [Google Scholar] [CrossRef]
  20. Zheng, H.; Yang, T.; Bao, Y.; He, P.; Yang, K.; Mei, X.; Banerjee, S. Network analysis and subsequent culturing reveal keystone taxa involved in microbial litter decomposition dynamics. Soil Biol. Biochem. 2021, 157, 108230. [Google Scholar] [CrossRef]
  21. Yang, Y.; Dou, Y.; Wang, B.; Xue, Z.; Wang, Y.; An, S.; Chang, S.X. Deciphering factors driving soil microbial life-history strategies in restored grasslands. iMeta 2023, 2, e66. [Google Scholar] [CrossRef]
  22. Andrews, J.H.; Harris, R.F. R-selection and K-selection and microbial ecology. Adv. Microb. Ecol. 1986, 9, 99–147. [Google Scholar]
  23. Spears, J.D.H.; Lajtha, K. The Imprint of Coarse Woody Debris on Soil Chemistry in the Western Oregon Cascades. Biogeochemistry 2004, 71, 163–175. [Google Scholar] [CrossRef]
  24. Khan, K.; Hussain, A.; Jamil, M.A.; Duan, W.; Chen, L.; Khan, A. Alteration in Forest Soil Biogeochemistry through Coarse Wood Debris in Northeast China. Forests 2022, 13, 1861. [Google Scholar] [CrossRef]
  25. Lauber, C.L.; Strickland, M.S.; Bradford, M.A.; Fierer, N. The influence of soil properties on the structure of bacterial and fungal communities across land-use types. Soil Biol. Biochem. 2008, 40, 2407–2415. [Google Scholar] [CrossRef]
  26. Wu, Y.; Gutknecht, J.; Nadrowski, K.; Geissler, C.; Kuehn, P.; Scholten, T.; Both, S.; Erfmeier, A.; Boehnke, M.; Bruelheide, H.; et al. Relationships Between Soil Microorganisms, Plant Communities, and Soil Characteristics in Chinese Subtropical Forests. Ecosystems 2012, 15, 624–636. [Google Scholar] [CrossRef]
  27. Rousk, J.; Baath, E.; Brookes, P.C.; Lauber, C.L.; Lozupone, C.; Caporaso, J.G.; Knight, R.; Fierer, N. Soil bacterial and fungal communities across a pH gradient in an arable soil. ISME J. 2010, 4, 1340–1351. [Google Scholar] [CrossRef]
  28. Xu, Z.; Zhang, T.; Wang, S.; Wang, Z. Soil pH and C/N ratio determines spatial variations in soil microbial communities and enzymatic activities of the agricultural ecosystems in Northeast China: Jilin Province case. Appl. Soil Ecol. 2020, 155, 103629. [Google Scholar] [CrossRef]
  29. Oberle, B.; Dunham, K.; Milo, A.M.; Walton, M.; Young, D.F.; Zanne, A.E. Progressive, idiosyncratic changes in wood hardness during decay: Implications for dead wood inventory and cycling. For. Ecol. Manag. 2014, 323, 1–9. [Google Scholar] [CrossRef]
  30. Wambsganss, J.; Stutz, K.P.; Lang, F. European beech deadwood can increase soil organic carbon sequestration in forest topsoils. For. Ecol. Manag. 2017, 405, 200–209. [Google Scholar] [CrossRef]
  31. Yang, Y.; Li, T.; Pokharel, P.; Liu, L.; Qiao, J.; Wang, Y.; An, S.; Chang, S.X. Global effects on soil respiration and its temperature sensitivity depend on nitrogen addition rate. Soil Biol. Biochem. 2022, 174, 108814. [Google Scholar] [CrossRef]
  32. Cleveland, C.C.; Reed, S.C.; Keller, A.B.; Nemergut, D.R.; O’Neill, S.P.; Ostertag, R.; Vitousek, P.M. Litter quality versus soil microbial community controls over decomposition: A quantitative analysis. Oecologia 2014, 174, 283–294. [Google Scholar] [CrossRef] [PubMed]
  33. Makipaa, R.; Rajala, T.; Schigel, D.; Rinne, K.T.; Pennanen, T.; Abrego, N.; Ovaskainen, O. Interactions between soil- and dead wood-inhabiting fungal communities during the decay of Norway spruce logs. ISME J. 2017, 11, 1964–1974. [Google Scholar] [CrossRef] [PubMed]
  34. Liu, Y.; Liu, X.; Yang, Z.; Li, G.; Liu, S. Wild boar grubbing causes organic carbon loss from both top-and sub-soil in an oak forest in central China. For. Ecol. Manag. 2020, 464, 118059. [Google Scholar] [CrossRef]
  35. Liu, Y.; Tian, H.; Li, J.; Wang, H.; Liu, S.; Liu, X. Reduced precipitation neutralizes the positive impact of soil warming on soil microbial community in a temperate oak forest. Sci. Total Environ. 2022, 806, 150957. [Google Scholar] [CrossRef] [PubMed]
  36. Hu, M.; Song, J.; Li, S.; Li, Z.; Hao, Y.; Di, M.; Wan, S. Understanding the effects of fire and nitrogen addition on soil respiration of a field study by combining observations with a meta-analysis. Agric. For. Meteorol. 2020, 292, 108106. [Google Scholar] [CrossRef]
  37. Song, Y.; Yan, G.; Zhang, G. Light Competition Contributes to the Death of Masson Pines of Coniferous-Broadleaf Mixed Forests in Subtropical China. Forests 2022, 13, 85. [Google Scholar] [CrossRef]
  38. Hou, S.; Hattenschwiler, S.; Yang, J.; Sistla, S.; Wei, H.; Zhang, Z.; Hu, Y.; Wang, R.; Cui, S.; Lü, X.; et al. Increasing rates of long-term nitrogen deposition consistently increased litter decomposition in a semi-arid grassland. New Phytol. 2021, 229, 296–307. [Google Scholar] [CrossRef]
  39. Guo, L.; Deng, M.; Yang, S.; Liu, W.; Wang, X.; Wang, J.; Liu, L. The coordination between leaf and fine root litter decomposition and the difference in their controlling factors. Glob. Ecol. Biogeogr. 2021, 30, 2286–2296. [Google Scholar] [CrossRef]
  40. Bragazza, L.; Robroek BJ, M.; Jassey VE, J.; Arif, M.S.; Marchesini, R.; Guglielmin, M.; Cannone, N. Soil microbial community structure and enzymatic activity along a plant cover gradient in Victoria Land (continental Antarctica). Geoderma 2019, 353, 144–151. [Google Scholar] [CrossRef]
  41. Chang, E.H.; Chen, C.P.; Tian, G.; Chiu, C.Y. Replacement of natural hardwood forest with planted bamboo and cedar in a humid subtropical mountain affects soil microbial community. Appl. Soil Ecol. 2018, 124, 146–154. [Google Scholar] [CrossRef]
  42. Rouvinen, S.; Kuuluvainen, T.; Karjalainen, L. Coarse woody debris in old Pinus sylvestris dominated forests along a geographic and human impact gradient in boreal Fennoscandia. Can. J. For. Res. 2002, 32, 2184–2200. [Google Scholar] [CrossRef]
  43. Zelles, L.; Bai, Q.Y.; Beck, T.; Beese, F. Signature fatty acids in phospholipids and lipopolysaccharides as indicators of microbial biomass and community structure in agricultural soils. Soil Biol. Biochem. 1992, 24, 317–323. [Google Scholar] [CrossRef]
  44. Hu, M.; Wang, J.; Lu, L.; Shao, P.; Zhou, Z.; Wang, D.; Han, S.; Osborne, B.; Chen, J. Post-fire soil extracellular enzyme activities in subtropical-warm temperate climate transitional forests. Land Degrad. Dev. 2023, 34, 1973–1983. [Google Scholar] [CrossRef]
  45. Pollierer, M.M.; Ferlian, O.; Scheu, S. Temporal dynamics and variation with forest type of phospholipid fatty acids in litter and soil of temperate forests across regions. Soil Biol. Biochem. 2015, 91, 248–257. [Google Scholar] [CrossRef]
  46. Strimmer, K. Fdrtool a versatile R package for estimating local and tail area-based false discovery rates. Bioinformatics 2008, 24, 1461–1462. [Google Scholar] [CrossRef]
  47. Minnich, C.; Persoh, D.; Poll, C.; Borken, W. Changes in Chemical and Microbial Soil Parameters Following 8 Years of Deadwood Decay: An Experiment with Logs of 13 Tree Species in 30 Forests. Ecosystems 2021, 24, 955–967. [Google Scholar] [CrossRef]
  48. Wan, X.; Xiao, L.; Vadeboncoeur, M.A.; Johnson, C.E.; Huang, Z. Response of mineral soil carbon storage to harvest residue retention depends on soil texture: A meta-analysis. For. Ecol. Manag. 2018, 408, 9–15. [Google Scholar] [CrossRef]
  49. Bantle, A.; Borken, W.; Ellerbrock, R.H.; Schulze, E.D.; Weisser, W.W.; Matzner, E. Quantity and quality of dissolved organic carbon released from coarse woody debris of different tree species in the early phase of decomposition. For. Ecol. Manag. 2014, 329, 287–294. [Google Scholar] [CrossRef]
  50. Kappes, H.; Topp, W.; Zach, P.; Kulfan, J. Coarse woody debris, soil properties and snails (Mollusca: Gastropoda) in European primeval forests of different environmental conditions. Eur. J. Soil. Biol. 2006, 42, 139–146. [Google Scholar] [CrossRef]
  51. Piaszczyk, W.; Lasota, J.; Blonska, E. Effect of Organic Matter Released from Deadwood at Different Decomposition Stages on Physical Properties of Forest Soil. Forests 2020, 11, 24. [Google Scholar] [CrossRef]
  52. Fanin, N.; Kardol, P.; Farrell, M.; Nilsson, M.C.; Gundale, M.J.; Wardle, D.A. The ratio of Gram-positive to Gram-negative bacterial PLFA markers as an indicator of carbon availability in organic soils. Soil Biol. Biochem. 2019, 128, 111–114. [Google Scholar] [CrossRef]
  53. Zalamea, M.; González, G.; Ping, C.L.; Michaelson, G. Soil organic matter dynamics under decaying wood in a subtropical wet forest: Effect of tree species and decay stage. Plant Soil 2007, 296, 173–185. [Google Scholar] [CrossRef]
  54. Hernandez, D.J.; David, A.S.; Menges, E.S.; Searcy, C.A.; Afkhami, M.E. Environmental stress destabilizes microbial networks. ISME J. 2021, 15, 1722–1734. [Google Scholar] [CrossRef] [PubMed]
  55. Qiu, L.; Zhang, Q.; Zhu, H.; Reich, P.B.; Banerjee, S.; van der Heijden, M.G.A.; Sadowsky, M.J.; Ishii, S.; Jia, X.; Shao, M.; et al. Erosion reduces soil microbial diversity, network complexity and multifunctionality. ISME J. 2021, 15, 2474–2489. [Google Scholar] [CrossRef] [PubMed]
  56. Bååth, E.; Nilsson, L.O.; Goransson, H.; Wallander, H. Can the extent of degradation of soil fungal mycelium during soil incubation be used to estimate ectomycorrhizal biomass in soil? Soil Biol. Biochem. 2004, 36, 2105–2109. [Google Scholar] [CrossRef]
  57. Bååth, E.; Anderson, T.H. Comparison of soil fungal/bacterial ratios in a pH gradient using physiological and PLFA-based techniques. Soil Biol. Biochem. 2003, 35, 955–963. [Google Scholar] [CrossRef]
  58. Krashevska, V.; Klarner, B.; Widyastuti, R.; Maraun, M.; Scheu, S. Impact of tropical lowland rainforest conversion into rubber and oil palm plantations on soil microbial communities. Biol. Fertil. Soils 2015, 51, 697–705. [Google Scholar] [CrossRef]
  59. Ge, R. Soil microbcs at dinghushan natural reserve and their adaptability to acidity. Chin. J. Ecol. 1993, 12, 11–18. [Google Scholar]
  60. Ouzounidou, G.; Skiada, V.; Papadopoulou, K.K.; Stamatis, N.; Kavvadias, V.; Eleftheriadis, E.; Gaitis, F. Effects of soil pH and arbuscular mycorrhiza (AM) inoculation on growth and chemical composition of chia (Salvia hispanica L.) leaves. Braz. J. Bot. 2015, 38, 487–495. [Google Scholar] [CrossRef]
  61. Ingwersen, J.; Poll, C.; Streck, T.; Kandeler, E. Micro-scale modelling of carbon turnover driven by microbial succession at a biogeochemical interface. Soil Biol. Biochem. 2008, 40, 864–878. [Google Scholar] [CrossRef]
  62. Blagodatskaya, E.V.; Anderson, T.H. Interactive effects of pH and substrate quality on the fungal-to-bacterial ratio and qCO2 of microbial communities in forest soils. Soil Biol. Biochem. 1998, 30, 1269–1274. [Google Scholar] [CrossRef]
  63. Siciliano, S.D.; Palmer, A.S.; Winsley, T.; Lamb, E.; Bissett, A.; Brown, M.V.; van Dorst, J.; Ji, M.; Ferrari, B.C.; Grogan, P.; et al. Soil fertility is associated with fungal and bacterial richness, whereas pH is associated with community composition in polar soil microbial communities. Soil Biol. Biochem. 2014, 78, 10–20. [Google Scholar] [CrossRef]
  64. Wang, C.; Lu, X.; Mori, T.; Mao, Q.; Zhou, K.; Zhou, G.; Nie, Y.; Mo, J. Responses of soil microbial community to continuous experimental nitrogen additions for 13 years in a nitrogen-rich tropical forest. Soil Biol. Biochem. 2018, 121, 103–112. [Google Scholar] [CrossRef]
  65. Francioli, D.; Schulz, E.; Lentendu, G.; Wubet, T.; Buscot, F.; Reitz, T. Mineral vs. Organic amendments: Microbial community structure, activity and abundance of agriculturally relevant microbes are driven by long-term fertilization strategies. Front. Microbiol. 2016, 7, 1446. [Google Scholar] [CrossRef]
  66. Li, S.; Hu, M.; Shi, J.; Tian, X. Improving long-term crop productivity and soil quality through integrated straw-return and tillage strategies. Agron. J. 2022, 114, 1500–1511. [Google Scholar] [CrossRef]
  67. Ghodszad, L.; Reyhanitabar, A.; Maghsoodi, M.R.; Lajayer, B.A.; Chang, S.X. Biochar affects the fate of phosphorus in soil and water: A critical review. Chemosphere 2021, 283, 131176. [Google Scholar] [CrossRef]
  68. Huang, J.; Hu, B.; Qi, K.; Chen, W.; Pang, X.; Bao, W.; Tian, G. Effects of phosphorus addition on soil microbial biomass and community composition in a subalpine spruce plantation. Eur. J. Soil Biol. 2016, 72, 35–41. [Google Scholar] [CrossRef]
  69. Feng, J.; Li, Z.; Hao, Y.; Wang, J.; Ru, J.; Song, J.; Wan, S. Litter removal exerts greater effects on soil microbial community than understory removal in a subtropical-warm temperate climate transitional forest. For. Ecol. Manag. 2022, 505, 119867. [Google Scholar] [CrossRef]
  70. van Diepen, L.T.A.; Lilleskov, E.A.; Pregitzer, K.S.; Miller, R.M. Simulated nitrogen deposition causes a decline of intra- and extraradical abundance of arbuscular mycorrhizal fungi and changes in microbial community structure in northern hardwood forests. Ecosystems 2010, 13, 683–695. [Google Scholar] [CrossRef]
  71. Li, W.; Shi, Y.; Zhu, D.; Wang, W.; Liu, H.; Li, J.; Shi, N.; Ma, L.; Fu, S. Fine root biomass and morphology in a temperate forest are influenced more by the nitrogen treatment approach than the rate. Ecol. Indic. 2021, 130, 108031. [Google Scholar] [CrossRef]
  72. Spears, J.D.H.; Holub, S.M.; Harmon, M.E.; Lajtha, K. The influence of decomposing logs on soil biology and nutrient cycling in an old-growth mixed coniferous forest in Oregon, USA. Can. J. For. Res. 2003, 33, 2193–2201. [Google Scholar] [CrossRef]
  73. Castle, S.C.; Sullivan, B.W.; Knelman, J.; Hood, E.; Nemergut, D.R.; Schmidt, S.K.; Cleveland, C.C. Nutrient limitation of soil microbial activity during the earliest stages of ecosystems development. Oecologia 2017, 185, 513–524. [Google Scholar] [CrossRef]
  74. Piaszczyk, W.; Lasota, J.; Gaura, G.; Blonska, E. Effect of Deadwood Decomposition on the Restoration of Soil Cover in Landslide Areas of the Karpaty Mountains, Poland. Forests 2021, 12, 237. [Google Scholar] [CrossRef]
  75. von Lützow, M.; Kögel-Knabner, I.; Ekschmitt, K.; Matzner, E.; Guggenberger, G.; Marschner, B.; Flessa, H. Stabilization of organic matter in temperate soils: Mechanisms and their relevance under different soil conditions? A review. Eur. J. Soil Sci. 2006, 57, 426–445. [Google Scholar] [CrossRef]
  76. Swift, M.J. The estimation of mycelial biomass by determination of the hexosamine content of wood tissue decayed by fungi. Soil Biol. Biochem. 1973, 5, 321–332. [Google Scholar] [CrossRef]
  77. Dove, N.C.; Keeton, W.S. Structural Complexity Enhancement increases fungal species richness in northern hardwood forests. Fungal Ecol. 2015, 13, 181–192. [Google Scholar] [CrossRef]
Figure 1. Localization of study plots and sampling scheme. DC: decay stage.
Forests 14 00955 g001
Figure 2. Mean values (± 1 standard error) of soil microbial PLFAs across decay stage of DWD and soil depth. Different letters indicate significant differences (p < 0.05) between decay stages in the same soil depth (a); bacteria: the proportion of total bacterial PLFAs (b); fungi: the proportion of fungal PLFAs (c); GB: the proportion of general bacterial PLFAs (d); GP: the proportion of gram-positive bacterial PLFAs (e); GN: the proportion of gram-negative bacterial PLFAs (f); AMF: the proportion of arbuscular mycorrhiza fungal PLFAs (g); Act: the proportion of actinomycete PLFAs (h); F/B: the ratio of fungal to total bacterial PLFAs (i); GP/GN: the ratio of gram-positive bacterial to gram-negative bacterial PLFAs (j); cy/pre: the ratio of cyclopropyl PLFAs to their monoenoic precursors (k).
Forests 14 00955 g002
Figure 3. Principal component analysis (PCA) showed variation in microbial community composition across decay stage (a) and soil depth (b). Each dotted circle represents a 95% confidence interval. DC: decay stage.
Forests 14 00955 g003
Figure 4. Network diagram of co-occurring PLFAs at different decay stages in two soil depths. Different colored nodes represent the individual microbial guilds. Number of connections is proportional to the size of the nodes. See Figure 2 for abbreviations.
Forests 14 00955 g004
Figure 5. Redundancy analysis (RDA) of soil microbial community composition (red vectors) and soil properties (blue vectors) at 0–10 cm soil depth (a) and 10–20 cm soil depth (b). See Table 1 and Figure 2 for abbreviations.
Forests 14 00955 g005
Figure 6. Heatmap of Pearson’s correlation between the microbial PLFAs and soil chemical properties. * p < 0.05; ** p < 0.01; *** p < 0.001. See Table 1 and Figure 2 for abbreviations.
Forests 14 00955 g006
Table 1. Mean values (± 1 standard error) of soil chemical properties across decay stage of DWD and soil depth.
Depth (cm)DCpHSOC (g kg−1)TN (g kg−1)NO3-N (mg kg−1)NH4+-N (mg kg−1)Avai P (mg kg−1)
0–104.69 ± 0.04a29.37 ± 1.62c2.20 ± 0.06b14.47 ± 0.93b15.84 ± 0.52ab12.57 ± 0.10b
4.33 ± 0.04b37.43 ± 1.27b2.53 ± 0.09ab15.26 ± 1.14ab13.73 ± 1.54b13.86 ± 0.63b
4.25 ± 0.00b51.03 ± 0.26a3.27 ± 0.20ab19.07 ± 1.80ab17.46 ± 0.50ab17.10 ± 1.17a
4.10 ± 0.01c56.81 ± 2.86a3.67 ± 0.41a21.26 ± 1.54a20.31 ± 2.10a14.75 ± 0.21ab
4.23 ± 0.01bc54.74 ± 0.99a3.47 ± 0.47ab21.22 ± 1.24a17.14 ± 0.62ab14.53 ± 0.22ab
10–204.75 ± 0.03a14.63 ± 0.67b1.23 ± 0.03a8.52 ± 0.63a8.57 ± 0.44b11.88 ± 0.12b
4.67 ± 0.02a14.73 ± 0.87b1.23 ± 0.03a8.09 ± 0.85a9.02 ± 0.89b13.23 ± 0.14ab
4.50 ± 0.03b19.50 ± 0.81ab1.83 ± 0.23a8.96 ± 1.37a9.08 ± 0.56b15.33 ± 0.79a
4.39 ± 0.01b28.60 ± 1.72a2.13 ± 0.39a9.49 ± 1.55a12.45 ± 0.40a13.98 ± 0.43ab
4.49 ± 0.04b26.57 ± 4.20a1.70 ± 0.25a10.78 ± 1.49a10.74 ± 0.99ab13.33 ± 0.77ab
Different letters indicate significant differences (p < 0.05) between decay stages in same soil depth. DC: decay stage; SOC: soil organic carbon; TN: total nitrogen; Avai P: available P.
Table 2. Stepwise multiple regression results (partial R2) showed the factors affecting microbial PLFAs and physiological stress indicator (cy/pre) at 0–10 cm and 10–20 cm soil depth.
0–10 cm10–20 cm
Microbial PLFAsIndependent
Variables
Partial R2pIndependent VariablesPartial R2p
BacteriaNO pH0.5280.002
FungiSOC0.716<0.001NO
F/BSOC0.5750.001NO
GBAvai P0.3990.012NO
GPSOC0.703<0.001pH0.4440.007
GNNH4+-N0.2780.043SOC0.4460.007
GP/GNpH0.625<0.001pH0.661<0.001
AMFNO3-N0.4350.008pH0.3980.012
ActSOC0.3210.028pH0.599<0.001
cy/preSOC0.3250.027pH0.3450.021
NH4+-N0.2150.036
See Table 1 and Figure 2 for abbreviations.
Disclaimer/Publisher’s Note: The statements, opinions and data contained in all publications are solely those of the individual author(s) and contributor(s) and not of MDPI and/or the editor(s). MDPI and/or the editor(s) disclaim responsibility for any injury to people or property resulting from any ideas, methods, instructions or products referred to in the content.

