Article

Mechanical Performance and Bond Integrity of Finger Jointed High-Density Sub-Tropical Hardwoods for Residential Decking

1
Department of Agriculture and Fisheries, Salisbury Research Facility, Brisbane, QLD 4107, Australia
2
School of Engineering, University of Southern Queensland, Toowoomba, QLD 4300, Australia
3
School of Engineering and Build Environment, Griffith University, Southport, QLD 4214, Australia
*
Author to whom correspondence should be addressed.
Forests 2023, 14(5), 956; https://doi.org/10.3390/f14050956
Submission received: 6 April 2023 / Revised: 25 April 2023 / Accepted: 4 May 2023 / Published: 6 May 2023
(This article belongs to the Section Wood Science and Forest Products)

Abstract

:
Finger jointing has long been a method of extending the longitudinal span of short-length timber pieces through a tooth-like profile of a nominated length and bonded with adhesive. With the high-density hardwood resource in the sub-tropics, local industries have found it difficult to obtain adequate bond integrity for high moisture areas and outdoor applications, where a good bond is governed by the dry modulus of rupture (MOR) and the percentage of wood fibre present in the separated joint after exposure to water impregnation. This paper presents the finger joint performance in terms of MOR, stiffness (MOE), and wood fiber amount (WFA) under different variables, joint profile (10 and 20 mm long fingers) using two structurally rated adhesives (a single-component polyurethane (1C-PUR) and resorcinol formaldehyde (RF)) on spotted gum (Corymbia citriodora) and Darwin stringybark (Eucalyptus tetrodonta) jointed boards. Dry bending strength or MOR testing indicated the 20 mm joints with the PUR adhesive had the best performance across both tested species compared to the RF adhesive. The measured MOE of the joints showed the RF samples to have higher MOE (7% to 13%) than the PUR samples for both joint sizes and species. Testing of joint durability through water impregnation resulted in MOR and MOE values decreasing by up to 50% for the RF and PUR joints. Conversely, the performance of water-impregnated joints after being allowed to re-condition to a 12% equilibrium moisture content produced a regain of MOR for the PUR joints across both species of 30% to 40%. Furthermore, it was found that the WFA increased for the PUR samples between the water-impregnated samples and the re-conditioned samples.

1. Introduction

The inclusion of finger joints (FJs) in engineered wood products (EWPs) allows for the longitudinal transmission of stresses through two or more adjoining laminates [1]. Finger jointing has long been used for non-structural applications [2,3] with many studies investigating their performance for furniture products [3,4,5,6]. They are also used for structural applications, such as structural glulam or decking, with the performance of finger-jointed products studied for instance through finger profile influences [7,8].
FJs have been shown to achieve comparable mechanical properties to non-jointed boards with tensile strength values of 90% compared to the original, un-jointed board. When compared to the tensile strength of other joint types, finger joints present reduced variability in measured tensile strength values [8,9]. Studies commonly indicate that the finger length and joint profile directly influence performance [5,10,11,12]. Non-structural joints, where strength is not the primary concern, generally use short finger lengths due to the aesthetic preference for the application [7,8,13]. A structural joint, with longer fingers, is used where the objective is to match (or come close to) the performance of the original board strength. The use of structural FJs is commonly governed by their performance against the relevant testing standards [14,15]. In the Australian standards, AS 5068 (2006) Timber—Finger joints in structural products—Production requirements [15], and AS/NZS 8008 (2022) Timber—Finger-jointed structural timber—Performance requirements [14]; performance consists of both a strength and a durability evaluation aspect.
The jointed products are required to meet specified service class exposure criteria which are determined by the intended application of the product. The product conformance to these service classes governs the expected performance. The three service class environments are listed hereafter and have been extracted from AS5068 [15]. Service Class 1 (SC1): defined as material that is exposed to a temperature of 20°C and a relative humidity (RH) of 65%. The equilibrium moisture content (EMC) is thus not expected to exceed 12%. This service class has been likened to an indoor product testing condition. Service Class 2 (SC2): similar environmental conditions to SC1, although the EMC range increases to 20%. This service class aims to represent the exposure conditions of the outdoors but with a protected application. Service Class 3 (SC3): climatic conditions that result in EMC above SC2, similar to an exposed outdoor condition. The different service classes are illustrated in Figure 1.
Queensland contains some of the most high-density species of wood globally [1] with spotted gum (Corymbia citriodora—SPG) and Darwin stringybark (Eucalyptus tetrodonta—DSK) being two of these species, with an average air-dry density measured for the boards used in this study of 1075 kg/m3 and 1002 kg/m3, respectively. Finger jointing on high-density, high-strength hardwood species is difficult due to low adhesion penetration, complexities attributed to high extractive content, as well as low permeability [2,16,17].
While the mechanical performance of high-density hardwood FJs is suitable for most applications, the lack of adhesive penetration relates to poor mechanical inter-lock occurring in the fibers of the jointed boards. When exposed to harsh environmental conditions, as specified by AS 5068 [15] and AS/NZS 8008 [14], this poor mechanical inter-lock has been seen to decrease FJ performance and relate to low wood fibre amount (WFA) between adjoining boards [18]. A minimum percentage of wood fibre failure in the joints is a requirement of both standards and for these high-density hardwoods, and it has proven difficult to pass the criteria requirements; it is a complexity facing the industry in obtaining standard compliant high-density hardwood FJs.
This complexity is as much a timber issue as an adhesive one as the anatomical nature of some high-density species (hardwoods and softwoods) makes the tearing of fibers for visual assessment difficult. Furthermore, different adhesive characteristics can affect the joints’ ability to retain wood fibre post-failure. Many studies have investigated the effects of adhesive types on bonding high-density hardwood species with the majority of works focusing on single-component polyurethane (1C-PUR) or resorcinol formaldehyde (RF) adhesives [18,19]. Comparisons of the two adhesives [19] on beech wood (Fagus sylvatica L.) jointed boards suggest FJs dried after environmental exposure see a reversal in strength loss, as is seen for non-jointed boards.
Smardzewski [5] evaluated the distribution of stresses concentrated in an FJ through both theoretical and experimental analysis. Smardzewski [5] found that the transferred stress needed to be considered differently for a bending arrangement than in tension due to the tensile and compressive sides of the member in bending. These changes in axial forces during bending disturb the distribution of stresses along the joint profile, although can be alleviated by the number of finger profiles and length (for both joint geometry and fibral interlock from adhesive).
FJ geometry has been reported by many as a key influential parameter in FJ designs governing the bending strength [8,10,11]. The main properties, shown in Figure 2, that govern the joint geometry, are pitch (p), length (L), slope (s), and width (b) of fingertips [10]. As the design of the joint profile encompasses all the previously mentioned properties, they can all influence, to a degree, the joint end performance [10]. Rao et al. [8] found that the interrelationship between the parameters of FJ geometries makes design evaluation complicated. This interrelationship prevents the geometrical change of one aspect for means of investigation, as this change will in turn affect the whole geometry (Figure 2).
Rao et al. [8] found high-strength FJs to correspond highly with a flat slope and sharp (or small) tip width. It was also concluded that a target slope ratio of 1:12 produced the optimal performing joint design. Practically tip thickness (b) and slope (s) will have a larger influence on the performance of the joint over the pitch (p) and length (L) of the joint [8,10]. Serrano [20] reported that decreasing the size of b can reduce geometric discontinuities in the FJ and lead to a reduction in stress concentration about the tip gap (lt). For most finger-cutting applications, controls are limited around b as these are parameters restricted by the cutter design. Klausler et al. [19] investigated the moisture-related performance of PUR-bonded beech wood (Fagus sylvatica L.) glulams for environmental exposure testing (referred to as WET as part of this paper) and performance changes from re-drying after the WET process (referred to as COND as part of this paper). Klausler et al. [19] achieved the WET condition by boiling the specimens for 6h; the COND condition followed the same wetting approach but the specimens were re-dried at 103 °C. The changes in bond strength of the glulam specimens were evaluated using a tensile test conducted perpendicular to the sample face. Klausler et al. [19] found that the WET testing condition produced a reduction in tensile strength of 50%. The COND sample performance found that the strength loss effects reported from the WET condition were reversed with strength increasing within 75% to 90% of the original tensile strength (referred to as DRY as part of this paper).
Sterley et al. [12] evaluated both RF- and PUR-type adhesives on both high- and low-density European spruce (Picea abies) to measure the performance changes in glued FJs manufactured from seasoned boards versus green (unseasoned) boards. Testing was conducted on batches of finger-jointed boards according to ASTM D 4688 [21] for both tensile strength and bond integrity (WET). Results of Sterley et al. [12] showed that (i) the PUR-type joints presented around a 50% decrease in strength between the DRY and WET tests, (ii) RF specimens presented only a 25% decrease in strength, and (iii) there was no difference in strength noted between the PUR joints manufactured from seasoned and unseasoned timber. Muller et al. [22] evaluated a range of wood adhesives (PUR, phenol resorcinol formaldehyde (PRF), and melamine urea formaldehyde (MUF)) for their fracture energy as an alternative to wood fibre evaluation on European spruce. It was found that while PUR adhesives produced a lower wood fibre amount (WFA), they recorded higher ultimate strength values compared to PRF- and MUF-type adhesives, which are often considered brittle in comparison to the PURs.
Based on the literature reviewed, it is clear the performance of jointed timber products is well understood, specifically regarding the effect of joint configuration, various adhesive systems, and testing conditions. However, the link between performance and product application has been identified as a notable gap in the reviewed studies. This study complements the referenced work by extending the performance evaluation testing for the application of residential decking and how the product performance characteristics suit the performance standard referenced through the study (AS 5068). Therefore, the aims of this study were to investigate the use of sub-tropical, high-density hardwood species (SPG and DSK) for their performance (MOR MOE, and WFA) in finger-jointed applications intended for residential decking. Ahmad et al. and Rao et al. [7,8] found that the joint or finger length is influential for the joint performance; 10 and 20 mm long fingers were targeted and evaluated for the study. RF and PUR adhesive types have been investigated for the species, as well as testing water impregnation of the joints and re-conditioning them to a targeted 12% moisture content.

2. Materials and Methods

2.1. Materials

Boards were selected to ensure defects were avoided and trimmed to ensure ends were square as required for FJ cutting and pressing. A total of 15 samples were prepared per tested configuration, as presented in Table 1. A total of 360 seasoned boards of both (180) spotted gum (Corymbia citriodora—SPG) and (180) Darwin stringybark (Eucalyptus tetrodonta—DSK) were prepared for the study measuring 145 mm (width) × 25 mm (depth) × 400 mm (length).

2.2. Manufacture

Boards were weighed and measured for their respective density and then separated into density batches of 15 systematically. Once boards were weighed and groupings assigned, FJs of the sizes provided in Table 2 were machined. The cutters used were manufactured by Leitz (Minifinger joint cutters, Leitz, Oberkochen, Germany). The machining of the fingers was conducted using an SCMT110 (SCM Spindle Moulder T110, Rimini, Italy). Joints were machined on opposing ends of the 400 mm long sample, and then docked in half, allowing the two machined ends to be joined together. The actual finger length as reported in Table 2 is the length of the machined finger that was created once the cutters were tuned to give a tip gap between 0.5–1 mm.
After machining, adhesive was prepared where the PUR was a single component and therefore did not require any preparation while the RF is a two-part adhesive system that required the resin and hardener to be mixed prior to application at a 4 to 1 ratio of resin to hardener as outlined in the technical data sheet. The adhesive was applied to one side of the freshly machined joints at a rate of 250 gsm for the PUR (Jowapur 681.40, Jowat Adhesives, Australia) and to both sides at a rate of 450 gsm total (225 gsm per side) for the resorcinol formaldehyde (950.82 RF resin and 950.85 paraformaldehyde hardener, Jowat Adhesives, Australia). Both RF and PUR adhesive types are thermosetting, meaning the curing periods are affected by the environmental conditions during pressing. The RF adhesive cures during pressing with the assistance of the paraformaldehyde hardener, whereas the PUR adhesive cures with moisture. The matching pairs of boards were pressed together using a Shimadzu universal testing machine (AG-100X, Shimadzu Corporation, Kyoto, Japan). A pressure of 7.5 MPa was applied to the joints for a period of 60 seconds after the adhesive was applied; pressure and press periods were applied in consultation with the adhesive supplier. The jointed boards were stored horizontally until they could be placed in a constant environment chamber at 20 °C and 65% relative humidity (RH), and 12% equilibrium moisture content (EMC). All samples were allowed a minimum of seven days to ensure full adhesive cure prior to testing, as specified by the adhesive supplier. Prior to testing the samples were machined to a nominal cross-section of 135 mm × 19 mm to represent the final product dimension.

2.3. Conditioning and Treatment

The Australian timber design standard AS 1720.1 (2010) Timber structures—design methods [23] and the glulam design standard for structural timber products AS/NZS1328.1 [24], EWP materials must meet the requirements of a service class 3 (SC3) exposure level for external applications. Therefore, testing to SC3 was adopted.
The testing stages and conditions are defined as DRY: Samples are tested in the ‘as glued’ condition after curing. WET: As detailed in AS 5068 [15], samples are exposed to a vacuum water impregnation process where samples submerged in water between 10 °C and 27 °C are cycled between a vacuum of 65 kPa and pressure of 500 ± 30 kPa at 1.5 h increments for a total of 6 h; these two processes were then repeated a second time, totaling 6 h. Samples were tested as soon as the process concluded. COND: After first being exposed to the process detailed for ‘WET’ samples, they are then conditioned at 20 °C and 65% to a targeted 12% MC prior to mechanical testing; this method has been adopted from the referenced studies presented above [19,25]. During conditioning, the COND sample masses were monitored until a constant mass was reached before testing.

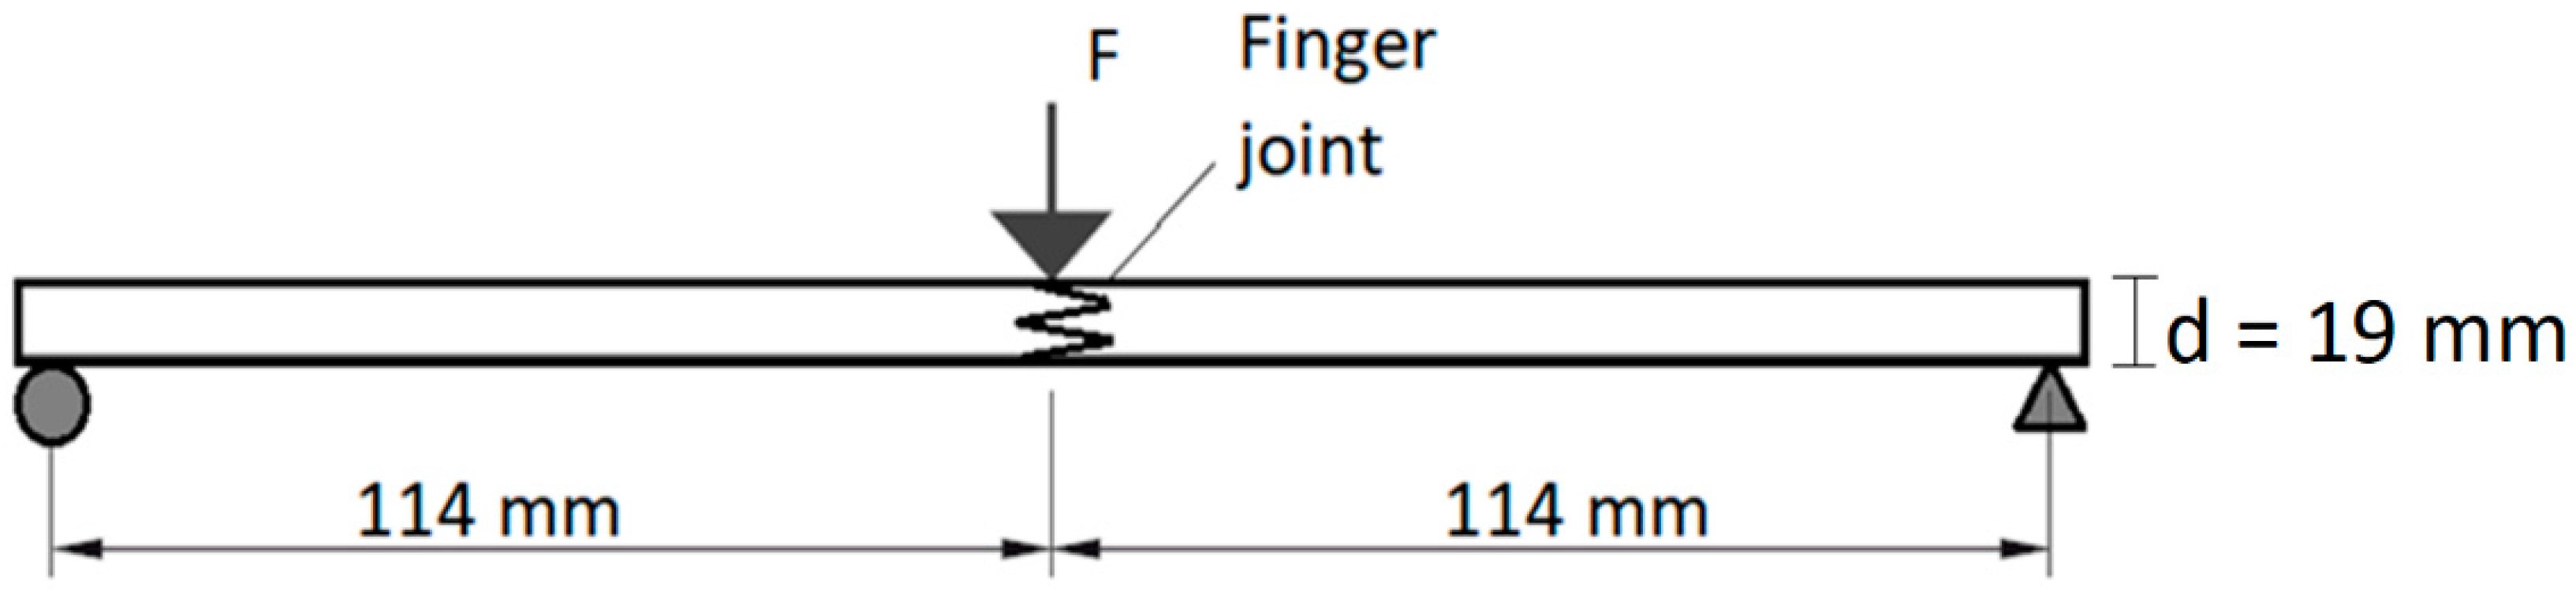
2.4. Bending Strength (MOR) and Stiffness (MOE) Testing

Testing of the FJs was conducted in accordance with Appendix B of AS5068 [15] where the 3-point, flatwise bending test arrangement was adopted, as shown in Figure 3. The testing arrangement places the FJ at the center-span point where loading is concentrated. The flatwise orientation satisfies the intended application of the jointed products for outdoor flooring (decking). A 3-point test setup has been selected to test the worst-case scenario for the in-service joint to be stressed. The span was 12 times the depth d, i.e., 228 mm.
Testing was conducted using a 100 kN Shimadzu universal testing machine. The applied rate of loading was 2.5 mm/min to ensure failure was obtained in not less than 10 s and no more than 3 min of load being applied as required by AS5068 [15]. At the conclusion of testing, the maximum load (F) reached was recorded and the bending strength ( MOR ) determined as per Equation (1) (AS5068 [15]).
MOR = 1.5 F L s w   d 2   ( MPa )
where L s is the span, and w and d are the measured width and depth of the boards, respectively. Once all testing was conducted, the mean, and coefficient of variation (COV) were calculated as per AS/NZS4063.2 [26] using Method 3 in Appendix B, i.e., non-parametric statistical evaluation. The results of MOR testing were evaluated for their statistical significance through the Fisher least significant difference (LSD) comparison with a 95% confidence level. Statistical interpretation has been conducted using RStudio (version 1.3.1058, RStudio, Boston, MA, USA).
As the bending stiffness (MOE) of the specimens, considering the rotational stiffness of the finger joints, is directly proportional to the elastic slope of the load versus deflection curve (N/mm), the MOE has been determined according to Section 2.4 of AS/NZS4063.1 [27] and used to compare the relative stiffness between samples (Equation (2)).
MOE = 23 108 Δ F n Δ e n L s 3 w d 3   ( MPa )
where the slope ( Δ F n Δ e n ) has been taken as the linear portion of the load versus displacement curve between 10% and 40% of the maximum failure load. MOE has been considered a determinant of the treatment conditions on the joint potential deterioration, and therefore, has been presented in this paper for reference and information only.

2.5. Wood Fibre Amount (WFA)

The failed FJ samples were also visually assessed for the percentage of wood fibre amount (WFA) across the two joint halves in accordance with Appendix D of AS5068 [15]. This standard demands that each joint must meet a minimum visual wood fibre percentage of 20% for hardwood samples and 30% for softwood samples, and an average percentage of 40% for hardwood samples and 60% for softwood samples per configuration across all boards.

2.6. Analysis of Results

The assessment of MOR and MOE has been applied to the three testing conditions discussed for the two adhesive types to determine their statistical significance through the Fisher LSD comparison with a 95% confidence level. A paired t-test was adopted to determine a significant difference between the two means when two variables were analysed. The normality of the datasets was also tested using the Shapiro–Wilk normality test with a 95% confidence level. Analyses were conducted separate to FJ size and statistical interpretation were conducted through the use of RStudio (ver. 1.3.1058).

3. Results and Discussion

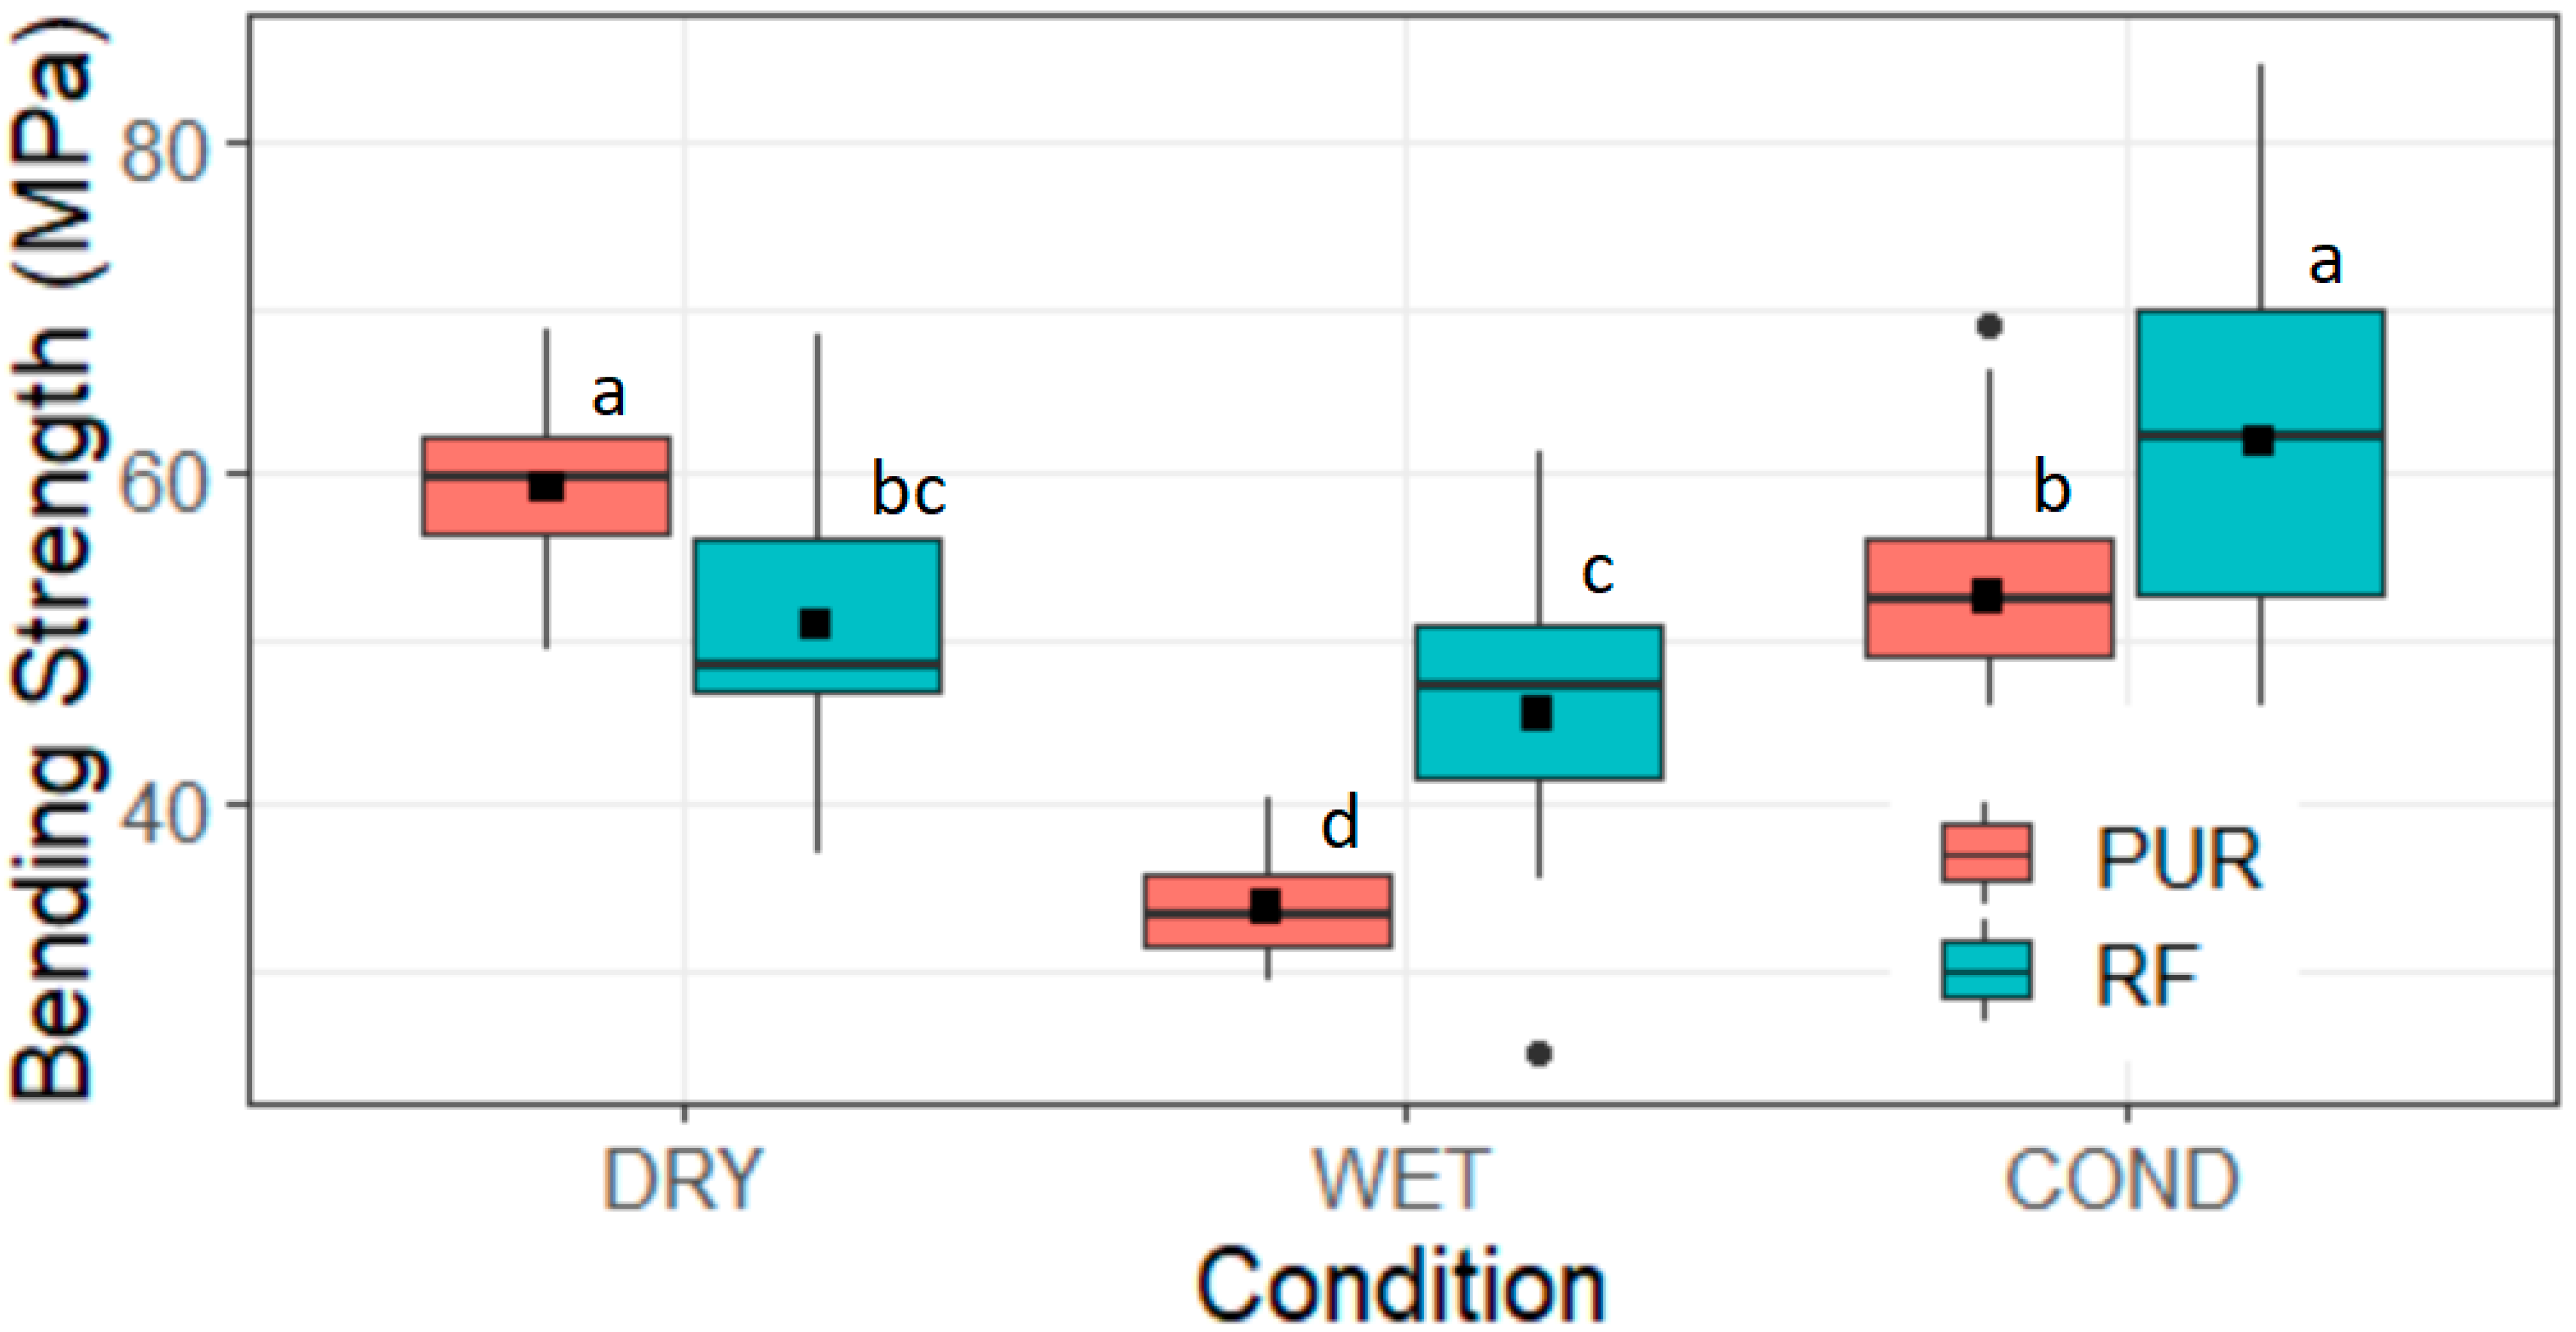
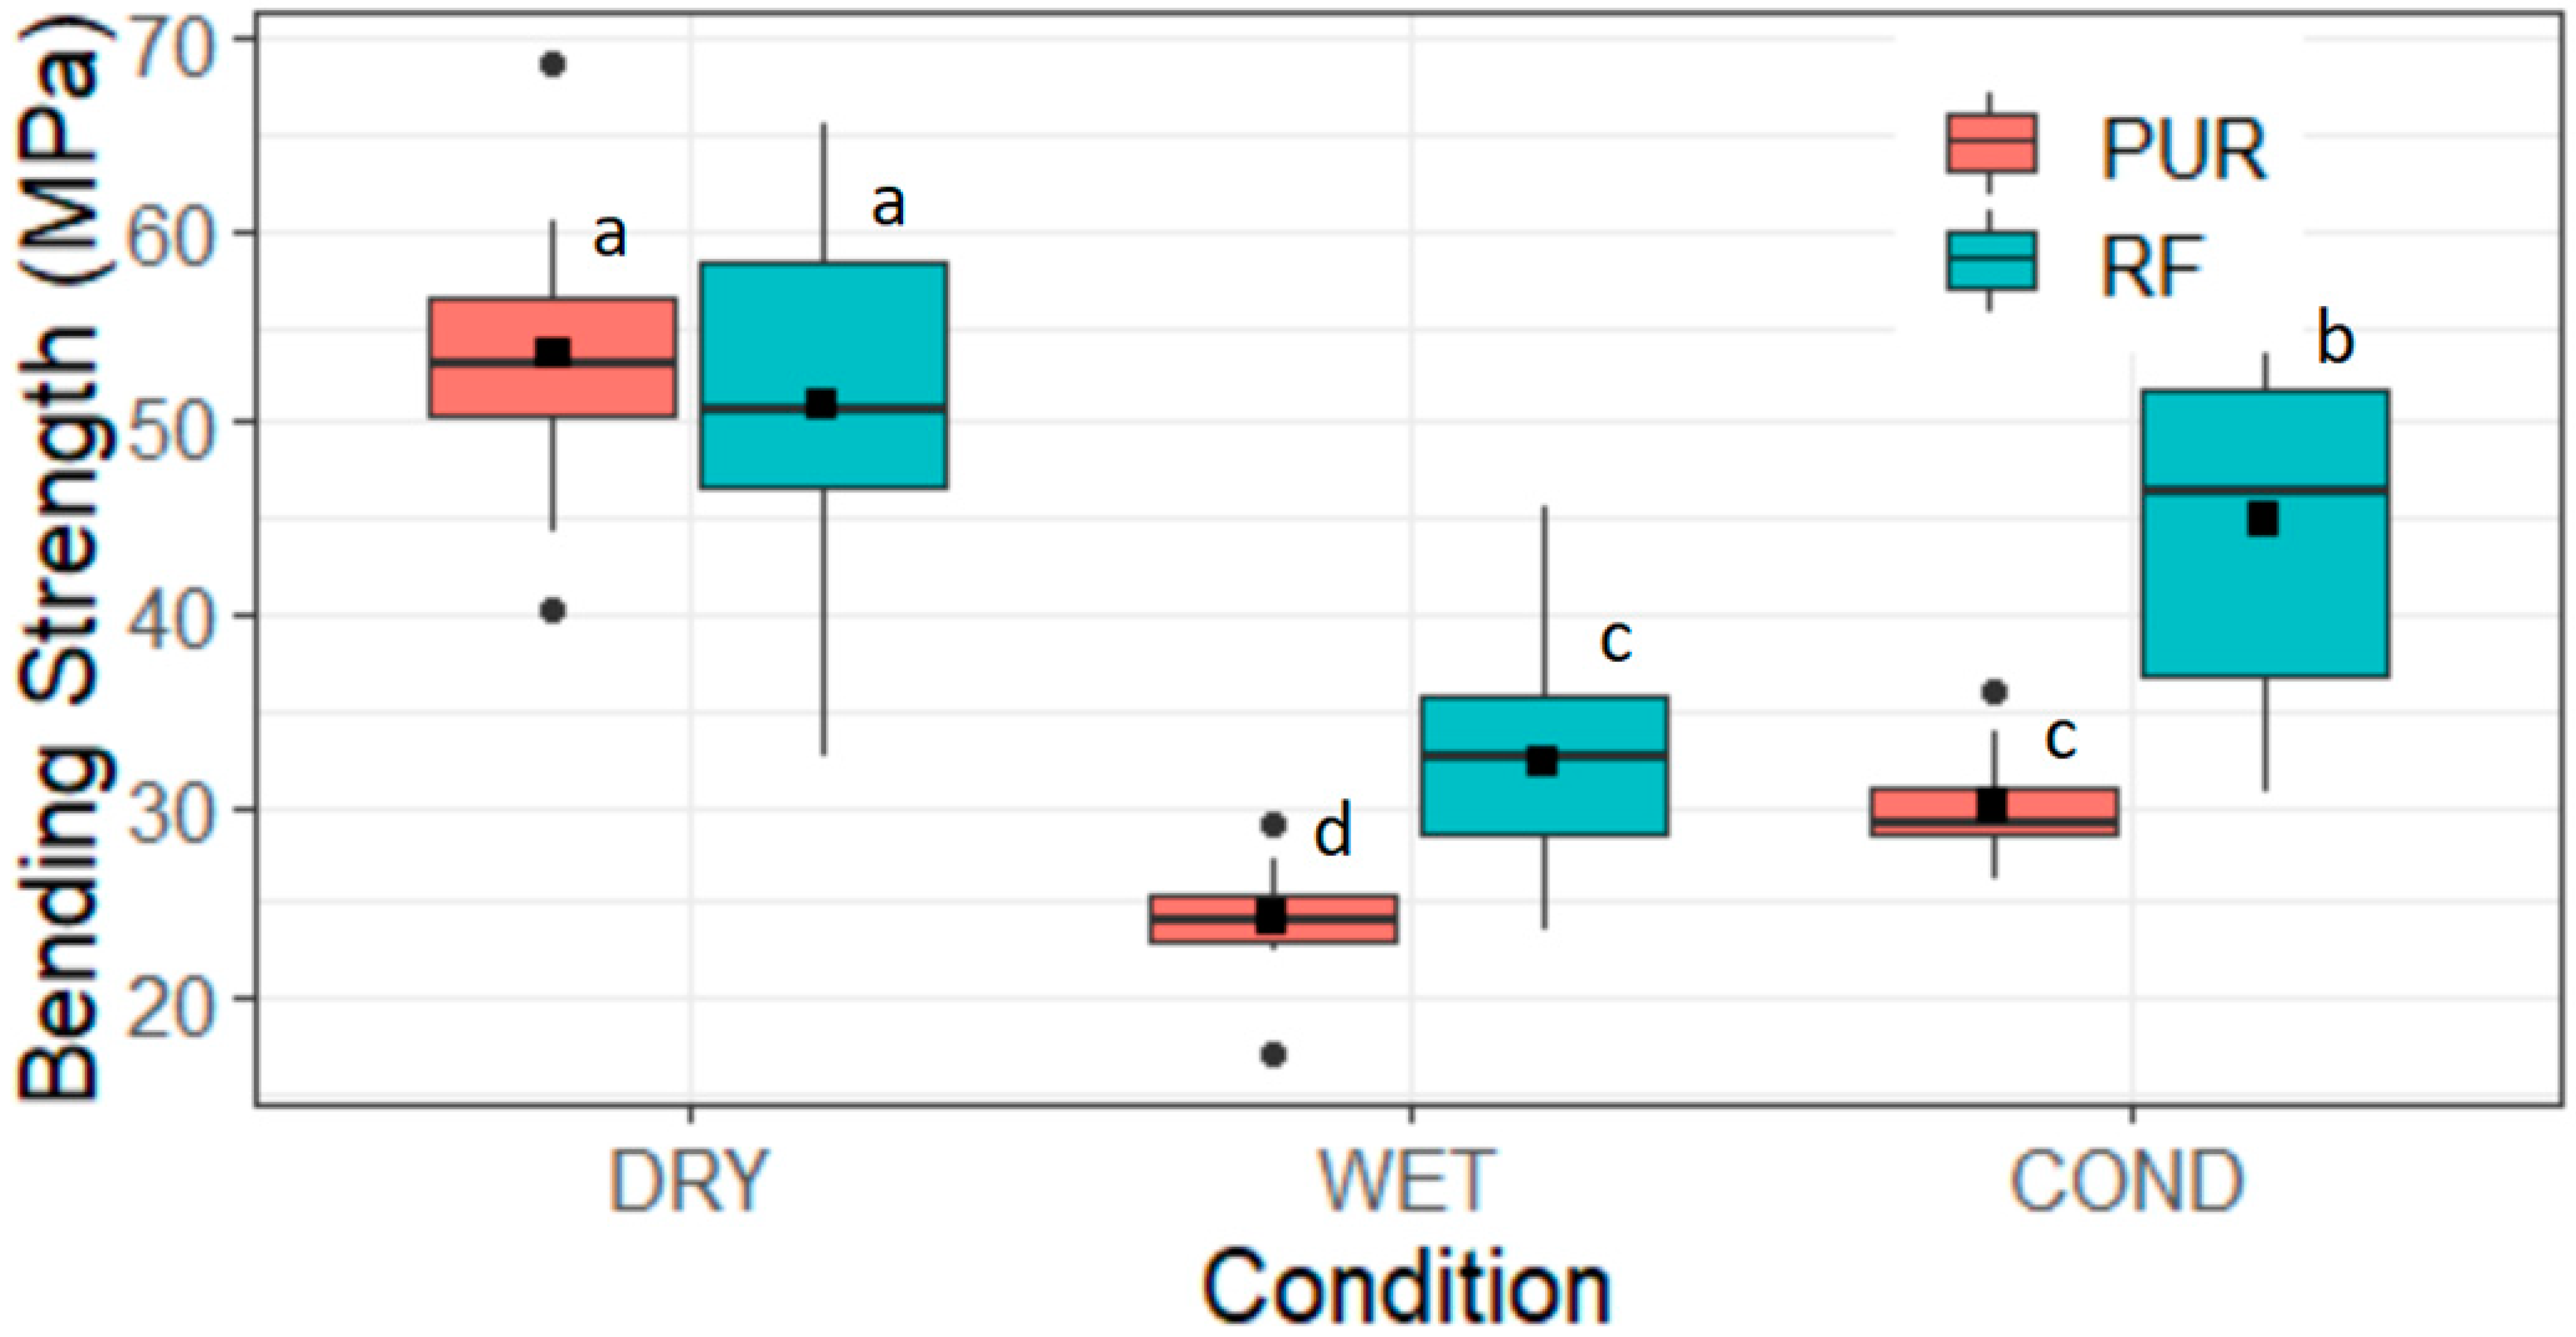
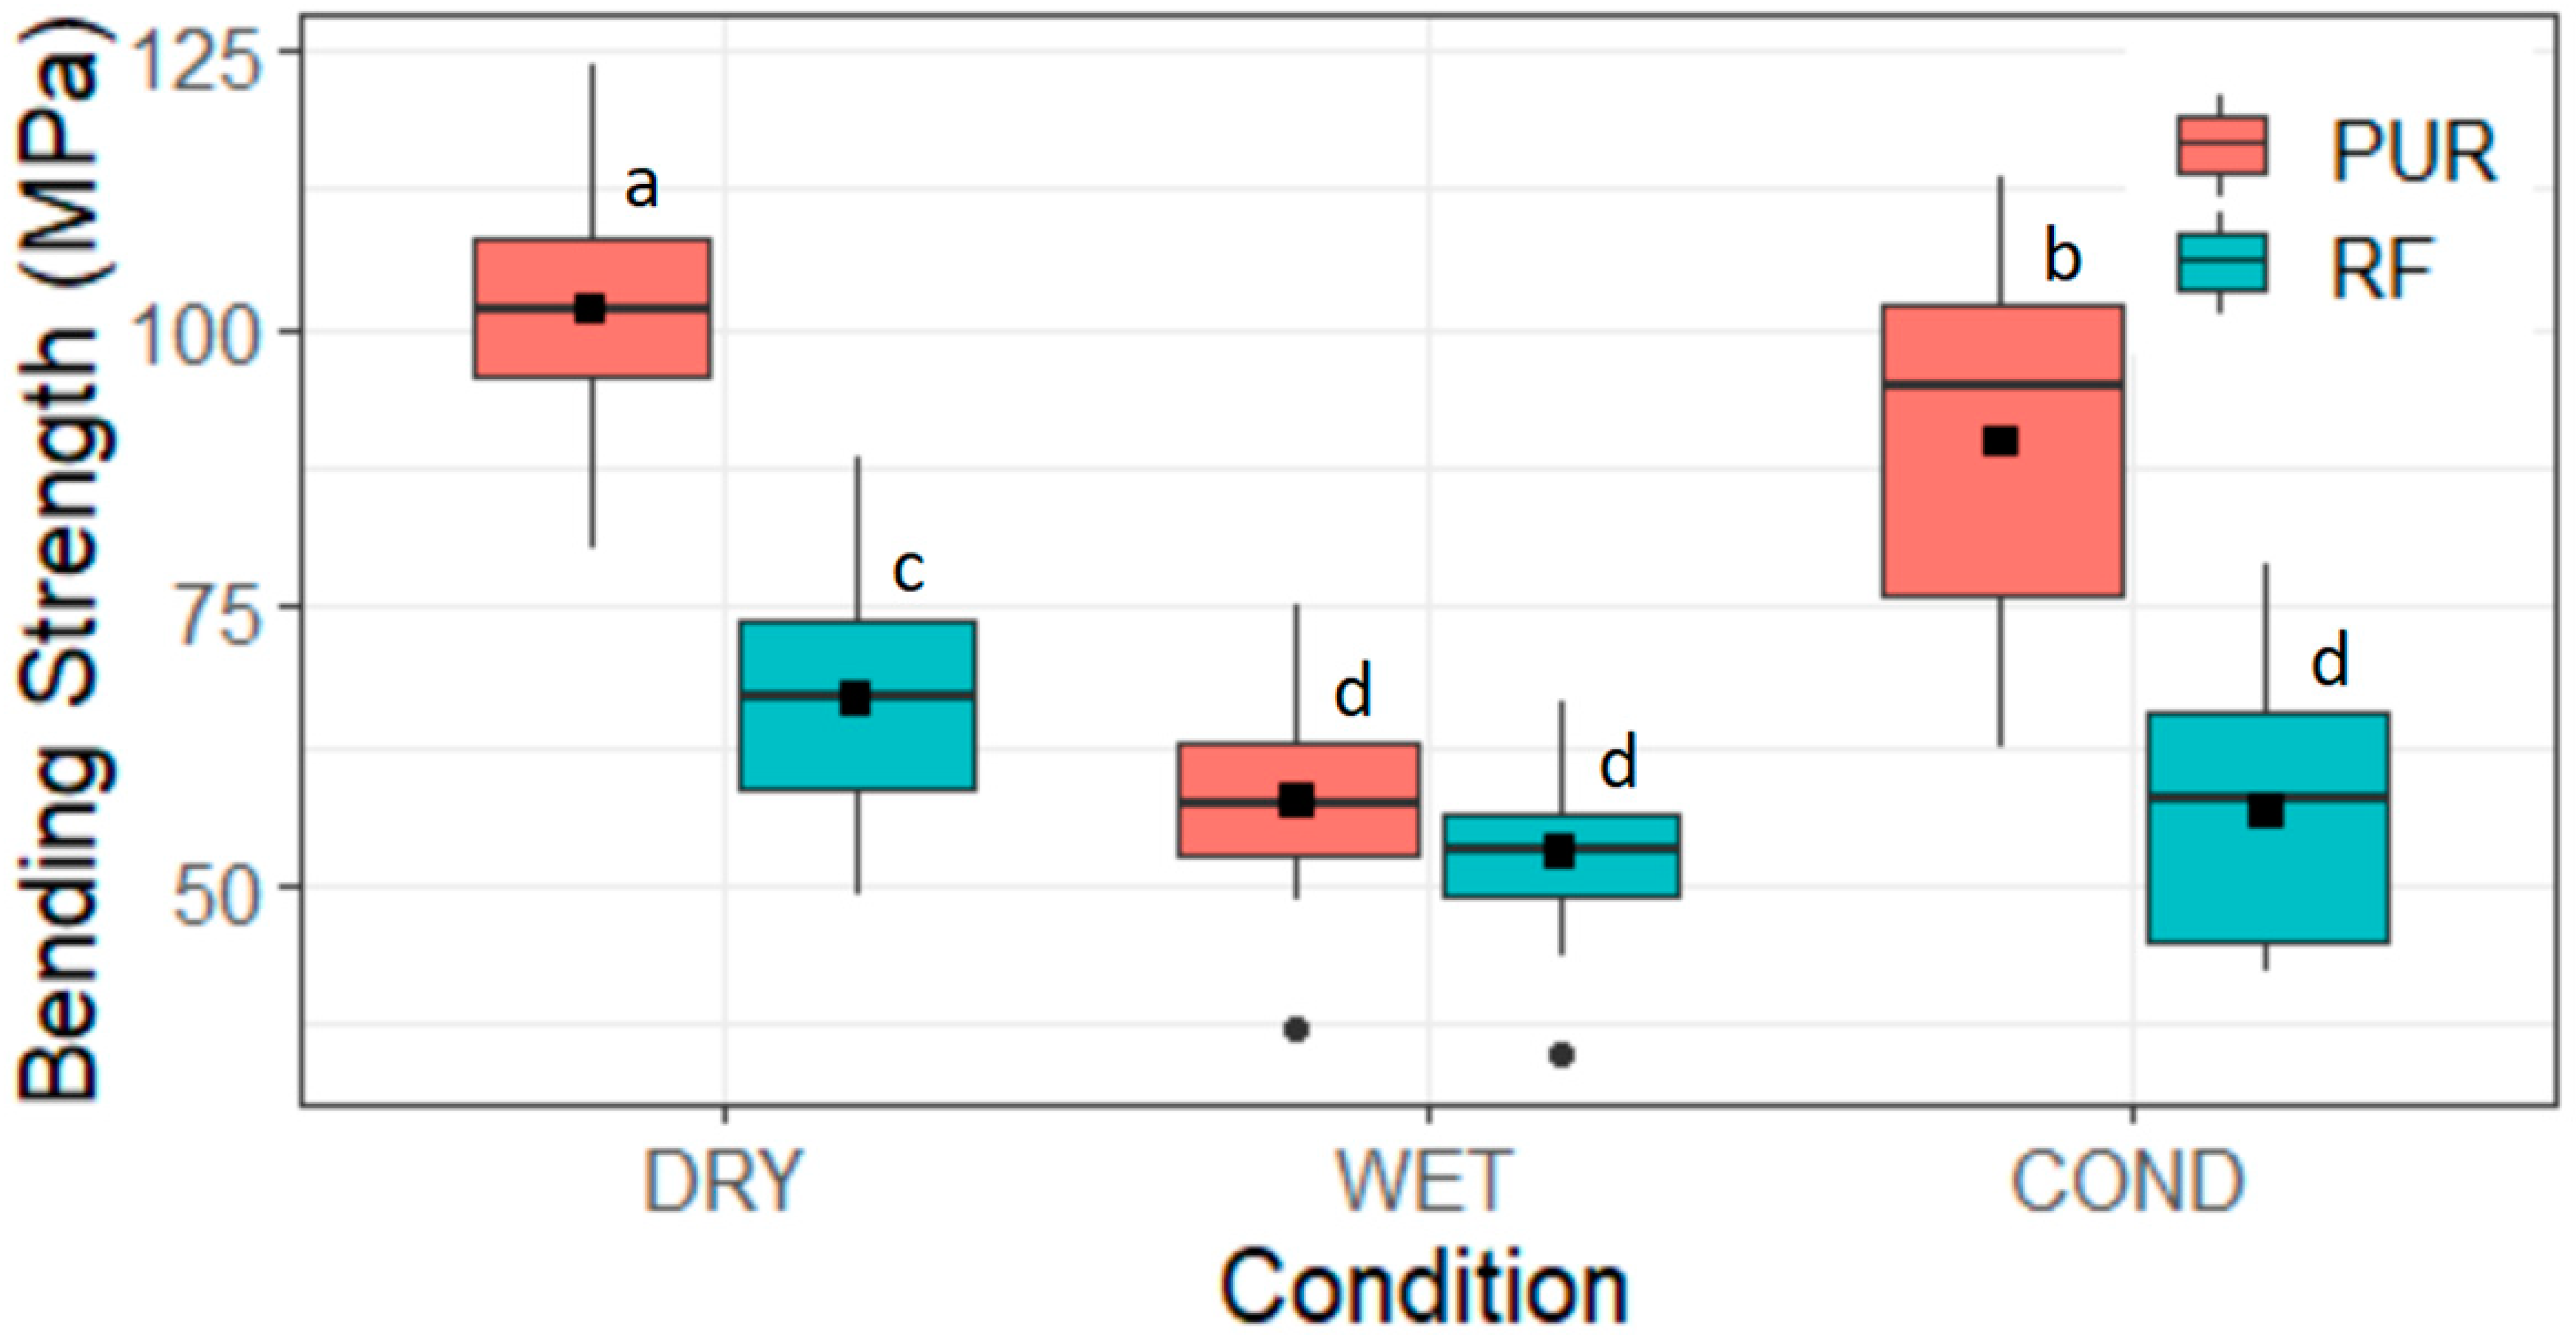
3.1. Bending Strength

Figure 4, Figure 5, Figure 6 and Figure 7 present the distribution of MOR values for each tested treatment and manufacturing configuration for SPG and DSK, respectively.
A normal distribution was found for all treatment conditions, species types, and joint sizes, except for the PUR DRY configuration (Figure 5). The PUR DRY was found to be not normally distributed due to two outliers, which upon inspection, showed defects (knots) near the FJ. These contributed to failure initiated at the defect point, and, therefore these samples had been removed from further analysis. The results of Figure 4 present an unexpected result in the RF samples between DRY and COND test treatments where the COND produces a higher mean when compared with the DRY. Figure 5 presents no significant change between RF WET and COND indicated by the same subscript value on the distribution plots.
The data presented in Figure 6 and Figure 7 for DSK indicate a normal distribution for all treatment conditions as suggested by the Shapiro–Wilk normality test (p-value = 0.37). The comparison of RF WET and COND presented in Figure 7 indicates no significant difference between datasets. A summary of the data presented in Figure 4, Figure 5, Figure 6 and Figure 7 is detailed in Table 3.
From the results presented in Figure 4, Figure 5, Figure 6 and Figure 7, a number of observations can be made related to the MOR of each of the tested configurations. These have been summarized below:
  • On the impact of FJ length, the 20 mm PUR DRY samples produced a significantly higher mean MOR value (p-value < 2.2 × 10⁻¹²) with an increase of 43% (SPG) and 47% (DSK) when compared to the 10 mm FJs. FJ length had a similar impact on the RF DRY samples with a mean MOR increase of 29% (SPG) and 24% (DSK) for the 20 mm joints when compared to the 10 mm. This observation was consistent across all testing conditions for the two species, adhesives, and joint types.
  • The 20 mm PUR FJs produced significantly higher MOR values (p-value < 2.0 × 10⁻¹⁶) with an increase of 34% and 19% (DSK) and 37% and 15% (SPG) for both DRY and COND, respectively, when compared with corresponding RF samples. The 10 mm PUR DRY results produced slight increases in MOR compared to RF DRY samples for SPG. The same comparison for PUR and RF DRY samples for DSK produced no significant difference (p-value > 0.05) for the 10 mm FJs. The 10 mm RF COND samples produced higher (p-value < 0.001) MOR values with an increase of 5% and 33% (DSK) and 14% and 15% (SPG) when compared to PUR COND.
  • In all treatment conditions, with the exception of the 20 mm DSK FJ, the variation in the distribution plots is lower for the PUR samples when compared to RF.
  • The impact of the COND phase of testing was measured by comparing the reversal in MOR loss from the WET phase. The reversal was largest for the PUR samples with SPG presenting a 36% and 42% (10 and 20 mm) increase and DSK presenting a 19 and 36% (10 and 20 mm) increase. RF samples showed a minimal reversal in MOR loss for the 10 mm FJs (for both SPG and DSK) and no significant difference in MOR for the 20 mm FJs.
The results indicating an increase in MOR capacity with an increased finger length are consistent with the data presented in the literature where Smardzewski [5] discussed the advantages of longer finger lengths in stress distribution. It was also found by Rao et al. [8] that the slope of the finger cutters had an effect on the joint performance, regardless of the length (found when comparing 28.3, 15.9, and 12.7 mm joints). For the experiments discussed in this paper, the finger slope was fixed based on the supplied cutters. The higher DRY strength produced by the PUR adhesive for both SPG and DSK is consistent with the results of Muller et al. [22]. Klausler [25] highlighted the ability of 1C-PUR adhesives to reverse strength loss post-wetting and after re-drying, reinforcing the findings of this section specifically, as well as the following MOE results.

3.2. Bending Stiffness (MOE) Results

The results presented in Table 4 contain the MOE (MPa) separated into the tested conditions of DRY, WET, and COND. The results are summarized as the mean and COV for the measured dataset.
The results of Fisher’s LSD testing indicate a number of groupings where no significant change exists as indicated by the subscript letters used in Table 3 (p-value > 0.05). The MOE (MPa) is influenced by the various treatments as the WET tests show a decrease in MOE compared to DRY followed by an increase (or reverse in loss) for the COND tests. When comparing DRY and WET, a significant decrease in MOE is noted with PUR SPG presenting 30% and 16% (10 and 20 mm) mean decreases and DSK presenting 12% and 30% (10 and 20 mm) mean decreases. The RF samples also produced significant decreases in MOE with 13% and 31% (10 and 20 mm) mean decreases and DSK presenting 35% and 32% (10 and 20 mm) mean decreases. From the mean differences, the RF samples experience a larger decrease in MOE when compared to the PUR samples.
The PUR samples for both SPG and DSK present no significant difference when comparing DRY and COND results for both the 10 and 20 mm FJ size with mean differences for SPG of 3.7% and 3.0% (10 and 20 mm) and of 0 and 2.2% (10 and 20 mm) for DSK. The RF SPG samples present no significant change between DRY and COND for both 10 and 20 mm FJs. However, the 10 mm RF DSK samples produce a significant difference between DRY and COND but no significant difference was noted for the 20 mm RF DRY samples.
When comparing the impact of FJ length, there is no significant difference (p-value > 0.05) between RF DRY samples (both SPG and DSK with 10 and 20 mm FJs) and PUR DRY 20 mm DSK samples. Across both 10 and 20 mm FJs for both species, MOE reported from PUR DRY sample testing is slightly lower than RF DRY samples. The comparison to Muller et al. [22] reinforces the finding that MOE of the PUR samples is slightly lower than the RF samples, as was present across the three tested conditions of DRY, WET, and COND. The findings of Klausler [25] confirmed the observations regarding MOR loss reversal through conditioning and thus would suggest a reversal in changes to stiffness would be linked. The decrease in mechanical performance for 1C-PURs being higher than that observed in RF was also reinforced by Klausler [25].

3.3. Wood Fibre Amount (WFA) Results

The results of the visually evaluated WFA are summarized in Table 5. The results are presented as the mean and maximum values of the WFA (%).
The results of the Shapiro–Wilk normality test indicated that the distribution of the datasets was significantly different (p-value < 2.47 × 10⁻¹²) from a normal distribution. Because of this, the Fisher LSD test was not conducted. Figure 8 presents an example of the separated FJs from which the WFA was obtained through visual evaluation. Figure 8 provides six example joints and their corresponding WFA for the readers’ information.
A decrease in the WFA is noted between DRY and WET conditions for both species, joint size, and adhesive types. Table 4 shows a difference between the two finger lengths, where a 20 mm FJ is more likely to result in a higher area of WFA compared to a 10 mm FJ, regardless of the adhesive and species. Comparing mean values, the RF SPG samples produce higher percentages of WFA for the three testing conditions when compared with the mean results from the PUR samples for both 10 and 20 mm FJs. The DSK samples produce higher mean percentages of WFA for the PUR 20 mm samples when compared with the RF 20 mm samples. The change in joint slope that comes with an increased finger length (between the 10- and 20 mm joint lengths) may have contributed to failures closer to the finger base in some instances as observed during testing of the 20 mm joints. The increased WFA for the 20 mm joints compared to the 10 mm is consistent across the three testing conditions for the two adhesives and two species used.
It was also noted that the DSK groups recorded higher mean WFA’s, when compared against the SPG samples. Comparing WET and COND WFA, the re-conditioning of samples appears to result in additional WFA. This observation is particularly interesting for the PUR samples with increases of 40% to 70% in WFA measured for both SPG and DSK across the two joint profiles. The RF samples measured increases in WFA of 30% to 50% for the SPG samples, while the DSK samples presented a 0% to 17% decrease in measured WFA, all between WET and COND. As presented in the literature [16,17,18], the bonding of high-density wood species such as SPG and DSK can result in a lack of wood fibre being obtained in the bonded interface (across both finger jointing and face lamination). As such, it is expected that the WFA results show low percentages of wood fibre across all permutations. The longer finger lengths appear to lead to increased WFA, most likely due to the increased surface area being bonded [5,22].

4. Conclusions

This study investigated the performance of finger-jointed sub-tropical native hardwood species (SPG and DSK) across three testing conditions (DRY, WET, and COND), two FJ geometries (10- and 20 mm finger length), and two adhesive types (PUR and RF). The hypothesis drawn from the literature that MOR strength reversal was possible post-WET through specimen conditioning (COND) was proven for both adhesives, joint sizes, and species types. PUR test specimens regained MOR to within 36% (10 mm SPG), 19% (10 mm DSK), 42% (20 mm SPG), and 36% (20 mm DSK) of DRY samples. RF samples regained MOR to within 20% (10 mm SPG), 44% (10 mm DSK), 12% (20 mm SPG), and 15% (20 mm DSK) of DRY samples.
The 20 mm FJs compared to the 10 mm joints resulted in significantly higher (p-value < 2.2 × 10⁻¹⁶) MOR values for both species and adhesive types tested with the PUR DRY results for both species and joint sizes being higher than the RF results. Typically, the MOR variation in the distribution plots was lower for the PUR samples when compared to RF. This was consistent across both 10 and 20 mm FJ samples and across both species. Based on the sample population evaluated through this study, there was a relationship between MOR, MOE, and WFA loss when comparing results from DRY- and WET-tested conditions. There was also a reversal relationship across those three parameters where the MOR, MOE, and WFA loss measured for these properties was reversed once the COND samples were dried from the WET condition. Although this reversal was noted for all permutations, a significant impact was noted for the PUR-type samples when compared to the RF.
A trend was observed for the change in MOE where the PUR samples for both species and joint sizes produced a slightly lower result when compared with the RF samples. Changes in WFA found the PUR-type adhesive for both FJ profiles and species to produce a measured WFA increase between the WET and COND samples. WFA measurements showed that DSK samples returned higher values than the SPG samples with the 20 mm joints producing higher WFA values across both species and adhesives. The findings presented through this study provide a testing method for high-density hardwood species that, due to their anatomical nature, do not meet the wood fibre criterion of the product testing standards (such as AS 5068). The method presents validated data for two high-density hardwood species and two structural adhesives indicating the presence of wood fibre has minimal effect on the MOR in a dry, wet, or re-conditioned state.

Author Contributions

Conceptualization and methodology development, R.L.M. and A.F.; specimen manufacture, A.F.; validation, A.F.; formal analysis, A.F., C.K., B.P.G., R.L.M. and W.L.; writing—original draft preparation, A.F.; writing, review and editing, W.L., C.K., B.P.G. and A.F.; project administration, R.L.M.; funding acquisition, R.L.M. All authors have read and agreed to the published version of the manuscript.

Funding

This research was funded through a DAF led collaborative research project with the Australian Centre for International Agricultural Research (ACIAR) titled “Coconut and other non-traditional forest resources for the manufacture of Engineered Wood Products” Project code: FST/2019/128. The research project focuses on the regional development and expansion of timber engineering applications in remote Asia-Pacific islands.

Institutional Review Board Statement

Not applicable.

Informed Consent Statement

Not applicable.

Data Availability Statement

Available upon request from authors.

Acknowledgments

The authors would like to acknowledge the support of the Queensland Government Department of Agriculture and Fisheries (DAF) and the technical staff and resources made available at the Salisbury Research Facility (SRF). The support and timber provision of industry research partner Robertson Bros Sawmills Pty. Ltd. and Parkside Timber Pty. Ltd. has ensured the impact of this research is applicable to the industry. Furthermore, acknowledgements to the technical expertise of Rodney Vella, technical expert from Jowat Adhesives for his advice and assistance with adhesive selection, supply and use for this research project. Along with Tony Dakin and Andrew Outhwaite for his advice and assistance towards timber engineering, design, and manufacture.

Conflicts of Interest

The authors declare no conflict of interest.

References

  1. Bootle, K. Wood in Australia; McGraw-Hill Book Company: Sydney, Australia, 1983; Volume 1, p. 443. [Google Scholar]
  2. Jokerst, R.W. Finger-Jointed Wood Products; Forest Products Laboratory—USDA Forest Services: Madison, WI, USA, 1981; pp. 1–24.
  3. Serrano, E.; Gustafsson, J.; Larsen, H. Modelling of finger-joint failure in glued-laminated timber beams. J. Struct. Eng. 2001, 127, 914–921. [Google Scholar] [CrossRef]
  4. Milner, H.; Yeoh, E. Finite element analysis of glued timber finger joints. J. Struct. Eng. 1991, 117, 755–766. [Google Scholar] [CrossRef]
  5. Smardzewski, J. Distribution of stresses in finger joints. Wood Sci. Technol. 1996, 30, 477–489. [Google Scholar] [CrossRef]
  6. Lara-Bocanegra, A.; Majano-Majano, A.; Crespo, J.; Guaita, M. Finger-jointed Eucalyptus globulus with 1C-PUR adhesive for high performance engineered laminated products. Constr. Build. Mater. 2017, 135, 529–537. [Google Scholar] [CrossRef]
  7. Ahmad, Z.; Lum, W.; Lee, S.; Razlan, M.; Mohamad, W. Mechanical properties of finger jointed beams fabricated from eight Malaysian hardwood species. Constr. Build. Mater. 2017, 145, 464–473. [Google Scholar] [CrossRef]
  8. Rao, S.; Gong, M.; Chui, Y.H.; Mohammad, M. Effect of Geometric Parameters of Finger Joint Profile on Ultimate Tensile Strength of Single Finger-Jointed Boards. Wood Fiber Sci. 2012, 44, 263–270. [Google Scholar]
  9. Kretschmann, D.E. Wood Handbook—Mechanical Properties of Wood; Forest Products Laboratory—USDA Forest Services: Madison, WI, USA, 2010; pp. 100–145.
  10. Ayarkwa, J.; Hirashima, Y.; Sasaki, Y. Effect of finger geometry and end pressure on the flexural properties of finger-jointed tropical african hardwoods. For. Prod. J. 2000, 50, 53–63. [Google Scholar]
  11. Habipi, B.; Ajdinaj, D. Wood Finger-Joint Strength as Function of Finger Length and Slope Positioning of Tips. Int. J. Eng. Appl. Sci. (IJEAS) 2015, 2, 128–132. [Google Scholar]
  12. Sterley, M.; Serrano, E.; Enquist, B.; Hornatowska, J. Finger jointing of freshly sawn Norway spruce side boards—A comparative study of fracture properties of joints glued with phenol-resorcinol and one-component polyurethane adhesive. In Materials and Joints in Timber Structures; RILEM Bookseries; Springer: Dordrecht, The Netherlands, 2014; Volume 9. [Google Scholar]
  13. Dziurka, D.; Kulinski, M.; Trocinski, A.; Radoslaw, M. Posibility to use short sawn timber in the product of glued laminated beams. Materials 2022, 15, 2992. [Google Scholar] [CrossRef]
  14. AS/NZS8008; Timber—Finger-Jointed Structural Timber—Performance Requirements. Standards Australia/Standards New Zealand: Sydney, Australia, 2022.
  15. AS5068; Timber—Finger Joints in Structural Products—Production Requirements. Standards Australia: Sydney, Australia, 2006.
  16. Leggate, W.; McGavin, R.; Outhwaite, A.; Gilbert, B.; Gunalan, S. Barriers to the Effective Adhesion of High-Density Hardwood Timbers for Glue-Laminated Beams in Australia. Forests 2022, 13, 1038. [Google Scholar] [CrossRef]
  17. Leggate, W.; McGavin, R.; Miao, C.; Outhwaite, A.; Chandra, K.; Dorries, J.; Kumar, C.; Knackstedt, M. The influence of mechanical surface preparation methods on southern pine and spotted gum wood properties: Wettability and permeability. BioResources 2020, 15, 8554–8576. [Google Scholar] [CrossRef]
  18. Leggate, W.; McGavin, R.; Outhwaite, A.; Kumar, C.; Faircloth, A.; Knackstedt, M. Influence of mechanical surface preparation methods on the bonding of southern pine and spotted gum: Tensile shear strength of lap joints. BioResources 2021, 16, 46–61. [Google Scholar] [CrossRef]
  19. Klausler, O.; Rehm, K.; Elstermann, F.; Niemz, P. Influence of wood machining on tensile shear strength and wood failure percentage of one-component polyurethane bonded wooden joints after wetting. Int. Wood Prod. J. 2013, 5, 18–26. [Google Scholar] [CrossRef]
  20. Serrano, E. Adhesive Joints in Timber Engineering. Modelling and Testing of Fracture Properties. Ph.D. Thesis, Lund University, Lund, Sweden, 2000. [Google Scholar]
  21. ASTMD4688; Standard Test Method for Evaluating Structural Adhesives for Finger Jointing Lumber. ASTM International: West Conshohocken, PA, USA, 2005.
  22. Muller, U.; Veigel, S.; Follrich, J.; Gabriel, J. Performance of One-Component Polyurethane in Comparison to Other Wood Adhesives. In Proceedings of the International Conference on Wood Adhesives 2009, Lake Tahoe, NV, USA, 28–30 September 2009. [Google Scholar]
  23. AS1720.1; Timber Structures—Design Methods. Standards Australia: Sydney, Australia, 2010.
  24. AS/NZS1328.1; Glued Laminated Structural Timber, Part 1, Performance Requirements and Minimum Production Requirements. Standards Australia/Standards New Zealand: Sydney, Australia, 1998.
  25. Klausler, O. Improvement of One-Component Polyurethane Bonded Wooden Joints Under Wet Conditions; ETH Zurich DISS ETH NO 22157; ETH Zurich: Zurich, Switzerland, 2014. [Google Scholar]
  26. AS/NZS4063.2; Characterisation of Structural Timber, Part 2, Determination of Characteristic Values. Standards Australia/Standards New Zealand: Sydney, Australia, 2010.
  27. AS/NZS4063.1; Characterisation of Structural Timber, Part 1, Test Methods. Standards Australia: Sydney, Australia, 2010.
Figure 1. Service class exposure scenario AS5068 [15].
Forests 14 00956 g001
Figure 2. Geometric parameters of FJs according to AS5068 [15].
Forests 14 00956 g002
Figure 3. Experimental test setup schematic [15].
Forests 14 00956 g003
Figure 4. MOR distribution for SPG with 10 mm fingers. Box distributions followed by the same letter are not significantly different (p-value > 0.05).
Forests 14 00956 g004
Figure 5. MOR distribution for SPG with 20 mm fingers. Box distributions followed by the same letter are not significantly different (p-value > 0.05).
Forests 14 00956 g005
Figure 6. MOR distribution for DSK with 10 mm fingers. Box distributions followed by the same letter are not significantly different (p-value > 0.05).
Forests 14 00956 g006
Figure 7. MOR distribution for DSK with 20 mm fingers. Box distributions followed by the same letter are not significantly different (p-value > 0.05).
Forests 14 00956 g007
Figure 8. Example of separated finger joints showing exposed surfaces for visual wood fibre assessment, (A) DSK 10 mm RF joint with 25% WFA, (B) DSK 10 mm PUR joint with 5% WFA, (C) SPG 20 mm PUR joint with 80% WFA, (D) SPG 20 mm RF joint with 70% WFA, (E) SPG 10 mm RF joint with 0% WFA, and (F) SPG 10 mm RF joint with 0% WFA.
Forests 14 00956 g008
Table 1. Number of specimens tested per configuration.
Species *Joint TypeAdhesiveTest Condition
DRYWETCOND
SPG10 mmPUR151515
20 mmPUR151515
10 mmRF151515
20 mmRF151515
DSK10 mmPUR151515
20 mmPUR151515
10 mmRF151515
20 mmRF151515
* Each joint length and species were manufactured using both PUR and RF adhesive types.
Table 2. Finger configurations.
Finger ConfigurationsValues
Cutter Size10 mm20 mm
Length (L)—mm7.7717.91
Pitch (p)—mm3.676.02
Fingertip (b)—mm1.151.42
Slope (s)—mm/mm0.088 (~1:12)0.089 (~1:12)
Table 3. Summary of MOR data from joint testing.
Properties SPG DSK
PURRFPURRF
10 mm20 mm10 mm20 mm10 mm20 mm10 mm20 mm
Dry Conditions (DRY)
Mean (MPa) 59.1102.850.984.053.6101.750.966.7
COV (%) 8.123.314.926.513.011.719.815.6
Wet Conditions (WET)
Mean (MPa) 33.950.345.471.524.257.632.353.0
COV (%) 9.518.922.231.912.016.417.016.4
Re-Dry Conditions (COND)
Mean (MPa) 52.686.161.973.130.089.544.956.8
COV (%) 17.811.322.735.28.518.522.721.2
Table 4. Summary results of MOE for all FJ test samples. Means followed by the same subscript letter are not significantly different (p-value > 0.05).
Properties SPG DSK
PURRFPURRF
10 mm20 mm10 mm20 mm10 mm20 mm10 mm20 mm
Dry Conditions (DRY)
Mean (MPa) 14,761 c15,750 b17,269 a16,909 a15,254 b16,718 a17,470 a17,304 a
COV (%) 14%14%8%15%11%9%7%6%
Wet Conditions (WET)
Mean (MPa) 10,211 d13,311 c15,088 bc11,621 d13,447 c11,757 c11,307 d11,732 c
COV (%) 25%14%16%18%8%22%24%11%
Re-Dry Conditions (COND)
Mean (MPa) 14,227 bc15,273 b16,586 ab16,356 ab15,243 b16,358 ab13,632 bc16,375 ab
COV (%) 13%17%7%10%16%9%24%8%
Table 5. Summary results of WFA of the evaluated FJs tested in the previous section.
PropertiesSPGDSK
PURRFPURRF
10 mm20 mm10 mm20 mm10 mm20 mm10 mm20 mm
Dry Conditions (DRY)
Mean (%)2636156334524
Maximum (%)1025703520606070
Wet Conditions (WET)
Mean (%)05715018217
Maximum (%)552550050580
Re-Dry Conditions (COND)
Mean (%)41210191025414
Maximum (%)56025502550535
Disclaimer/Publisher’s Note: The statements, opinions and data contained in all publications are solely those of the individual author(s) and contributor(s) and not of MDPI and/or the editor(s). MDPI and/or the editor(s) disclaim responsibility for any injury to people or property resulting from any ideas, methods, instructions or products referred to in the content.

