Article

Assessing the Effects of Different Harvesting Practices on the Forestry Sector’s Climate Benefits Potential: A Stand Level Theoretical Study in an Eastern Canadian Boreal Forest

Renewable Materials Research Center, Faculty of Forestry Geography and Geomatics, Laval University, Quebec City, QC G1V 0A6, Canada
*
Author to whom correspondence should be addressed.
Forests 2023, 14(6), 1109; https://doi.org/10.3390/f14061109
Submission received: 20 April 2023 / Revised: 22 May 2023 / Accepted: 23 May 2023 / Published: 26 May 2023
(This article belongs to the Section Forest Ecology and Management)

Abstract

:
The contribution of the forest sector to climate change mitigation needs to rely on optimal strategies that include forest management, wood supply, wood product disposal, and replacement of GHG-intensive materials and energy sources. Our study aimed to assess the impact of alternative forest management practices applied at the stand scale on the capacity of the forest sector to reduce its radiative forcing, using the boreal forests of eastern Canada as a case study. We simulated management of a balsam fir–white birch stand over a sixty-year period and determined the sectorial carbon and radiative forcing budget for a reference scenario (no harvest) and for nineteen clearcut and partial cut alternatives. The results suggest that logging may not significantly reduce carbon emissions compared to a preservation practice and does not yield any climate benefits in terms of radiative forcing. In a context for which the substitution effect of wood products on markets is expected to be limited, the mitigation potential of a scenario is mostly driven by the capacity of the forest ecosystem carbon sink to compensate for the substantial CO 2 and CH 4 emissions from wood product decay in landfills. The improved assessment of carbon emission temporality, incorporation of ecosystem carbon dynamics, and improved consideration of substitution and the decay of wood products are essential in the development of any forest management strategy. Neglecting these elements can lead to misconceptions and prevent informed mitigation decisions.

1. Introduction

Forestry-based climate change mitigation has become a crucial aspect of the Paris Agreement, potentially accounting for up to a quarter of the total planned reductions in emissions [1]. To effectively reduce greenhouse gas (GHG) emissions and achieve the climate change mitigation targets outlined in international agreements, efforts must be made to enhance natural carbon sinks and reduce emissions. This can be achieved in the forest sector by increasing carbon sequestration in forest ecosystems, reducing emissions from the decay of wood-based products at their end-of-life and expanding the use of wood-based products to replace materials and energy sources that rely heavily on fossil fuels and emit high levels of GHGs [2,3].
In the boreal biome, managed forests cover large territories, and communities are built around well-established wood processing industries. The relationship between forest ecosystems and industrial networks enables the use of wood products to fulfill material and energy demand for domestic and international markets, thereby offering potential for mitigating climate change [4]. Therefore, various initiatives have been launched by both scientists and professionals to develop forest management and wood production practices that can contribute to climate change mitigation.
The literature for the boreal forests of eastern Canada suggests that a reduction in the volume of harvested wood from forest ecosystems at a landscape or regional scale may be an effective approach for climate change mitigation [5,6]. The carbon dynamics at the landscape level may vary from those at the stand level due to the impact of different factors, especially the age class distribution of different stands and divergent tree growth rates [7]. Assessing carbon dynamics at the stand level is crucial as it enhances the understanding of expected large-scale trends. However, given the scarcity of field-scale carbon studies for alternative forest management practices in the boreal forests of eastern Canada, the simulation of these practices and their impact on the carbon budget and radiative forcing of the forest sector needs to be conducted.
Clearcutting of boreal forests have been shown to result in a period of net emissions to the atmosphere following harvest, as the annual emissions from organic matter decomposition are greater than the annual carbon sequestration from photosynthesis for at least 10 years [8,9,10]. Conversely, continuous-cover forestry based on partial cuts is associated with reduced fluctuations in the net ecosystem production by preserving stocks of dead organic matter (DOM) [6,11] and promoting the growth of residual trees [12,13,14].
Continuous-cover forestry may enable a continuous accumulation of carbon in the ecosystem while still maintaining a level of wood production and substitution of products in the market [15]. Employing partial cutting could enhance forest carbon sequestration and preserve greater soil carbon stocks compared to clearcutting. Such forest carbon benefits have been observed across various biomes, including boreal, subtropical, and tropical regions [11].
Ecosystem dynamics after a partial cut are subject to uncertainties that must be considered in any stand-level carbon simulation. The first challenge is the lack of field data on carbon dynamics after partial cutting in the boreal biome. A second important consideration is strongly tied to the survival of residual trees, as increased losses through mortality could impact the next timber production [16] and generate emissions from wood decomposition. In the absence of fire or insect outbreaks, a high proportion of this mortality can be due to windthrow [16], which may vary along the stand vulnerability to it [17,18].
The goal of forest management to produce wood products for markets should not overlook the potentially high emissions from the decay of wood products at the end of their service life. Although the climate benefit of long-lived wood products (sawnwood) on GHG emissions can be substantial [5,19], a portion of the biogenic carbon from all wood products may still be released into the atmosphere as carbon dioxide (CO 2 ) and methane (CH 4 ), in proportions depending on the end-of-life conditions [20]. The global warming potential (GWP100) of CH 4 over a 100-year horizon is 25 [21]. Wood products with a high rate of decay in landfills and a high rate of methane emissions, such as pulp and paper [20], may have a detrimental impact on the carbon budget of the forest sector. Additionally, these products tend to have limited substitution effects, which is a crucial element for achieving climate mitigation targets [22,23,24], despite uncertainties surrounding the real substitution impact [25,26]. It is therefore important to consider the type of harvest that may result in the production of different assortments of wood products.
When evaluating an alternative carbon management strategy, it is necessary to consider actions relative to a reference scenario. To calculate the potential carbon mitigation benefit of a given alternative practice, only the difference in GHG emissions between the alternative scenario and the reference scenario should be taken into account [5,27].
To maintain temporal consistency in the assessment of mitigation potential, it is essential to consider the radiative forcing effects of biogenic carbon-based strategies [28,29]. As the balance between emissions and removals over a specified time period does not necessarily have a neutral effect on the climate, combining static and dynamic radiative forcing assessments can provide a more accurate representation of the impact of alternative biogenic carbon management strategies [30].
Our study sought to assess and compare the effects of different harvesting practices on the climate change mitigation potential of the forest sector. This assessment was based on the carbon balance and associated radiative forcing of carbon emissions and removals from forest ecosystems, wood product decay, and product substitution on markets. The analysis was performed at the stand level for stands typical of the boreal balsam fir–white birch landscapes of eastern Canada, an economically significant area for the North American forest industry.

2. Materials and Methods

2.1. Case Study Area

Scenarios were simulated on theoretical one-hectare stands based on data from the Montmorency Forest in the province of Quebec (Canada). The Montmorency Forest is located in the boreal zone, more specifically in the balsam fir (Abies balsamea)—white birch (Betula papyrifera) bioclimatic domain of Quebec [31], characterized by a cold and humid climate. Forest stands are dominated by balsam fir and white birch, with a small component of white and black spruces (Picea glauca and Picea mariana). Soils are mainly classified as ferro-humic podzols with a mor humus of 10–15 cm and often exhibit seepage due to the hilly topography.
Clearcut harvesting with protection of regeneration and soils has been the main type of logging in boreal forests of Quebec, including in the Montmorency Forest. However, over the past years, several partial cut alternatives have been tested for different research projects and more broadly in line with the management strategy of the Montmorency Forest. While an analysis of carbon dynamics following clearcut can be found in the scientific literature for the Montmorency Forest [9], such a study does not yet exist for partial cut practices due to the lack of field data over a sufficient length of time.

2.2. Forest Management Framework

We used a Natural evolution scenario (no harvest) as the reference forest management scenario in our simulations. We started all our forest ecosystem simulations on a mature stand, 60 years after the last clearcut, representing past practices of the Montmorency Forest and the current silvicultural rotation period. We then simulated one reference scenario (named Natural evolution), one clearcut scenario, and three different partial cut harvest types (named Clearcut + Partial cut (30%), Partial cut (30%) + Partial cut (30%), and Partial cut (40%) + Clearcut). A partial cut of X% is equivalent to a volume harvest of X% of the initial stand. Each scenario was simulated for a period of 60 years. If applicable, the second cut during the period always occurred 30 years after the initial cut, except for the Partial cut (40%) + Clearcut, for which it was simulated to occur after 35 years (Figure 1).
As no data on carbon dynamics were available for partial cuts at the Montmorency Forest, several assumptions related to the windthrow proportions of the post-harvested stand (0% for X_1_X scenarios and 50% for X_2_X scenarios) and to carbon dynamics of dead organic matter and living biomass were simulated (Figure 1). At each harvest event, an amount of carbon was extracted from the ecosystem in the form of harvested wood and assumed to be transferred to wood products.
As a result, 20 different scenarios were simulated over a 60-year period (Figure 1). In this study, no climate change or natural disturbances were considered, as the focus was put on the theoretical impact of the alternative harvest type on the forest sector mitigation potential.

2.3. Wood Products Framework

Harvested wood was assumed to be processed and manufactured into wood products. Baskets of wood products were projected using distinct portfolios of products based on tree species and their average diameter class according to regionalized product allocation matrices (Modèle d’évaluation de rentabilité des investissements sylvicoles—MERIS model) from the Timber Marketing Office of the Quebec Ministry of Natural Resources and Forests [32]. In this study, we did not simulate wood product exports to other jurisdictions; all harvested wood was assumed to be used and landfilled within the province.
In our analysis, we accounted for the additional diameter growth resulting from partial cuts compared to the reference scenario. We added between one (2 cm) and two (4 cm) diameter classes to the mean diameter, which was based on field data compiled from harvested trees.

2.4. Modelling

2.4.1. Forest Ecosystems

We used equations for the evolution of forest carbon pools over an 80-year chronosequence following the clearcut harvest of a boreal balsam fir forest relevant to our study territory [9]. Data in Senez-Gagnon et al. [9] were collected along a chronosequence of forest stands regenerated after clearcut harvest. The chronosequence included 36 plots that spanned from 1 to 80 years after the harvest took place. All plots shared the same ecological classification, soil type, and drainage. The evolution of live tree woody biomass and foliage was fitted according to the Chapman–Richards equation. For the remaining ecosystem pools, a selection of linear and nonlinear model forms was tested in order to determine those that best fitted the observed patterns of variation of the raw data over time. In our simulations, we simulated only pools for which a statistically significant model was found, i.e., carbon pools consisting of the “Live trees”/“Tree foliage”/“L horizon”/“Roots” pools and DOM pools consisting of the “Downed woody debris”/“Stumps”/“Snags”/“Buried wood” pools from Senez-Gagnon et al. [9]. Soil carbon pools (FH and mineral horizons) were not simulated, as they were assumed to stay stable following harvest. Soil type, drainage, and site productivity were assumed to be the same across all simulations and represented the most common ecological conditions found in the Montmorency Forest [9].
Concerning carbon biomass dynamics assumptions, we simulated different alternatives for each stand after a partial cut (pale orange boxes in Figure 1); the Default (a) alternative carbon dynamics were based on Senez-Gagnon et al. [9] for clearcut. The DOM stable (b) alternative modified the Default (a) by keeping DOM pools stable after the cut (no loss or gain in the dead organic matter pool). Finally, the DOM stable + Vegetation stable (c) alternative modified the Default (a) by stabilizing all carbon pools (stable DOM and living carbon stocks). If a clearcut event was simulated in any scenario, all associated carbon dynamics were modelled according to Senez-Gagnon et al. [9].
A set of assumptions was used to represent windthrow occurrence in stands, described as the proportion of the stand affected by windthrow. These assumptions were represented in our model as disturbances that either caused no damage (0%) or resulted in a 50% mortality of the post-harvested stand. When a scenario name included “1”, we simulated 0% windthrow, and when it included “2”, we simulated 50% windthrow (Figure 1). A maximum value of 50% was chosen based on the assumption that it represents an extreme disturbance event for the area but not a stand-replacing-one. We simulated wood decomposition following windthrow in forests by using equations from the Carbon Budget Model of the Canadian Forest Sector [33]. We did not account for a possible delay in regeneration due to the windthrow disturbance.
We used field data on harvested trees after partial cuts in the Montmorency Forest to estimate the volume of wood extracted for each harvest and for each scenario. To estimate the volume extracted from a clearcut, we used the same database and assumed that the entire initial stand had been harvested.
For the reference scenario (natural evolution without any harvest), we used equations from Senez-Gagnon et al. [9] to model ecosystem carbon dynamics up to year 20 of the simulation period (i.e., when the stand reaches 80 years old). After this period, we assumed that carbon stocks remained stable based on Harel et al. [34], a study that was also conducted in the Montmorency Forest on sites with an identical ecological classification.

2.4.2. Wood Products and Substitution

The annual harvested carbon was used as an input in a custom harvested wood products (HWP) model (QC HWP v2). QC HWP v2 is a modified version of QC HWP v1 [6] and incorporates provincial data from [20]. HWP model simulations were run using ANSE v0.9, developed by Natural Resources Canada.
This model tracks harvested carbon stocks and emissions during the service life of wood products and their end-of-life in landfills, based on wood product basket specifications and landfill settings. We tracked all carbon emissions from the decay of products regardless of their form (CO 2 and CH 4 ). Additional CH 4 emissions from wood combustion were also considered and transformed into carbon dioxide equivalent (CO 2 e). In our HWP model, emissions from wood product decay were calculated using a decomposition function with half-life values based on the Intergovernmental Panel on Climate Change (IPCC) default values [35] (2 years for pulp and paper products, 25 years for wood-based panels, and 35 years for sawn products). Emissions from wood harvested before the start of our simulations were not considered; the HWP stock was therefore assumed to be empty at the beginning of the simulations.
For end-of-life scenarios, a large part (99%) of solid wood products (sawnwood and panels) was assumed to be sent to landfills, while the rest was assumed to be incinerated (without energy capture) [5,6]. In landfills, 90% of solid wood products (sawnwood and panels) was assumed to be not degradable, while the other 10% was assumed to be degradable with a half-life of 11.7 years [20,36,37]. For pulp and paper, the proportions were 93% to landfills and 7% to incineration. In landfills, 50% was assumed to be not degradable, while the remaining 50% was assumed to be degradable with a half-life of 11.7 years [20,36,37]. Landfill carbon emissions were assumed to be comprised of 50% CO 2 and 50% CH 4 for all products [20,36,37]. CO 2 emissions were not captured and were therefore simulated as going directly to the atmosphere.
CH 4 emissions from wood product decomposition can be left unrecovered and released to the atmosphere, flared, or used as an energy carrier [5,6]. In our landfill carbon emission settings, produced internally by Natural Resources Canada, 66% of CH 4 emissions went to the unrecovered CH 4 stock, and 100% of this was released into the atmosphere in CH 4 form; 17% was flared, with 99.7% being released into the atmosphere in CO 2 form and 0.3% in CH 4 form. The remaining 17% went to energy, with 99.7% being released into the atmosphere in CO 2 form and 0.3% in CH 4 form. The global warming potential of CO 2 was assumed to be 1, and that of CH 4 was assumed to be 25 [21]. Carbon emissions (C) were converted into CO 2 or CH 4 (based on molar mass), and the GWP100 from landfill emissions was calculated.
The reduction in GHG emissions that can be achieved in markets through the substitution of fossil-based, non-renewable materials, and energy sources by wood products was determined using displacement factors (DF). This was carried out by comparing the fossil fuel emissions reported in life-cycle analyses of functionally equivalent wood-based vs. other products [38]. A DF is expressed as the amount of carbon emissions avoided per tonne of biogenic carbon in the wood product, measured in tonnes of carbon per tonne of carbon (tC/tC). We used the following DF values estimated for the province of Quebec: 0.91 tC/tC for sawnwood and 0.77 tC/tC for panels and other sawmill products [6,39]. The substitution effect was computed as a carbon sequestration (in tonnes of carbon dioxide equivalent [tCO 2 e]) during the year of wood harvest.
Fossil fuel emissions from the harvesting, transportation, and manufacturing of wood products, as well as emissions from bioheat production used internally by the forest sector, were already taken into account in the displacement factors; they were thus not computed separately.

2.5. Carbon Budget and Mitigation Potential

For our carbon accounting perimeter, we used the IPCC simple decay approach [37]. Our carbon budgets considered annual emissions and removal from the forest ecosystems, emissions from wood product decay and the substitution effect relative to the reference scenario in markets [37]. We also calculated the cumulative carbon budget of the forest sector for the simulated period in CO 2 e.
The mitigation potential of a given alternative scenario, i.e., its potential for reducing CO 2 e emissions, was calculated as the difference between its cumulative CO 2 e budget and the cumulative CO 2 e budget of the reference scenario. This method minimizes uncertainty and only focuses on the effects of mitigation measures [5,27]. A negative value for the mitigation potential of a given alternative scenario suggests that it would result in lower emissions or remove more emissions from the atmosphere compared to the reference scenario, creating a CO 2 e sink. Conversely, a positive value signifies that the scenario would result in higher emissions or sequester fewer emissions compared to the reference scenario, making it a CO 2 e source. To account for the mass of carbon harvested and processed into wood products relative to the reference, we also calculated the ratio of cumulative mitigation potential per tonne of carbon harvested.

2.6. Radiative Forcing

A dynamic radiative forcing analysis was carried out for each alternative scenario. First, we calculated the annual CO 2 and CH 4 emissions for all scenarios. Next, we determined the difference in annual CO 2 and CH 4 emissions between each alternative and the reference scenario. We used these annual differences in emissions to calculate the cumulative radiative forcing using the DynCO 2 dynamic life cycle assessment model developed for global warming determination [28], as measured in nano watts per square meter.

3. Results

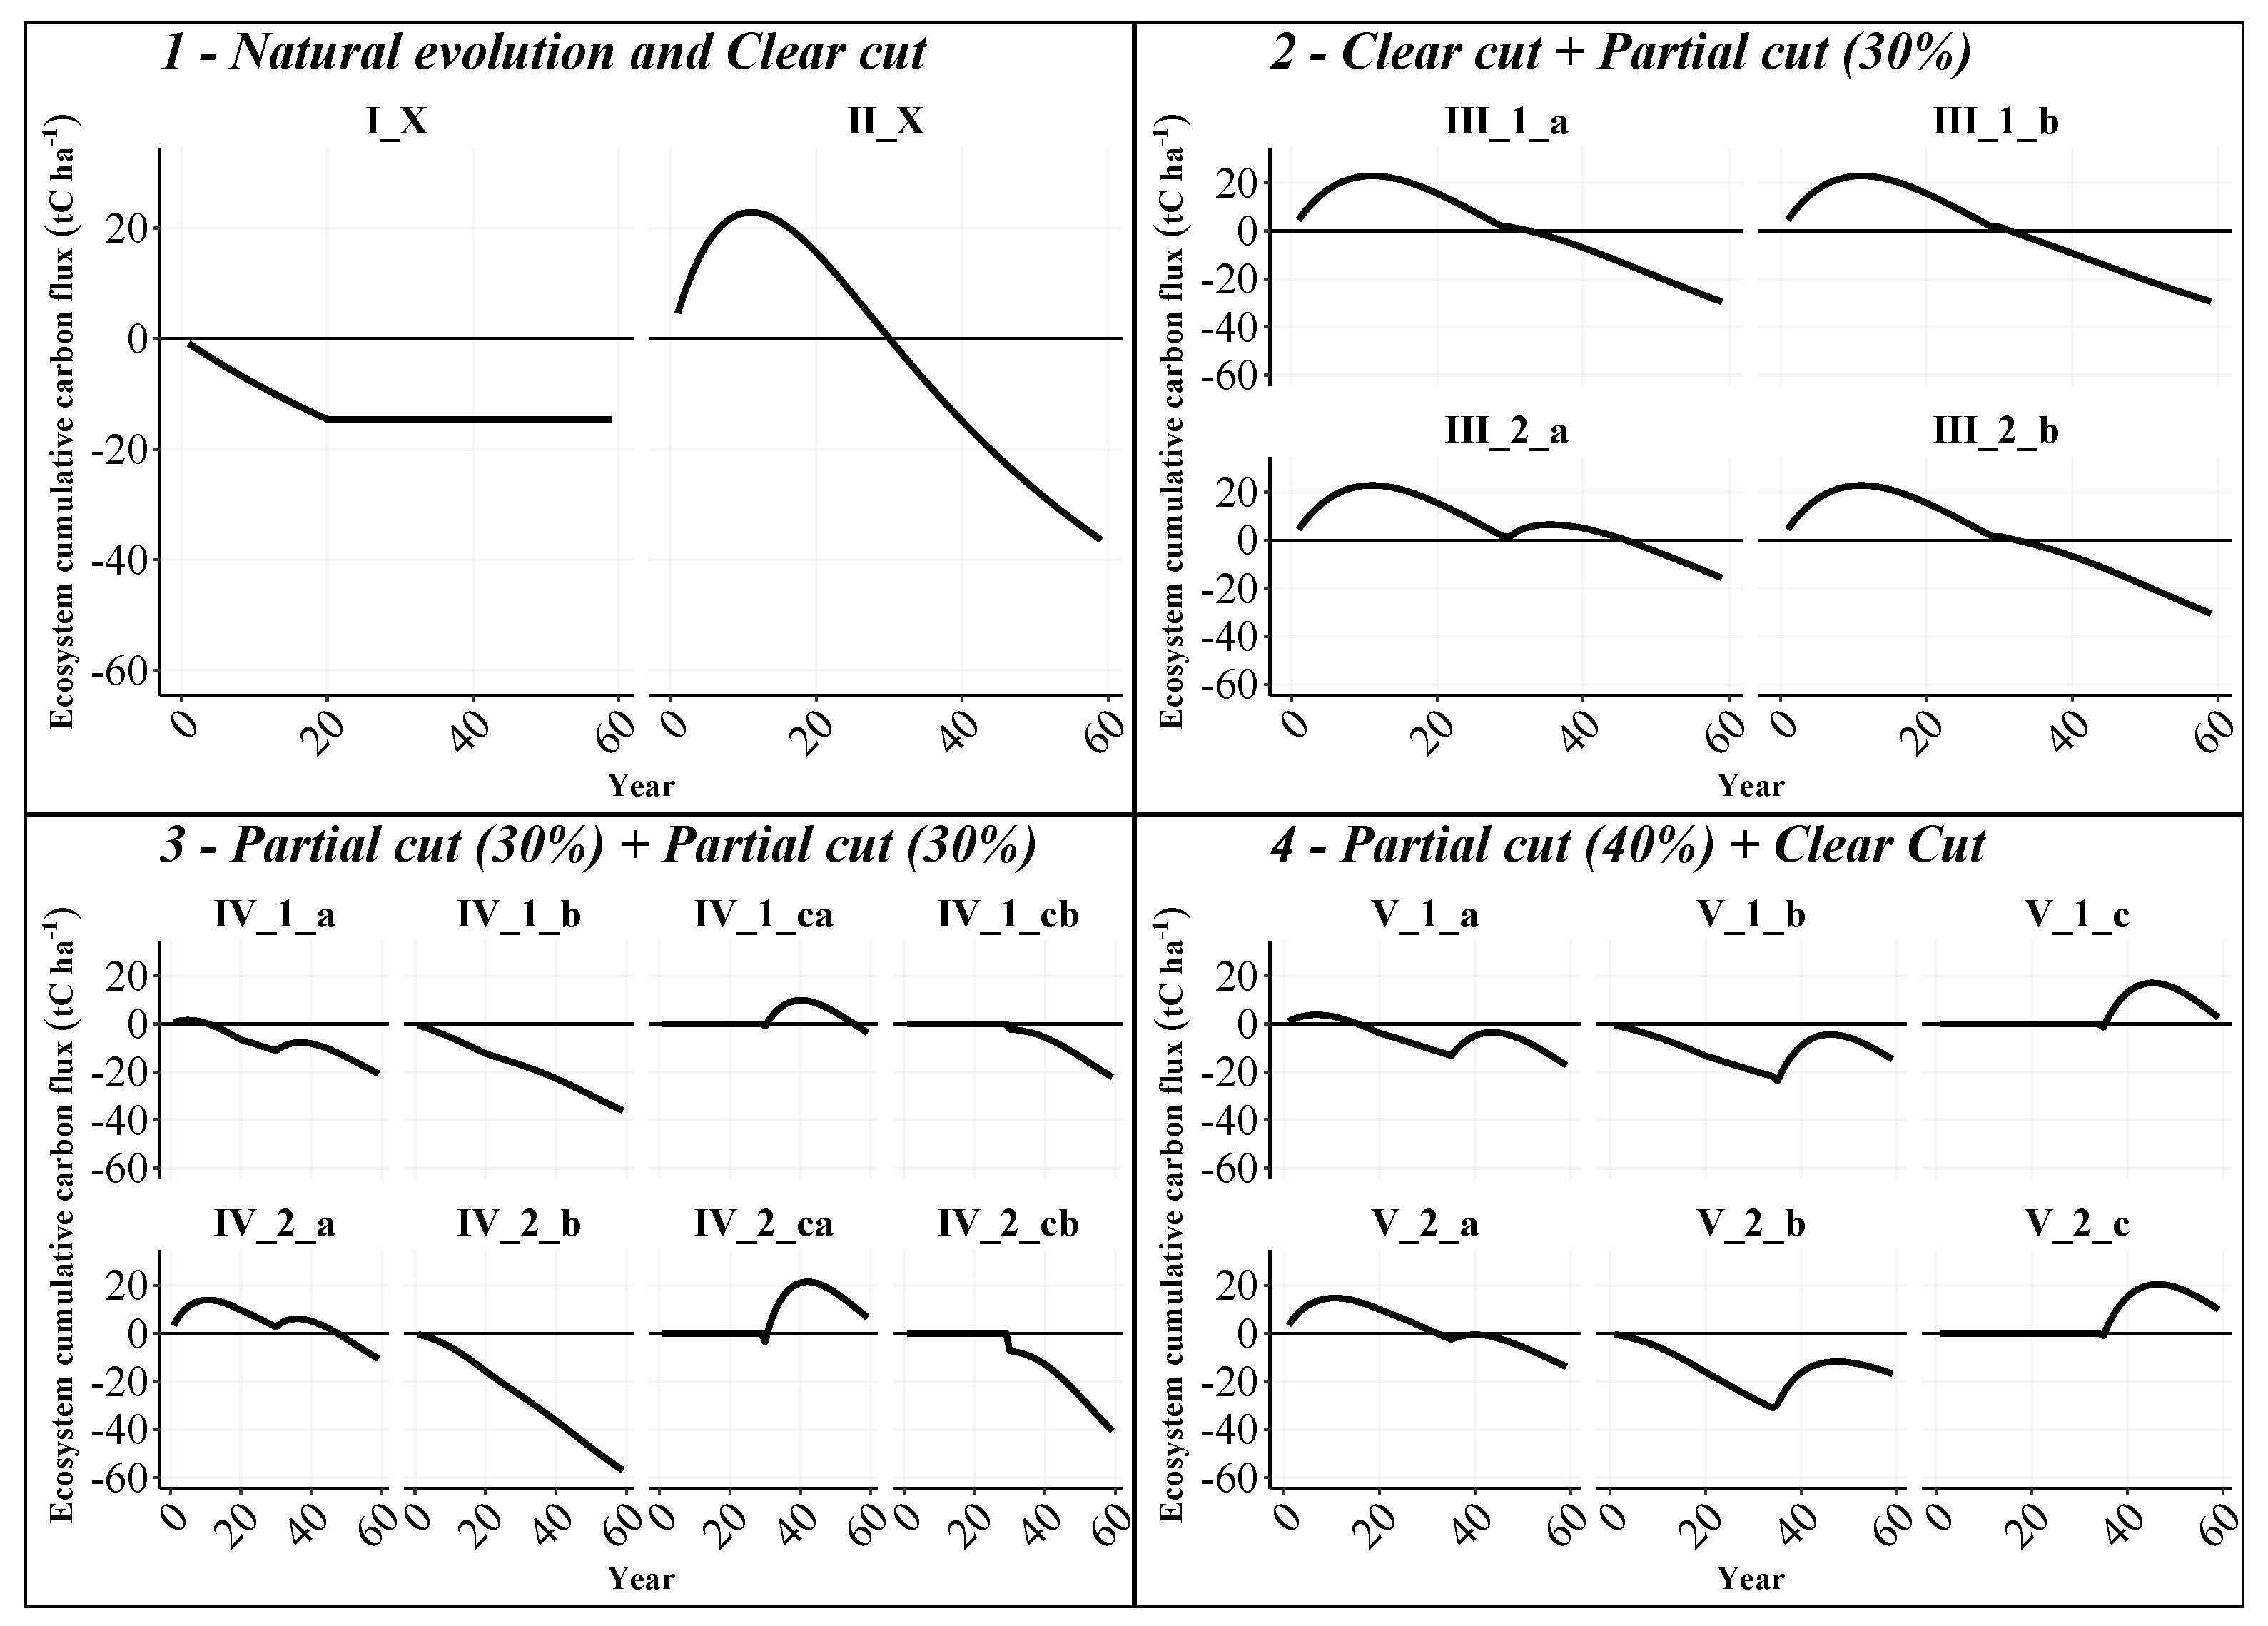
3.1. Carbon Budgets for Forest Ecosystems

For most of our scenarios, the forest ecosystem was predicted to become a cumulative carbon sink over the period simulated (Figure 2). Only extreme scenarios, in which high percentages of windthrow associated with stable vegetation dynamics (no carbon loss or sequestration in the vegetation pool) and a loss of DOM carbon stock were simulated, were not predicted to be cumulative carbon sinks. The largest sinks were predicted for scenarios with limited loss of DOM carbon stock, especially when windthrow occurred.
After each harvest, a period of net carbon emissions appeared and lasted from 0 (IV_1_b) to 32 years (V_2_a), depending on the type of harvest (clearcutting resulted in higher carbon emissions and a longer period of emissions), windthrow proportion (higher carbon emissions following high windthrow proportion), and the simulated DOM dynamics (higher carbon emissions associated with DOM decomposition) (Figure 2).
The clearcut scenario (II_X) appeared to be the third largest cumulative carbon sink at the end of the simulated period, with 36   tC   ha 1 , the first two scenarios being extreme ones with high windthrow percentages and no DOM carbon loss (IV_2_b with 57   tC   ha 1 and IV_2_cb with 40   tC   ha 1 ). Thus, by the end of the next clearcut rotation period (60 years), partial harvest types were predicted to be mostly smaller cumulative sinks in comparison to a unique clearcut (Figure 2). However, the absolute maximum cumulative value of the carbon emission period was predicted as a result of an initial clearcut, with values around 23   tC   ha 1 for years 10, 11, and 12.
Scenarios with an initial clearcut followed by a partial cut at year 30 (III_X_X scenarios) were predicted to be smaller forest ecosystem cumulative sinks ( 16   to 30   tC   ha 1 ) in comparison to the clearcut scenario (II_X), despite having the same starting point.
Scenarios with an initial partial cut followed by a clearcut at year 35 (V_X_X scenarios) were predicted to be smaller forest ecosystem cumulative sinks ( 17   to + 10   tC   ha 1 ) in comparison to the clearcut scenario (II_X). If any, the carbon accumulated as DOM following the partial cut was then entirely lost following the clearcut at year 35, thus generating important annual emissions at the end of the simulated period.

3.2. Carbon Budgets for the Whole Forest Sector

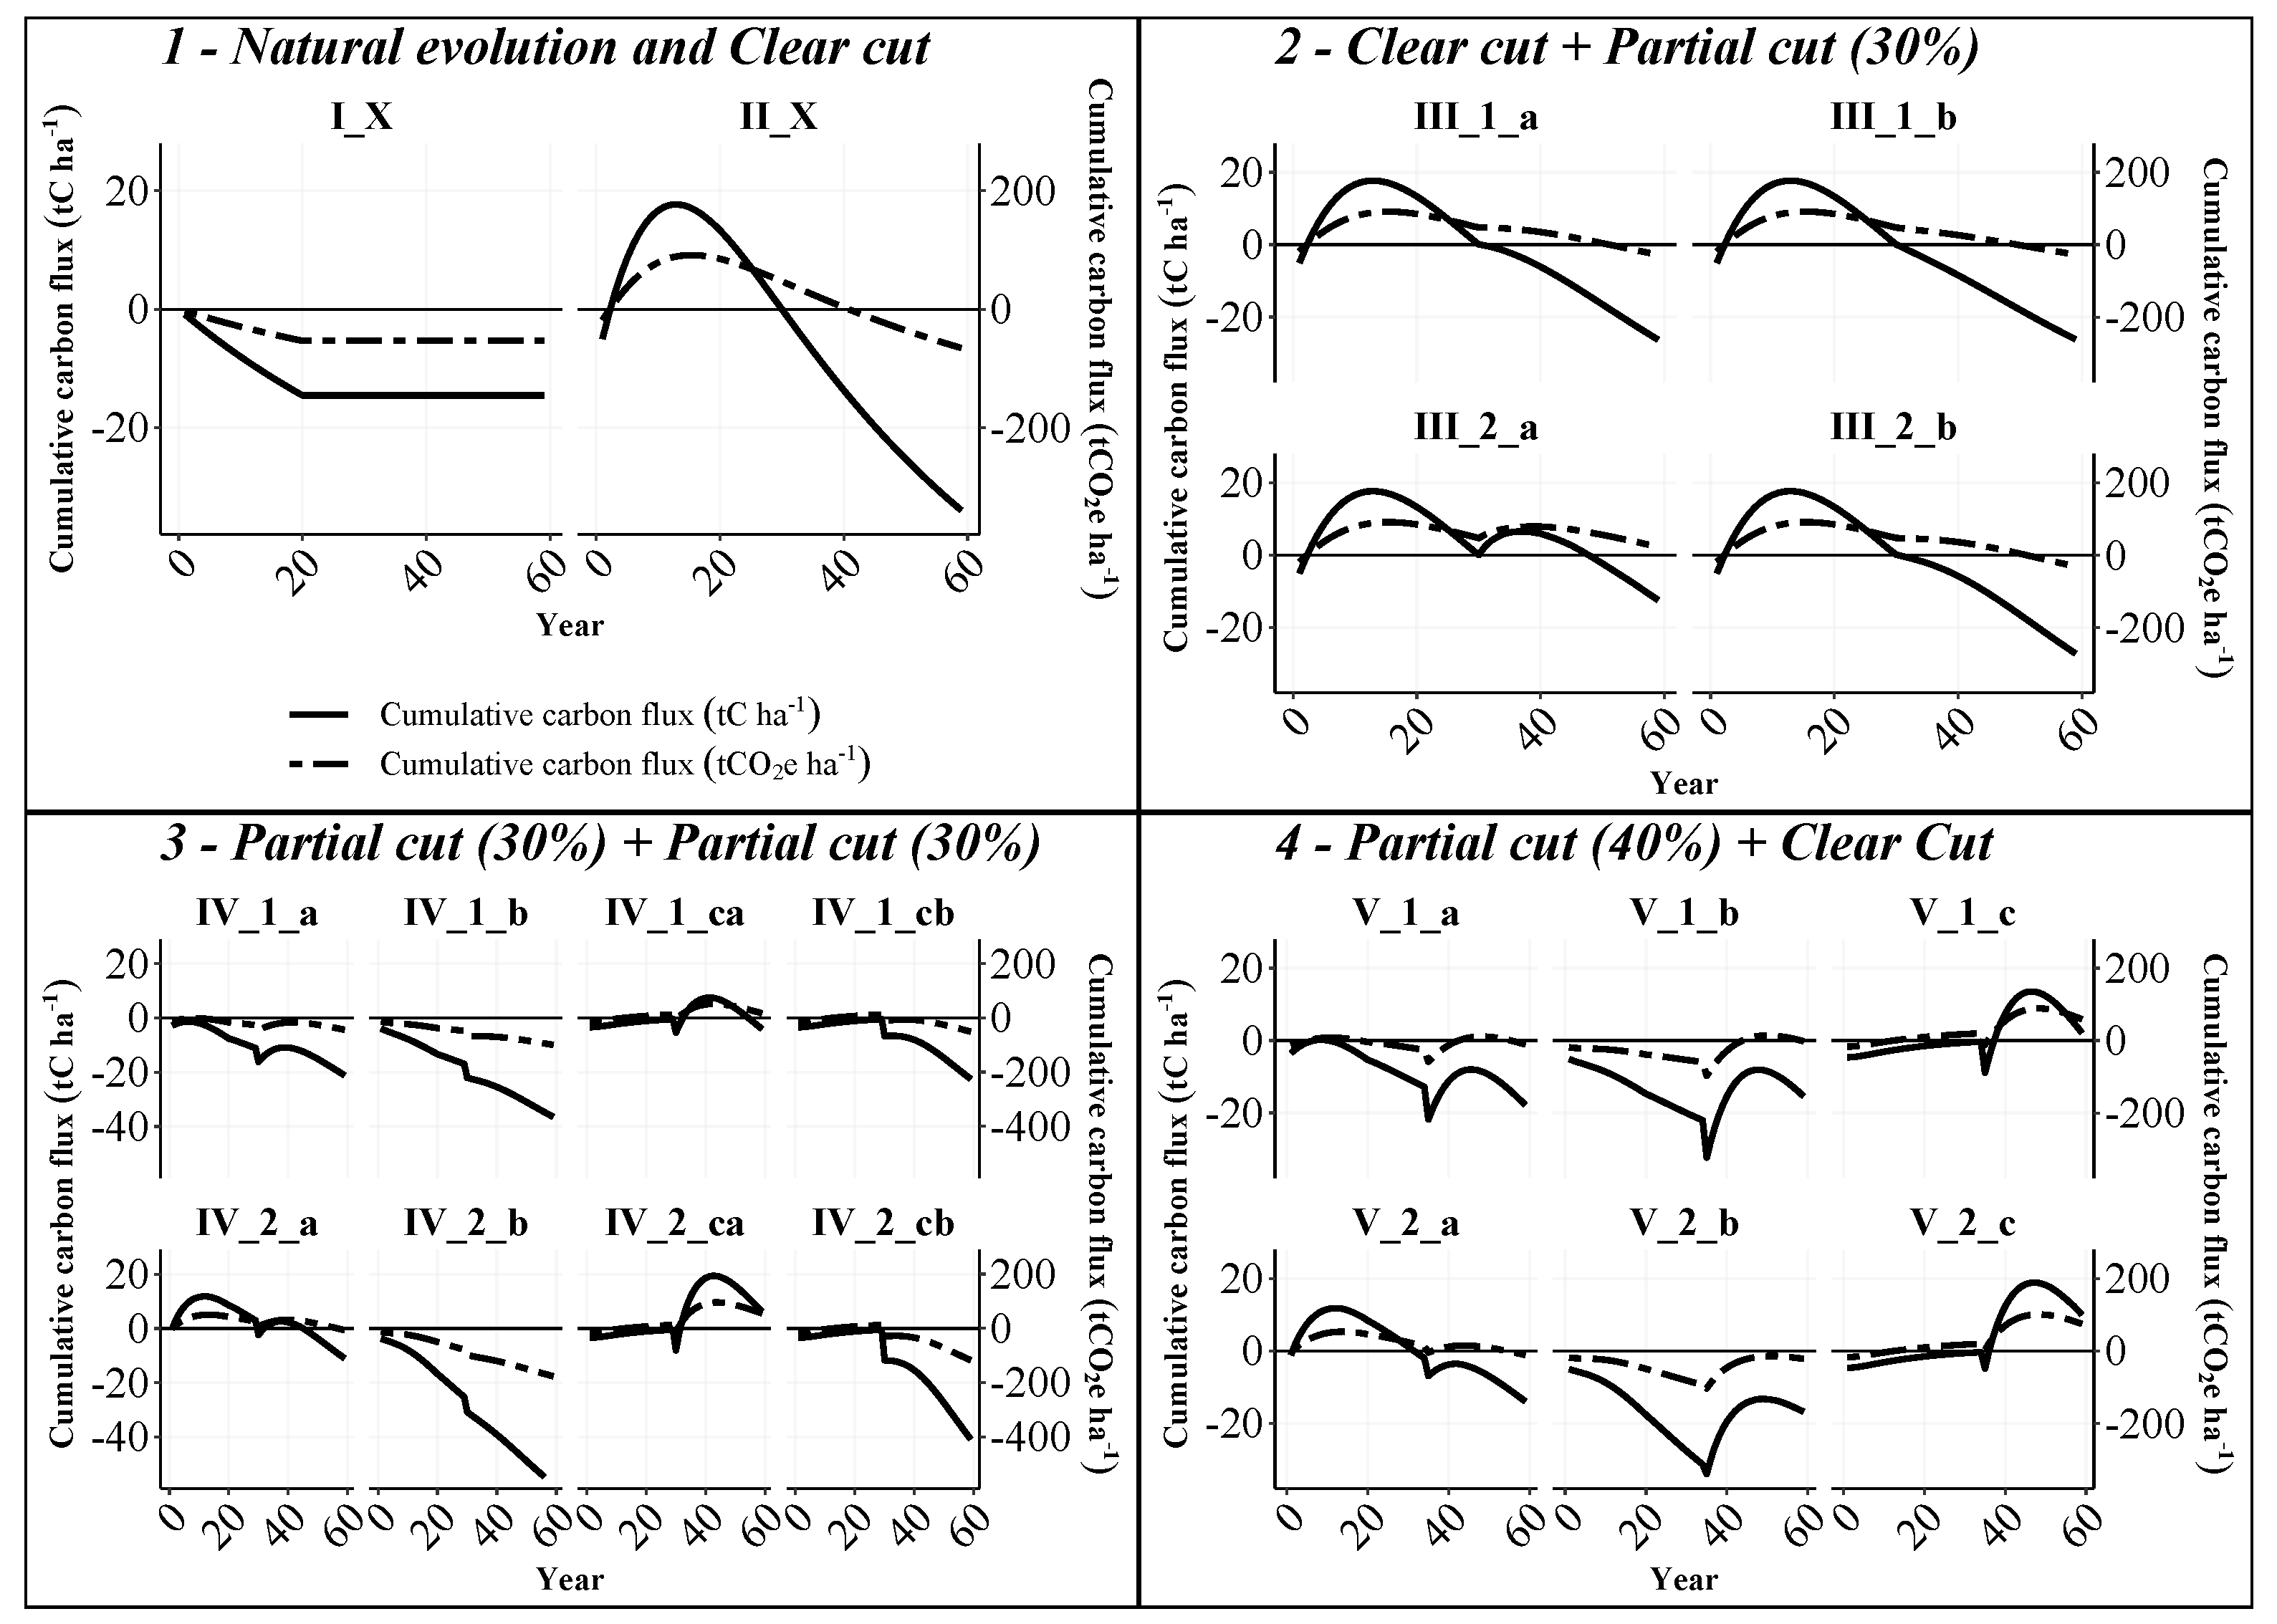
3.2.1. Carbon Budgets in Tonnes of Carbon

When considering the whole forest sector, i.e., emissions and sequestration from forest ecosystems, wood product decay, and substitution effects, the carbon budget in tonnes of carbon (tC) was predicted to be a cumulative carbon sink for almost all scenarios during the simulated time horizon; this sink reached up to 57   tC   ha 1 for the IV_2_b scenario (Figure 3). The clearcut scenario (II_X) appeared to be the 4th largest cumulative carbon sink at the end of the simulated period, with 34   tC   ha 1 , just behind scenario IV_1_b, with 37   tC   ha 1 , and scenario IV_2_cb, with 41   tC   ha 1 (Figure 3). The reference scenario (I_X) was 13th, with a cumulative carbon sink of 15   tC   ha 1 . The largest carbon sinks for stands following a partial cut were directly linked to a stable DOM dynamic, as also shown in Figure 2.
The scenarios with an initial clearcut followed by a partial cut (III_X scenarios) were predicted to be smaller cumulative sinks ( 12   to 27 tC   ha 1 ) in comparison to the clearcut scenario (II_X), despite having the same initial cut. The substitution effect caused by wood products generated by the partial cut did not appear to compensate for the reduced ecosystem sequestration and additional decay of new wood products (Figure 3).
For scenarios with an initial partial cut followed by a clearcut at year 35 (V_X_X scenarios), cumulative forest sector sinks were predicted to reach 18   to + 10   tC   ha 1 . The substitution caused by wood products (recorded as carbon sequestration) compensated for the emissions generated by the decay of additional wood products sent to markets (Figure 3).

3.2.2. Carbon Budgets in Tonnes of Carbon Dioxide Equivalent

The ranking of scenarios was different when based on tonnes of carbon dioxide equivalent (tCO 2 e). With a cumulative carbon dioxide equivalent budget of 53   tCO 2 e   ha 1 at the end of the simulated period, the reference scenario (I_X, Natural Evolution) was predicted to be the forth largest carbon dioxide equivalent sink scenario (Figure 3). The clearcut scenario (II_X) with 65   tCO 2 e   ha 1 was predicted to be the third largest cumulative carbon dioxide equivalent sink (Figure 3).
Almost all scenarios were predicted to be overall small sinks of carbon dioxide equivalent (Figure 3), even if the ecosystem sinks alone were found to be important (Figure 2). Moreover, two scenarios for which the ecosystem was a carbon sink were predicted to be overall carbon dioxide equivalent sources when emissions/sequestrations from wood products and substitution were taken into account (III_2_a, IV_1_ca).

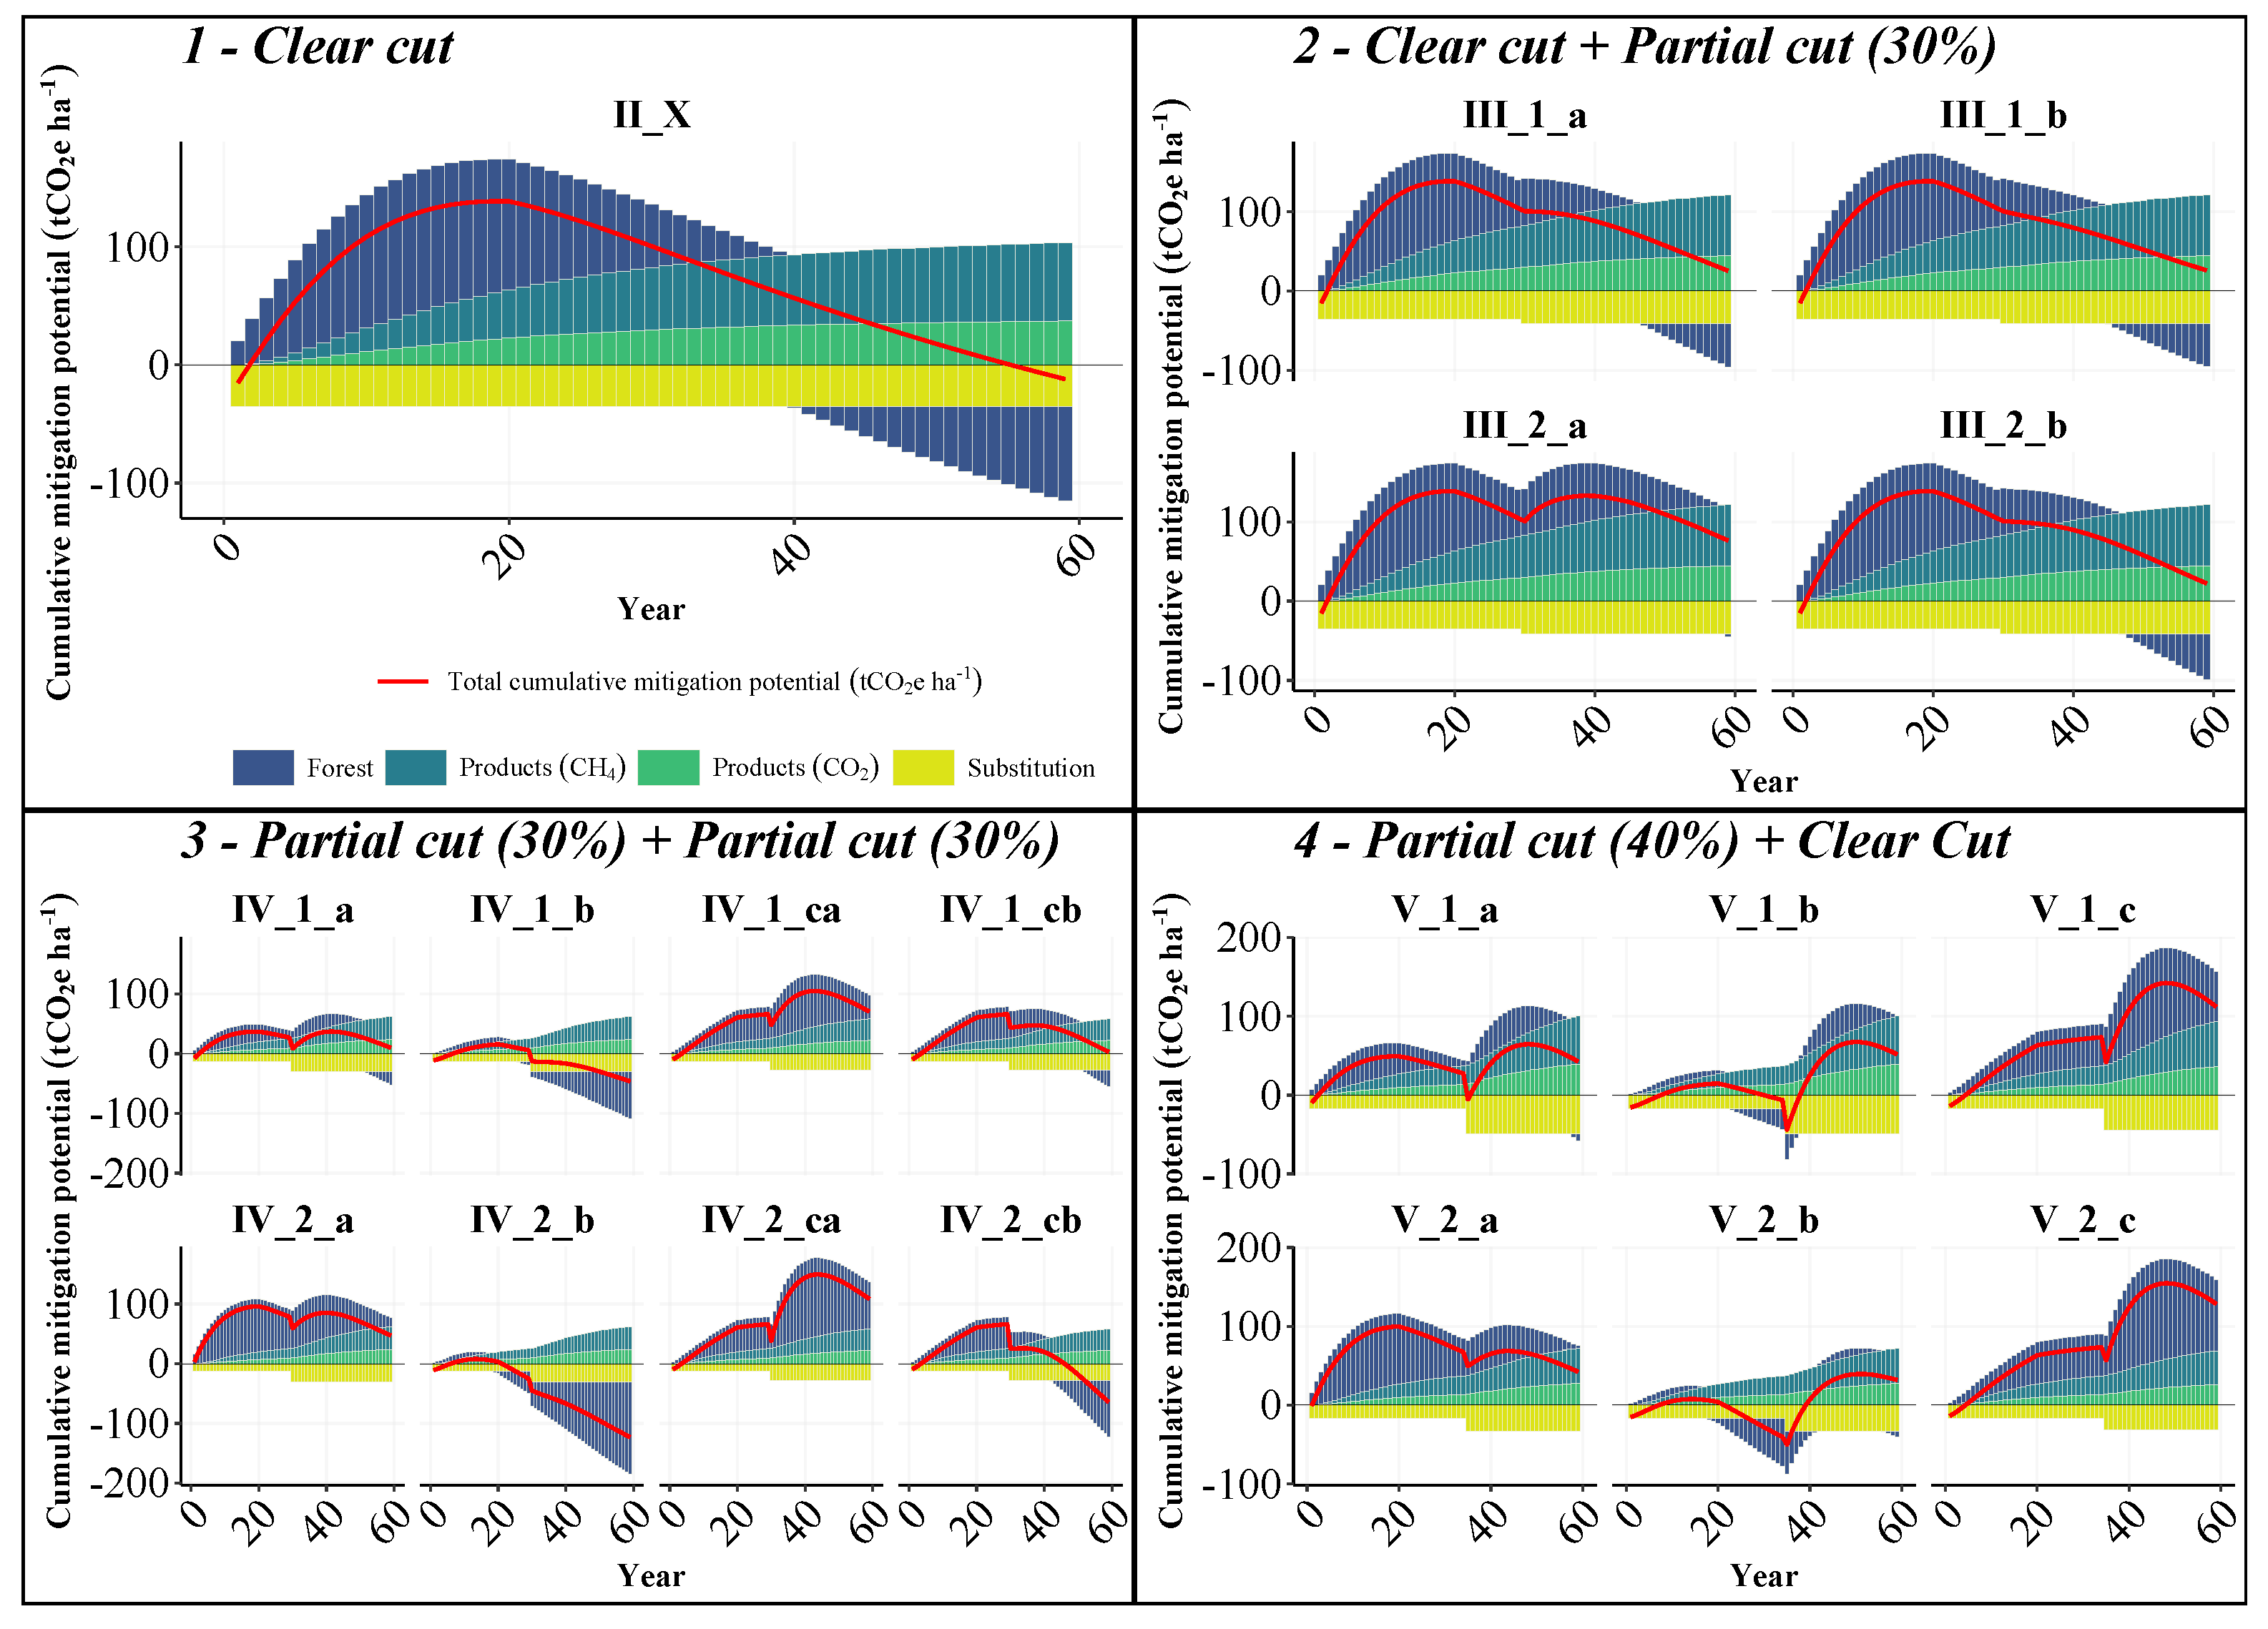
3.3. Mitigation Potential

Mitigation potential was computed as the comparison between an alternative and the reference scenario (Natural evolution). Our results predicted that all scenarios except four (IV_2_b, IV_2_cb, IV_1_b and II_X) would become cumulative CO 2 e sources compared with the reference, up to 128   tCO 2 e   ha 1 for the V_2_c scenario (Figure 4), at the end of the next harvest cycle (60 years). The cumulative carbon budget of the reference scenario (I_X) was predicted to be a sink during all of the simulated period (Figure 3); therefore, in the mitigation potential calculation, any carbon emission following a harvest event in an alternative scenario (Figure 3) caused this alternative to be a comparative source (Figure 4). After an initial 20-year period of emissions for all alternative scenarios, they followed different trends. There was either an increase (IV_1_ca, IV_2_ca, V_1_b, V_2_b, V_1_c, V_2_c), a stabilization (IV_1_a, IV_2_a, V_1_a), or a decrease (II_X, III_X_X, IV_1_b, IV_2_b, IV_1_cb, IV_2_cb, V_2_a) of the cumulative CO 2 e source relative to the reference (Figure 4). Most scenarios remained a cumulative CO 2 e source over the whole simulated period. Three of the four scenarios were predicted as cumulative CO 2 e sinks, i.e., IV_2_b with 123   tCO 2 e   ha 1 , IV_2_cb with 64   tCO 2 e   ha 1 , and IV_1_b with 46   tCO 2 e   ha 1 were partial cut scenarios for which the DOM pool was assumed to remain stable (Figure 4). The clearcut scenario (II_X) was expected to procure the lowest cumulative mitigation potential of the four, with 12   tCO 2 e   ha 1 (Figure 4).

3.4. Breakdown of Carbon Fluxes

The decay of wood products in landfills, and more specifically the methane production, largely drove tCO 2 e budgets (Figure 5). Indeed, although CH 4 only accounted for 17% of annual emissions from landfills (with 83% being CO 2 ), it still contributed to 64% of the annual global warming potential.
The substitution effect associated with wood products generated by the initial harvest was enough to compensate emissions from ecosystems and wood product decay only during the first year of our simulations (Figure 5). Subsequent substitution effects from additional harvests were not large enough to compensate for the cumulative CO 2 e source from the ecosystem and wood product decay, especially if the new harvest occurred in young stands that generated a low proportion of long-lived wood products (Section 2.4.2) as in type III alternative scenarios (Figure 5).
The cumulative mitigation potential depended largely on the response of the forest ecosystem to the harvest, as emissions from wood product decay were always a large source and substitution was too low to drastically influence the potential. In the forest ecosystem, 40 years after a single clearcut event (II_X), a cumulative CO 2 e sink could be generated relative to the reference scenario. However, when a partial cut followed the clearcut (III_X_X), the forest ecosystem took between 45 to 59 years to become a cumulative CO 2 e sink relative to the reference (Figure 5). Except for scenarios with partial cuts for which no decomposition and loss of DOM was assumed (IV_1_b, IV_2_b, IV_1_cb, IV_2_cb), no other scenario generated a forest cumulative CO 2 e sink relative to the reference (Figure 5).
The mitigation potential for all scenarios at the end of our simulation period became less positive or more negative, i.e., the carbon sink of the forest sector improved, as a result of the carbon sink from the forest ecosystem surpassing the emissions originating from the decay of wood products (Figure 5). Consequently, it could be inferred that an extended period without harvest may enhance the mitigation potential of some of our scenarios, especially scenarios for which harvest was simulated later in the period (V_X_X).

3.5. Mitigation Potential per Unit of Harvested Wood

Logging caused important ecosystem carbon emissions following harvest, and the decay of wood products was responsible for a large part of the CO 2 e emissions in our simulations (Figure 5); therefore, harvesting more wood during the period simulated, especially at the end (V_X_X), was not linked to a higher mitigation potential per tonne of carbon harvested. Indeed, a reduction of CO 2 e emissions relative to the reference per unit of harvested wood was found only for scenarios with limited carbon emissions after harvest (IV_1_b, IV_2_b, IV_1_cb, IV_2_cb) and for the scenario with no subsequent harvest event after the initial one (II_X).
Scenarios with a high proportion of windthrow (IV_2_b, IV_2_cb, V_2_b) and/or with partial cut (IV_1_b, IV_1_cb, V_1_b) only provided a reduction of CO 2 e emissions per unit of harvested carbon when no decomposition of DOM was assumed (Figure 6).
By considering mitigation potential values in tonnes of carbon, the ratio oscillated for almost all scenarios around 0 tC/tC; thus, no significant difference with the reference scenario was predicted in this theoretical case for almost all scenarios, irrespective of harvest types (Figure 6).

3.6. Radiative Forcing

The cumulative radiative forcing of each scenario relative to the reference was calculated (Figure 7). All scenarios except IV_2_b resulted in a positive cumulative radiative forcing, indicating a cumulative warming effect at the end of the simulated period (Figure 7). A significant change compared to results based on the tCO 2 e mitigation potential was the ranking of the clearcut scenario (II_X), which fell to the 13th at the end of simulations due to the large initial post-harvest carbon emissions.
Partial cut scenarios in mature stands (IV_X_X, V_X_X) reduced post-harvest carbon emissions and therefore resulted in lower cumulative warming after 60 years compared to the clearcut scenario (II_X), which contrasts with the tCO 2 e-based results (Figure 7). This phenomenon was amplified when no carbon loss from DOM stock (i.e., no net DOM decomposition) was assumed in the simulation (Figure 7).
While some scenarios (III_1_a, III_1_b, III_2_b, IV_1_b) showed an overall stable dynamic by the end, others displayed continuous increases of radiative forcing (III_2_a, IV_1_a, IV_1_ca, IV_1_cb, IV_2_a, IV_2_ca) or the beginning of a decrease (II_X, IV_2_b, IV_2_cb) (Figure 7).

4. Discussion

Our study suggests that at the stand level, forest harvesting in the boreal forests typical of Eastern Canada may provide only limited carbon emission reduction compared to preservation practices (no harvest). Moreover, harvesting practices do not result in any climate change mitigation benefit in terms of radiative forcing, at least over the 60-year simulation period used here. The capacity of the forest ecosystem carbon sink to compensate for the substantial emissions of CO 2 and CH 4 from the decay of wood products in landfills was a crucial factor for reaching an overall carbon emission reduction, especially in the context of the relatively minor substitution effect of wood products on markets. In order to mitigate the anticipated climate warming effect of logging, particularly in the first years following harvest, it is essential to reduce overall post-harvest carbon emissions from the ecosystem and from products. Due to the importance of CO 2 and CH 4 emissions arising from the end-of-life of wood products in landfills, reducing these emissions may represent a pertinent mitigation action for the forest sector.
As a new harvest is scheduled in nearly all scenarios in the year following the end of our simulations, it is raising concerns about the significance of such a harvest for scenarios that are still cumulative CO 2 e or warming sources at that point. A longer period between logging events (i.e., longer harvest rotations) would maximize overall net carbon emission reduction. Indeed, as the stand gets older, ecosystem carbon sequestration becomes high enough to compensate emissions from organic matter decomposition in forest and the decay of wood products in landfills. Older trees may also generate larger logs, providing a higher proportion of long-lived wood products, which would contribute to reducing decay emissions to the atmosphere (at least in the short term) and yield a higher substitution effect on markets.
The carbon dynamics of the natural evolution scenario (i.e., without harvest), which served as the reference, was based on local studies [9,34] and should therefore be a good representation of the ecosystem functioning of boreal balsam fir landscapes of the Montmorency Forest. More globally, the long-term carbon sink capacity of mature and overmature stands is subject to significant uncertainty: the long-term persistence of carbon sequestration depends on stand characteristics and landscape dynamics, as they determine whether the stands might potentially transition into a carbon source [40,41,42]. The saturation of ecosystem carbon stocks in overmature stands observed in the Montmorency Forest [34] suggests that a preservation strategy implemented on the territory would lead to lower carbon sequestration over time. In such cases, harvesting strategies, if applied within a sustainable management framework, may help sustain ecosystem carbon sequestration through anthropogenic disturbances that renew the carbon sequestration capacity of stands [6]. At the same time, strategies that prioritize preservation may be vulnerable to carbon reversal as a result of natural disturbances, given the presence of a high quantity of mature and old forests generated by these strategies [43,44].
Variation in wood harvesting may also pose the risk of carbon leakage to other regions or jurisdictions. Carbon leakage refers to the transfer of carbon emissions from an area with emission regulations to a less regulated or unregulated one [2]. This risk of leakage exists for both strategies of increasing and decreasing the harvested volume [45] and may account for approximately 60 to 100% of the variation in volume resulting from the implementation of an alternative harvesting strategy [45,46,47]. Given that the demand for bio-based resources is expected to increase significantly in the coming decades [48,49,50], it is reasonable to assume that the risks of carbon leakage in the context of reduced harvesting will be accentuated.
Our study demonstrates the role of wood products [51,52,53] and their substitution effect [22,23,24] in any mitigation potential analysis. Our findings indicate that neglecting the fate of wood products during their service life and at their end-of-life may result in a misconception about the real forest sector mitigation potential. Wood products with low or absent substitution effect such as pulp and paper products also often result in high methane emissions during decay in landfills [20]. In contrast, long-lived wood products such as sawnwood or panels are associated with lower emissions in landfills [20] and greater substitution [22,23,24]. It is therefore important to prioritize the replacement of short-lived and low-quality wood products with longer-lived alternatives [51,52,53] or with new high-substitution potential products such as wood fiber-based foams, lignin-based adhesives, glycols, bioplastics, and textile fibers [48,49,54].
Increasing the residual tree growth and overall merchantable volume is often a goal of partial cutting strategies [12,13,14]. However, assessing the real effect on residual trees can be challenging as it depends on several pre-harvest stand characteristics [12,18,55,56], operational processes [57,58], and the capacity of the stand to resist post-harvest mortality [14,16,17,18,56]. Therefore, sensitivity analyses are necessary in any modelling exercise to account for the high degree of uncertainty surrounding the growth of residual trees after a partial cut, especially when impacts can be time dependent [12,55]. As partial cuts may have a greater impact on already uneven-aged stands [57], the composition of wood products obtained from stands that have undergone partial cutting for several rotations may differ from those obtained from even-aged stands. When attempting to consider the growth of the diameter in our study, we found inconclusive results as the simulated diameter changes did not noticeably influence the composition of the basket of wood products. Based on the allocation matrices used here, a substantial increase in diameter growth would be needed to have a significant impact on the wood product portfolio [32]. Nevertheless, the presence of larger trees is expected to improve the mitigation potential of the forest sector. This is because the largest trees would result in a higher proportion of long-lived wood products [51,52,53], which would enhance the substitution effect [22,23,24] while reducing and postponing methane emissions over an extended period of time [59].
As demonstrated in our study, neglecting the temporality and the radiative forcing of GHG emissions in the forest sector can also lead to significant misconceptions about the potential of the sector for climate change mitigation and its real impact on global warming. Using GWP100 static values introduces an inconsistency between the period of the study (60 years) and the time horizon of GWP100 (100 years). Such temporal issues should be included in any analysis based on biogenic carbon strategies [29]. If the use of a unique static GWP100 for wood products is a common practice in the literature [5,60], using dynamic assessments can provide a more accurate representation of the impact of biogenic carbon emissions and removals from forest ecosystems, emissions from wood products resulting from decay, and substitution effects [30]. Furthermore, our analysis based on carbon dioxide equivalent (CO 2 e) assumed that the sequestration of one unit of CO 2 e is equivalent to the emission of one unit of CO 2 e. Although this assertion may be true in the context of very short-term temporal considerations, it can be challenged when the time gap between the two events spans over several years, as the balance between carbon emissions and removals over a specified time period does not assure a neutral effect on the climate [28,30]. This is particularly important for stand-level studies in the boreal region, where carbon emissions to the atmosphere in the years following a harvest can be significant, particularly after clearcutting practices. Thus, in order to ensure temporal consistency in our analysis of mitigation potential, it is crucial to take into account the dynamic radiative forcing of biogenic carbon-based strategies, as outlined by [28]. Using the radiative forcing unit (nW·m 2 ) should also facilitate the integration of various climate studies related to forestry, such as those focused on albedo and volatile organic compounds, which typically assess warming or cooling potential as the main outcome [61,62].
According to our results, methane emissions generated by wood products in landfills largely contribute to dampen the climate change mitigation potential of the forest sector. Therefore, special attention must be paid to adequately model their impacts. This includes regularly updating information on the parameters of the end-of-life of wood products, particularly in landfills, such as their half-life, the proportion of carbon that is biodegradable, and the ultimate outcome of methane emissions. The development of appropriate biogenic methane capture from landfills and its use as an energy carrier may result in a substantial new substitution effect. This effect has the potential to render most alternative forest management scenarios as carbon dioxide equivalent sinks relative to a reference scenario with no harvest; such potential will need to be quantified. It is important to highlight that both the federal and provincial governments in Canada are actively promoting protocols for increasing landfill methane recovery and destruction [63,64].

5. Conclusions

Our findings at the stand level indicate that forest harvesting, when compared to a preservation practice (i.e., no harvest), may only lead to a limited reduction in carbon emissions. However, this reduction does not contribute to any climate benefits in terms of radiative forcing over the simulated period (i.e., 60 years). The substitution effects (recorded as a carbon sequestration) that wood products can create on markets by displacing more GHG-intensive products were too low to compensate for the substantial emissions of CO 2 and CH 4 from the decay of wood products in landfills (carbon source). Forest management practices that can maintain or increase the carbon sink in ecosystems, such as partial cut (especially in circumstances for which decomposition of organic material left on the forest site is very slow), were therefore crucial to achieving a reduction in carbon emissions compared to a preservation practice.
To limit the anticipated warming effect of logging (radiative forcing), it is essential to reduce carbon emissions, particularly in the initial years following harvest. While significant emphasis is currently placed on improving forestry practices to maximize the ecosystem carbon sequestration, it may be more pressing in the short term to address the problem of emissions arising from the end-of-life of wood products, particularly in the form of CH 4 emitted from landfills, in order to make the forest sector a more effective tool for climate change mitigation.
While the theoretical carbon benefits of forest harvesting may be relatively limited, sustainable management can ultimately reduce the risks and uncertainties associated with preservation practices. These include forest losses to natural disturbances, harvest and carbon leaks to other jurisdictions, and carbon saturation in forest ecosystems in the long term. Nevertheless, the determination of the rotation cycle and type of harvest in a forestry management strategy that considers carbon implications must consider the carbon dynamics of the ecosystem as the main input, while ensuring that substitution and emissions resulting from management decisions, including those associated with wood products, are correctly assessed. Neglecting the temporality and the dynamic radiative forcing of GHG emissions in the forest sector can lead to significant misconceptions about the potential of the forest sector for climate change mitigation, as demonstrated by our study.

Author Contributions

Conceptualization, L.M. and E.T.; methodology, L.M.; software, L.M.; validation, L.M., E.T. and R.B.; formal analysis, L.M.; investigation, L.M.; resources, L.M. and E.T.; data curation, E.T. and L.M.; writing—original draft preparation, L.M.; writing—review and editing, L.M., E.T. and R.B.; visualization, L.M.; supervision, E.T. and R.B.; project administration, E.T.; funding acquisition, E.T. All authors have read and agreed to the published version of the manuscript.

Funding

This study was funded by the Quebec Ministry of Forests, Wildlife, and Parks (research projects 142332156-2018-A and 142332174-E: PI: E. Thiffault), and by the Natural Science and Engineering Research Council through a Discovery Grant to E. Thiffault (grant number RGPIN-2018-05755).

Data Availability Statement

Dataset available at 10.6084/m9.figshare.22666363 (CC BY 4.0).

Conflicts of Interest

The authors declare no conflict of interest. The funders had no role in the design of the study; in the collection, analyses, or interpretation of data; in the writing of the manuscript; or in the decision to publish the results.

Abbreviations

The following abbreviations are used in this manuscript:
CCarbon
CH 4 Methane
CO 2            Carbon dioxide
CO 2 eCarbon dioxide equivalent
DFDisplacement factor
DOMDead organic matter
GHGGreenhouse Gas
GWP100Global Warming Potential over 100 years
HWPHarvested wood products
IPCCIntergovernmental Panel on Climate Change

References

  1. Grassi, G.; House, J.; Dentener, F.; Federici, S.; den Elzen, M.; Penman, J. The key role of forests in meeting climate targets requires science for credible mitigation. Nat. Clim. Chang. 2017, 7, 220–226. [Google Scholar] [CrossRef]
  2. Nabuurs, G.J.; Andrasko, K.; Benitez-Ponce, P.; Boer, R.; Dutschke, M.; Elsiddig, E.; Ford-Robertson, J.; Matsumoto, M.; Oyhantcabal, W.; Achard, F.; et al. 2007: Forestry. In Climate Change 2007: Mitigation. Contribution of Working Group III to the Fourth Assessment Report of the Intergovernmental Panel on Climate Change; Metz, B., Davidson, O.R., Bosch, P.R., Dave, R., Meyer, L.A., Eds.; Cambridge University Press: Cambridge, UK; New York, NY, USA, 2007; p. 44. [Google Scholar]
  3. Nabuurs, G.J.; Hatab, A.A.; Bustamante, M.; Clark, H.; Havlík, P.; Ninan, K.N.; Popp, A.; Roe, S.; Aoki, L.; Angers, D.; et al. Agriculture, Forestry and Other Land Uses (AFOLU). In IPCC, 2022: Climate Change 2022: Mitigation of Climate Change. Contribution of Working Group III to the Sixth Assessment Report of the Intergovernmental Panel on Climate Change; Shukla, P.R., Skea, J., Slade, R., Khourdajie, A.A., Diemen, R.v., McCollum, D., Pathak, M., Some, S., Vyas, P., Fradera, R., et al., Eds.; Cambridge University Press: Cambridge, UK; New York, NY, USA, 2022. [Google Scholar]
  4. Bernier, P.; Astrup, R.; Bright, R.; Genet, H.; Hurmekoski, E.; Kraxner, F.; Liski, J.; Lundmark, T.; McGuire, D.; Moen, J.; et al. How Can the Circumboreal Forest Contribute to Mitigating Climate Change? Meeting Report; IBFRA: Haparanda, Sweden, 2018. [Google Scholar]
  5. Smyth, C.E.; Stinson, G.; Neilson, E.; Lemprière, T.C.; Hafer, M.; Rampley, G.J.; Kurz, W.A. Quantifying the biophysical climate change mitigation potential of Canada’s forest sector. Biogeosciences 2014, 11, 3515–3529. [Google Scholar] [CrossRef]
  6. Moreau, L.; Thiffault, E.; Cyr, D.; Boulanger, Y.; Beauregard, R. How can the forest sector mitigate climate change in a changing climate? Case studies of boreal and northern temperate forests in eastern Canada. For. Ecosyst. 2022, 9, 100026. [Google Scholar] [CrossRef]
  7. Peichl, M.; Martínez-García, E.; Fransson, J.E.S.; Wallerman, J.; Laudon, H.; Lundmark, T.; Nilsson, M.B. Landscape-variability of the carbon balance across managed boreal forests. Glob. Chang. Biol. 2023, 29, 1119–1132. [Google Scholar] [CrossRef] [PubMed]
  8. Kurz, W.; Shaw, C.; Boisvenue, C.; Stinson, G.; Metsaranta, J.; Leckie, D.; Dyk, A.; Smyth, C.; Neilson, E. Carbon in Canada’s boreal forest—A synthesis. Environ. Rev. 2013, 21, 260–292. [Google Scholar] [CrossRef]
  9. Senez-Gagnon, F.; Thiffault, E.; Paré, D.; Achim, A.; Bergeron, Y. Dynamics of detrital carbon pools following harvesting of a humid eastern Canadian balsam fir boreal forest. For. Ecol. Manag. 2018, 430, 33–42. [Google Scholar] [CrossRef]
  10. Paradis, L.; Thiffault, E.; Achim, A. Comparison of carbon balance and climate change mitigation potential of forest management strategies in the boreal forest of Quebec (Canada). Forestry 2019, 92, 264–277. [Google Scholar] [CrossRef]
  11. Ameray, A.; Bergeron, Y.; Valeria, O.; Montoro Girona, M.; Cavard, X. Forest Carbon Management: A Review of Silvicultural Practices and Management Strategies Across Boreal, Temperate and Tropical Forests. Curr. For. Rep. 2021, 7, 245–266. [Google Scholar] [CrossRef]
  12. Thorpe, H.C.; Thomas, S.C.; Caspersen, J.P. Residual-tree growth responses to partial stand harvest in the black spruce (Picea mariana) boreal forest. Can. J. For. Res. 2007, 37, 1563–1571. [Google Scholar] [CrossRef]
  13. Gauthier, M.M.; Barrette, M.; Tremblay, S. Commercial Thinning to Meet Wood Production Objectives and Develop Structural Heterogeneity: A Case Study in the Spruce-Fir Forest, Quebec, Canada. Forests 2015, 6, 510–532. [Google Scholar] [CrossRef]
  14. Bose, A.K.; Weiskittel, A.; Kuehne, C.; Wagner, R.G.; Turnblom, E.; Burkhart, H.E. Tree-level growth and survival following commercial thinning of four major softwood species in North America. For. Ecol. Manag. 2018, 427, 355–364. [Google Scholar] [CrossRef]
  15. Pukkala, T. Does biofuel harvesting and continuous cover management increase carbon sequestration? For. Policy Econ. 2014, 43, 41–50. [Google Scholar] [CrossRef]
  16. Montoro Girona, M.; Morin, H.; Lussier, J.M.; Ruel, J.C. Post-cutting Mortality Following Experimental Silvicultural Treatments in Unmanaged Boreal Forest Stands. Front. For. Glob. Chang. 2019, 2, 4. [Google Scholar] [CrossRef]
  17. Ruel, J.C.; Gardiner, B. Mortality patterns after different levels of harvesting of old-growth boreal forests. For. Ecol. Manag. 2019, 448, 346–354. [Google Scholar] [CrossRef]
  18. Moussaoui, L.; Leduc, A.; Girona, M.M.; Bélisle, A.C.; Lafleur, B.; Fenton, N.J.; Bergeron, Y. Success Factors for Experimental Partial Harvesting in Unmanaged Boreal Forest: 10-Year Stand Yield Results. Forests 2020, 11, 1199. [Google Scholar] [CrossRef]
  19. Xie, S.H.; Kurz, W.A.; McFarlane, P.N. Inward- versus outward-focused bioeconomy strategies for British Columbia’s forest products industry: A harvested wood products carbon storage and emission perspective. Carbon Balance Manag. 2021, 16, 30. [Google Scholar] [CrossRef] [PubMed]
  20. MELCCFP; MAPAQ. GES 1990–2020. Méthodologie de Calcul D’émissions, Description des Secteurs et Facteurs D’émission. Annexes à L’inventaire Québécois des Émissions de Gaz à Effet de Serre en 2020 et Leur Évolution Depuis 1990; Annexes Techniques; Direction des Communications du MELCCFP: Québec City, QC, Canada, 2022.
  21. Forster, P.; Ramaswamy, V.; Artaxo, P.; Berntsen, T.; Betts, R.; Fahey, D.W.; Haywood, J.; Lean, J.; Lowe, D.C.; Raga, G.; et al. 2007: Changes in Atmospheric Constituents and in Radiative Forcing. In Climate Change 2007: The Physical Science Basis. Contribution of Working Group I to the Fourth Assessment Report of the Intergovernmental Panel on Climate Change; Solomon, S., Qin, D., Manning, M., Chen, Z., Marquis, M., Averyt, K.B., Tignor, M., Miller, H.L., Eds.; Cambridge University Press: Cambridge, UK; New York, NY, USA, 2007; p. 106. [Google Scholar]
  22. Leskinen, P.; Cardellini, G.; González-García, S.; Hurmekoski, E.; Sathre, R.; Seppälä, J.; Smyth, C.; Stern, T.; Verkerk, P.J.; European Forest Institute. Substitution Effects of Wood-Based Products in Climate Change Mitigation; From Science to Policy; European Forest Institute: Joensuu, Finland, 2018. [Google Scholar] [CrossRef]
  23. Seppälä, J.; Heinonen, T.; Pukkala, T.; Kilpeläinen, A.; Mattila, T.; Myllyviita, T.; Asikainen, A.; Peltola, H. Effect of increased wood harvesting and utilization on required greenhouse gas displacement factors of wood-based products and fuels. J. Environ. Manag. 2019, 247, 580–587. [Google Scholar] [CrossRef]
  24. Hurmekoski, E.; Smyth, C.E.; Stern, T.; Verkerk, P.J.; Asada, R. Substitution impacts of wood use at the market level: A systematic review. Environ. Res. Lett. 2021, 16, 123004. [Google Scholar] [CrossRef]
  25. Harmon, M.E. Have product substitution carbon benefits been overestimated? A sensitivity analysis of key assumptions. Environ. Res. Lett. 2019, 14, 065008. [Google Scholar] [CrossRef]
  26. Howard, C.; Dymond, C.C.; Griess, V.C.; Tolkien-Spurr, D.; van Kooten, G.C. Wood product carbon substitution benefits: A critical review of assumptions. Carbon Balance Manag. 2021, 16, 9. [Google Scholar] [CrossRef]
  27. Xu, Z.; Smyth, C.E.; Lemprière, T.C.; Rampley, G.J.; Kurz, W.A. Climate change mitigation strategies in the forest sector: Biophysical impacts and economic implications in British Columbia, Canada. Mitig. Adapt. Strateg. Glob. Chang. 2018, 23, 257–290. [Google Scholar] [CrossRef] [PubMed]
  28. Levasseur, A.; Lesage, P.; Margni, M.; Deschênes, L.; Samson, R. Considering Time in LCA: Dynamic LCA and Its Application to Global Warming Impact Assessments. Environ. Sci. Technol. 2010, 44, 3169–3174. [Google Scholar] [CrossRef]
  29. Brandão, M.; Levasseur, A.; Kirschbaum, M.U.F.; Weidema, B.P.; Cowie, A.L.; Jørgensen, S.V.; Hauschild, M.Z.; Pennington, D.W.; Chomkhamsri, K. Key issues and options in accounting for carbon sequestration and temporary storage in life cycle assessment and carbon footprinting. Int. J. Life Cycle Assess. 2013, 18, 230–240. [Google Scholar] [CrossRef]
  30. Breton, C.; Blanchet, P.; Amor, B.; Beauregard, R.; Chang, W.S. Assessing the Climate Change Impacts of Biogenic Carbon in Buildings: A Critical Review of Two Main Dynamic Approaches. Sustainability 2018, 10, 2020. [Google Scholar] [CrossRef]
  31. Saucier, J.P.; Bergeron, J.F.; Grondin, P.; Robitaille, A. Les régions écologiques du Québec méridional: Un des éléments du système hiérarchique de classification écologique du territoire mis au point par le Ministère des Ressources Naturelles. MNRQ 1998, 1, 1–12. [Google Scholar]
  32. Bureau de Mise en Marché des Bois. Guide D’analyse économique Appliquée aux Investissements Sylvicoles; Bureau de Mise en Marché des Bois: Québec City, QC, Canada, 2018; Volume 1.
  33. Kurz, W.A.; Dymond, C.C.; White, T.M.; Stinson, G.; Shaw, C.H.; Rampley, G.J.; Smyth, C.; Simpson, B.N.; Neilson, E.T.; Trofymow, J.A.; et al. CBM-CFS3: A model of carbon-dynamics in forestry and land-use change implementing IPCC standards. Ecol. Model. 2009, 220, 480–504. [Google Scholar] [CrossRef]
  34. Harel, A.; Thiffault, E.; Paré, D. Ageing forests and carbon storage: A case study in boreal balsam fir stands. Forestry 2021, 94, 651–663. [Google Scholar] [CrossRef]
  35. IPCC. 2013 Revised Supplementary Methods and Good Practice Guidance Arising from the Kyoto Protocol; Technical Report; IPCC: Interlaken, Switzerland, 2014. [Google Scholar]
  36. IPCC. IPCC Guidelines for National Greenhouse Gas Inventory; Technical Report; IPCC: Kyoto, Japan, 2006. [Google Scholar]
  37. Rüter, S.; Matthews, R.; Lundblad, M.; Sato, A.; Hassan, R. Volume 4, Chapter 12: Harvested Wood products. In 2019 Refinement to the 2006 IPCC Guidelines for National Greenhouse Gas Inventories; Technical Report; IPCC: Interlaken, Switzerland, 2019. [Google Scholar]
  38. Sathre, R.; O’Connor, J. Meta-analysis of greenhouse gas displacement factors of wood product substitution. Environ. Sci. Policy 2010, 13, 104–114. [Google Scholar] [CrossRef]
  39. Beauregard, R.; Lavoie, P.; Thiffault, E.; Ménard, I.; Moreau, L.; Boucher, J.F.; Robichaud, F. Rapport du Groupe de Travail sur la Foret et les Changements Climatiques; Technical Report; GTFCC: Quebec, QC, Canada, 2019. [Google Scholar]
  40. Gao, B.; Taylor, A.R.; Searle, E.B.; Kumar, P.; Ma, Z.; Hume, A.M.; Chen, H.Y.H. Carbon Storage Declines in Old Boreal Forests Irrespective of Succession Pathway. Ecosystems 2018, 21, 1168–1182. [Google Scholar] [CrossRef]
  41. Smyth, C.E.; Xu, Z.; Lemprière, T.C.; Kurz, W.A. Climate change mitigation in British Columbia’s forest sector: GHG reductions, costs, and environmental impacts. Carbon Balance Manag. 2020, 15, 21. [Google Scholar] [CrossRef]
  42. Gundersen, P.; Thybring, E.E.; Nord-Larsen, T.; Vesterdal, L.; Nadelhoffer, K.J.; Johannsen, V.K. Old-growth forest carbon sinks overestimated. Nature 2021, 591, E21–E23. [Google Scholar] [CrossRef] [PubMed]
  43. Sharma, T.; Kurz, W.A.; Stinson, G.; Pellatt, M.G.; Li, Q. A 100-year conservation experiment: Impacts on forest carbon stocks and fluxes. For. Ecol. Manag. 2013, 310, 242–255. [Google Scholar] [CrossRef]
  44. Houndode, D.J.; Krause, C.; Morin, H. Predicting balsam fir mortality in boreal stands affected by spruce budworm. For. Ecol. Manag. 2021, 496, 119408. [Google Scholar] [CrossRef]
  45. Kallio, A.M.I.; Solberg, B. Leakage of forest harvest changes in a small open economy: Case Norway. Scand. J. For. Res. 2018, 33, 502–510. [Google Scholar] [CrossRef]
  46. Nepal, P.; Ince, P.J.; Skog, K.E.; Chang, S.J. Forest carbon benefits, costs and leakage effects of carbon reserve scenarios in the United States. J. For. Econ. 2013, 19, 286–306. [Google Scholar] [CrossRef]
  47. Hu, X.; Shi, G.; Hodges, D.G. International Market Leakage from China’s Forestry Policies. Forests 2014, 5, 2613–2625. [Google Scholar] [CrossRef]
  48. FAO. Forest Products in the Global Bioeconomy Enabling Substitution by Wood-Based Products and Contributing to the Sustainable Development Goals; Technical Report; FAO: Roma, Italy, 2022. [Google Scholar] [CrossRef]
  49. Hassegawa, M.; Karlberg, A.; Hertzberg, M.; Verkerk, P. Innovative forest products in the circular bioeconomy. Open Res. Eur. 2022, 2, 19. [Google Scholar] [CrossRef]
  50. Hurmekoski, E.; Kunttu, J.; Heinonen, T.; Pukkala, T.; Peltola, H. Does expanding wood use in construction and textile markets contribute to climate change mitigation? Renew. Sustain. Energy Rev. 2023, 174, 113152. [Google Scholar] [CrossRef]
  51. Smith, P.; Bustamante, M.; Ahammad, H.; Clark, H.; Dong, H.; Elsiddig, E.; Haberl, H.; Harper, R.; House, J.; Jafari, M.; et al. Climate Change 2014 Mitigation of Climate Change: Working Group III Contribution to the Fifth Assessment Techreport of the Intergovernmental Panel on Climate Change; Technical Report; Cambridge University Press: Cambridge, UK, 2014. [Google Scholar] [CrossRef]
  52. Chen, J.; Ter-Mikaelian, M.T.; Ng, P.Q.; Colombo, S.J. Ontario’s managed forests and harvested wood products contribute to greenhouse gas mitigation from 2020 to 2100. For. Chron. 2018, 94, 269–282. [Google Scholar]
  53. Chen, J.; Ter-Mikaelian, M.T.; Yang, H.; Colombo, S.J. Assessing the greenhouse gas effects of harvested wood products manufactured from managed forests in Canada. Forestry 2018, 91, 193–205. [Google Scholar] [CrossRef]
  54. Hurmekoski, E.; Jonsson, R.; Korhonen, J.; Jänis, J.; Mäkinen, M.; Leskinen, P.; Hetemäki, L. Diversification of the forest industries: Role of new wood-based products. Can. J. For. Res. 2018, 48, 1417–1432. [Google Scholar] [CrossRef]
  55. Montoro Girona, M.; Morin, H.; Lussier, J.M.; Walsh, D. Radial Growth Response of Black Spruce Stands Ten Years after Experimental Shelterwoods and Seed-Tree Cuttings in Boreal Forest. Forests 2016, 7, 240. [Google Scholar] [CrossRef]
  56. Montoro Girona, M.; Rossi, S.; Lussier, J.M.; Walsh, D.; Morin, H. Understanding tree growth responses after partial cuttings: A new approach. PLoS ONE 2017, 12, e0172653. [Google Scholar] [CrossRef]
  57. Boivin-Dompierre, S.; Achim, A.; Pothier, D. Functional response of coniferous trees and stands to commercial thinning in eastern Canada. For. Ecol. Manag. 2017, 384, 6–16. [Google Scholar] [CrossRef]
  58. Moreau, G.; Achim, A.; Pothier, D. Growth and survival dynamics of partially cut northern hardwood stands as affected by precut competition and spatial distribution of residual trees. Forestry 2020, 93, 96–106. [Google Scholar] [CrossRef]
  59. Chen, J.; Colombo, S.J.; Ter-Mikaelian, M.T.; Heath, L.S. Carbon Profile of the Managed Forest Sector in Canada in the 20th Century: Sink or Source? Environ. Sci. Technol. 2014, 48, 9859–9866. [Google Scholar] [CrossRef]
  60. Smyth, C.; Rampley, G.; Lemprière, T.C.; Schwab, O.; Kurz, W.A. Estimating product and energy substitution benefits in national-scale mitigation analyses for Canada. GCB Bioenergy 2017, 9, 1071–1084. [Google Scholar] [CrossRef]
  61. Kalliokoski, T.; Bäck, J.; Boy, M.; Kulmala, M.; Kuusinen, N.; Mäkelä, A.; Minkkinen, K.; Minunno, F.; Paasonen, P.; Peltoniemi, M.; et al. Mitigation Impact of Different Harvest Scenarios of Finnish Forests That Account for Albedo, Aerosols, and Trade-Offs of Carbon Sequestration and Avoided Emissions. Front. For. Glob. Chang. 2020, 3, 562044. [Google Scholar] [CrossRef]
  62. Kellomäki, S.; Väisänen, H.; Kirschbaum, M.U.F.; Kirsikka-Aho, S.; Peltola, H. Effects of different management options of Norway spruce on radiative forcing through changes in carbon stocks and albedo. Forestry 2021, 94, 588–597. [Google Scholar] [CrossRef]
  63. Gouvernement du Québec. Chapter Q-2, r.19 Regulation Respecting the Landfilling and Incineration of Residual Materials—Environment Quality Act. Quebec; Gouvernement du Québec: Quebec, QC, Canada, 2021.
  64. Environment and Climate Change Canada. Federal Offset Protocol: Landfill Methane Recovery and Destruction. Version 1 Junne 2022; Offset Protocol; Environment and Climate Change Canada: Ottawa, ON, Canada, 2022.
Figure 1. Forest management scenario identification flowchart. For scenario names, the Roman numeral corresponds to the harvest type family, the Arabic numeral corresponds to the windthrow assumption (0% or 50%), and the final letter corresponds to the simulated carbon dynamics. The windthrow and carbon dynamics alternative occurred only during the partial cutting period, if any.
Forests 14 01109 g001
Figure 2. Cumulative forest ecosystem carbon budget per hectare over time. Results shown in this figure are in tonnes of carbon per hectare and are exclusively from the forest ecosystem. Positive values represent a carbon source to the atmosphere, and negative values represent a carbon sink. For scenario names, the Roman numeral corresponds to the harvest type, the Arabic numeral to the windthrow assumption, and the last letter to the carbon dynamics assumption following partial cut (if any). Default (a) carbon dynamics from Senez-Gagnon et al. [9] for clearcut, DOM stable (b) modified the Default by stabilizing DOM pools after the cut (no positive or negative DOM stock variation), and the DOM stable + Vegetation stable (c) assumption modified the Default (a) by stabilizing all ecosystem carbon pools (ecosystem carbon sequestration equal to emissions).
Forests 14 01109 g002
Figure 3. Cumulative forest sector carbon and carbon dioxide equivalent budgets per hectare over time. Results shown in this Figure are in tonnes of carbon (solid lines) and in tonnes of carbon dioxide equivalent (dashed lines) for the whole forest sector (emissions and removals from forest ecosystems, decay of wood products, and substitution effects of wood products on markets). Positive values represent a carbon source to the atmosphere, and negative values represent a carbon sink. For scenario names, the Roman numeral corresponds to the harvest type, the Arabic numeral to the windthrow assumption, and the last letter to the carbon dynamics assumption following partial cut. Default (a) carbon dynamics from Senez-Gagnon et al. [9] for clearcut, DOM stable (b) modified the Default by stabilizing DOM pools after the cut (no positive or negative DOM stock variation) and the DOM stable + Vegetation stable (c) assumption modified the Default (a) by stabilizing all ecosystem carbon pools (ecosystem sequestration equal to emissions).
Forests 14 01109 g003
Figure 4. Cumulative carbon dioxide equivalent mitigation potential relative to the reference scenario. All results shown are relative to the reference scenario (Natural Evolution) and are in tonnes of carbon dioxide equivalent for the whole forest sector (emissions and removals from forest ecosystems, decay of wood products, and substitution effects of wood products on markets). Positive values represent a carbon source, and negative values represent a carbon sink relative to the reference scenario. For scenario names, the Roman numeral corresponds to the harvest type, the Arabic numeral to the windthrow assumption, and the last letter to the simulated carbon dynamics assumption following partial cut (if any). Default (a) carbon dynamics from Senez-Gagnon et al. [9] for clearcut, DOM stable (b) modified the Default by stabilizing DOM pools after the cut (no positive or negative DOM stock variation), and the DOM stable + Vegetation stable (c) assumption modified the Default (a) by stabilizing all ecosystem carbon pools (ecosystem carbon sequestration equal to emissions).
Forests 14 01109 g004
Figure 5. Breakdown of the cumulative carbon dioxide equivalent mitigation potential relative to the reference. All results shown are relative to the reference scenario (Natural Evolution) and are in tonnes of carbon dioxide equivalent for the whole forest sector (emissions and removals from forest ecosystems in blue, decomposition of wood products in green, and substitution effects of wood products on markets in yellow). Positive values represent a carbon source, and negative values represent a carbon sink relative to the reference scenario. Product (CH 4 ) and (CO 2 ) are a breakdown of product decomposition emissions per carbon form. For scenario names, the Roman numeral corresponds to the harvest type, the Arabic numeral to the windthrow assumption, and the last letter to the carbon dynamics assumption following partial cut (if any). Default (a) carbon dynamics from Senez-Gagnon et al. [9] for clearcut, DOM stable (b) modified the Default by stabilizing DOM pools after the cut (no positive or negative DOM stock variation) and the DOM stable + Vegetation stable (c) assumption modified the Default (a) by stabilizing all ecosystem carbon pools (ecosystem carbon sequestration equal to emissions).
Forests 14 01109 g005
Figure 6. Cumulative carbon and carbon dioxide equivalent mitigation potential per tonne of carbon in harvested wood over time. All results shown are relative to the reference scenario (Natural Evolution) and are in tonnes of carbon dioxide equivalent (dashed lines) or tonnes of carbon (solid lines) for the whole forest sector (emissions and removals from forest ecosystems, decay of wood products, and substitution effects of wood products on markets). Positive values represent a carbon source, and negative values represent a carbon sink per tonne of carbon in harvested wood. For scenario names, the Roman numeral corresponds to the harvest type, the Arabic numeral to the windthrow assumption, and the last letter to the carbon dynamics assumption following partial cut (if any). Default (a) carbon dynamics from Senez-Gagnon et al. [9] for clearcut, DOM stable (b) modified the Default by stabilizing DOM pools after the cut (no positive or negative DOM stock variation), and the DOM stable + Vegetation stable (c) assumption modified the Default (a) by stabilizing all ecosystem carbon pools (ecosystem carbon sequestration equal to emissions).
Forests 14 01109 g006
Figure 7. Cumulative radiative forcing relative to the reference. All results shown are relative to the reference scenario (Natural Evolution) for the whole forest sector (emissions and removals from forest ecosystems, decay of wood products, and substitution effects of wood products on markets). Positive values represent a warming effect, and negative values represent a cooling effect for a particular scenario relative to the reference. For scenario names, the Roman numeral corresponds to the harvest type, the Arabic numeral to the windthrow assumption, and the last letter to the carbon dynamics assumption following partial cut (if any). Default (a) carbon dynamics defined by Senez-Gagnon et al. [9] for clearcut, DOM stable (b) modified the Default by stabilizing DOM pools after the cut (no positive or negative DOM stock variation), and the DOM stable + Vegetation stable (c) assumption modified the Default (a) by stabilizing all ecosystem carbon pools (ecosystem carbon sequestration equal to emissions).
Forests 14 01109 g007
Disclaimer/Publisher’s Note: The statements, opinions and data contained in all publications are solely those of the individual author(s) and contributor(s) and not of MDPI and/or the editor(s). MDPI and/or the editor(s) disclaim responsibility for any injury to people or property resulting from any ideas, methods, instructions or products referred to in the content.

