Abstract
This study is intended for forest owners considering options to increase the efficiency of the production of forest seedlings in automated nurseries. In the short rotation technology of the Scots pine (Pinus sylvestris L.), the production of seedlings was integrated in the process of grading seeds by spectrometric features, followed by the fall outplanting of containerized seedlings to a restorable post-pyrogenic site. There are studies of the spectrometric effect grading viable seeds, but a negligible amount of testing has been conducted on the seedling’s field performance from these seeds. It was very important for us to evaluate the morphogenesis of juvenile Scots pine trees in relation to the change in morphological features—increase in root collar diameter (RCD-increment) and increase in stem height (SH-increment)—in the second and third growing season from the field outplanting. To determine the nature of the interaction between independent (RCD increase), dependent (SH-increment), and categorical (seed spectrometric categories and timespans) variables, a regression analysis was performed using the R statistical software. All coefficients of the linear models are statistically significant at the 1% significance level, and all are positively associated with an increase in seedling height. On average, a RCD increment by 0.1 cm causes a SH-increment by 0.72 ± 0.16 cm (p = 9.779 × 10⁻⁶). In addition, in 2020, compared to 2019, the SH-increment was 5.46 ± 0.37 cm (p < 0.001). The seeds’ differentiation into spectrometric categories is strongly correlated with the stem height increment (p < 0.001). Thus, in order to improve the plant propagation protocol, it seems advisable to first condition the seeds in accordance with the spectrometric feature, and to then apply a coating (by pelleting or encapsulating) in order to improve the storage and seeding conditions. For a medium-term assessment of the short rotation technology with an integrated seed spectrometric grading in the future, the morphogenesis of Scots pine trees at 5, 7 and 10 growing seasons from the seedlings field outplanting is controlled.
1. Introduction
The title of the paper reflects the aim to determine the relationship between the grading process of Scots pine seeds with the breakdown by spectrometric properties and sizes that are integrated into the containerized technology for the production of forest reproductive material. Along with that, it is necessary to take into account the ecophysiological aspects of the juvenile tree’s growth while implementing an integrated approach to ecological restoration. Our approach includes the set of management concepts and technologies as a set of operations [1], combining the AFM [2] (Adaptive Forest Management) and FLR [3] (Forest Landscape Restoration) approaches. An important component of the integrated approach is the adaptation of trees to climate change. Firstly, adaptation can occur due to genetic mechanisms [4]. Secondly, adaptation may be due, but not always [5], to phenological plasticity [4].
Since the spectrometric properties and the size of the seeds are both genetic and phenological signs, the choice of the tree species for the study has not been made by chance. First, according to Hallingbäck et al. (2021) “conifers present higher adaptation rates for tree growth [4]”. Second, the Scots pine (Pinus sylvestris L.) is prevalent in “wide climatic niche [6]”. Third, the ability of Scots pine trees as a head in mixed can stand with birch (Betula spp.) [7], European beech (Fagus sylvatica L.) [8], under the conditions of climate change, giving a greater increase than in monocultures, which makes this breed economically attractive for a complex approach of restoration.
The Scots pine seed coat colour is under genetic control, and it can be used as a phenotypic marker [9,10,11,12,13,14]. There is a more than century-old interest of scientists [15,16,17,18] to study the seeds of Scots pine with different spectrometric properties [19,20] and, also, to study the growth of juvenile trees obtained from these seeds [21]. As for the size of the seeds, a direct correlation between the Scots pine seed size and seedling growth intensity is not always observed, since both empty large seeds and fossilized seeds are often found in seed lots. The former can be easily eliminated on an air separator, but the latter are very difficult to eliminate due to having the same density as sound seeds.
The spectrometric parameters of the seed coat in the vast majority of these experiments were determined by researchers in an organoleptic way, and color calibration did not occur quantitatively. We can state, unequivocally, only that there is a difference in the seed’s germination and the growth of the seedlings. There are studies in which the physiological parameters of pine seedlings grown from light seeds prevail over seedlings from dark seeds [16] and vice versa [21]. There are also studies of laboratory germination of seeds that do not differ in germination energy and cumulative germination between color seed groups [22].
Application of the spectrometric effect in the detection of pine seeds [23] allows us to accurately grade seeds according to the absorption index depending on the wavelength [24]. The effect of the spectrometric effect with accurate grading of Scots pine seeds on the morphogenesis of Scots pine in the juvenile stage is not practically represented in the empirical literature, especially for the currently widely used short rotation technology for obtaining forest reproductive material of Scots pine in an automated containerized nursery, with the transfer of containerized seedlings to a restorable post-pyrogenic site. Ontogenesis at the juvenile stage of the development of woody plants makes it possible to fully assess the degree of difference between phenetic traits, since by the age of “8–10 there is a tendency to equalize the heights of trees of different types of morphogenesis, as well as a change in their ranks according to the intensity of growth [25]”. Aiming to assess the effect of seed coat color to the quality of seedlings, we have measured seedling height (SH) and root collar diameter (RCD) as the most widely used attributes measured in seedling quality assessment [14,26,27].
Growth rates—RCD-increment and SH-increment—of juvenile crops of Scots pine (P. sylvestris L.) after transplantation into the field will be important to a forest farmer when modeling the biomass of a future forest, since “trees and forests grow and react to environmental changes in several ways simultaneously, for example, changes in radial growth and height growth” [28].
The purpose of this paper is to detect the effect of the RCD-increment on the SH-increment, focusing on the seed’s spectrometric categories in an ongoing experiment to obtain forest reproductive material of Scots pine (P. sylvestris L.). The study includes improving the quality of Scots pine (P. sylvestris L.) seeds by spectrometric grading, seeding in a containerized nursery, outplanting containerized seedlings on the post-fire experimental site [14], and control of the ontogenesis of trees during the first, second, and third growing seasons.
2. Materials and Methods
2.1. Experimental Setup
The study design (Appendix A) was carried out according to the Fall Planting scenario [29] for containerized nursery by integrating seed spectrometric grading.
2.1.1. Seed Collecting, Pretreatment and Differentiation
P. sylvestris L. seeds were obtained from cones collected in a natural stand no more than 1.3° away from the experimental site in latitude [30] in the Pavlovsky district of the Voronezh Region (Russia).
For differentiation (1-milestone on Figure A1, Appendix A), seeds were taken that had been previously prepared with a drum-type wet de-winger (Dewinger-800—BCC AB, Landskrona, Sweden), and were then dried in a chamber (DL-1200—BCC AB, Sweden) at a moisture level of 7.5% [14]. Empty seeds were then eliminated by gravity method [31] using gravity separator (Mini-Series—BCC AB, Landskrona, Sweden). The seeds were then separated according to the spectrometric feature in the visible and infrared regions of optical radiation wavelengths.
The technological criteria for seed differentiation are presented in Table 1. Further, seeds in each category (2, 3, and 4), using the Cleaner and Seed Sizer (Mini-Series—BCC AB, Landskrona, Sweden), were divided into two dimensional fractions and received categories 5, 6, 7 and 8, 9, and 10, respectively. For this purpose, sieves with round punching holes with diameters of 2.5 and 3.25 mm were used.

Table 1.
Technological criteria for Scots pine seed differentiation used in the study. The choice of wavelength is related to the peculiarities of seed grading by spectrometric properties (reproduced from [23]).
2.1.2. Container’s Seeding
The seeds were sown using an automatic line (BCC AB, Landskrona, Sweden). The line included a batch mixer, a flexi filler for filling containers with substrate (acid peat), a dibbler, a precision seeder, and a mulcher. After filling 40-cell containers (Hiko V-120 SideSlit—BCC AB, Landskrona, Sweden) with the cell size 40 × 40 × 110 mm, a cone-shaped hole is formed by the substrate in each cell. At the bottom of the wells, all 40 cells of the container were then simultaneously automatically sown (2-milestone on Figure A1, Appendix A) with a single seed and mulched with perlite. Containers with seeds were positioned in greenhouse #2 with automatized watering, temperature, and humidity control. The greenhouse vegetation of seedlings (5-timespan on Figure A1, Appendix A) lasted until the relocation of containers (6-milestone on Figure A1, Appendix A) to the tempering platform. Seedlings tempering vegetation (7-timespan on Figure A1, Appendix A) lasted until outplanting seedlings (8-milestone on Figure A1, Appendix A) to the experimental site.
2.1.3. Container’s Germination
Germination was defined as the appearance of a seedling through mulch. The germination percentage was calculated in each container for seeds of all categories (see Table 1) from 30 (3-milestones on Figure A1, Appendix A) to 50 (4-milestones on Figure A1, Appendix A) days by analogy with Mañas et al. [33] after sowing. The container’s germination may be characterized by substrate [34], temperature conditions [35], and seed viability [36].
2.1.4. Experimental Site
Container-grown seedlings were outplanted on 24 October 2017 (8-milestone on Figure A1, Appendix A) at the experimental site. The experimental site was founded under Dr. Arthur Novikov leadership and is a scientific object of Voronezh State University of Forestry and Technologies (VSUFT). The site is located (51.827861; 39.363806; 100.8 m a.s.l.) on pyrogenically disturbed areas in 2010 of the Educational and Experimental Forestry Center of VSUFT. At a distance of 1.0 m, with the help of a plow aggregated with a tractor in the sandy soil, parallel furrows were cut to a depth of about 0.2 m. Seedlings were planted on a previously furrowed soil (without uprooting the remaining stumps) in the bottom of the furrow under the Kolesov sword at a distance of 0.7 m (between the seedlings in one row) × 1 m (between rows) [14]. According to Grossnickle and MacDonald (2017) [29], fall-planting seedlings are characterized by increased resistance to drought, initial frost resistance, moderately intensive root growth, and the balanced nutrition of seedlings. However, choosing autumn as the planting period, it is necessary to take into account biological risks (Table 2)––namely, slightly reduced growth with unchanged preservation [37]––and they can be planted if the climatic conditions are favorable [38].
Table 2.
Biological risk levels of containerized seedlings outplanted on the field (adapted from the publication with an open access license: Grossnickle, S.C.; MacDonald, J.E. Fall Planting Option: A Biological Perspective to Support a Successful Outcome; 2017. Available online: https://vimeo.com/445651112 [29]) (accessed on 12 January 2023).
2.1.5. Thermophysiological Conditions during Growing Season
The beginning and end of the first, second, and third growing season vegetation periods (VP1, VP2, and VP3 on Figure 1) were determined based on the fact that, according to Redko (1983), the biological (thermophysiological) minimum of vegetation for the Scots pine is equal to 4.5 °C [39]. The conditional point of the beginning of the growing season is the day when the average daily temperature is higher by 4.5 °C. The end of the growing season end was determined based on the vegetative timespan of the Scots pine (P. sylvestris L.) in the conditions of the experimental site that stops in the period of the end of August to the beginning of September [40], although it is possible for growth to continue until September–October [41]. Considering the research in the field of the vegetation of Scots pine, the moment at the end of the previous growing season after transplanting from a containerized nursery is the moment of the beginning of the next growing season––namely, the day after which a significant excess of the thermophysiological minimum is predicted according to meteorological services (which, in our case, was 28 March). Thus, the time milestones for measuring the biometric parameters of seedlings for the second growing season (VP2) were set on 28 March 2020, and the third growing season (VP3) was SET on 28 March 2021. At the same time, the temperature conditions of the second and third growing seasons are presented below in Table 3.
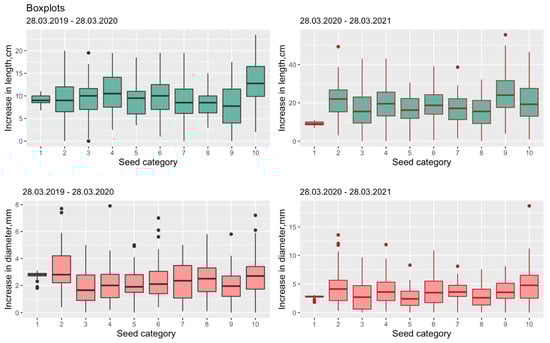
Figure 1.
Box plots for SH-increment and RCD-increment from (1–10) seed grading categories during VP2 (left) and VP3 (right) timespans accordingly. SH is seedling height, RCD is root collar diameter.
Table 3.
Temperature data for the growing season during the study in the Voronezh Region (51.650, 39.250) (adapted from the site with an open access license: http://pogoda-service.ru/ [accessed on 30 December 2022]).
2.2. Data Processing
2.2.1. Data Measuring
Biometric parameters were measured for the seedling outplanting of Scots pine as follows. Seedling Height (SH) was measured from the root collar to the base of the terminal bud [33] using a metal ruler with an accuracy of 1 mm [42]. For stem diameter or Root Collar Diameter (RCD), two measurements were taken from each seed’s technological category (Table 1). The second measurement was the transverse section of the first and the mean diameter was calculated. A 0.1 mm resolution digital caliper was used. Stem diameter [42,43,44] is a fairly stable and statistically significant indicator for the characteristics of both the growth and the survival of the tree. SH, meanwhile, characterizes both the photosynthetic ability [45] and the area of their transpiration, since it strongly correlates with the number of needles.
2.2.2. Statistical Procedure
All the statistical analyses were carried out using R Studio software (IDE for R programming language) [46].
The distribution of SH-increment and RCD-increment seedlings for two and three timespans as differences between VP2 and VP1, and VP3 and VP2 (Figure 1). Biometric measurements (n > 1000) were represented by descriptive statistics and visualized by boxplots, which allowed the estimation of median values of variables as well as a tablecloth determining the preliminary nature of the interaction between independent (stem diameter), dependent (seedling height), and categorical (seed categories and timespans) variables.
The linear model from the R-package “NLMe” [47,48] has been used to analyze differences in annual RCD-increment under different seed grading categories. As a result of regression analysis of n = 543 juvenile trees (N = 1086), two regression models with RCD2, SH2 and RCD3, SH3 increments for categorical variables have been analyzed. In order to check the overall significance of a categorical variable, which has many levels in regression (for us, this is the interaction of diameter and categories; Diameter:factor (Category)), we have carried out ANOVA.
Linear OLS model verification has been carried out according to the following criteria: (1) linearity in parameters; (2) normal distribution of residuals (with a large sample according to the central limit theorem of statistics (this condition can be eliminated, and it makes sense in the case of small samples); (3) homoscedasticity; (4) multicollinearity; and (5) the presence of outliers. The regression relationship was visualized by a regression line with a 95% confidence interval. The model whose only predictor represents the best fit (with the smallest Root-Mean-Squared Error (RMSE) and the largest coefficient of determination R2) is ultimately defined as a basic linear model [49].
We run following regressions, estimated with ordinary least squares (OLS):
Height = Intercept + Diameter + Diameter:factor (Category) + factor (Year);
Height = Intercept+ Diameter:factor (Category) + factor (Year).
3. Results
Germination of seeds in containers of an automated nursery is shown in Table 4.
Table 4.
Scots pine seedling final container’s germination percentage 30 and 50 days after sowing. Different letters mean significant differences at p < 0.05, according to Tukey’s HSD test. Data are expressed as mean ± standard error (Adapted with permission by Arthur I. Novikov from Ref. [32]).
To assess the relationship between SH-increment and RCD-increment, it seems appropriate not to use the absolute values of the SH-increment and RCD-increment but, rather, their increment for the corresponding timespans, VP2 and VP3 (Table 5).
Table 5.
Descriptive statistics of SH- and RCD-increments for VP2 and VP3 timespans.
Descriptive statistics reveal a moderate increase in the average value of increments, a slight increase in the degree of variability of the variables (coefficient of variation) in the VP3-timespan, and some loss of seedlings (nbr.nul) (which were cut off by the cultivator during agrotechnical care due to the incorrectly chosen tractor trajectory followed by the driver).
The distribution of descriptive statistics by seed categories (see Table 1) and the choice of the central trend is demonstrated by Figure 1.
The preliminary nature of the interaction between the independent (stem diameter), dependent (seedling height), and categorical (seed categories and timespans) variables is visualized in Figure 2.
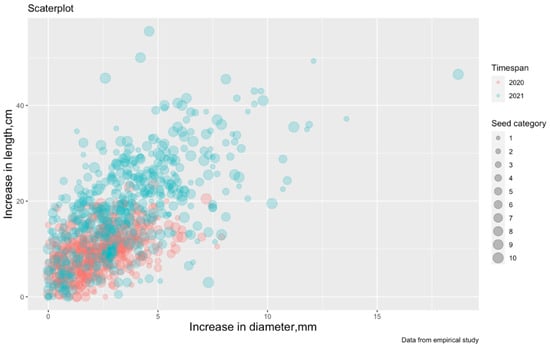
Figure 2.
Scatterplot of SH-increment from RCD-increment (the color marks the difference by observation periods: VP2-2019, VP3- 2020, and the size of the dots determines the seed category from 1 to 10 (from Table 1). SH is seedling height; RCD is root collar diameter; VP is vegetation period.
From Figure 2, it is possible to assume a linear relationship between two variables, and, therefore, it is possible to build a linear regression where the dependent variable (predictor) is an increase in SH-increment and the independent variable (regressor) is a RCD-increment. It is also assumed that the SH-increment is affected by the division of seeds into categories and observation periods (temperature changes from Table 2).
The estimation of the model coefficients by formula (lm1) is given in Table 6.
Table 6.
Evaluation of the significance of the coefficients of the regression Linear Model 1.
To check the overall significance of a categorical variable on many levels (we have this interaction of diameter and categories, Diameter:factor (Category)), we analyze ANOVA (Table 7).
Table 7.
ANOVA (Type II tests) analysis for the categorical variable used in the Linear Model 1. Evaluation of the significance of the coefficients of the regression linear model 1. Significant codes: ‘***’ 0.001. Height—dependent variable.
We can notice that the categorical variable (Diameter:factor (Category)) is statistically significant (p < 0.001). All coefficients are statistically significant at the level of 1%, and they are all positively associated with an increase in seedling height––for example, an increase in diameter by 0.1 cm causes an increase in height by 0.715 cm on average, and, in addition, in 2020 (the second observation period), compared to 2019, the increase was 5.46 cm more, and the division into categories was also affected. In particular, for seed Category 2, the increase was 1.37 cm more compared to seed Category 1.
The verification of Model 1 is shown in Figure 3.

Figure 3.
Diagrams for checking the conditions of applicability of Model 1.
The visualization of Model 1 is shown in Figure 4.
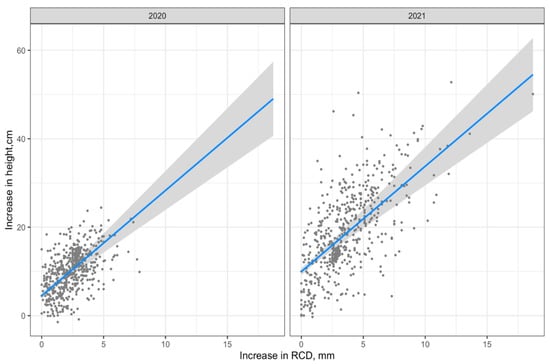
Figure 4.
Visualization of Model 1 (regression line with 95% confidence interval).
The analysis of the diagrams in Figure 5 shows that all of the conditions are more or less met, except for the normality of the distribution of residues on the “tails”, but this can be neglected since the sample is rather large, with more than 1000 observations.
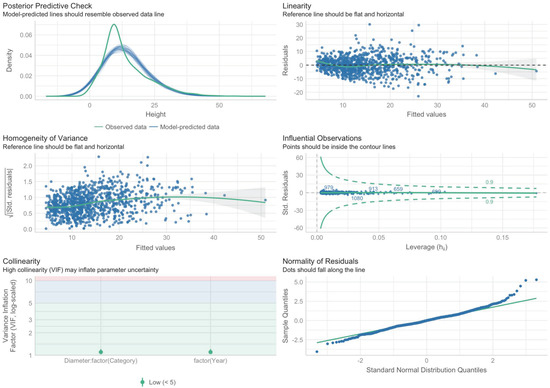
Figure 5.
Diagrams for checking the conditions of applicability of Regression Model 2.
The estimation of the model coefficients by formula (lm2) given in Table 8.
Table 8.
Evaluation of the significance of the coefficients of the regression Linear Model 2.
To check the overall significance of a categorical variable with many levels in regression (we have this interaction of diameter and categories, Diameter:factor (Category)), we analyze ANOVA (Table 9).
Table 9.
ANOVA (Type II tests) analysis for the Diameter:factor (Category) variable used in the linear model 1 (lm1). Evaluation of the significance of the coefficients of the regression Linear Model 2. Significant codes: ‘***’ 0.001. Height—dependent variable.
We can notice here that the categorical variable (Diameter:factor (Category)) is generally significant (null hypothesis is rejected at 1% of significance). All coefficients are statistically significant at the level of 1%, and all of them are positively associated with an increase in the height of the seedling.
The verification of the applicability conditions of Model 2 is shown in Figure 5.
The visualization of Model 2 by formula (lm2) is shown in Figure 6.
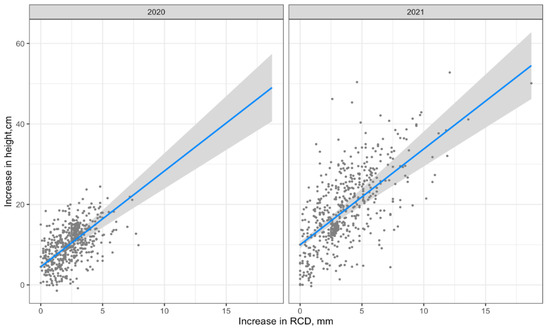
Figure 6.
Visualization of Model 2 (regression line with 95% confidence interval).
Both regressions describe the relationship between the predictor and the regressor adequately (Akaike criteria are equal).
4. Discussion
In the first approximation, the morphological features of Scots pine seedlings outplanted from an automated nursery were compared. For trees grown from seeds ripened in a natural stand (60° north latitude), the SH increase on VP3 timespan was 14.4 cm [50] vs. 17.3 cm for all of the trees of the current study (52° north latitude) without differentiation by spectrometric category. However, in the first study, the measurement of SH was estimated at the highest seedling [50], whereas in the current one, it is measured by the average value of the entire set of measurements. Moreover, the compared study did not take into account RCD, which has a closer positive correlation with the growth after planting seedlings in the field, and which is a better (compared to SH) indicator of the quality of seedlings [51,52]. Moreover, SH can have both positive and negative effects on the growth of seedlings in the field [53]. For pine species, there are studies of the relationship between SH and RCD as SH RCD−1 [44] in other sources as SQ (sturdiness coefficient) [54], which show that SQ is the most reliable sign of a plant for predicting ontogenesis on the field.
The interaction between RCD and SH will make it possible to predict the quality indicators of the seedlings: for example, the seedling sturdiness quotient (SH RCD-1) included in the Dickson Quality Index [55] as well as the possibility of excluding the operation of measuring the height of the seedling using only the RCD measurement. Moreover, a close correlation between these indicators, as shown in a recent study by Jiang et al. [56], may contribute to the selection of the best trees. Another possibility is the one shown in Rodríguez de Prado et al. [57], the height–diameter (H–D) ratio, which, due to the strong correlation between the two, can be “an important tool for estimating the height of trees in mixing forest at various spatio-temporal scales”. Another possibility is the one in Vospernik et al. [58], where the RCD-increment in Scots pine (P. sylvestris L.) depends on the age, the temperature gradient, and mixture with Quercus robur L. According to Degtyareva, a botanist, the «stronger correlation between RCD-increment and SH-increment, the more intense the growth of the tree».
From the point of view of seedling production technology in containerized nurseries, the differentiation of seeds into discrete size groups will have a positive impact. The workflow of automatic seeding machines requires seeds aligned in size, otherwise it is possible to obtain more than one seed into one cell or none at all. This violates the growth space of the seedlings. Outplanting container-grown block of two (or more) seedlings on the site disrupts their normal growth due to competition. The costs of container-grown seedling production are rising, too. According to a number of authors, uniform geometric parameters, and, hence, the weight of seeds in fractions, are preferable, since they affect the speed of both seed growth [59,60] and seedling size [61,62].
Regarding the expediency of separating seeds by quantitative characteristics, some scientists consider the elimination of whole genotypes [63,64] at the same time, so the opinion about the effect on the exclusion of certain maternal genotypes is not so much of separation operations as of a wide range of annual variations in the genetic structure of seeds that are produced at permanent forest seed sites [65]. The results given above show that the seed size itself is not related to ground germination, but that it may be related to it through genetic lines.
The problem of the maximum production of seedlings from seeds cannot be completely solved by separation in the visible wavelength range. In any batch of Scots pine seeds, regardless of geometric, dimensional and color characteristics, non-viable fossils petrified [66] or yielded only empty seeds [67], which do not have a strong correlation with the optical flux absorption index in the visible range or the geometric parameters of the seed. The presence of non-viable seeds in the sown material will lead to inefficient use of the volume of one container and, as a result, inefficient use of the greenhouse and automated containerized nursery as a whole.
The separation of the seeds into discrete spectrometric categories, 2, 3, and 4, may be of some importance when conducting phenetic studies [5,68] related to the study of the features of the color-seeded forms of Scots pine because it provides a clear gradation of spectrometric characteristics.
Moreover, a long-term study by Baltzer et al. (2021) on post-pyrogenic sites of the black spruce biome found that “the set of seedlings in the first years after a fire is a critical factor determining the composition of mature stands for boreal tree species [69]”. Consequently, the planning of the trajectory of the restoration of successions in post-pyrogenic sites [48,70] should extend block I of the FLR algorithm [1] conditional operators for both the selection of the mixture and the method of seed conditioning, as well as the type of restoration—spontaneous [71] or afforestation—and the corresponding scheme of aerial sowing of seeds or planting seedlings.
There is a reasonable opinion that in a tree there are usually only two significantly different seed colors, e.g., black and a lighter black (or speckled), while the seeds with either a lighter color or a darker color are usually of lower quality. There are cones with brown seeds for the good ones and light brown seeds for the inferior ones. The next pair is beige and lighter beige. The lighter-colored seeds in the cone are always of lower quality. Therefore, when mixing cones [72] from the same stand, they should not be sorted into light and dark. Ideally, the seeds should be color segregated according to individual trees. However, this is difficult, labor intensive, energy consuming, and costly.
The statement is quite controversial, since the authors have encountered studies with good growth of seedlings from light seeds. At the same time, it is very useful to convey the impetus for future research, especially in terms of finding an optical criterion for the separation of seeds between individual trees [73] that takes into account the development of modern methods of information processing based on neural networks.
In the future, it is planned to control the Scots pine trees parameters (SH increase and RCD increase) for 5, 7, and 10 years from the moment of the outplanting of seedlings in the field. Moreover, an ambitious goal is planned: to trace the path of each seed from its morphometric and spectrometric parameters to the growth of the seedling––that is, to create a “genetic passport of the tree”, synchronized with the FLR Library [74].
5. Conclusions
The economically valuable operation of the process of improving the selection quality of seeds for the effective use of containerized nursery areas and the maximum yield of reproductive material is separation by spectrometric feature. This will make it possible to fully realize the energy potential of seeds in conditions of favorable controlled temperature and humidity before outplanting containerized seedlings into the field.
In order to comply with the genetic and technological aspects of the differentiation of Scots pine seeds and the improvement of the plant propagation protocol, it is advisable to condition seeds according to a spectrometric trait, subsequent coat them (pelleting or encapsulating), and, immediately before sowing, mechanically size-sort them in order to improve the work of seeders.
The categorical variable (Diameter:factor (Category)) is generally significant (p-value is less than 1% of significance). All coefficients are statistically significant at the level of 1%, and they are all positively associated with an increase in seedling height: for example, an increase in diameter by 1 mm causes an increase in height by 0.715 cm on average, and, addition, the increase in VP3 compared to VP2 was 5.46 cm greater, whilst differentiation into seed categories also statistically significantly affects SH. In particular, for 2-category seeds, the increase was 1.37 cm more than for 1-category seeds.
Both regression models of the RCD-increment and SH -increment relationship predict variables with a high degree and have equal values of the AIC criterion.
In the plant propagation protocol of Scots pine trees, it is advisable to first grade seeds according to spectrometric feature, and to then coat them to improve storage and automated seeding.
Author Contributions
Conceptualization, A.I.N. and T.P.N.; methodology, A.I.N. and P.T.; software, T.P.N.; validation, A.I.N. and T.P.N.; formal analysis, T.P.N., M.V.D., P.T., A.I.N., C.B.M. and S.V.K.; investigation, T.P.N., P.T., A.I.N. and C.B.M.; resources, T.P.N., A.I.N., P.T. and C.B.M.; data curation, T.P.N., A.I.N., C.B.M. and S.V.K.; writing—original draft preparation, T.P.N., M.V.D., P.T., C.B.M., A.I.N. and S.V.K.; writing—review and editing, T.P.N., M.V.D., P.T., C.B.M., A.I.N. and S.V.K.; visualization, T.P.N. and S.V.K.; supervision, M.V.D.; project administration, T.P.N.; funding acquisition, T.P.N. All authors have read and agreed to the published version of the manuscript.
Funding
The development, conceptualization, and validation of the FLR model was carried out by T.P.N., and A.I.N. within the framework of the grant of Russian Science Foundation (RSF), grant number 23-26-00102, https://rscf.ru/project/23-26-00102/, accessed on 12 January 2023. The synthesis of samples was carried out by P.T. with the support of the University of Agriculture in Krakow (Poland). The study of seed spectrometric properties was carried out by C.B.M. with the support of the University of São Paulo (Brazil) within the framework of the grant National Council for Scientific and Technological Development—CNPq (Grant number #314305/2021-1) and the grant of the São Paulo Research Foundation—FAPESP (Grant number #2017/15220-7). Statistical Data analysis and verification was performed by S.V.K. with the support of the Institute of Economic Research of Slovak Academy of Sciences.
Institutional Review Board Statement
Not applicable.
Informed Consent Statement
Not applicable.
Data Availability Statement
The data presented in this study are available on request from the corresponding author. Pinus sylvestris L. seeds were used in this study. The cones were collected in a natural forest stand (Latitude 50.462169; Longitude 40.096446, Altitude 83 m a.s.l.; Voronezh region, Russia).
Acknowledgments
The authors acknowledge the Educational and Experimental Forestry Center (EEFC) of Voronezh State University of Forestry and Technologies (VSUFT), named after G.F. Morozov, for the opportunity to conduct research. We give special thanks to Vladan Ivetic (University in Belgrade—Forestry Faculty), Mulualem Tigabu (Southern Swedish Forest Research Centre, Swedish University of Agricultural Sciences), and Svetlana Degtyareva (Department of Botany and Plant Physiology, VSUFT) for their constructive feedback. The authors would also like to acknowledge the reviewers and the editorial board of the Forests journal for their valuable comments and recommendations that have helped to increase the reader’s interest in the paper. All authors have read and agreed to the published version of the manuscript.
Conflicts of Interest
The authors declare no conflict of interest.
Appendix A
The stages of this study on the integration of spectrometric grading of Pinus sylvestris L. seeds into the Fall-Planting scenario [29] of a containerized nursery. The numbers are indicated by the time milestones (1–4, 6, 8, 10, 12, 14) and the timespans (5, 7, 9, 11, 13) of Scots pine growing. This is adapted and supplemented from [32].

Figure A1.
Gantt-diagram for this study.
Figure A1.
Gantt-diagram for this study.

References
- Novikova, T.P. The choice of a set of operations for forest landscape restoration technology. Inventions 2022, 7, 1. [Google Scholar] [CrossRef]
- Hazarika, R.; Bolte, A.; Bednarova, D.; Chakraborty, D.; Gaviria, J.; Kanzian, M.; Kowalczyk, J.; Lackner, M.; Lstibůrek, M.; Longauer, R.; et al. Multi-actor perspectives on afforestation and reforestation strategies in Central Europe under climate change. Ann. For. Sci. 2021, 78, 60. [Google Scholar] [CrossRef]
- Mansourian, S. From landscape ecology to forest landscape restoration. Landsc. Ecol. 2021, 36, 2443–2452. [Google Scholar] [CrossRef]
- Hallingbäck, H.R.; Burton, V.; Vizcaíno-Palomar, N.; Trotter, F.; Liziniewicz, M.; Marchi, M.; Berlin, M.; Ray, D.; Benito Garzón, M. Managing Uncertainty in Scots Pine Range-Wide Adaptation under Climate Change. Front. Ecol. Evol. 2021, 9, 724051. [Google Scholar] [CrossRef]
- Duputié, A.; Rutschmann, A.; Ronce, O.; Chuine, I. Phenological plasticity will not help all species adapt to climate change. Glob. Chang. Biol. 2015, 21, 3062–3073. [Google Scholar] [CrossRef]
- Benito Garzón, M.; Vizcaíno-Palomar, N. Biogeographical Patterns of Local Adaptation and Plasticity of Mediterranean Pines and Their Implications under Climate Change. In Pines and Their Mixed Forest Ecosystems in the Mediterranean Basin; Springer: Cham, Switzerland, 2021; pp. 71–82. [Google Scholar]
- Mikalajunas, M.; Pretzsch, H.; Mozgeris, G.; Linkevičius, E.; Augustaitiene, I.; Augustaitis, A. Scots pine’s capacity to adapt to climate change in hemi-boreal forests in relation to dominating tree increment and site condition. iForest-Biogeosci. For. 2021, 14, 473–482. [Google Scholar] [CrossRef]
- Pretzsch, H.; del Río, M.; Ammer, C.; Avdagic, A.; Barbeito, I.; Bielak, K.; Brazaitis, G.; Coll, L.; Dirnberger, G.; Drössler, L.; et al. Growth and yield of mixed versus pure stands of Scots pine (Pinus sylvestris L.) and European beech (Fagus sylvatica L.) analysed along a productivity gradient through Europe. Eur. J. For. Res. 2015, 134, 927–947. [Google Scholar] [CrossRef]
- Pravdin, L.F. The main regularities of the geographical variability of Scots pine (Pinus sylvestris L.). In Fundamentals of Forest Science and Forestry; Forestry Publ.: Moscow, Russia, 1960; pp. 245–250. (In Russian) [Google Scholar]
- Grzywacz, A.P.; Rosochacka, J. The colour of Pinus silvestris L. seed and their susceptibility to damping-off. I. The colour and quality of seeds and fatty acids content of the seed coat. For. Pathol. 1980, 10, 138–144. [Google Scholar] [CrossRef]
- Rosochacka, J.; Grzywacz, A.P. The colour of Pinus silvestris L. seeds and their susceptibility to damping-off. II. Colour of seed coats and their chemical composition. For. Pathol. 1980, 10, 193–201. [Google Scholar] [CrossRef]
- Mamaev, S.A. Forms of Intraspecific Variability of Woody Plants (on the Example of Pinaceae Family in the Urals); Science Publ.: Moscow, Russia, 1973. [Google Scholar]
- Boelt, B.; Shrestha, S.; Salimi, Z.; Jørgensen, J.R.; Nicolaisen, M.; Carstensen, J.M. Multispectral imaging—A new tool in seed quality assessment? Seed Sci. Res. 2018, 28, 222–228. [Google Scholar] [CrossRef]
- Novikov, A.I.; Sokolov, S.V.; Drapalyuk, M.V.; Zelikov, V.A.; Ivetić, V. Performance of Scots Pine Seedlings from Seeds Graded by Colour. Forests 2019, 10, 1064. [Google Scholar] [CrossRef]
- Kobranov, N.P. About the color seed race of the Scots pine (Pinus sylvestris L.). Timber Ind. Bull. 1914, 28, 385. (In Russian) [Google Scholar]
- Konovalov, N.A.; Pugach, E.A. Basics of Forest Breeding and Variety Seed Production; Forest Industry: Moscow, Russia, 1978. [Google Scholar]
- Nekrasova, T.P. The Fruiting of Scots Pine in Western Siberia; Academy of Science USSR: Novosibirsk, Russia, 1960. [Google Scholar]
- Pimenov, A.V.; Sedelnikova, T.S. Qualitative evaluation of a shaped variety of Scotch pine at forest-bog complexes of West Siberia. Conifers Boreal Area 2012, 30, 157–161. [Google Scholar]
- Nystrand, O.; Granström, A. Post-dispersal predation on Pinus sylvestris seeds by Fringilla spp.: Ground substrate affects selection for seed color. Oecologia 1997, 110, 353–359. [Google Scholar] [CrossRef]
- Cram, W.H.; Lindquist, C.H. Maturity of Scots pine cones. For. Chron. 1979, 55, 170–174. [Google Scholar] [CrossRef]
- Mukassabi, T.A.; Polwart, A.; Coleshaw, T.; Thomas, P.A. Does Scots pine seed colour affect its germination? Seed Sci. Technol. 2012, 40, 155–162. [Google Scholar] [CrossRef]
- Kaliniewicz, Z.; Tylek, P.; Markowski, P.; Anders, A.; Rawa, T.; Jóźwiak, K.; Fura, S. Correlations between the germination capacity and selected physical properties of Scots pine (Pinus sylvestris L.) seeds. Balt. For. 2013, 19, 201–211. [Google Scholar]
- Novikov, A.; Lisitsyn, V.; Tigabu, M.; Tylek, P.; Chuchupal, S. Detection of Scots Pine Single Seed in Optoelectronic System of Mobile Grader: Mathematical Modeling. Forests 2021, 12, 240. [Google Scholar] [CrossRef]
- Novikov, A.I.; Zolnikov, V.K.; Novikova, T.P. Grading of Scots Pine Seeds by the Seed Coat Color: How to Optimize the Engineering Parameters of the Mobile Optoelectronic Device. Inventions 2021, 6, 7. [Google Scholar] [CrossRef]
- Raevsky, B.V.; Schurova, M.L.; Chepic, F.A. Some results of scoth pine plus trees breeding assessment in progeny trial in Karelia. Izv. Sankt-Peterburgskoj Lesoteh. Akad. 2018, 224, 6–20. [Google Scholar] [CrossRef]
- Mexal, J.G.; Landis, T.D. Target seedling concepts: Height and diameter. In Proceedings of the Target Seedling Symposium: Proceedings, Combined Meeting of the Western Forest Nursery Associations; Rose, R., Campbell, S.J., Landis, T.D., Eds.; U.S. Department of Agriculture, Forest Service, Rocky Mountain Forest and Range Experiment Station: Fort Collins, CO, USA, 1990; pp. 17–35. [Google Scholar]
- Ivetić, V. Handbook on Seed Production, Seedling Production and Afforestation; University of Belgrade—Faculty of Forestry: Belgrade, Serbia, 2013. (In Serbian) [Google Scholar]
- Trouillier, M.; van der Maaten-Theunissen, M.; Scharnweber, T.; Wilmking, M. A Unifying Concept for Growth Trends of Trees and Forests—The “Potential Natural Forest”. Front. For. Glob. Chang. 2020, 3, 581334. [Google Scholar] [CrossRef]
- Grossnickle, S.C.; MacDonald, J.E. Fall Planting Option: A Biological Perspective to Support a Successful Outcome; Electronic Resource. New York, NY, USA, 2017. Available online: https://vimeo.com/445651112 (accessed on 12 January 2023).
- Raevsky, B.V. Breeding and seed production of Pinus sylvestris L. and Pinus contorta Dougl. ex Loud. var. latifolia Engelm in the North-West of the Russian Taiga. Ph.D. Thesis, Forest Institute of the Karelian Scientific Center of the Russian Academy of Sciences, Petrozavodsk, Russia, 17 June 2015. [Google Scholar]
- Douglas, J.L.; Grabowski, J.M.; Keith, B.C. A comparison of seed cleaning techniques for improving quality of eastern gamagrass seed. Seed Sci. Technol. 2000, 28, 163–167. [Google Scholar]
- Novikov, A.I. Improvement of Technology for Obtaining High-Quality Forest Seed Material. Advanced. Doctoral Thesis, Voronezh State University of Forestry and Technologies named after G.F. Morozov, Voronezh, Russia, 2 July 2021. [Google Scholar]
- Mañas, P.; Castro, E.; De Las Heras, J. Quality of maritime pine (Pinus pinaster Ait.) seedlings using waste materials as nursery growing media. New For. 2009, 37, 295–311. [Google Scholar] [CrossRef]
- Liu, Y.; El-Kassaby, Y.A. Timing of seed germination correlated with temperature-based environmental conditions during seed development in conifers. Seed Sci. Res. 2014, 25, 29–45. [Google Scholar] [CrossRef]
- Bradbeer, J.W. Seed Dormancy and Germination; Springer: Boston, MA, USA, 1988; ISBN 978-0-216-91636-4. [Google Scholar]
- Downie, B.; Bergsten, U.; Wang, B.S.P.; Bewley, J.D. Conifer seed germination is faster after membrane tube invigoration than after prechilling or osmotic priming. Seed Sci. Res. 1993, 3, 259–270. [Google Scholar] [CrossRef]
- Luoranen, J.; Rikala, R. Field performance of Scots pine (Pinus sylvestris L.) seedlings planted in disc trenched or mounded sites over an extended planting season. New For. 2013, 44, 147–162. [Google Scholar] [CrossRef]
- Luoranen, J. Autumn versus spring planting: The initiation of root growth and subsequent field performance of Scots pine and Norway spruce seedlings. Silva Fenn. 2018, 52, 7813. [Google Scholar] [CrossRef]
- Redko, G.I.; Ogievsky, D.V.; Nakvasina, E.N.; Romanov, E.M. Bioecological Basics of Growing Pine and Spruce Seedlings in Nurseries; Forest Industry: Moscow, Russia, 1983; p. 64. [Google Scholar]
- Matveev, S.; Tishin, D.; Maximchuk, P.; Zhuravleva, I. Seasonal radial growth dynamics of Scots pine (Pinus silvestris L.) in Voronezh region (Russia). IOP Conf. Ser. Earth Environ. Sci. 2020, 595, 012044. [Google Scholar] [CrossRef]
- Petäistö, R.-L. Growth phase of bare-root Scots pine seedlings and their susceptibility to Gremmeniella abietina. Silva Fenn. 1999, 33, 655. [Google Scholar] [CrossRef]
- Ivetić, V.; Devetaković, J.; Maksimović, Z. Initial height and diameter are equally related to survival and growth of hardwood seedlings in first year after field planting. Reforesta 2016, 2, 6–21. [Google Scholar] [CrossRef]
- Mason, E.G. A model of the juvenile growth and survival of Pinus radiata D. Don; adding the effects of initial seedling diameter and plant handling. New For. 2001, 22, 133–158. [Google Scholar] [CrossRef]
- Ivetić, V.; Grossnickle, S.; Škorić, M. Forecasting the field performance of Austrian pine seedlings using morphological attributes. IForest-Biogeosci. For. 2016, 10, 99–107. [Google Scholar] [CrossRef]
- Karlman, L.; Fries, A.; Martinsson, O.; Westin, J. Juvenile growth of provenances and open pollinated families of four Russian larch species (Larix Mill.) in Swedish field tests. Silvae Genet. 2011, 60, 165–177. [Google Scholar] [CrossRef]
- R: A Language and Environment for Statistical Computing. Available online: https://www.r-project.org/ (accessed on 30 December 2022).
- Pinheiro, J.; Bates, D.; DebRoy, S.; Sarkar, D.; Team, R.C. Linear and Nonlinear Mixed Effects Models, R Package Version 3.1-117; R Core Team: Linhares, Brasil, 2014; Available online: https://svn.r-project.org/R-packages/trunk/nlme/ (accessed on 30 December 2022).
- Johnstone, J.F.; Celis, G.; Chapin, F.S.; Hollingsworth, T.N.; Jean, M.; Mack, M.C. Factors shaping alternate successional trajectories in burned black spruce forests of Alaska. Ecosphere 2020, 11, e03129. [Google Scholar] [CrossRef]
- Wilms, F.; Duppel, N.; Cremer, T.; Berendt, F. Bark Thickness and Heights of the Bark Transition Area of Scots Pine. Forests 2021, 12, 1386. [Google Scholar] [CrossRef]
- Wennström, U.; Bergsten, U.; Nilsson, J.-E. Seedling establishment and growth after direct seeding with Pinus sylvestris: Effects of seed type, seed origin, and seeding year. Silva Fenn. 2007, 41, 299–314. [Google Scholar] [CrossRef]
- Mattsson, A. Predicting field performance using seedling quality assessment. New For. 1996, 13, 223–248. [Google Scholar] [CrossRef]
- Chavasse, C.G.R. The significance of planting height as an indicator of subsequent seedling growth [forest and ornamental trees]. N. Z. J. For. 1977, 22, 283–296. [Google Scholar]
- Ivetić, V.; Devetaković, J. Reforestation challenges in Southeast Europe facing climate change. Reforesta 2016, 1, 178–220. [Google Scholar] [CrossRef]
- Devetaković, J.; Krinulović, L.; Kerkez Janković, I. Effect of sowing pattern and density on the quality of one-year-old Austrian pine bareroot seedlings. Reforesta 2020, 5, 25–30. [Google Scholar] [CrossRef]
- Novikov, A.I.; Rabko, S.V.; Novikova, T.P.; Petrishchev, E.P. Dickson Quality Index: Relation to technological impact on forest seeds. For. Eng. J. 2023, 13, 23–36. [Google Scholar]
- Jiang, L.; Xu, X.; Cai, Q.; Han, R.; Tigabu, M.; Jiang, T.; Zhao, X. Variations in Growth and Photosynthetic Traits of Polyploid Poplar Hybrids and Clones in Northeast China. Genes 2022, 13, 2161. [Google Scholar] [CrossRef] [PubMed]
- Rodríguez de Prado, D.; Riofrío, J.; Aldea, J.; McDermott, J.; Bravo, F.; Herrero de Aza, C. Species Mixing Proportion and Aridity Influence in the Height–Diameter Relationship for Different Species Mixtures in Mediterranean Forests. Forests 2022, 13, 119. [Google Scholar] [CrossRef]
- Vospernik, S.; Heym, M.; Pretzsch, H.; Pach, M.; Steckel, M.; Aldea, J.; Brazaitis, G.; Bravo-Oviedo, A.; Del Rio, M.; Löf, M.; et al. Tree species growth response to climate in mixtures of Quercus robur/Quercus petraea and Pinus sylvestris across Europe—A dynamic, sensitive equilibrium. For. Ecol. Manag. 2023, 530, 120753. [Google Scholar] [CrossRef]
- Dunlap, J.R.; Barnett, J.P. Influence of seed size on germination and early development of loblolly pine (Pinus taeda L.) germinants. Can. J. For. Res. 1983, 13, 40–44. [Google Scholar] [CrossRef]
- Sorensen, F.C.; Campbell, R.K. Seed weight–seedling size correlation in coastal Douglas-fir: Genetic and environmental components. Can. J. For. Res. 1993, 23, 275–285. [Google Scholar] [CrossRef]
- Reich, P.B.; Oleksyn, J.; Tjoelker, M.G. Seed mass effects on germination and growth of diverse European Scots pine populations. Can. J. For. Res. 1994, 24, 306–320. [Google Scholar] [CrossRef]
- Novikov, A.I.; Ivetić, V. The effect of seed size grading on seed use efficiency and height of one-year-old container-grown Scots pine (Pinus sylvestris L.) seedlings. Reforesta 2018, 6, 100–109. [Google Scholar] [CrossRef]
- Ivetić, V.; Devetaković, J.; Nonić, M.; Stanković, D.; Šijačić-Nikolić, M. Genetic diversity and forest reproductive material—From seed source selection to planting. IForest-Biogeosci. For. 2016, 9, 801–812. [Google Scholar] [CrossRef]
- Hodgson, T.J. Pine seed grading: The implication for orchard seed. South African For. J. 1980, 112, 10–14. [Google Scholar] [CrossRef]
- Himanen, K. Seed quality attributes in seedling production of Norway spruce (Picea abies (L.) Karst.). Diss. For. 2018, 261, 74. [Google Scholar] [CrossRef]
- Farhadi, M.; Tigabu, M.; Odén, P. Near Infrared Spectroscopy as non-destructive method for sorting viable, petrified and empty seeds of Larix sibirica. Silva Fenn. 2015, 49, 1340. [Google Scholar] [CrossRef]
- Tigabu, M.; Daneshvar, A.; Jingjing, R.; Wu, P.; Ma, X.; Odén, P.C. Multivariate Discriminant Analysis of Single Seed Near Infrared Spectra for Sorting Dead-Filled and Viable Seeds of Three Pine Species: Does One Model Fit All Species? Forests 2019, 10, 469. [Google Scholar] [CrossRef]
- Egorov, M.N. Phenetics of woody plants as a new promising area of research in forest universities of Russia. Bull. High. Educ. Institutions. For. J. 2001, 4, 7–12. (In Russian) [Google Scholar]
- Baltzer, J.L.; Day, N.J.; Walker, X.J.; Greene, D.; Mack, M.C.; Alexander, H.D.; Arseneault, D.; Barnes, J.; Bergeron, Y.; Boucher, Y.; et al. Increasing fire and the decline of fire adapted black spruce in the boreal forest. Proc. Natl. Acad. Sci. USA 2021, 118, e2024872118. [Google Scholar] [CrossRef]
- Johnstone, J.F.; Chapin, F.S.; Hollingsworth, T.N.; Mack, M.C.; Romanovsky, V.; Turetsky, M. Fire, climate change, and forest resilience in interior AlaskaThis article is one of a selection of papers from The Dynamics of Change in Alaska’s Boreal Forests: Resilience and Vulnerability in Response to Climate Warming. Can. J. For. Res. 2010, 40, 1302–1312. [Google Scholar] [CrossRef]
- Martínez-Baroja, L.; Rey-Benayas, J.M.; Pérez-Camacho, L.; Villar-Salvador, P. Drivers of oak establishment in Mediterranean old fields from 25-year-old woodland islets planted to assist natural regeneration. Eur. J. For. Res. 2021, 141, 17–30. [Google Scholar] [CrossRef]
- Aniszewska, M. Connection between shape of pine (Pinus sylvestris) cones and weight, colour and number of seeds extracted from them. Electron. J. Polish Agric. Univ. Ser. For. 2018, 9, 1–6. [Google Scholar]
- Novikova, T.P. Assessment of the forest seed material quality at the Scots pine (Pinus sylvestris L.) experimental site during adaptive restoration of forest landscapes. For. Eng. J. 2023, 13, 112–128. [Google Scholar]
- Novikov, A.I.; Ivetić, V.; Novikova, T.P.; Petrishchev, E.P. Scots Pine Seedlings Growth Dynamics Data Reveals Properties for the Future Proof of Seed Coat Color Grading Conjecture. Data 2019, 4, 106. [Google Scholar] [CrossRef]


Disclaimer/Publisher’s Note: The statements, opinions and data contained in all publications are solely those of the individual author(s) and contributor(s) and not of MDPI and/or the editor(s). MDPI and/or the editor(s) disclaim responsibility for any injury to people or property resulting from any ideas, methods, instructions or products referred to in the content. |
© 2023 by the authors. Licensee MDPI, Basel, Switzerland. This article is an open access article distributed under the terms and conditions of the Creative Commons Attribution (CC BY) license (https://creativecommons.org/licenses/by/4.0/).