Abstract
The performance characteristics of finger-joints as a jointing technique for Eucalyptus nitens is crucial for their use in engineered wood products. This research evaluated the strength of the finger-jointed laminations made from fiber-managed E. nitens. A total of 237 specimens with (117 pieces) and without (120 pieces) finger-joints were sectioned from finger-jointed laminations and tested by bending, tensile, shear, and bearing tests. Bending and tensile tests were paired to identify any correlations. The mean value with finger-joints for bending and tensile were 92.1 MPa and 79.6 MPa, respectively. The presence of finger-joints reduced the strength values. Joint efficiencies in bending and tensile are 0.73 and 0.62, respectively. The distributions of bending and tensile strength were similar for the samples without finger-joints. For the samples with finger-joints, tensile strength was significantly lower than paired bending strength. Shear test results show that the short-span test is inefficient in obtaining the shear strength of fiber-managed E. nitens boards. Meanwhile, the finger-joint efficiency in the bearing is 0.86. The prediction models of lamination’s bending, tensile, and bearing strength were established by non-destructive properties as predictors. Bending strength was highly correlated to the modulus of elasticity value, while tensile and bearing strength were correlated to density. This study obtained promising results on finger-jointed boards from fiber-managed E. nitens suggesting they could be suitable for structural purposes.
1. Introduction
Eucalyptus nitens plantations are grown globally, particularly in Portugal, Spain, Chile, and Australia, because of their distinctive characteristics (i.e., fast-growing, cool temperate performance, and frequent frost tolerance) [1]. Most E. nitens are grown for woodchips and pulp production, but there is an increasing interest and demand for using them in solid wood products [2]. Glulam, as an engineered wood product, is one option [3]. While the E. nitens resource may be readily available, it usually yields small-diameter logs with many natural features (i.e., knot, the slope of grain, and wane) that severely reduce its strength. As a result, finger-joints are widely used in engineered wood products to reduce these strength-reducing features and extend the laminations to the required structural lengths. However, finger-joints have been identified as weak components [4,5]. Initial failures at a finger-joint in the extreme tension laminate have been found in the glulam beam bending tests [6,7]. Therefore, the performance of finger-joints is as important as the wood properties of sawn boards.
Existing research on wood properties of fiber-managed E. nitens showed an application potential of this species as feedstock for engineered wood products. As early as 1996, Yang and Waugh [8] tested plantation-grown 15- to 29-year-old E. nitens boards and reported the potential to use this plantation species for structural purposes. Derikvand et al. [9] obtained comprehensive data on wood properties, including bending, shear, tensile, and compression strength, by testing 315 fiber-managed E. nitens specimens. Cheng et al. [10,11,12] investigated the characteristics of the mechanical properties, including bending, tensile, and compression strength, of plantation E. nitens with high and low moisture content.
There is beneficial research on finger-jointed laminations made from hardwood species but limited publications on fiber-managed E. nitens. Gutierrez et al.’s most recently published paper reported that 15 mm finger-joints performed significantly better than 10 mm ones [13]. Meanwhile, researchers found the finger-joint technique suitable for manufacturing engineered wood products using other hardwood species as raw materials. Lehmann et al. [14] investigated the finger-joint strength by bending and tensile tests and reported that the finger-joint technique is sufficient to make glulam beams from beech with a characteristic bending strength of up to 55 MPa. Morin-Bernard et al. [15] tested finger-jointed boards made from three hardwood species and confirmed that white ash, yellow birch, and white oak could achieve characteristic tensile strengths up to 36.4 MPa, 33.6 MPa, and 35.8 MPa, respectively. Moreover, some scholars identified the limitation of the structural applications of certain finger-jointed boards from hardwood species. For example, Amoah et al. [16] conducted bending tests on finger-jointed boards made from four tropical timber species and reported that the maximum joint efficiencies in the dry and green states were 50.7% and 40.1%, respectively. They claimed that further research is needed to use these tropical timber species for structural purposes.
It is necessary to study the strength of finger joints to promote the utilization of fiber-managed E. nitens in engineered wood products. The finger-joint strength has been identified as the predictor for estimating the laminated beam’s strength [6]. According to the Australian Standard 1328.1: 1998 [17], glulam members’ characteristic bending and tensile strength are calculated by a finger joint’s characteristic bending and tensile strength, respectively, while according to European standards, the strength of glulam members depends on both the bending and tensile strength of finger joints [18].
A comprehensive understanding of the finger joints’ performance would promote a further understanding of the lamination properties of E. nitens. The results would play a key role in predicting the strength of final products. Therefore, this study aimed to investigate the strength of the finger joints to:
- Obtain the bending, tensile, shear, and bearing strength of sawn boards made from fiber-managed E. nitens with and without finger joints;
- Determine the finger joint’s efficiency of strengths;
- Explore the correlation between bending and tensile strength;
- Predict the strengths by non-destructive properties.
2. Materials and Methods
2.1. Material
The boards in this study were sourced from a fiber-managed E. nitens plantation in southern Tasmania. When harvested, the trees were 21 years old. The back-sawn method was used to maximize board recovery. After being racked, the boards were air-dried to the fiber saturation point (FSP) in an industry drying yard. Because E. nitens is a collapse-prone species, the boards were reconditioned with steam and finally kiln dried to a nominal 12% moisture content.
Prior to docking out the strength-reducing features, parameters, including the moisture content, nominal density, and edgewise modulus of elasticity (MoE) values of each board, were measured. The cumulative distributions of these parameters are shown in Figure 1. The moisture content was measured by a handheld Moisture Encounter Meter. The nominal density equals the weight divided by volume. Three dimensions were measured to assess individual boards’ volume. A scale with an accuracy of 0.01 kg was used to weigh the boards. Based on the moisture content values, the nominal densities were adjusted to the standard moisture content of 12%. A four-point bending test obtained the MoE values according to Australian standard AS/NZS 4063.1: 2010. The span–depth ratio was 18:1. In this study, the MoE value obtained by a four-point bending test () and adjusted density () were considered predictors.
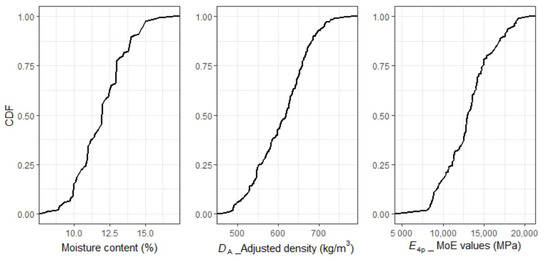
Figure 1.
Cumulative distributions of mechanical parameters.
Then, the boards were docked. The docking work included:
- Remove knots that were larger than 3/8 boards’ width;
- Remove want, pocket, and wane;
- Ensure that knots are away from the nearest end by more than 50 mm;
- Ensure that the lengths of the shook were less than 1.5 m and more than 0.3 m.
In this study, 120 m long shooks were sent to the manufacturer for finger jointing.
2.2. Finger-Joint Processing
The shooks were processed by the finger-jointing system automatically. The finger-joint length was 15 mm. The one-component polyurethane (1C–PUR) was used for finger-jointing. The other gluing parameters, including end pressure, pressing time, glue spread rate, and curing time, are listed in Table 1. A total of 30 laminations with a length of 3.6 m were manufactured.

Table 1.
The manufacturing parameters of finger joints.
2.3. Preparation of the Samples
The specimens were sectioned from the laminations. Two groups of specimens were prepared: Group A containing samples made from processed boards without finger joints, and Group B containing samples made from processed boards with finger joints in the middle. Each group consisted of four types of samples, including paired bending, paired tensile, shear, and bearing samples. The dimensions and the number of specimens are listed in Table 2.
Table 2.
Number of specimens.
Clear segments were chosen to prepare the paired bending-tensile test samples. A table saw split these segments into two parts. One part was used in the bending test. The other part was shaped by a bandsaw into waisted tensile specimens. The dimensions of the tensile specimens are shown in Figure 2.
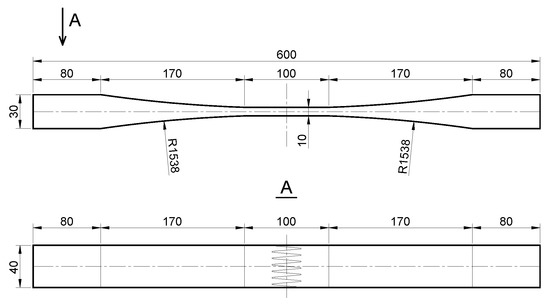
Figure 2.
Dimensions of the tensile specimens (Unit: mm).
2.4. Mechanical Tests
Paired bending and tensile tests, shear test, and bearing parallel-to-grain tests were conducted as per the relative standard listed in Table 3. The setups are shown in Figure 3.
Table 3.
Details of the tests.
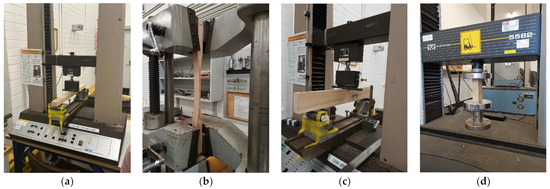
Figure 3.
Setup of the tests. (a) Bending test; (b) tensile test; (c) shear test; (d) bearing test.
2.5. Data Analysis
Statistical software RStudio was used to conduct the statistical analyses. The level of significance was 5% (p < 0.05).
2.5.1. Statistical Comparison
(A) Mean value among groups
Analysis of variance (ANOVA) was used to detect the significance of the parameter difference between or among groups. Tukey’s test was performed as a post hoc test to compare the differences between or among groups.
(B) Signed-rank test of paired specimens’ results
The following statistical analyses were performed to compare the bending and tensile strength of paired specimens:
- The quantile–quantile (Q–Q) plots were produced to verify the normality distribution of the difference between paired bending and tensile strength;
- Paired Wilcoxon tests (Wilcoxon signed-rank test) were performed across the sample groups. This test is used for non-normally distributed data.
(C) Relationship between paired specimens’ strength
The following statistical analyses were performed to explore the relationship between the bending and tensile strength of paired specimens:
- Pearson’s tests were conducted to calculate the correlation coefficients;
- Linear regressions were conducted to establish the relationships between bending and tensile strength of finger-jointed specimens.
(D) Normality Test of Residuals
- Shapiro–Wilk tests were conducted to verify the normality of the distribution of the residuals. This test is a more appropriate method for a small sample size (n < 50) [22].
2.5.2. Prediction of Strength
The following statistical analysis steps involve using non-destructive properties (, , , sample groups mentioned in Section 2.3 ()) as predictors to predict the strength values.
- Build the model NEST by general linear regression. Predictors combine factors (categorical) and covariates (continuous);
- Calculate Akaike’s information criterion (AIC) values of all the models to select the best model;
- Refit the best model to predict the strength values.
The factors and covariates considered in different model NESTs are as follows:
- Bending strength: the general linear model was established considering one factor and three covariates, including , , , and ;
- Tensile strength: the model was established considering the same factor and covariates with the bending strength model;
- Bearing strength: and were considered.
The number of models in NEST is , in which “m” is the quantity of factors and covariates. Predicted models were selected by Akaike’s information criterion (AIC). The value is calculated by log-likelihood (LL) and the number of estimated parameters (K), . Each model has a Δ value which is the difference from the lowest value. For the candidate models with the Δ less than six were listed. A factor in all the candidate models is strong support for that factor to be a predictor. In this study, the models with the smallest value were selected to predict the strength.
3. Results
The measured and calculated properties of 237 specimens, i.e., , , , , , , and , as defined above, are presented below.
3.1. Paired Bending and Tensile Test
The paired bending and tensile test results are summarised in Table 4.
Table 4.
Paired bending and tensile test results.
3.1.1. Comparison of Strength between Groups
In this section, bending and tensile strength across groups and two strengths within groups were compared by statistical analysis. The paired strength is shown in Figure 4.
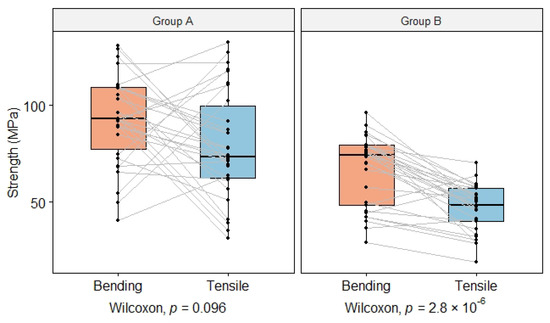
Figure 4.
Box plot of the strengths ( and ) in paired bending and tensile tests. The grey lines connected the paired specimens’ results.
(A) Bending strength
One-way ANOVA was performed to compare the bending strength. There was strong evidence that the strengths differed between the groups (ANOVA, F1.57 = 22.3, p < 0.05). The mean value of Group A was 92.1 MPa which was 25.6 MPa higher than Group B, 95% CI (14.8, 36.5) MPa. This difference was significant, meaning that the presence of finger joints did reduce the bending strength significantly.
(B) Tensile strength
In terms of tensile strength, the same statistical analysis was conducted. There was also strong evidence that the strengths differed between the groups (ANOVA, F1.57 = 33.5, p < 0.05). The mean value of Group A was 79.6 MPa which was 32.7 MPa higher than Group B, 95% CI (21.4, 4.1) MPa. This difference was significant, also meaning that the existence of finger joints did reduce the tensile strength significantly.
(C) Paired strength across groups
The paired bending and tensile strength were compared. The quantile–quantile (Q–Q) plots for the differences between bending and tensile strength are shown in Figure 5.
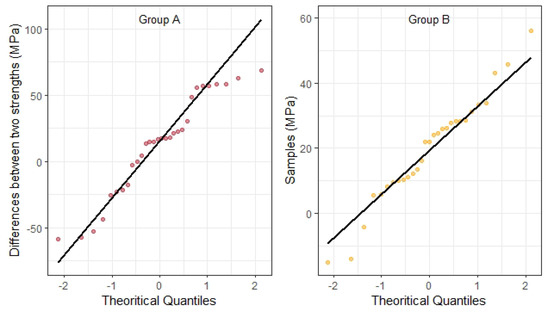
Figure 5.
The quantile–quantile (Q–Q) plots for the differences between bending and tensile strength.
In both two groups, the observations formed a curve that deviated from the straight line, which means this data did not follow a normal distribution. Summary statistics, median and interquartile range (IQR), by groups, are listed in Table 5. The Wilcoxon test showed that the median bending strength of Group A was not significantly different from tensile strength (Wilcoxon test, V = 314, p = 0.10 > 0.05, n = 30, effect size r = 0.31 (moderate)). However, in Group B, the tensile strength was significantly lower than the bending strength (Wilcoxon test, V = 411, p < 0.05, n = 29, effect size r = 0.78 (large)).
Table 5.
Summary statistics across groups in paired bending and tensile test.
The above results show that the bending and tensile strengths of the samples without finger joints are similar. However, the tensile strength of samples with finger joints is commonly lower than the bending strength (Figure 6).
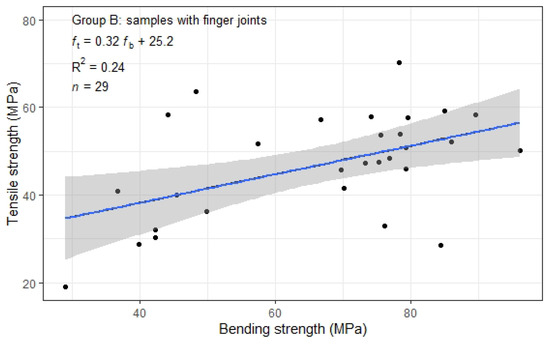
Figure 6.
Relation between and (filled circles). The straight blue line is estimated by , and the grey region depicts the 95% confidence interval for the mean.
Pearson’s tests showed the correlation coefficient of the linear relationship between and in Group B (Pearson’s test: df = 27, cor = 0.50, p = 0.01 < 0.05). Linear regression was performed to establish the relationship (linear regression; R2 = 0.24, df = 27, p = 0.01 < 0.05).
3.1.2. Prediction of the Strength
The bending and tensile strength of processed boards without (Group A) and with (Group B) finger joints were predicted by non-destructive properties.
(A) Bending strength
, , , and sample group () were considered to predict the bending strength. The model NEST was built, in which was a factor, and , and were covariates. There were 16 models in this nest. The candidate models with an ΔAIC less than 6 were ranked by the AIC value in Table 6. The covariates and factor occurred in all the candidate models. Meanwhile, the model with and had the smallest AIC value; therefore, this model was selected.
Table 6.
Candidate models in predicting bending strength ranked by AIC values.
The linear regression analysis was performed to predict the bending strength considering a group (Section 2.3) as a random effect (Figure 7). As mentioned above, there was strong evidence that the existence of finger joints reduced the bending strength. The model performed well in predicting the bending strength of specimens with and without finger joints (linear regression; R2 = 0.80, df = 55, p < 0.05). The linear regression parameters are listed in Table 7.
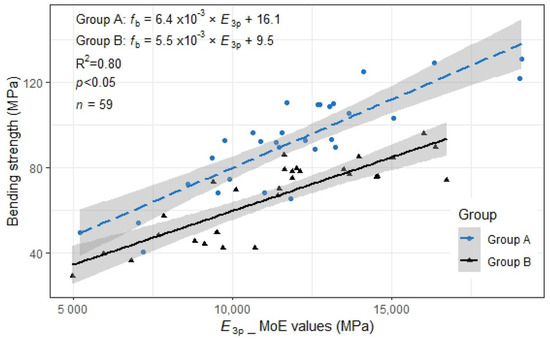
Figure 7.
Relation between and (filled shapes). Straight lines are estimated by across groups, the grey regions depict the 95% confidence interval for the means.
Table 7.
Parameters of selected model for .
The identified regression function showed as the following Equation (1):
The Shapiro–Wilk test was conducted to test the normality of the residuals, and the null hypothesis was rejected. The test indicated that the residuals of this model follow a normal distribution (W (59) = 0.98, p = 0.31 > 0.05).
(B) Tensile strength
The same factor () and covariates (, and ) were considered to predict the tensile strength. The model NEST consisting of 16 models was built. The candidate models with an ΔAIC less than 6 were ranked by the AIC value in Table 8. The model with and had the smallest AIC value; therefore, this model was selected.
Table 8.
Candidate models in predicting tensile strength ranked by AIC values.
The linear regression analysis was performed to predict the tensile strength (Figure 8). No interaction was considered. The linear regression parameters are listed in Table 9.
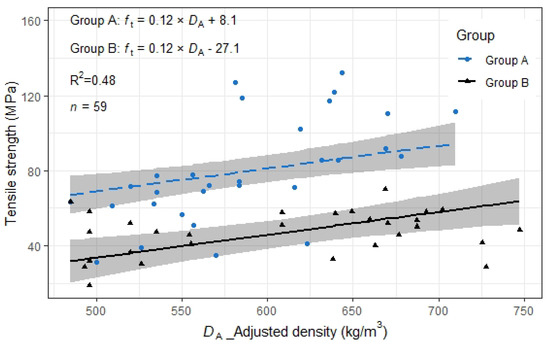
Figure 8.
Relation between and (filled shapes). Straight lines are estimated by across groups, the grey regions depict the 95% confidence interval for the means.
Table 9.
Parameters of selected model for .
The identified regression function showed as the following Equation (2):
The Shapiro–Wilk test was conducted to test the normality of the residuals, and the null hypothesis was rejected. The test indicated that the residuals of this model follow a normal distribution (W (59) = 0.97, p = 0.09 > 0.05).
3.1.3. Failure Mode of the Samples with Finger Joints
The failure modes of paired bending and tensile test specimens in Group B are classified into six groups per Australian standard 5068-2006 [19]. The typical failures are shown in Figure 9.
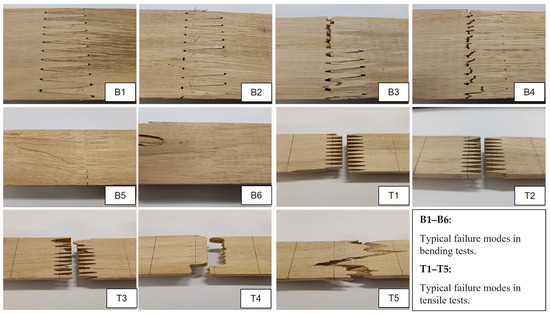
Figure 9.
Typical failure modes in bending and tensile tests.
In bending tests, the failure modes distributed across bending strength and density are shown in Figure 10. The failure modes B1 and B4 have the most occurrences with seven samples, and B2 and B6 have the fewest with three samples. The bending strength’s mean value of group B1 is 81.2 MPa, which is the highest, followed by groups B2 and B6. The specimens in these three groups have higher densities than the other three groups.
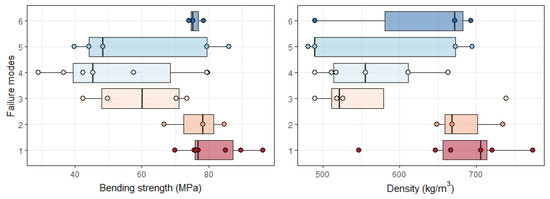
Figure 10.
Box plot of bending strength and density across failure modes as per AS 5068-2006 [19].
In tensile tests, the failure modes were distributed unevenly compared with the bending tests (Figure 11). The failure mode T4 has the most occurrences with 13 specimens. No samples failed in Mode 6 as per AS 5068-2006 [19]. The specimens with failure modes T1 and T2 tend to have a higher density than the other three groups. However, no obvious difference in strength was observed.
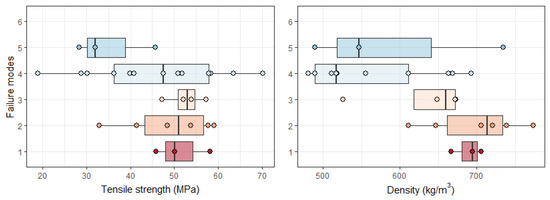
Figure 11.
Box plot of tensile strength and density across failure modes as per AS 5068-2006 [19].
The Australian standard classifies finger-joint failure into six modes [19]. For hardwood, failure modes 1 and 2, along the bond line surfaces of the joint profile, are most likely to occur in bending tests [23] and tensile tests [15]. In this study, a lower percentage (around 30%) of the specimens failed in Mode 1 or 2. Meanwhile, these specimens had higher mean density than others. In the bending test, the specimens that failed in Mode 1 or 2 also had higher bending strength (Figure 10). This means the bond line strength is weaker than the higher-density timber strength. In contrast, specimens with lower density failed in Mode 3 or 4, meaning that bond line strength is higher than timber strength.
It can be concluded that glue line failure does not indicate low strength and that it is possible to further improve the performance of the finger joints to its full potential.
3.2. Shear Test
This study selects the short-span shear test as it aligns with the objective of introducing E. nitens into glulam products. Shear failure represents one of the primary modes of failure in glulam beams, thus necessitating an examination of the beam shear strength of laminations. This test is only appropriate for evaluating shear strength if the specimen exhibits clear indications of shear failure. The results of the shear test must be analyzed with the failure modes because the failure commonly results from bending moment or beam stability factor [24].
In this test, failure in bending and shear was observed. The data for the two failure modes are shown in Table 10. In Group A, the mean value of shear strength failure was 0.8 MPa higher than the bending mean. For the specimens that failed in bending, the shear stress was calculated. Meanwhile, all the specimens in Group B failed in bending. That means of this group was shear stress.
Table 10.
Data summary of two failure modes in shear tests.
The results of specimens that failed in shear in Group A are given in Table 11, and the results of Group B failed in bending. Although the calculated shear stress of Group B was significantly lower than the calculated shear strength of Group A, there was no confidence to report that the existence of finger joints reduced the shear strength. These results indicate that the shear beam performance of finger-jointed boards does not need to be considered.
Table 11.
Shear test results.
3.3. Bearing Test (Parallel to the Grain)
The bearing test results are given in Table 12.
Table 12.
Bearing test results.
3.3.1. Comparison of Strength between Groups
One-way ANOVA was performed to compare the bearing strength between groups (Figure 12). Strong evidence showed that the strength differed across the groups (ANOVA, F1.58 = 15.2, p < 0.05). The mean value of Group A was 63.5 MPa which was 8.6 MPa higher than Group B, 95% CI (4.2, 13.0) MPa. This difference is significant, meaning that the existence of a finger joint did reduce the bearing strength.
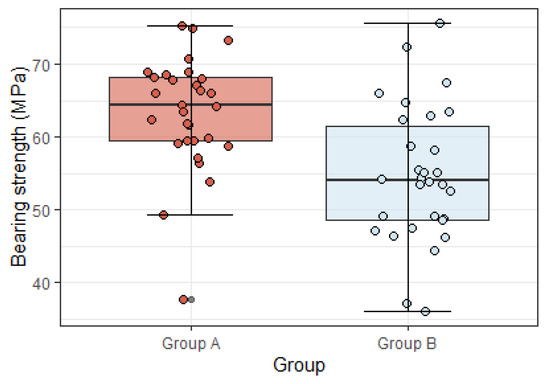
Figure 12.
Box plot of bearing strength across the groups.
3.3.2. Prediction of Bearing Strength
Factor Group () and covariates Density () were considered to predict bearing strength. The model NEST consisting of four models was built. The model with and had the smallest AIC value; hence, this model was selected (AIC, df = 4, LL = −179.0, AIC value = 366.7, ΔAIC = 0.0). The linear regression analysis was performed to predict the strength (Figure 13). No interaction was considered. The linear regression parameters are listed in Table 13.
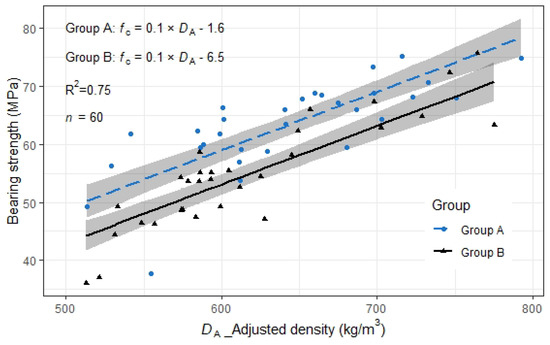
Figure 13.
Relation between and (filled shapes). Straight lines are estimated by across groups, the grey regions depict the 95% confidence interval for the mean.
Table 13.
Parameters of selected relationship model.
The regression function showed as the following Equation (3):
The Shapiro–Wilk test was conducted to test the normality of the residuals, and the null hypothesis was rejected. The test indicated that the residuals of this model follow a normal distribution (W (60) = 0.97, p = 0.12 > 0.05).
3.3.3. Failure Mode
Three bearing failure modes were observed, including rolling shear, end failure, and shear (Figure 14). The parameters categorized by failure modes across groups are listed in Table 14.
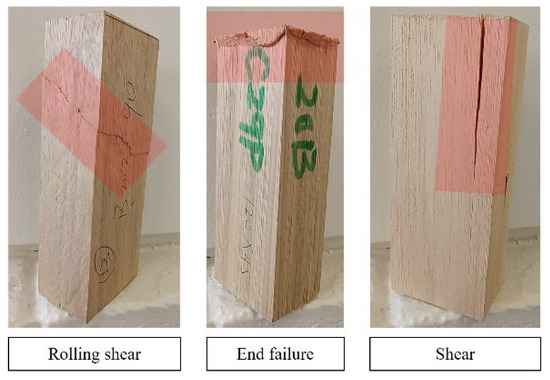
Figure 14.
Typical failure modes in bearing tests. The red shadowed areas are the failed parts.
Table 14.
Parameters of bearing samples across failure modes.
In Group A, the specimens that failed in rolling shear were with the highest mean density value, and those in shear were with the lowest. However, the difference was not statistically significant (ANOVA, F2.27 = 1.8, p = 0.19 > 0.05). There was also no significant difference in strength across failure modes (ANOVA, F2.27 = 0.45, p = 0.64 > 0.05). In Group B, 29 specimens out of 30 failed in rolling shear. Additionally, 28 specimens out of 29 of the rolling shear failure occurred at the finger roots.
4. Discussion
4.1. Comparison with References
Finger joints did reduce the bending, tensile, and bearing strength significantly. For the mean value, the joint efficiency in bending is 0.73, in tensile is 0.62, and in bearing is 0.86. However, compared with the existing research on other hardwood species, the performance of finger-jointed E. nitens boards is promising in strength values (Table 15). As per Australian standards, the finger-jointed E. nitens boards can be classified as F11 or MGP12.
Table 15.
Comparison of finger-jointed boards’ strength with the references.
Finger joints changed the relation between bending and tensile strength. There is no clear trend of the difference between paired bending and tensile for the samples without finger joints. However, for the finger-jointed samples, paired tensile strength is significantly lower than paired bending strength. This is because finger joints affect tensile strength more than bending strength. This is also supported by the lower joint efficiency of tensile strength rather than bending.
There is no strong evidence that finger joints reduced the shear strength. The short-span test is not efficient for solid boards from fiber-managed E. nitens. Over half of the non-jointed samples and all the jointed samples failed in bending. The results can only be used to indicate that beam shear may not be considered a failure criterion.
Finger joints are the weakest component in engineered wood products. This study obtained promising results on finger-jointed boards from fiber-managed E. nitens suggesting they could be suitable for structural purposes. Further study on optimizing the machining and gluing parameters to explore the possibility may increase the joint efficiency to guarantee high-quality products.
4.2. Comparison of Finger-Joint Efficiency with the Reduction Factor of Strength
Finger joints, akin to natural features including knots, grain slopes, and wane, are likewise acknowledged as areas of vulnerability or weak points within engineered wood products [4,5]. Since the stems of fiber-managed plantation E. nitens are unthinned and unpruned, the wood from plantation E. nitens includes regular knots and other natural features. This section focuses on comparing finger-joint efficiency with the reduction factor of strength that arises from knots.
Finger-joint efficiency is used to evaluate the efficacy of load transmission within finger-jointed timber members. In the present study, it was observed that the finger-joint efficiencies were below 1.0, indicating a reduction in strength due to the presence of finger joints. Particularly in tensile tests, the finger-joint efficiency is only 0.62.
The strength characteristics are diminished because of the existence of knots. In a previous study, the authors found that the visual feature groups play a role in predicting the average static flatwise MoE. The predicted MoE value of boards with knots larger than 3/8 boards’ width is significantly lower than those with small knots [28]. Consequently, 3/8 boards’ width serves as the criterion for determining whether a knot necessitates removal. That means the reduction factor () in tensile strength that arises from knots is less than 0.375.
The authors employed the efficiency of knots () to compare with the finger-joint efficiency, which is 0.625. It is not necessary to remove the knots with higher efficiency than finger joints. While knots do offer slightly higher efficiency compared to finger joints, it can be concluded that removing knots larger than 3/8 of the boards’ width yields an equivalent efficiency to finger joints. Further investigation into optimizing the manufacturing parameters has the potential to enhance finger-joint efficiency. Consequently, a commensurate reduction in the size of preserved knots should be pursued.
5. Conclusions
In this study, the effect of finger joints on the strengths of laminations was studied. The specimens with and without finger joints from finger-jointed laminations were tested by mechanical tests. Based on the test results, the bending, tensile, and bearing strength of processed boards with and without finger joints are predicted by non-destructive properties. Bending strength is highly correlated to MoE values, and tensile and bearing strength is correlated to density. The prediction models could be used in both academic research and industry manufacturing. For academic research, the predicted strength could be used to predict the strength of final products, for example, glulam beams. Meanwhile, the linear models provide input parameters for numerical analysis in finite element modeling. For industry manufacturers, these models could be used to convert measured parameters, i.e., stiffness or density, to stress grade when processing fiber-managed E. nitens.
The following conclusion can be summarised:
- The finger-joint efficiency in bending, tensile, and bearing is 0.73, 0.62, and 0.86, respectively;
- The finger-jointed E. nitens boards are classified as F11 or MGP12 per Australian standards;
- The short-span test is inefficient in obtaining the shear strength of fiber-managed E. nitens boards, especially for the finger-jointed ones. However, the shear test results indicate that the shear beam performance of finger-jointed boards does not need to be considered;
- Paired bending and tensile tests show that the tensile strength of samples without finger joints is similar to bending strength on average, but those with finger joints are significantly lower than bending strength;
- Bending strength could be predicted by MoE value. The R2 value is 0.78;
- Tensile and bearing strength are highly correlated to density. The R2 values are 0.47 and 0.75, respectively;
- Glue line failure occurred on one-third of the bending and tensile specimens as per AS 5068-2006. However, their strengths are not low.
Author Contributions
Conceptualisation, J.H. and A.T.; methodology, J.H. and N.K.; software, J.H.; validation, A.T. and N.K.; formal analysis, J.H.; investigation, J.H.; resources, G.N.; data curation, J.H.; writing—original draft preparation, J.H.; writing—review and editing, A.T. and N.K.; visualization, J.H.; supervision, A.T., N.K. and G.N.; project administration, G.N. All authors have read and agreed to the published version of the manuscript.
Funding
This work was supported by the National Institute for Forest Product Innovation (Grant number: NT016/NIF080).
Data Availability Statement
Data supporting this study are not publicly available due to commercial reasons. Please contact the authors for details.
Acknowledgments
The National Institute for Forest Product Innovation (NIFFPI) is acknowledged for funding this research (Grant number: NT016/NIF080). The ARC Training Centre for Forest Value is acknowledged for preparing the sawn boards. Cusp Building Solutions is acknowledged for investing resources in manufacturing the samples. Stuart Meldrum and Malcolm Liehr are acknowledged for assistance in preparing the samples. Kuluni Piumika Millaniyage, Haochen Xue, and Calverly Gerard are acknowledged for assistance with testing.
Conflicts of Interest
The authors declare no conflict of interest.
Abbreviations
| 1C–PUR | One-component polyurethane |
| AIC | Akaike’s information criterion method |
| AIC value | Calculated by log-likelihood and the number of estimated parameters. |
| ANOVA | Analysis of variance |
| B1–B6 | Failure mode 1–6 as per AS5068-2006 in bending test |
| CI | Confidence interval |
| cor | Correlation coefficient |
| CV | Coefficient of variation |
| Density-adjusted moisture content to 12% | |
| df | Degrees of freedom |
| E. nitens | Eucalyptus nitens |
| FSP | Fibre saturation point |
| Sample’s groups | |
| IQR | Interquartile range |
| K | Number of estimated parameters |
| LL | Log-likelihood |
| MAE | Mean absolute error |
| MC | Moisture content |
| MoE | Modulus of elasticity |
| MSE | Mean square error |
| p | p value in statistical analysis |
| Q–Q plot | Quantile–quantile plot |
| RMSE | Root mean square error |
| SD | Standard deviation |
| T1–T5 | Failure mode 1–5 as per AS5068-2006 in the tensile test |
References
- Larcombe, M.J.; Potts, B.M.; Jones, R.C.; Steane, D.A.; Silva, J.C.E.; Vaillancourt, R.E. Managing Australia’s eucalypt gene pools: Assessing the risk of exotic gene flow. Proc. R. Soc. Vic. 2016, 128, 25. [Google Scholar] [CrossRef]
- Derikvand, M.; Nolan, G.; Jiao, H.; Kotlarewski, N.J. What to Do with Structurally Low-Grad Wood from Australia’s Plantation Eucalyptus; Building Application? BioResources 2016, 12, 4–7. [Google Scholar] [CrossRef]
- Martins, C.; Dias, A.M.P.G.; Cruz, H. Blue gum: Assessment of its potential for glued laminated timber beams. Eur. J. Wood Wood Prod. 2020, 78, 905–913. [Google Scholar] [CrossRef]
- Ong, C.B.; Ansell, M.P.; Chang, W.-S.; Walker, P. Bending properties of finger-jointed Malaysian dark red meranti. Int. Wood Prod. J. 2019, 10, 49–54. [Google Scholar] [CrossRef]
- Tran, V.-D.; Oudjene, M.; Méausoone, P.-J. FE analysis and geometrical optimization of timber beech finger-joint under bending test. Int. J. Adhes. Adhes. 2014, 52, 40–47. [Google Scholar] [CrossRef]
- Burdzik, W.M.G. Finger joint strength. A laminated beam strength predictor? S. Afr. For. J. 1997, 178, 39–45. [Google Scholar] [CrossRef]
- Ehrhart, T.; Steiger, R.; Lehmann, M.; Frangi, A. European beech (Fagus sylvatica L.) glued laminated timber: Lamination strength grading, production and mechanical properties. Eur. J. Wood Wood Prod. 2020, 78, 971–984. [Google Scholar] [CrossRef]
- Yang, J.L.; Waugh, G. Potential of plantation-grown eucalypts for structural sawn products. II. Eucalyptus nitens (Dean & Maiden) Maiden and E. regnans F. MuelL. Aust. For. 1996, 59, 99–107. [Google Scholar]
- Derikvand, M.; Kotlarewski, N.; Lee, M.; Jiao, H.; Nolan, G. Characterisation of Physical and Mechanical Properties of Unthinned and Unpruned Plantation-Grown Eucalyptus nitens H.Deane & Maiden Lumber. Forests 2019, 10, 194. [Google Scholar] [CrossRef]
- Chen, X.; Cheng, Y.; Chan, A.; Holloway, D.; Nolan, G. Anisotropic Tensile Characterisation of Eucalyptus nitens Timber above Its Fibre Saturation Point, and Its Application. Polymers 2022, 14, 2390. [Google Scholar] [CrossRef] [PubMed]
- Cheng, Y.; Chan, A.H.; Holloway, D.; Nolan, G. Anisotropic material behaviour under compression of Eucalyptus nitens with high moisture content. Constr. Build. Mater. 2021, 314, 124788. [Google Scholar] [CrossRef]
- Cheng, Y.; Nolan, G.; Holloway, D.; Kaur, J.; Lee, M.; Chan, A. Flexural characteristics of Eucalyptus nitens timber with high moisture content. Bioresources 2021, 16, 2921–2936. [Google Scholar] [CrossRef]
- Gutierrez, M.; Ettelaei, A.; Kotlarewski, N.; Lee, M. Structural Properties of Commercial Australian Plantation Hardwood CLT. Buildings 2023, 13, 208. [Google Scholar] [CrossRef]
- Lehmann, M.; Clerc, G.; Lehringer, C.; Strahm, T.; Volkmer, T. Investigation of the Bond Quality and the Finger Joint Strength of Beech Glulam. In Proceedings of the World Conference on Timber Engineering (WCTE), Seoul, Republic of Korea, 20–23 August 2018. [Google Scholar]
- Morin-Bernard, A.; Blanchet, P.; Dagenais, C.; Achim, A. Glued-laminated timber from northern hardwoods: Effect of finger-joint profile on lamellae tensile strength. Constr. Build. Mater. 2020, 271, 121591. [Google Scholar] [CrossRef]
- Amoah, M.; Kwarteng, F.O.; Dadzie, P.K. Bending properties and joint efficiency of some tropical hardwoods finger-jointed in green and dry states. J. Indian Acad. Wood Sci. 2014, 11, 57–64. [Google Scholar] [CrossRef]
- AS/NZS1328.1:1998; Glued Laminated Structural Timber Part 1: Performance Requirements and Minimum Production Requirements. SAI Global Limited Under Licence from Standards Australia Limited: Sydney, Australia, 1998.
- EN 14080:2013; Timber Structures—Glued Laminated Timber and Glued Solid Timber—Requirements. CEN: Brussels, Belgium, 2013.
- AS5068-2006; Timber-Finger Joints in Structural Products—Production Requirements. SAI Global Limited Under Licence from Standards Australia Limited: Sydney, Australia, 2006.
- ASTM(D3500-14); Standard Test Methods for Structural Panels in Tension. World Trade Organization Technical Barriers to Trade (TBT) Committee: Geneva, Switzerland, 2014.
- AS/NZS4063.1:2010; Characterization of Structural Timber Test Methods. SAI Global Limited Under Licence from Standards Australia Limited: Sydney, Australia, 2010.
- Mishra, P.; Pandey, C.M.; Singh, U.; Gupta, A.; Sahu, C.; Keshri, A. Descriptive statistics and normality tests for statistical data. Ann. Card. Anaesth. 2019, 22, 67–72. [Google Scholar] [PubMed]
- Lara-Bocanegra, A.J.; Majano-Majano, A.; Crespo, J.; Guaita, M. Finger-Joint Performance in Engineered Laminated Products Made of Eucalyptus Globulus; Vienna University of Technology: Vienna, Austria, 2016. [Google Scholar]
- Bahtiar, E.T.; Erizal, E.; Hermawan, D.; Nugroho, N.; Hidayatullah, R. Experimental Study of Beam Stability Factor of Sawn Lumber Subjected to Concentrated Bending Loads at Several Points. Forests 2022, 13, 1480. [Google Scholar] [CrossRef]
- Aicher, S.; Stapf, G. Glulam from European White Oak: Finger Joint Influence on Bending Size Effect. In Materials and Joints in Timber Structures; Aicher, S., Reinhardt, H.W., Garrecht, H., Eds.; Springer: Dordrecht, The Netherlands, 2014; pp. 641–656. [Google Scholar]
- Muthumala, C.K.; De Silva, S.; Arunakumara, K.K.I.U.; Alwis, P.L.A.G. Failure Modes and Compression Strength of Seven Finger-Jointed Wood Species from Sri Lanka. J. Fail. Anal. Prev. 2021, 21, 2215–2223. [Google Scholar] [CrossRef]
- AS1720.1-2010; Timber Structures—Part 1: Design Method. SAI Global Limited Under Licence from Standards Australia Limited: Sydney, Australia, 2010.
- Hou, J.; Taoum, A.; Nolan, G.; Kotlarewski, N. Study of the relationship between flatwise and edgewise modulus of elasticity of plantation fibre-managed E. nitens sawn boards. Constr. Build. Mater. 2022, 349, 128774. [Google Scholar] [CrossRef]


Disclaimer/Publisher’s Note: The statements, opinions and data contained in all publications are solely those of the individual author(s) and contributor(s) and not of MDPI and/or the editor(s). MDPI and/or the editor(s) disclaim responsibility for any injury to people or property resulting from any ideas, methods, instructions or products referred to in the content. |
© 2023 by the authors. Licensee MDPI, Basel, Switzerland. This article is an open access article distributed under the terms and conditions of the Creative Commons Attribution (CC BY) license (https://creativecommons.org/licenses/by/4.0/).