Article

Identification of Eight Pterocarpus Species and Two Dalbergia Species Using Visible/Near-Infrared (Vis/NIR) Hyperspectral Imaging (HSI)

1
Nanjing Forest Police College, College of Criminal Science and Technology, Nanjing 210023, China
2
College of Forestry, Nanjing Forestry University, Nanjing 210037, China
3
College of Landscape Architecture, Nanjing Forestry University, Nanjing 210037, China
*
Author to whom correspondence should be addressed.
These authors contributed equally to this work.
Forests 2023, 14(6), 1259; https://doi.org/10.3390/f14061259
Submission received: 1 June 2023 / Revised: 14 June 2023 / Accepted: 15 June 2023 / Published: 17 June 2023
(This article belongs to the Special Issue Recent Advances in Wood Identification, Evaluation and Modification)

Abstract

:
Pterocarpus santalinus is considered among the finest luxury woods in the world and has potential commercial and medicinal value. Due to its rich hue and high price, Pterocarpus santalinus has often been substituted and mislabeled with other woods of lower economic value. To maintain the order of the timber market and the interests of consumers, it is necessary to establish a fast and reliable method for Pterocarpus species identification. In this study, wood samples of Pterocarpus santalinus and nine other wood samples commonly used for counterfeiting were analyzed by visible light/near-infrared (Vis/NIR) hyperspectral imaging (HSI). The spectral data were preprocessed with different algorithms. Principal component analysis (PCA) was applied in different spectral ranges: 400~2500 nm, 400~800 nm, and 800~2500 nm. Partial least squares discriminant analysis (PLS-DA) and square support vector machine (SVM) modeling methods were performed for effective discrimination. The best classification model was SVM combined with a normalization preprocessing method in whole spectral range (400~2500 nm), with prediction accuracy higher than 99.8%. The results suggest that the use of Vis/NIR-HSI in combination with chemometric approaches can be used as an effective tool for the discrimination of Pterocarpus santalinus.

1. Introduction

Pterocarpus santalinus, popularly known as “red sanders”, is a slow-growing forest legume tree that can attain a harvestable size of 70 cm DBH at 80~100 years. Pterocarpus santalinus has potential commercial and medicinal value, but due to poor natural regeneration, illegal logging, over-exploitation, and microclimate changes causing the degradation of natural populations, it has become an endangered species and was listed as a vulnerable species by the International Union for Conservation of Nature in 1998 [1]. The value of wood per ton was US $12,000 [2] and the global demand was estimated at 3000 tons per year [3]. Pterocarpus santalinus is considered among the finest luxury woods in the world [4] and is in high demand for musical instruments, toys, furniture, and handicrafts [5]. The wood is also considered as antipyretic, astringent, anthelmintic, and diaphoretic in indigenous medicine [6].
Illegal trading and harvesting of Pterocarpus santalinus appears to be widespread due to its rich hue and high price. It is often substituted and mislabeled with other woods of lower economic value, like Pterocarpus soyauxii, Pterocarpus tinctorius, Dalbergia louvelii, and Pterocarpus erinaceus, in the timber market [7]. Numerous seizures of Pterocarpus santalinus have been reported in China and other countries [7]. The identification of Pterocarpus santalinus wood is difficult because it shares morphological and anatomical similarities with other Pterocarpus species and some Dalbergia species [8]. Moreover, the Convention on International Trade in Endangered Species (CITES) has limited resources to assist in the identification of Pterocarpus wood [9].
To maintain the order of the timber market and the interests of consumers, it is necessary to establish a fast and reliable method for Pterocarpus species identification. Traditional wood identification methods were mainly carried out from the perspective of physics and anatomy. Despite the effectiveness of these methods, they have intrinsic disadvantages of high cost, lack of speed, and generally are only accurate to the genus level [10,11]. By contrast, optical and chemotaxonomical methods had proven useful in wood identification [12] and extremely similar wood species can be distinguished by analyzing their spectral characteristics.
Visible light/near-infrared (Vis/NIR) hyperspectral imaging (his) is a simple, green, effective, eco-friendly, and qualitative spectroscopic analytical technique [13]. NIR responds to the energy changing when the non-resonant molecular vibration changes from the ground state to the excited state, mainly reflecting the overtone and combination of hydrogen groups X–H [14]. Vis, as a very narrow part of the electromagnetic spectrum near the NIR, has a similar spectral response to NIR light [15,16]. Spectroscopic analysis combing Vis and NIR is an efficient and fast modern technology for quantitative and qualitative detections. Coupled with suitable modeling methods, Vis/NIR has been successfully applied in many fields, such as the petrochemical [17,18], agricultural [19,20], food [21,22], and pharmaceutical [23] industries. In recent years, Vis/NIR has also shown great potential in forestry applications [24,25,26]. Compared with Vis/NIR, Vis/NIR-HSI provides simultaneous determination of the physical and chemical properties of the sample as well as their spatial distribution, which overcomes some limitations of Vis/NIR spectroscopy. Therefore, Vis/NIR-HSI is more suitable for the analysis of heterogeneous samples and allows more reliable qualitative identification using both spatial and spectral information. Although this technique requires strong professional judgment, it has greater potential when combined with machine learning algorithms [27].
In this study, wood samples of Pterocarpus santalinus (expensive) and nine other highly similar species (less expensive) were analyzed by the Vis/NIR-HSI technique with standard normal variate (SNV), Savitzky–Golay (SG) smoothing, normalization, and multiple scattering correction (MSC) preprocessing methods. Different classification models have been compared and ranked, with the aim of establishing a reliable approach for the identification of these woods. Furthermore, there are few studies comparing and discerning which wavelength ranges are suitable for wood identification [28,29]. Using inappropriate wavelength ranges not only reduces the accuracy of the identification but also increases the computing costs. This study compared the reliability of spectral data in different ranges (Vis range, NIR range, entire range) in order to select the optimal range for the identification of Pterocarpus santalinus.

2. Materials and Methods

2.1. Samples

The scientific classification and number of wood samples are presented in Table 1. Wood samples were obtained from China National Forestry and Grassland Administration Wildlife Criminal Evidence Identification Center (Nanjing Forest Police College) including eight Pterocarpus species and two Dalbergia species. We included only species that had at least 20 individuals, with 4~8 samples taken from each individual. A total of 800 wood samples were obtained. In order to develop models, 600 samples were randomly selected as the calibration set for model calibration and 200 samples were selected as the validation set for validation.
Air-dried samples (moisture content of 11.5%–12%) were polished using sandpaper to reduce the roughness of surface and cut to 20 cubic mm (sap wood). According to our previous research, a transverse section of wood is more suitable for wood identification [27]. In this study, spectral data were scanned in a transverse section of the samples.

2.2. Equipment and Spectra Acquisition

Vis/NIR spectra of wood samples were collected in a darkroom using a Vis/NIR spectrophotometer (ImSpectorV 10E, Specim, Oulu, Finland). The light source was provided by a 350 W halogen lamp (Illumination Technologies, Liverpool, NY, USA) at a 45° angle. The distance between the light source and the surface of the wood sample was 350 mm. The spectroradiometer was located approximately 170 mm from the surface of the wood to be analyzed. The detection wavelength range of the spectrometer was 400~2500 nm and the sampling range of the Vis/NIR spectrophotometer was 6.2 nm. The light source was turned on 15 min earlier to allow the halogen lamps to warm up prior to analysis. Before spectrum acquisition, the instrument was calibrated with a black (covered camera lens) and white image (99.9% reflectance Teflon white plate). Wood samples were placed on a black cloth. For each sample, 80 spectra were scanned and averaged (Figure 1 and Figure 2).

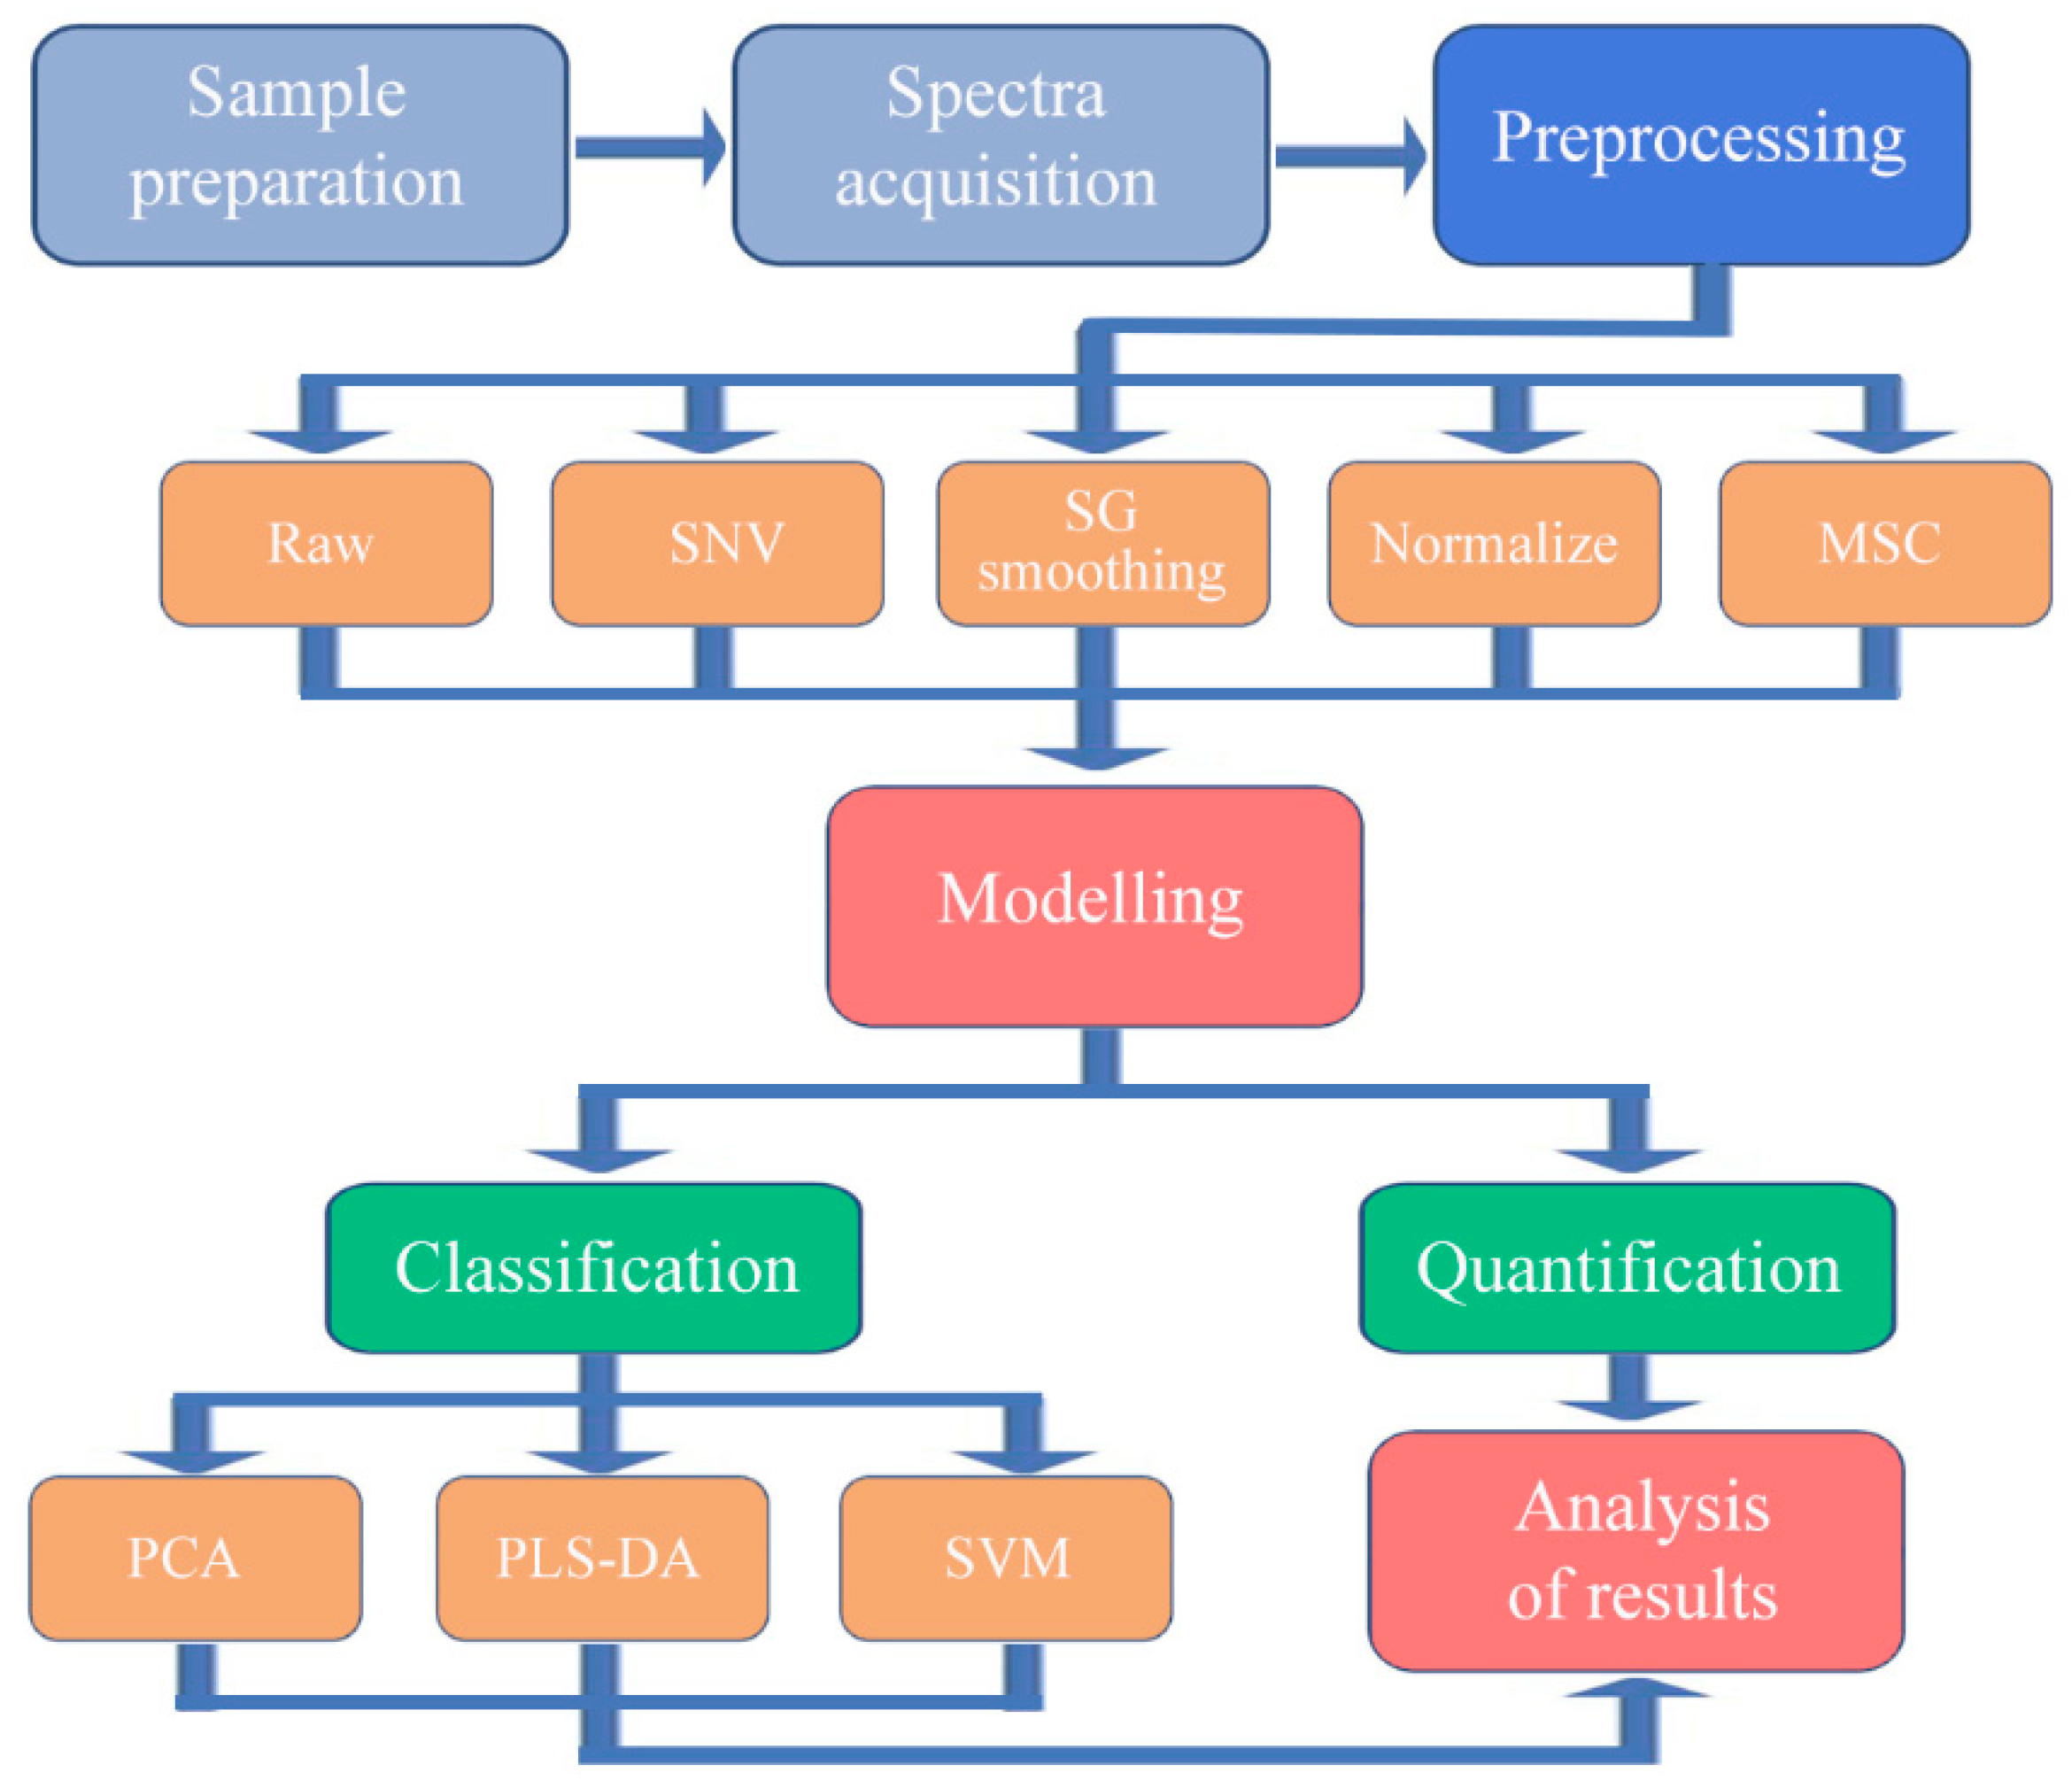
2.3. Model Development

Wood identification is needed in qualitative analysis. Principal component analysis (PCA), partial least squares discriminant analysis (PLS-DA), and square support vector machine (SVM) modeling methods were performed separately for the Vis range (400 nm~800 nm), the NIR range (800 nm~2500 nm), and the entire spectral range with PLS-toolbox 802 (Eigenvector Research, Inc., Manson, WA, USA). In addition, SNV, SG smoothing, normalization, and MSC preprocessing methods were employed before model development.
The value of accuracy rate, sensitivity, and specificity were used to determine the performance of models. The accuracy rate is the ratio of true positives to the total number of samples. Sensitivity allows for the assessment of how well the model can identify samples that belong to a particular class, and specificity measures the capacity of the model to reject nonbelonging samples. In this study, three statistical parameters were considered to evaluate the models. The flowchart for the identification of wood samples using Vis/NIR-HSI technique is shown in Figure 3.

3. Results

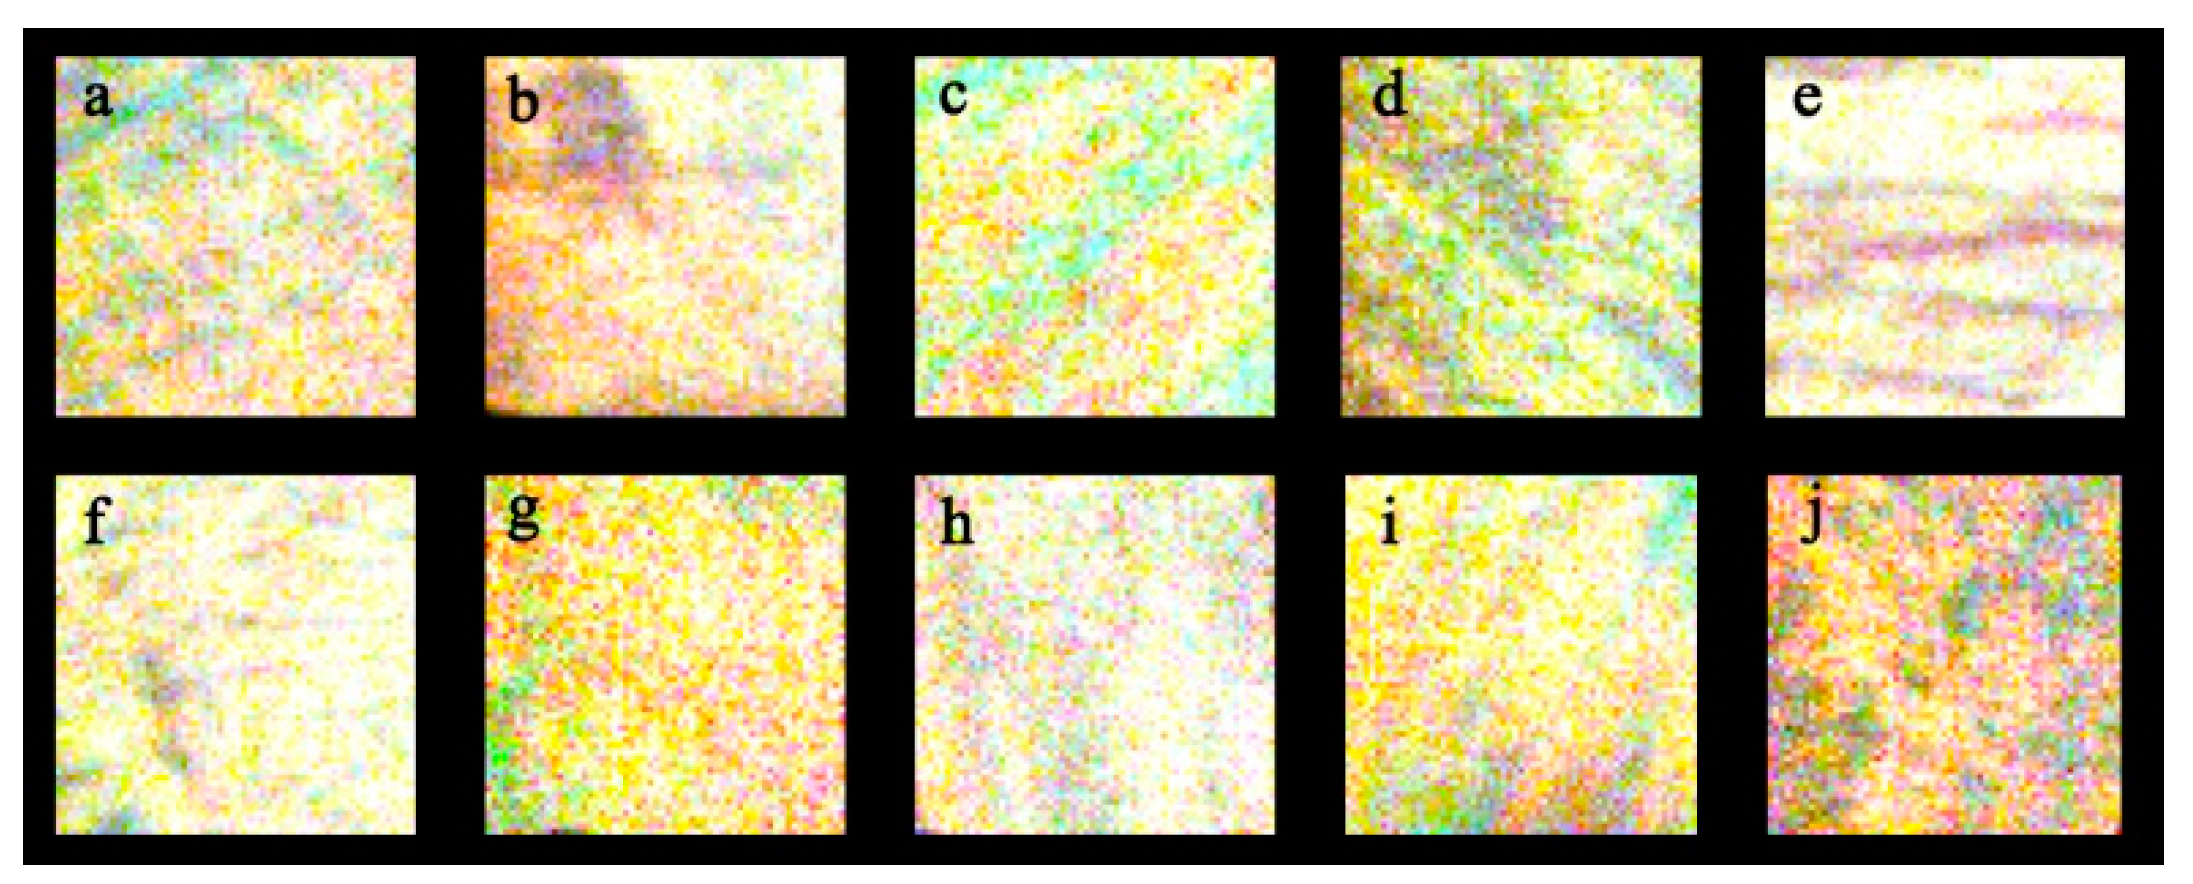
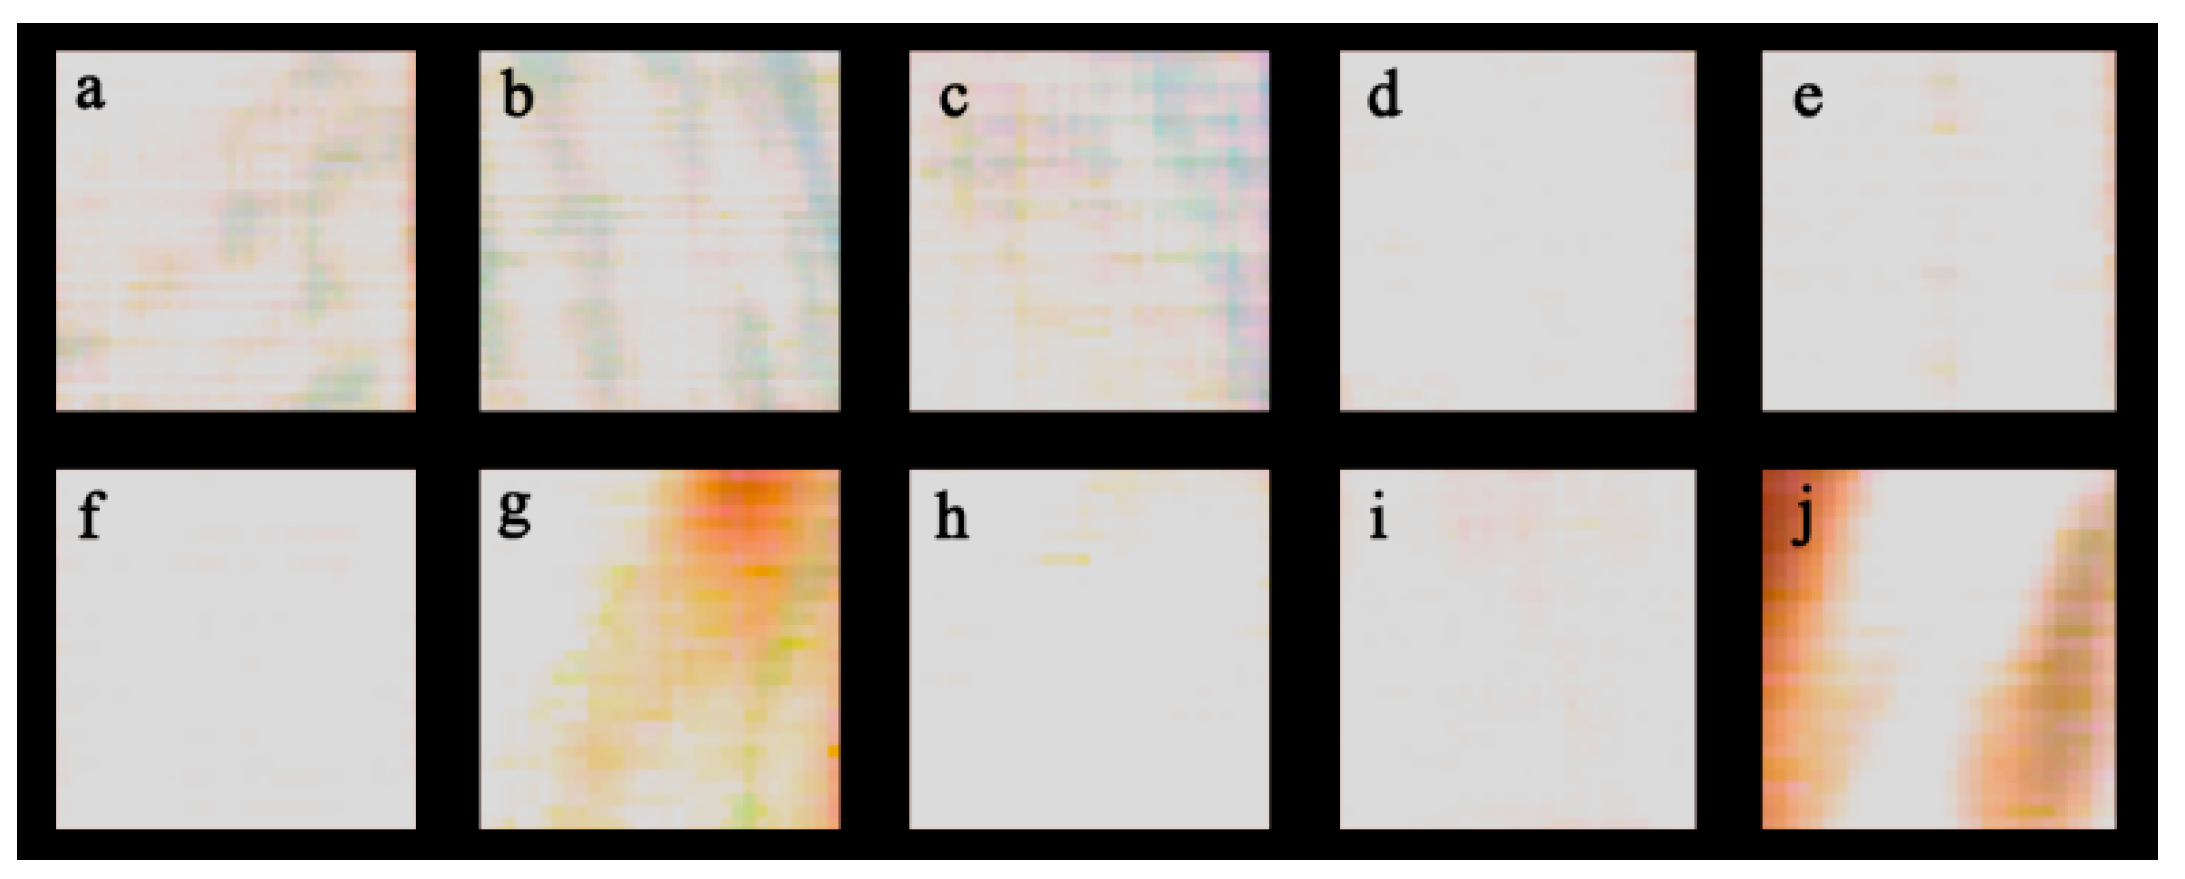
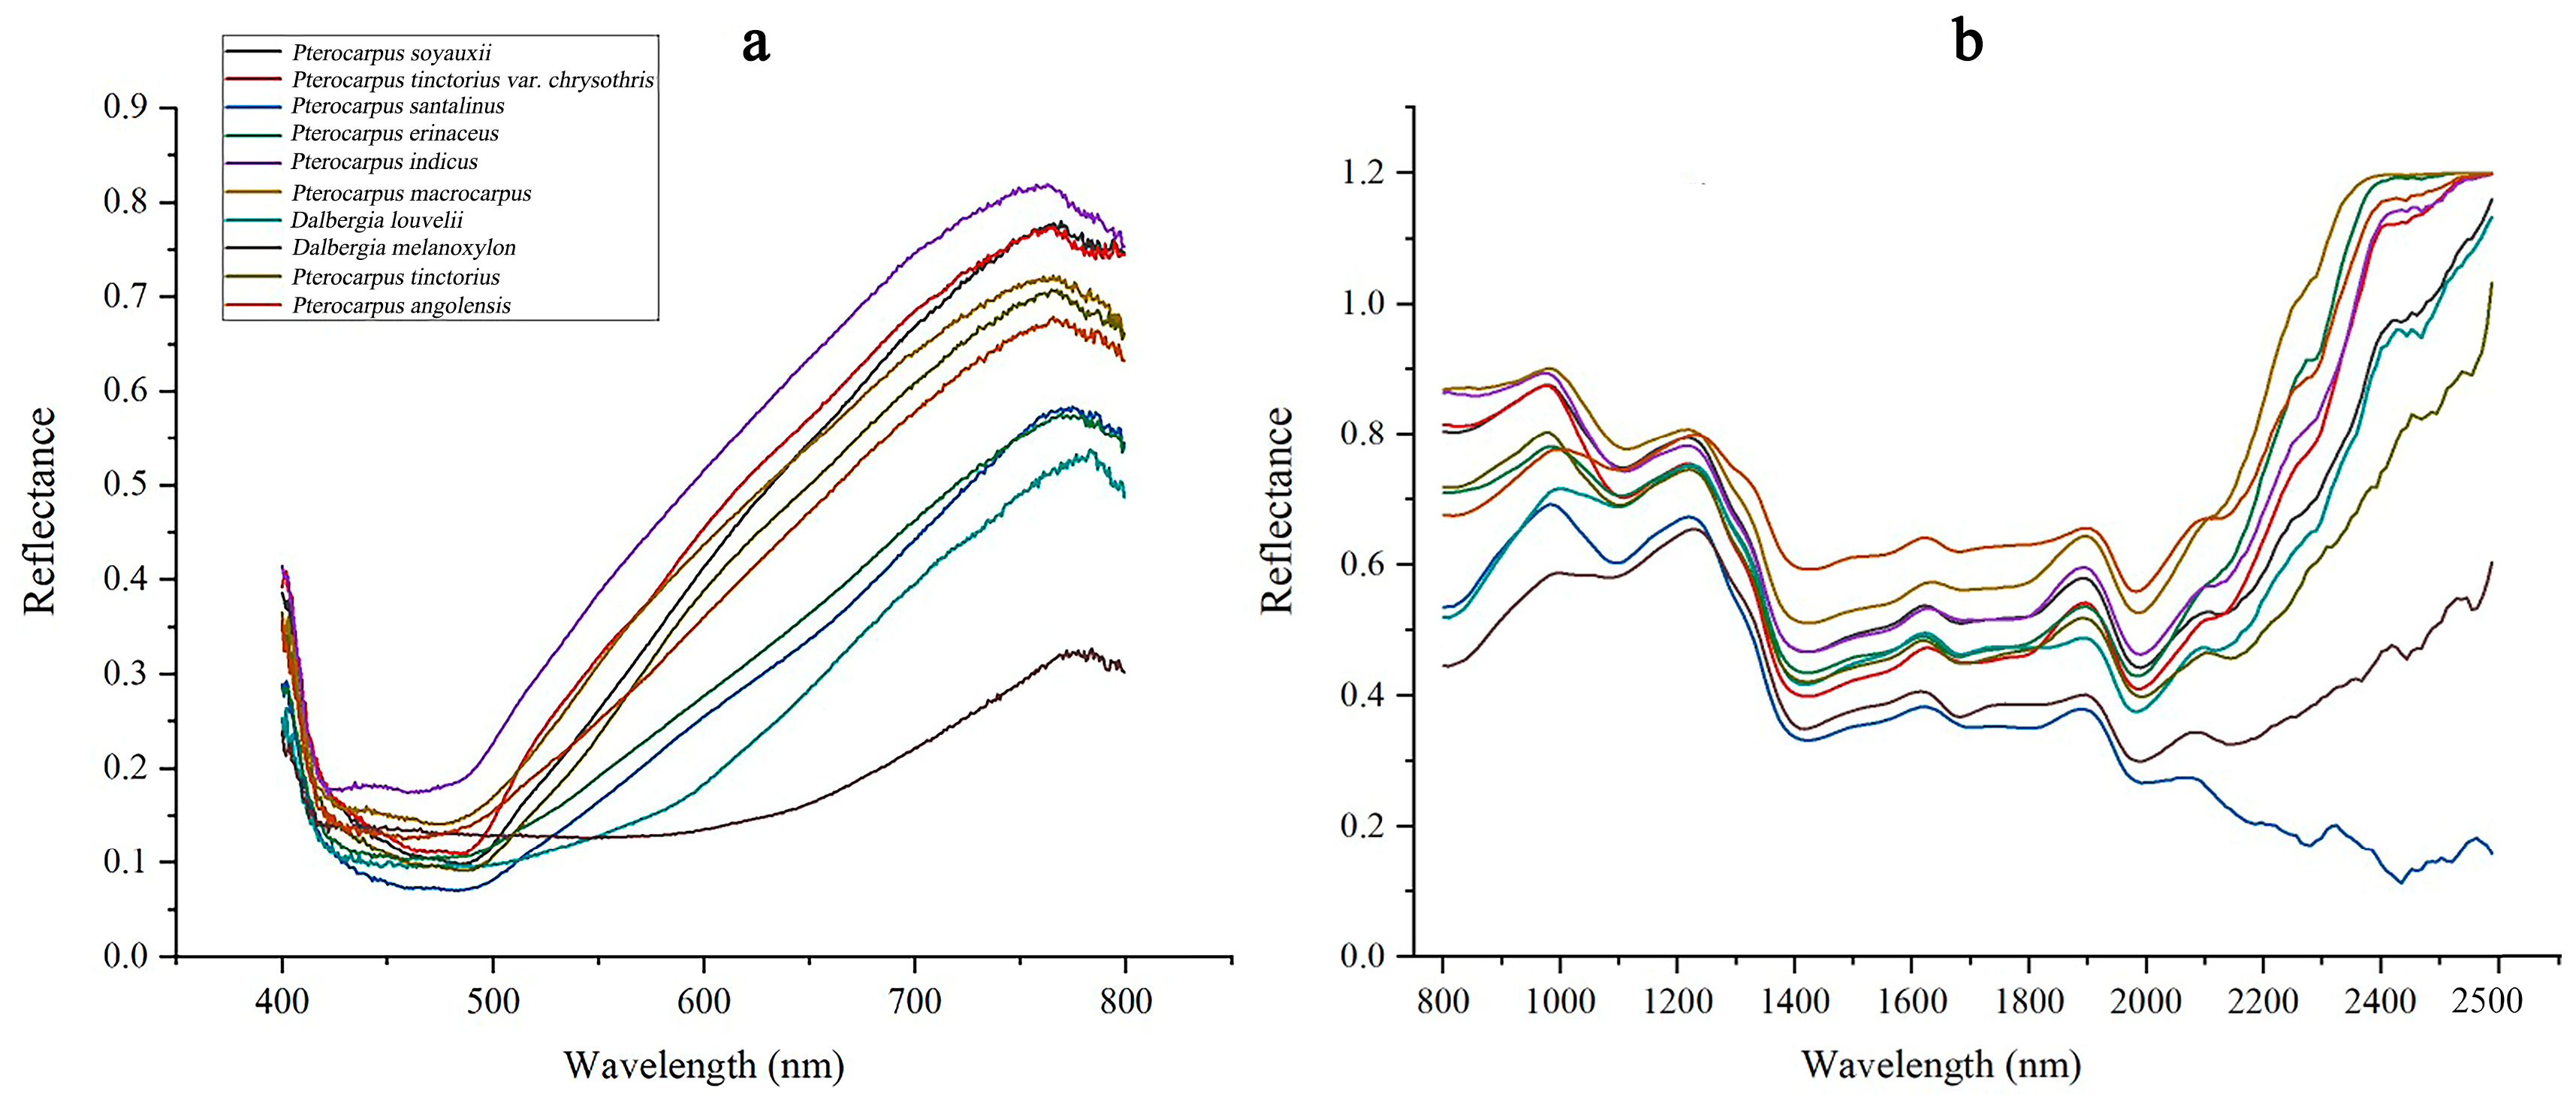
3.1. Spectroscopic Characterization

Vis/NIR are highly suitable for assessment of heterogeneous organic matter, including wood and wood products. The Vis/NIR spectrum contains information regarding both the physical state and chemical composition of measured wood samples. The spectral peak position and its shape corresponds to the presence of specific functional groups possessing dipole momentum [30].
Figure 4 shows that the eight Pterocarpus species and two Dalbergia species had different absorbance patterns, with prominent absorption peaks at 780, 980, 1240, 1660, 1930, 2080, 2230, and 2350 nm. The variation in the Vis range would be related to ASTA values (extractable color) [31]. The peak around 980 nm may associated with the third stretching overtone of the C-H bonds [32]. The peaks at 1240 nm may correspond to cellulose [33], while the peak at 1660 nm corresponds to a C-H stretching vibration in the first and second overtone. The peak at approximately 1930 nm corresponds to an O-H stretching vibration or O-H-O combination of deformation, and might be due to water peaks [34]. The peaks at 2080 and 2230 nm correspond to an N-H stretching vibration and are mainly related to lipids, carbohydrates, or protein macromolecular organic matter [35]. The peak at around 2350 nm most likely originates from fat [36,37]. The above characteristic peaks are associated with the chemical compound content in the wood samples. Overall, the NIR range provided more useful information than Vis range, which may be more suitable for wood identification.

3.2. Principal Component Analysis

A PCA model was applied to preprocessed data to investigate the grouping possibility in the data set. The best results of the PCA model were achieved by a normalization algorithm, and therefore the 3D scatterplots of ten tree species were created based on normalization preprocessed spectra. PCA were performed on three spectral ranges (400~800 nm, 800~2500 nm, 400~2500 nm) including all wood samples. For three spectral ranges, the first three principal components (PCs) can describe the most variance. In Figure 5a, PC1 explains 79.2% of total variance, and PC2 explains 14.7% of variance. Figure 5b represents 95.5% of total variance (PC1 = 79.1%, PC2 = 9.2%, PC = 7.2%). When including the entire spectral range, the first three main components explain 90.3% of data variance (PC1 = 66.7%, PC2 = 14.4%, PC = 9.2%).
Figure 5 illustrates the ten tree species that were clustered into ten groups. However, there was a moderate overlap between wood samples of Pterocarpus soyauxii and Pterocarpus tinctorius var. chrysothris and a small overlap between Pterocarpus soyauxii and Pterocarpus tinctorius. This indicates that Pterocarpus soyauxii and Pterocarpus tinctorius var. chrysothris were similar to each other in wood spectra. Moreover, the overlap of the groups is stronger when using only the Vis range, compared to using the NIR and entire spectral range. PCA scatterplots of spectral data from 800 nm to 2500 nm show the best clustering compared to the other spectral data ranges. The Vis range was previously reported to be related to pigment [38]. Some of the wood samples in this study had a similar pigment composition [39], which may lead to close Vis spectral characteristics. From the outcomes of PCA analysis, it can be concluded that the results of PCA model are dependent on the range of spectral data.

3.3. Results Using PLS-DA

In this study, PLS-DA and SVM were used for spectral data classification. Both chemometric methods belong to the group of supervised techniques and need complete information regarding the membership of each wood sample to a certain category. These algorithms are capable of classifying an unknown sample into one of the pre-defined classes on the basis of its spectral pattern [40].
Tables S1 and S2, and Figure 6 summarize the accuracy, sensitivity, and specificity for the PLS-DA model and compare different preprocessing algorithms. The PLS-DA model, as a commonly used classification model, has the advantage of less computational cost; it can find the best functional match for a set of data by minimizing the sum of squares of the errors [41]. PLS-DA has been widely used in the analysis of multivariate data. However, the calculation results show that the PLS-DA model performed poorly in the identification of eight Pterocarpus species and two Dalbergia species. The best results were achieved for the NIR range in both calibration and validation sets. The entire spectral range gave slightly lower accuracy than the NIR range. Therefore, the best choice for modeling with PLS-DA would be the NIR range.
In this study, for the sake of suppressing the bad influence of noise, SNV, SG smoothing, normalization, and MSC preprocessing were used to analyze the Vis/NIR spectra data. The results for the preprocessed spectra data were improved compared to the raw spectra data. It is apparent from Table 2 that PLS-DA combined with SG smoothing preprocessing methods can achieve the highest prediction accuracy, while SNV and MSC treatment performed relatively poorly. Additionally, there were some differences in the performance of the preprocessing methods within each spectral range. In this study, the best PLS-DA model was obtained using NIR spectral data with SG smoothing methods with 96.8% and 96.5% accuracy for calibration and validation sets, respectively. Furthermore, it can be seen from Figure 6 that Pterocarpus santalinus can be easily confused with Pterocarpus erinaceus when using Vis range, which may be related to the highly similar ASTA values of the two species.

3.4. Results Using SVM

SVM is a supervised machine learning algorithm useful for solving both regression and classification problems. It is a nonlinear classification method that constructs a set of hyperplanes in a high or infinite dimensional space, and a good separation is achieved by the hyperplane that has the largest distance to the nearest training data point of any class [42]. Compared with the PLS-DA model, SVM is not influenced by the distribution of diverse sample classes.
In contrast to the results of PLS-DA model, the performance of the SVM was better. The classification accuracy was lower for the spectral range from 400 nm to 800 nm as compared with the other ranges, but still provided acceptable results. As shown in Table 2, the best choice with SVM model would be with the entire spectral range, but the difference was not significant compared to the NIR range. In the NIR and entire spectral range, the sensitivity and specificity rates present similar values, which means that the error was balanced.
The classification accuracy of the SVM model for various preprocessing methods is illustrated in Table 3. The best results for NIR and entire spectral range were obtained with the normalization method, with 100% (validation set). In spite of weaker classification results for PLS-DA in the Vis range, the SVM model combined with normalization preprocessing was able to identify eight Pterocarpus species and two Dalbergia species with an accuracy of 96.5% (calibration set) and 95% (validation set). It needs to be noted that the use of the SVM model with Vis ranges does not improve the accuracy of identifying Pterocarpus santalinus (Figure 7).

4. Discussion

Pterocarpus santalinus has a higher economic value than Pterocarpus soyauxii, Pterocarpus tinctorius var. chrysothris, and Pterocarpus erinaceus, et al. The identification of Pterocarpus santalinus and its counterfeits requires specialist skills. In this study, we have used Vis/NIR-HSI techniques to identify Pterocarpus santalinus and its nine common counterfeit woods. It can be seen from the raw Vis-NIR spectra (Figure 4) that the wavelengths with the highest variation for Pterocarpus santalinus were mainly at 780, 980, 1240, 1660, 1930, 2080, 2230, and 2350 nm, which were different from its counterfeits. Furthermore, the original average spectra of all samples in the wavelength ranges of 400~955 nm and 800~2500 nm showed different absorbance peaks related to the vibration energy of the molecular bonds of O–H, C–H, C–O, and N–H. This demonstrates the potential of using the Vis/NIR-HSI technique for the identification of wood samples.
In recent years, many studies have focused on the identification of wood using Vis/NIR techniques, [43] but the optimal wavelength range selection has rarely been discussed. Choosing an unsuitable wavelength range not only reduces the accuracy of identification, but it also increases the cost of the equipment. In this study, we developed a classification model with spectral data in different ranges (Vis range, NIR range, entire range). When compared to the results of the NIR spectra, the predictive accuracy of the classification model developed with full spectra was not enhanced. The reason behind this may be that the Vis range cannot provide enough spectral information, and noise exists, leading to the low quality of spectral data. This also demonstrated that few wavelengths are needed for the identification of Pterocarpus and Dalbergia species. Wavelengths attributed to wood compounds, such as cellulose and lignin, may have more effects on the prediction accuracy [28,44,45].
The wood samples used in this study were natural and had not been treated with formaldehyde, thermally modified, etc. The treatment of wood can significantly affect its spectral characteristics [46,47]. As treated wood and wood products are very common in the market, further research is needed in this important area. Furthermore, the wood samples selected for this study were all sap wood. Different parts of the rosewood may secrete different substances [48], which may affect the applicability of the models. To build more accurate classification models, wood samples from different parts are needed in future studies.

5. Conclusions

In this study, Vis/NIR-HSI techniques have been proven to classify eight Pterocarpus species and two Dalbergia species. The variability of wood samples and the random selection of samples for calibration and validation suggest the robustness of the models. PCA was used to analyze the spectral data of the wood samples. PCA scatterplots of NIR range show the best clustering compared to the other spectral ranges. Moreover, it was found that the differences between Pterocarpus soyauxii and Pterocarpus tinctorius var. chrysothris were not obvious due to similar spectral characteristics. The PLS-DA and SVM models were established based on different spectral ranges of the raw data and preprocessed data. The Vis range offered acceptable classification, whereas the NIR range showed significantly higher identification accuracy based on differences in the absorbance of lipids, carbohydrates, or protein macromolecular organic matter. It was found that the SVM model performed better than the PLS-DA method, as shown by its discrimination accuracy. Satisfactory identification accuracy was obtained, which was 99.5% for both NIR and entire spectral range (validation set). It can be highlighted that the normalization preprocessing method combined with SVM model can achieve the highest accuracy in the whole spectral range (100%, validation set).
This study demonstrated that the Vis/NIR-HSI techniques combined with SVM have the ability to identify wood from the genera Pterocarpus and Dalbergia. This method is rapid, easy, and non-destructive, which could reduce the enormous workload of wood experts and increase the accuracy of testing.

Supplementary Materials

The following supporting information can be downloaded at: https://www.mdpi.com/article/10.3390/f14061259/s1, Table S1: Results of calibration and validation sets using PLS-DA. Table S2: Results of calibration and validation sets using SVM.

Author Contributions

Conceptualization, X.X.; writing—original draft preparation, Z.C.; data curation, H.W.; supervision, H.G.; software, J.N. and X.L. All authors have read and agreed to the published version of the manuscript.

Funding

This research was funded by the Excellent scientific and technological innovation team of higher education in Jiangsu Province, grant number 2019-29; the Qing Lan Project of higher education of Jiangsu province; National College Student Innovation Training Programme, grant number 202012213040, 202012213020; the 14th Five-Year Plan (2021–2025) Key Subjects of Jiangsu province (Police technology).

Data Availability Statement

The datasets generated and analyzed during the current study are available in the Figshare repository, [https://doi.org/10.6084/m9.figshare.22284712.v1 (accessed on 16 March 2023)].

Conflicts of Interest

The authors declare no conflict of interest.

References

  1. Karthikeyan, A.; Arunprasad, T. Growth Response of Pterocarpus santalinus Seedlings to Native Microbial Symbionts (Arbuscular mycorrhizal Fungi and Rhizobium aegyptiacum) under Nursery Conditions. J. For. Res. 2021, 32, 225–231. [Google Scholar] [CrossRef]
  2. Soundararajan, V. A Review on red sanders (Pterocarpus santalinus linn.)-Phyto-Chemistry and pharmacological importance. World J. Pharm. Pharm. Sci. 2016, 5, 667–689. [Google Scholar]
  3. Kukrety, S.; Dwivedi, P.; Jose, S.; Alavalapati, J.R.R. Stakeholders’ Perceptions on Developing Sustainable Red Sanders (Pterocarpus santalinus L.) Wood Trade in Andhra Pradesh, India. For. Policy Econ. 2013, 26, 43–53. [Google Scholar] [CrossRef]
  4. Prakash, E.; Sha Valli Khan, P.S.; Sreenivasa Rao, T.J.V.; Meru, E.S. Micropropagation of Red Sanders (Pterocarpus santalinus L.) Using Mature Nodal Explants. J. Res. 2006, 11, 329–335. [Google Scholar] [CrossRef]
  5. Arunkumar, A.N.; Joshi, G. Pterocarpus santalinus (Red Sanders) an Endemic, Endangered Tree of India: Current Status, Improvement and the Future. J. Trop. For. Environ. 2014, 4, 1–10. [Google Scholar] [CrossRef]
  6. Arokiyaraj, S.; Martin, S.; Perinbam, K.; Arockianathan, P.M.; Beatrice, V. Free Radical Scavenging Activity and HPTLC Finger Print of Pterocarpus santalinus L.—An in Vitro Study. Indian J. Sci. Technol. 2008, 1, 1–3. [Google Scholar] [CrossRef]
  7. Jiao, L.; Yu, M.; Wiedenhoeft, A.C.; He, T.; Li, J.; Liu, B.; Jiang, X.; Yin, Y. DNA Barcode Authentication and Library Development for the Wood of Six Commercial Pterocarpus Species: The Critical Role of Xylarium Specimens. Sci. Rep. 2018, 8, 1945. [Google Scholar] [CrossRef] [Green Version]
  8. Braga, J.W.B.; Pastore, T.C.M.; Coradin, V.T.R.; Camargos, J.A.A.; Silva, A.R. da The Use of near Infrared Spectroscopy to Identify Solid Wood Specimens of Swietenia Macrophylla0 (Cites Appendix II). IAWA J. 2011, 32, 285–296. [Google Scholar] [CrossRef]
  9. MacLachlan, I.R.; Gasson, P. PCA of Cites Listed Pterocarpus santalinus (Leguminosae) Wood. IAWA J. 2010, 31, 121–138. [Google Scholar] [CrossRef] [Green Version]
  10. Gasson, P. How Precise Can Wood Identification Be? Wood Anatomy’s Role in Support of the Legal Timber Trade, Especially Cites. IAWA J. 2011, 32, 137–154. [Google Scholar] [CrossRef]
  11. Ravindran, P.; Thompson, B.J.; Soares, R.K.; Wiedenhoeft, A.C. The XyloTron: Flexible, Open-Source, Image-Based Macroscopic Field Identification of Wood Products. Front. Plant Sci. 2020, 11, 1015. [Google Scholar] [CrossRef] [PubMed]
  12. Brunswick, P.; Cuthbertson, D.; Yan, J.; Chua, C.C.; Duchesne, I.; Isabel, N.; Evans, P.D.; Gasson, P.; Kite, G.; Bruno, J.; et al. A Practical Study of CITES Wood Species Identification by Untargeted DART/QTOF, GC/QTOF and LC/QTOF Together with Machine Learning Processes and Statistical Analysis. Environ. Adv. 2021, 5, 100089. [Google Scholar] [CrossRef]
  13. Sun, X.; Li, H.; Yi, Y.; Hua, H.; Guan, Y.; Chen, C. Rapid Detection and Quantification of Adulteration in Chinese Hawthorn Fruits Powder by Near-Infrared Spectroscopy Combined with Chemometrics. Spectrochim. Acta Part A Mol. Biomol. Spectrosc. 2021, 250, 119346. [Google Scholar] [CrossRef] [PubMed]
  14. Chen, H.-Z.; Xu, L.-L.; Tang, G.-Q.; Song, Q.-Q.; Feng, Q.-X. Rapid Detection of Surface Color of Shatian Pomelo Using Vis-NIR Spectrometry for the Identification of Maturity. Food Anal. Methods 2016, 9, 192–201. [Google Scholar] [CrossRef]
  15. da Silva, V.A.G.; Talhavini, M.; Peixoto, I.C.F.; Zacca, J.J.; Maldaner, A.O.; Braga, J.W.B. Non-Destructive Identification of Different Types and Brands of Blue Pen Inks in Cursive Handwriting by Visible Spectroscopy and PLS-DA for Forensic Analysis. Microchem. J. 2014, 116, 235–243. [Google Scholar] [CrossRef]
  16. Wu, D.; He, Y.; Nie, P.; Cao, F.; Bao, Y. Hybrid Variable Selection in Visible and Near-Infrared Spectral Analysis for Non-Invasive Quality Determination of Grape Juice. Anal. Chim. Acta 2010, 659, 229–237. [Google Scholar] [CrossRef]
  17. He, K.; Zhong, M.; Li, Z.; Liu, J. Near-Infrared Spectroscopy for the Concurrent Quality Prediction and Status Monitoring of Gasoline Blending. Control Eng. Pract. 2020, 101, 104478. [Google Scholar] [CrossRef]
  18. Jingyan, L.I.; Xiaoli, C.H.U.; Pu, C.; Songbai, T. Application of Spectral Automatic Retrieval Algorithm on the Rapid Establishment of Gasoline Spectral Database. Acta Pet. Sin. (Pet. Process. Sect.) 2017, 33, 131. [Google Scholar]
  19. Lin, Z.D.; Wang, Y.B.; Wang, R.J.; Wang, L.S.; Lu, C.P.; Zhang, Z.Y.; Song, L.T.; Liu, Y. Improvements of the Vis-NIRS Model in the Prediction of Soil Organic Matter Content Using Spectral Pretreatments, Sample Selection, and Wavelength Optimization. J. Appl. Spectrosc. 2017, 84, 529–534. [Google Scholar] [CrossRef]
  20. Mishra, P.; Herrmann, I.; Angileri, M. Improved Prediction of Potassium and Nitrogen in Dried Bell Pepper Leaves with Visible and Near-Infrared Spectroscopy Utilising Wavelength Selection Techniques. Talanta 2021, 225, 121971. [Google Scholar] [CrossRef]
  21. Jiang, Y.; Li, C.; Takeda, F. Nondestructive Detection and Quantification of Blueberry Bruising Using Near-Infrared (NIR) Hyperspectral Reflectance Imaging. Sci. Rep. 2016, 6, 35679. [Google Scholar] [CrossRef] [PubMed] [Green Version]
  22. Santos, I.A.; Conceição, D.G.; Viana, M.B.; de J. Silva, G.; Santos, L.S.; Ferrão, S.P.B. NIR and MIR Spectroscopy for Quick Detection of the Adulteration of Cocoa Content in Chocolates. Food Chem. 2021, 349, 129095. [Google Scholar] [CrossRef] [PubMed]
  23. Lakeh, M.A.; Karimvand, S.K.; Khoshayand, M.R.; Abdollahi, H. Analysis of Residual Moisture in a Freeze-Dried Sample Drug Using a Multivariate Fitting Regression Model. Microchem. J. 2020, 154, 104516. [Google Scholar] [CrossRef]
  24. Amaral, E.A.; dos Santos, L.M.; Hein, P.R.G.; Costa, E.V.S.; Rosado, S.C.S.; Trugilho, P.F. Evaluating Basic Density Calibrations Based on NIR Spectra Recorded on the Three Wood Faces and Subject to Different Mathematical Treatments. N. Z. J. For. Sci. 2021, 51. [Google Scholar] [CrossRef]
  25. Blaschek, M.; Roudier, P.; Poggio, M.; Hedley, C.B. Prediction of Soil Available Water-Holding Capacity from Visible near-Infrared Reflectance Spectra. Sci. Rep. 2019, 9, 12833. [Google Scholar] [CrossRef] [Green Version]
  26. Pace, J.-H.C.; de F. Latorraca, J.-V.; Hein, P.; da Silva, C.-E.S. Wood Species Identification from Atlantic Forest by near Infrared Spectroscopy. For. Syst. 2019, 28, 3. [Google Scholar]
  27. Xue, X.; Chen, Z.; Wu, H.; Gao, H. Identification of Guiboutia Species by NIR-HSI Spectroscopy. Sci. Rep. 2022, 12, 11507. [Google Scholar] [CrossRef]
  28. Ziyang, W.; Shikui, Y.I.N.; Ying, L.I.; Yaoxiang, L.I. Identification of common wood species in northeast China using Vis/NIR spectroscopy. J. Zhejiang AF Univ. 2019, 36, 162–169. [Google Scholar]
  29. Zhao, P.; Li, Z.-Y.; Wang, C.-K. Wood Species Recognition Based on Visible and Near-Infrared Spectral Analysis Using Fuzzy Reasoning and Decision-Level Fusion. J. Spectrosc. 2021, 2021, e6088435. [Google Scholar] [CrossRef]
  30. Sandak, J.; Sandak, A.; Zitek, A.; Hintestoisser, B.; Picchi, G. Development of Low-Cost Portable Spectrometers for Detection of Wood Defects. Sensors 2020, 20, 545. [Google Scholar] [CrossRef] [Green Version]
  31. Palacios-Morillo, A.; Jurado, J.M.; Alcázar, A.; Pablos, F. Differentiation of Spanish Paprika from Protected Designation of Origin Based on Color Measurements and Pattern Recognition. Food Control 2016, 62, 243–249. [Google Scholar] [CrossRef]
  32. Andrés, S.; Murray, I.; Navajas, E.A.; Fisher, A.V.; Lambe, N.R.; Bünger, L. Prediction of Sensory Characteristics of Lamb Meat Samples by near Infrared Reflectance Spectroscopy. Meat Sci. 2007, 76, 509–516. [Google Scholar] [CrossRef] [PubMed]
  33. Ali, M.; Emsley, A.M.; Herman, H.; Heywood, R.J. Spectroscopic Studies of the Ageing of Cellulosic Paper. Polymer 2001, 42, 2893–2900. [Google Scholar] [CrossRef]
  34. Núñez-Sánchez, N.; Martínez-Marín, A.L.; Polvillo, O.; Fernández-Cabanás, V.M.; Carrizosa, J.; Urrutia, B.; Serradilla, J.M. Near Infrared Spectroscopy (NIRS) for the Determination of the Milk Fat Fatty Acid Profile of Goats. Food Chem. 2016, 190, 244–252. [Google Scholar] [CrossRef] [PubMed]
  35. Badaró, A.T.; Morimitsu, F.L.; Ferreira, A.R.; Clerici, M.T.P.S.; Fernandes Barbin, D. Identification of Fiber Added to Semolina by near Infrared (NIR) Spectral Techniques. Food Chem. 2019, 289, 195–203. [Google Scholar] [CrossRef]
  36. Krähmer, A.; Engel, A.; Kadow, D.; Ali, N.; Umaharan, P.; Kroh, L.W.; Schulz, H. Fast and Neat—Determination of Biochemical Quality Parameters in Cocoa Using near Infrared Spectroscopy. Food Chem. 2015, 181, 152–159. [Google Scholar] [CrossRef]
  37. Lequeue, G.; Draye, X.; Baeten, V. Determination by near Infrared Microscopy of the Nitrogen and Carbon Content of Tomato (Solanum lycopersicum L.) Leaf Powder. Sci. Rep. 2016, 6, 33183. [Google Scholar] [CrossRef]
  38. Bonaccorsi, I.; Cacciola, F.; Utczas, M.; Inferrera, V.; Giuffrida, D.; Donato, P.; Dugo, P.; Mondello, L. Characterization of the Pigment Fraction in Sweet Bell Peppers (Capsicum annuum L.) Harvested at Green and Overripe Yellow and Red Stages by Offline Multidimensional Convergence Chromatography/Liquid Chromatography-Mass Spectrometry. J. Sep. Sci. 2016, 39, 3281–3291. [Google Scholar] [CrossRef]
  39. Tan, Y.; Chen, B.; Ren, C.; Guo, M.; Wang, J.; Shi, K.; Wu, X.; Feng, Y. Rapid Identification Model Based on Decision Tree Algorithm Coupling with 1H NMR and Feature Analysis by UHPLC-QTOFMS Spectrometry for Sandalwood. J. Chromatogr. B 2020, 1161, 122449. [Google Scholar] [CrossRef]
  40. Berrueta, L.A.; Alonso-Salces, R.M.; Héberger, K. Supervised Pattern Recognition in Food Analysis. J. Chromatogr. A 2007, 1158, 196–214. [Google Scholar] [CrossRef]
  41. Lestander, T.A.; Lindeberg, J.; Eriksson, D.; Bergsten, U. Prediction of Pinus Sylvestris Clear-Wood Properties Using NIR Spectroscopy and Biorthogonal Partial Least Squares Regression. Can. J. For. Res. 2008, 38, 2052–2062. [Google Scholar] [CrossRef] [Green Version]
  42. Tian, Y.; Wang, Z.; Han, X.; Hou, H.; Zheng, R. Comparative Investigation of Partial Least Squares Discriminant Analysis and Support Vector Machines for Geological Cuttings Identification Using Laser-Induced Breakdown Spectroscopy. Spectrochim. Acta Part B At. Spectrosc. 2014, 102, 52–57. [Google Scholar] [CrossRef]
  43. Li, Y.; Via, B.K.; Young, T.; Li, Y. Visible-Near Infrared Spectroscopy and Chemometric Methods for Wood Density Prediction and Origin/Species Identification. Forests 2019, 10, 1078. [Google Scholar] [CrossRef] [Green Version]
  44. Estimation of Pinus Radiata D. Don Tracheid Morphological Characteristics by near Infrared Spectroscopy. Available online: https://www.degruyter.com/document/doi/10.1515/HF.2004.009/html (accessed on 3 May 2023).
  45. Wang, C.-K.; Zhao, P.; Li, Z.-Y.; Li, X.-H. Comparison of VIS/NIR Spectral Curves plus RGB Images with Hyperspectral Images for the Identification of Pterocarpus Species. Holzforschung 2022, 76, 579–591. [Google Scholar] [CrossRef]
  46. Bächle, H.; Zimmer, B.; Wegener, G. Classification of Thermally Modified Wood by FT-NIR Spectroscopy and SIMCA. Wood Sci. Technol. 2012, 46, 1181–1192. [Google Scholar] [CrossRef]
  47. Bächle, H.; Zimmer, B.; Windeisen, E.; Wegener, G. Evaluation of Thermally Modified Beech and Spruce Wood and Their Properties by FT-NIR Spectroscopy. Wood Sci. Technol. 2010, 44, 421–433. [Google Scholar] [CrossRef]
  48. Karthick, M.; Parthiban, K.T. Chemical Characterization of Pterocarpus santalinus Wood Using GC-MS. J. Pharm. Phytochem. 2019, 8, 380–382. [Google Scholar]
Figure 1. Vis-HSI of wood samples. (a) Pterocarpus soyauxii, (b) Pterocarpus tinctorius var. chrysothris, (c) Pterocarpus santalinus, (d) Pterocarpus erinaceus, (e) Pterocarpus indicus, (f) Pterocarpus macrocarpus, (g) Dalbergia louvelii, (h) Dalbergia melanoxylon, (i) Pterocarpus tinctorius, (j) Pterocarpus angolensis.
Forests 14 01259 g001
Figure 2. NIR-HSI of wood samples. (a) Pterocarpus soyauxii, (b) Pterocarpus tinctorius var. chrysothris, (c) Pterocarpus santalinus, (d) Pterocarpus erinaceus, (e) Pterocarpus indicus, (f) Pterocarpus macrocarpus, (g) Dalbergia louvelii, (h) Dalbergia melanoxylon, (i) Pterocarpus tinctorius, (j) Pterocarpus angolensis.
Forests 14 01259 g002
Figure 3. Flowchart of eight Pterocarpus species and two Dalbergia species’ identification using Vis/NIR-HSI method.
Forests 14 01259 g003
Figure 4. (a) Average Vis spectra of wood samples. (b) Average NIR spectra of wood samples.
Forests 14 01259 g004
Figure 5. Principal Component Analysis 3D scatterplots of spectral data from distinct wood samples. (a) Spectral data range from 400 nm to 800 nm, (b) spectral data range from 800 nm to 2500 nm, (c) spectral data range from 400 nm to 2500 nm.
Forests 14 01259 g005
Figure 6. Mixing matrix between true class and predicted class with PLS-DA model (without preprocessing). (a) Spectral data range from 400 nm to 800 nm, (b) spectral data range from 800nm to 2500 nm, (c) spectral data range from 400 nm to 2500 nm.
Forests 14 01259 g006
Figure 7. Mixing matrix between true class and predicted class with SVM model (without preprocessing). (a) Spectral data range from 400 nm to 800 nm, (b) spectral data range from 800 nm to 2500 nm, (c) spectral data range from 400 nm to 2500 nm.
Forests 14 01259 g007
Table 1. The plant materials used in the study.
Scientific ClassificationCalibration SetValidation Set
Pterocarpus soyauxii6020
Pterocarpus tinctorius var. chrysothris6020
Pterocarpus santalinus6020
Pterocarpus erinaceus6020
Pterocarpus indicus6020
Pterocarpus macrocarpus6020
Dalbergia louvelii6020
Dalbergia melanoxylon6020
Pterocarpus tinctorius6020
Pterocarpus angolensis6020
Table 2. The accuracy of PLS-DA model with different preprocessing method.
400~800 nm800~2500 nm400~2500 nm
Calibration Set (%)Validation Set (%)Calibration Set (%)Validation Set (%)Calibration Set (%)Validation Set (%)
PreprocessingRaw8884.596.796.590.394
SNV79.27692.8928688
SG Smoothing88.885.596.896.590.394
Normalization88.88596.59690.394
MSC88.885.592.79285.888.5
Bold values indicate the best results.
Table 3. The accuracy of SVM model with different preprocessing method.
400~800 nm800~2500 nm400~2500 nm
Calibration Set (%)Validation Set (%)Calibration Set (%)Validation Set (%)Calibration Set (%)Validation Set (%)
PreprocessingRaw96.394.599.799.599.899.5
SNV93.292.597.399.595.898
SG Smoothing96.59599.799.599.899.5
Normalization96.59599.710099.8100
MSC92.291.597.399.596.798.5
Bold values indicate the best results.
Disclaimer/Publisher’s Note: The statements, opinions and data contained in all publications are solely those of the individual author(s) and contributor(s) and not of MDPI and/or the editor(s). MDPI and/or the editor(s) disclaim responsibility for any injury to people or property resulting from any ideas, methods, instructions or products referred to in the content.

