1. Introduction
In an urbanising environment, issues of green space availability for city residents are relevant, both to the city in general and its individual/specific urban districts. The city’s greenery is the basis of the socio-ecological framework, an integral part of the urban infrastructure, performing ecosystem-environmental, sanitary, air/soil/water protection, recreational, and other essential purposes. Moreover, the optimal greenery determines the aesthetic function and lifestyle comfort of the population [
1,
2].
There are many ways to measure the multifunctionality of green infrastructure. Qualitative assessment includes identifying the data of forest’s inventory, health, phytopathological, living states, stand sustainability in response to urban environmental risks, and determining the ecological status of the areas. Ecosystem services are defined as assessing the environmental stabilisation, sanitation, and cultural functions of green spaces [
3]. The attractiveness of green spaces defines the functions of recreation and positive health effects on preventable deaths and diseases [
4,
5,
6].
The quantitative evaluation is expressed by calculating the degree of greening, per capita availability, accessibility measures, and proportion of protected natural areas. Greening is measured by calculating the proportion of green lands in a city’s total land fund and the proportion of green lands of public spaces in the total number of green areas. In the European Union (EU), green space availability per person considers both the distance to green space (percentage of residents that live 300 m away from parks or recreational areas) and the amount/density of green space (square metres per person) [
7]. The accessibility of green spaces is expressed by calculating the proportion of the population with access to green spaces, e.g., public green spaces, and determining green areas within a defined radius of the population’s residence. The same group includes assessing the dynamics of urban green spaces over a certain period [
8].
The availability of green areas is presently not defined by a single global standard [
9]. Such regulations and recommendations exist at the national or regional level. According to the Accessible Natural Greenspace Standard, which was developed in England [
10], everyone should have access to a green space that is at least 2 ha in size and no more than 300 m (5 min walk) from their house, regardless of where they reside. The International Union for Conservation of Nature (IUCN) proposes ”rule 3-30-300” which entails the following parameters: 3 trees by every home, 30 percent tree canopy cover in every neighbourhood, and 300 metres from the nearest park or green space (
https://iucnurbanalliance.org/promoting-health-and-wellbeing-through-urban-forests-introducing-the-3-30-300-rule/ (accessed on 16 June 2023)). The European Common Indicator suggests that green space should be at a distance around a 15 min walk, although there is not a strong consensus on how to measure the availability of green space throughout the EU [
11]. Therefore, public green spaces should be designed to be accessible to all inhabitants within a 15 min walk of their homes. A concept called the “15 min community life circle (15 min-CLC)” was established in China using Shanghai as an example. This suggests that residents should be able to access all urban infrastructure, including green spaces, within a 15 min walk [
12,
13,
14]. A guideline that is likewise based on the 15 min city’s concepts has been created by the C40 Cities Climate Leadership Group [
15]. During the COVID-19 lockdown, this strategy transformed into a “15 min city”, a “10 min city”, and a “5 min city” [
16,
17]. According to the Russian national standard [
18], residents living in medium- and high-rise (multi-storey) building areas should have access to green spaces within a 400 metre radius, while those living in low-rise building areas should have that same assurance within an 800 metre radius. This implies that green spaces should be accessible within a 5–10 min walking distance.
According to the “15 min city” idea, inhabitants should have access to green areas within a radius of 1000–1500 m of their homes, considering age-related variances in walking speed. The “10 min city” and “5 min city” concepts reduce this distance to approximately 800 and 400 m, respectively. This means that green spaces must be accessible in the same administrative municipal district where the residents live. Furthermore, choices on creating new urban infrastructure, including new green areas (gardens, parks, and forestry parks), are usually made at the district level. Thus, a study of green space availability at the administrative district level is relevant.
Worldwide, the number of research works related to urban green space availability has increased at both on the city and city-district levels (e.g., [
19,
20,
21,
22,
23,
24,
25]). However, there is a dearth of qualitative and quantitative information about the presence of green space in major (with a population of more than one million) and other Russian cities [
26,
27]. There are only a few works describing the greenery of the following Russian cities: Moscow [
28], Arkhangelsk [
29], Nadym [
30], and small towns in the Krasnodar region [
31]. The primary research on green spaces in Russian major cities focuses on the evaluation of the conditions and characteristics of the growth of woody vegetation in polluted urban environments [
32,
33,
34,
35]. For Ufa city as the object of this study, there is a lack of information about green space availability in local and foreign literature. However, such data will be interesting and useful for domestic and international readers because Ufa is the capital of the Republic of Bashkortostan, a millionaire city, one of the largest economic, scientific, and cultural centres of Russia and an important transport hub. Earlier in Ufa, a forestry inventory was carried out for green stands [
36,
37], and their recreational importance [
38] and stability under anthropogenic conditions [
39], were determined using both instrumental methods and terrestrial remote sensing data [
8]. Moreover, no work has been done to assess the availability of green space within a defined radius; this and the abovementioned statements explain the necessity/novelty of such kind of research. Therefore, the aim of this study was to conduct qualitative, quantitative, and spatial analyses of green space availability in the administrative districts of Ufa.
2. Materials and Methods
2.1. City Characteristics
The city of Ufa (54°43′34″ N, 55°56′51″ E) is located in the central part of Russia and lies on hills forming the Pribelskaya undulating plain to the west of the southern Ural Mountains. Ufa area has grown over the last decades, expanding its space and transforming transport communications.
Spatially, Ufa is a typical river-edge city, located along the Belaya and Ufa River floodplains on a narrow divide. Most mid-sized and large forest areas occupy the city’s periphery, entering floodplains and floodplain terraces.
The city of Ufa has significant environmental potential because the share of green spaces in the city’s total area is on average higher than in most Russian cities, with a population of over one million residents. Additionally, citizens receive ecosystem services in urban forests and beyond the city.
The natural forests of Ufa city are deciduous broad-leaved, large-grass forests. The primary forest species are European white birch, small-leaved linden, Scots pine, European oak, Norway maple, and poplars (black poplar and Eurasian aspen). There are common hazelnuts, cherry trees, winter creepers, and other species in the understory. The forests in Ufa are classified as protecting forests (urban forests) and forestry parks.
The city of Ufa was founded in 1574 and has a long history of development; therefore, there are many cultural heritage objects, including greenery, which are preserved nowadays [
40,
41]. Numerous of these locations serve as city landmarks (
https://www.tripadvisor.in/Attractions-g298518-Activities-oa0-Ufa_Republic_of_Bashkortostan_Volga_District.html (accessed on 9 June 2023)) and are regularly used by residents/guests/foreigners for leisure activities. For example,
Figure 1 shows, the Aksakov garden (Kirovsky district), which is a house in which the novelist Sergey Aksakov lived in his early years (late 18th century) or the square of Salavat Yulaev (local national hero and poet), which also has an eponymous monument. The “Garden of the sobriety society” (Sovetsky district) was founded in 1903, and in 1918, it received its current name in honour of Ivan Yakutov (revolutionary and the first chairman of the Ufa city council). Victory Park (Ordzhonikidzevsky district) is a garden and memorial complex dedicated to the Great Patriotic War, that was created in 1947 and has an area of 62 ha. One of the large objects (554 ha) in public green spaces is the Forest Park named after Foresters of Bashkortostan and covers two districts (116 ha of Sovetsky and 438 ha—Oktyabrsky district).
The city of Ufa covers an area of 70.8 thousand ha, the residential areas are 6.9 thousand ha, and the area allotted for residential development is 13.9 thousand ha. The city comprises seven administrative districts: Dyomsky in the southwest; Kalininsky (the largest by area) in the northeast; Kirovsky in the south; Leninsky in the west; Oktyabrsky in 2 parts, the first in the centre, the second part in the southwest; Sovetsky is the historical centre of the city (the smallest and most densely populated area); Ordzhonikidzevsky is an industrial district in the north-western part of the city (
Figure 2A). The green spaces of the Ufa cover are 25.2 thousand ha (i.e., 35.6% of the city’s territory) of which 20.8 thousand ha are forest estate lands, 0.7 thousand ha are stands outside the forestlands, and 3.7 ha are perennial plantations (
Figure 2B).
2.2. Method of Buffering Zones
The work was performed using the GIS project generated in QGIS software (ver. 3.16.10-Hannover,
https://qgis.org/en/site/ (accessed on 17 January 2023)) [
42,
43]. Different vector layers in the Universal Transverse Mercator coordinate system (EPSG:32640 WGS 84/UTM zone 40N) were constructed as part of a GIS project.
Vector layers with boundaries of the Ufa and its administrative districts and water objects were created using OpenStreetMap materials (
https://www.openstreetmap.org/ (accessed on 17 January 2023)). Existing and planned public green spaces were created as vector objects based on data from current regulatory documents [
44]. Other protecting stands were derived from the Global Land Cover Dataset of ESRI 2020 as a 10-class Global Land Use and Land Cover (LULC) map for 2020 at a resolution of 10 metres (
https://lulctimeseries.blob.core.windows.net/lulctimeseriespublic/lc2020/40U_20200101-20210101.tif (accessed on 17 January 2023)). According to the developers, the classes are based on the core data model of deep learning, using six ranges of Sentinel-2 surface reflection data: visible blue, green, red, near-infrared, and two shortwave infrared bands [
45,
46]. The model was launched on multiple imaging survey dates throughout the year, and the results were combined into a final representative map for 2020. The dataset was created by the Impact Observatory for ESRI and is based on a dataset built for the Dynamic World Project by the National Geographic Society in collaboration with Google and the World Resources Institute (
https://tiledimageservices.arcgis.com/P3ePLMYs2RVChkJx/arcgis/rest/services/Esri_2020_Land_Cover_V2/ImageServer (accessed on 17 January 2023)).
Based on this matrix dataset, data concerning the territory of the Ufa and its suburbs were selected. Class 2 “Trees” were selected, meaning any significant concentration of dense vegetation (15 m and above), typically with a closed or dense canopy. This class was later converted to a vector layer from which objects coincident with existing and planned public-use green areas were excluded. Therefore, we called the resulting layer with forest stands as “other protecting stands”. Since the initial material has a spatial resolution of 10 m, these stands are at least 100 m2 in size.
Residential areas have been digitised as polygonal vector layers based on a map of Ufa city planning zones [
47]. To evaluate the availability of green spaces, three different categories of residential areas have been defined. The whole residential area of Ufa was evaluated for availability within a 15 min walk. According to the Town Planning Code of Russia [
48], these areas covered all varieties of residential neighbourhoods. The following areas were included within the many(multi)-storied housing estate area: residential blocks with primarily high-rise buildings (nine stories or more) and blocks with medium-rise buildings (five-story apartment buildings, often called to as “Khrushchyovka”s). Homes of four stories or less reflect low-rise residential areas. Additionally, urban blocks with individual dwelling construction and blocked housing estates were included. The construction of individual dwellings involves the placement of low-rise individual homes (up to three stories) with a backyard for the occupancy of one family. A block housing project involves the establishment of a residential building (up to three stories) that shares one or more walls with nearby residential buildings. The total number of combined dwellings (blocks) may not exceed ten, each of which is designated for the habitation of one family.
For a vector layer that exclusively comprises multi-storeyed housing areas, hereinafter referred to as “multi-storey building areas”, an estimation of the availability of green spaces within a 400 m radius was generated. A vector layer including solely low-rise housing areas (up to 4 stories inclusive), hereby referred to as “low-rise building areas”, was used to estimate the availability of green spaces within an 800-metre radius.
The residents’ age and gender variations, the kind of ground surface, and the season all affect how quickly people walk [
49,
50,
51,
52,
53,
54]. The typical walking speed is regarded as 5 km/h (~1.38 m/s). The distance to accessible green spaces within a 15 min walk radius was calculated as 1250 m based on the average walking speed of residents. According to the following regulation [
18] determining the availability of green spaces for residents of areas with multi-story buildings (400 m) and low-rise buildings (800 m) when walking 5 and 10 min to green spaces at this average speed. On the fringes of the city, residents may leave the city limits and stroll to green spaces (in 15 min or less) that are not a part of the urban greenery. Therefore, green areas at a distance of 1250 m from the city edge were added to evaluate the accessibility of urban green space.
The following operations were performed to analyse the presence of green spaces in a defined radius compared with residential areas. A layer of “regular points” with a spacing between points of 50 m was developed for a polygon layer of residential areas using research tools in the programme function “Vector”. The points covered the city area in both the “west–east” and “north–south” directions with an equal distance of 50 m between the points. A total of 681,738 points made up this layer, of which 55,357 points corresponded to Ufa’s residential area. Buffer zones with a radius of 1250 m have been defined around each point. In buffer zones, existing public green spaces were first analysed, followed by planned green spaces, and finally the presence of other protected areas. The multi-story building areas had 21,851 points, while the low-rise building areas had 228 points; buffers within a 400 m and 800 m radius were built around them. Existing and planned public green areas were analysed within the buffer zones.
2.3. A Road-Based Network Analysis
The existing roads and footpaths within Ufa boundaries were downloaded from OpenStreetMap and imported into the GIS project. Additionally, from vector polygons representing the public green spaces, vertices were extracted as a point vector layer. Isochrones for the vertices were constructed using the “Iso-Area as Polygons (from Layer)” tool based on the road network (see for details:
https://root676.github.io/IsoAreaAlgs.html (accessed on 15 March 2023)). This tool generates a Triangulated Irregular Network (TIN) interpolation of a point vector layer. The TIN interpolation method creates a surface formed by triangles of nearest neighbour points. Because of TIN interpolation, isochrones are produced with inaccuracies if all vertices are specified at once. Therefore, isochrones were constructed independently for compact groups. Furthermore, isochrones were superimposed on the layer “residential areas” that had previously been created (for calculation using the method of buffering zones). The “zone of 15 min (1250 m) accessibility from public green places on the road network” was established using the tool “Join Attributes by Locations”, which allowed us to add characteristics to the layer “residential area with roads”. Similar calculations were made to determine the walking accessibility based on other existing green spaces as well as planned public green spaces.
2.4. Assessment of Fragmented Green Spaces
Estimates of green space fragmentation were made for all of the green spaces that were designated on the original map (LULC map). Class 2 “Trees” was chosen, which included all public green areas, both existing and planned, without distinction into parks, squares, etc. After determining how all of the greenery in the city is fragmented, the area of green spaces was measured taking into account the area of individual fragments (5 categories: 0.01–1, 1.1–10, 10–100, 100–1000, and 1000–5000 ha). The availability of green spaces was calculated only for fragments greater than 1 ha; smaller fragments were not taken into account. For each fragment greater than 1 ha, vertex coordinates were found. The “15 min walking distance (1250 m) from green spaces on the road network, considering the fragmentation of green spaces” was calculated using these vertexes.
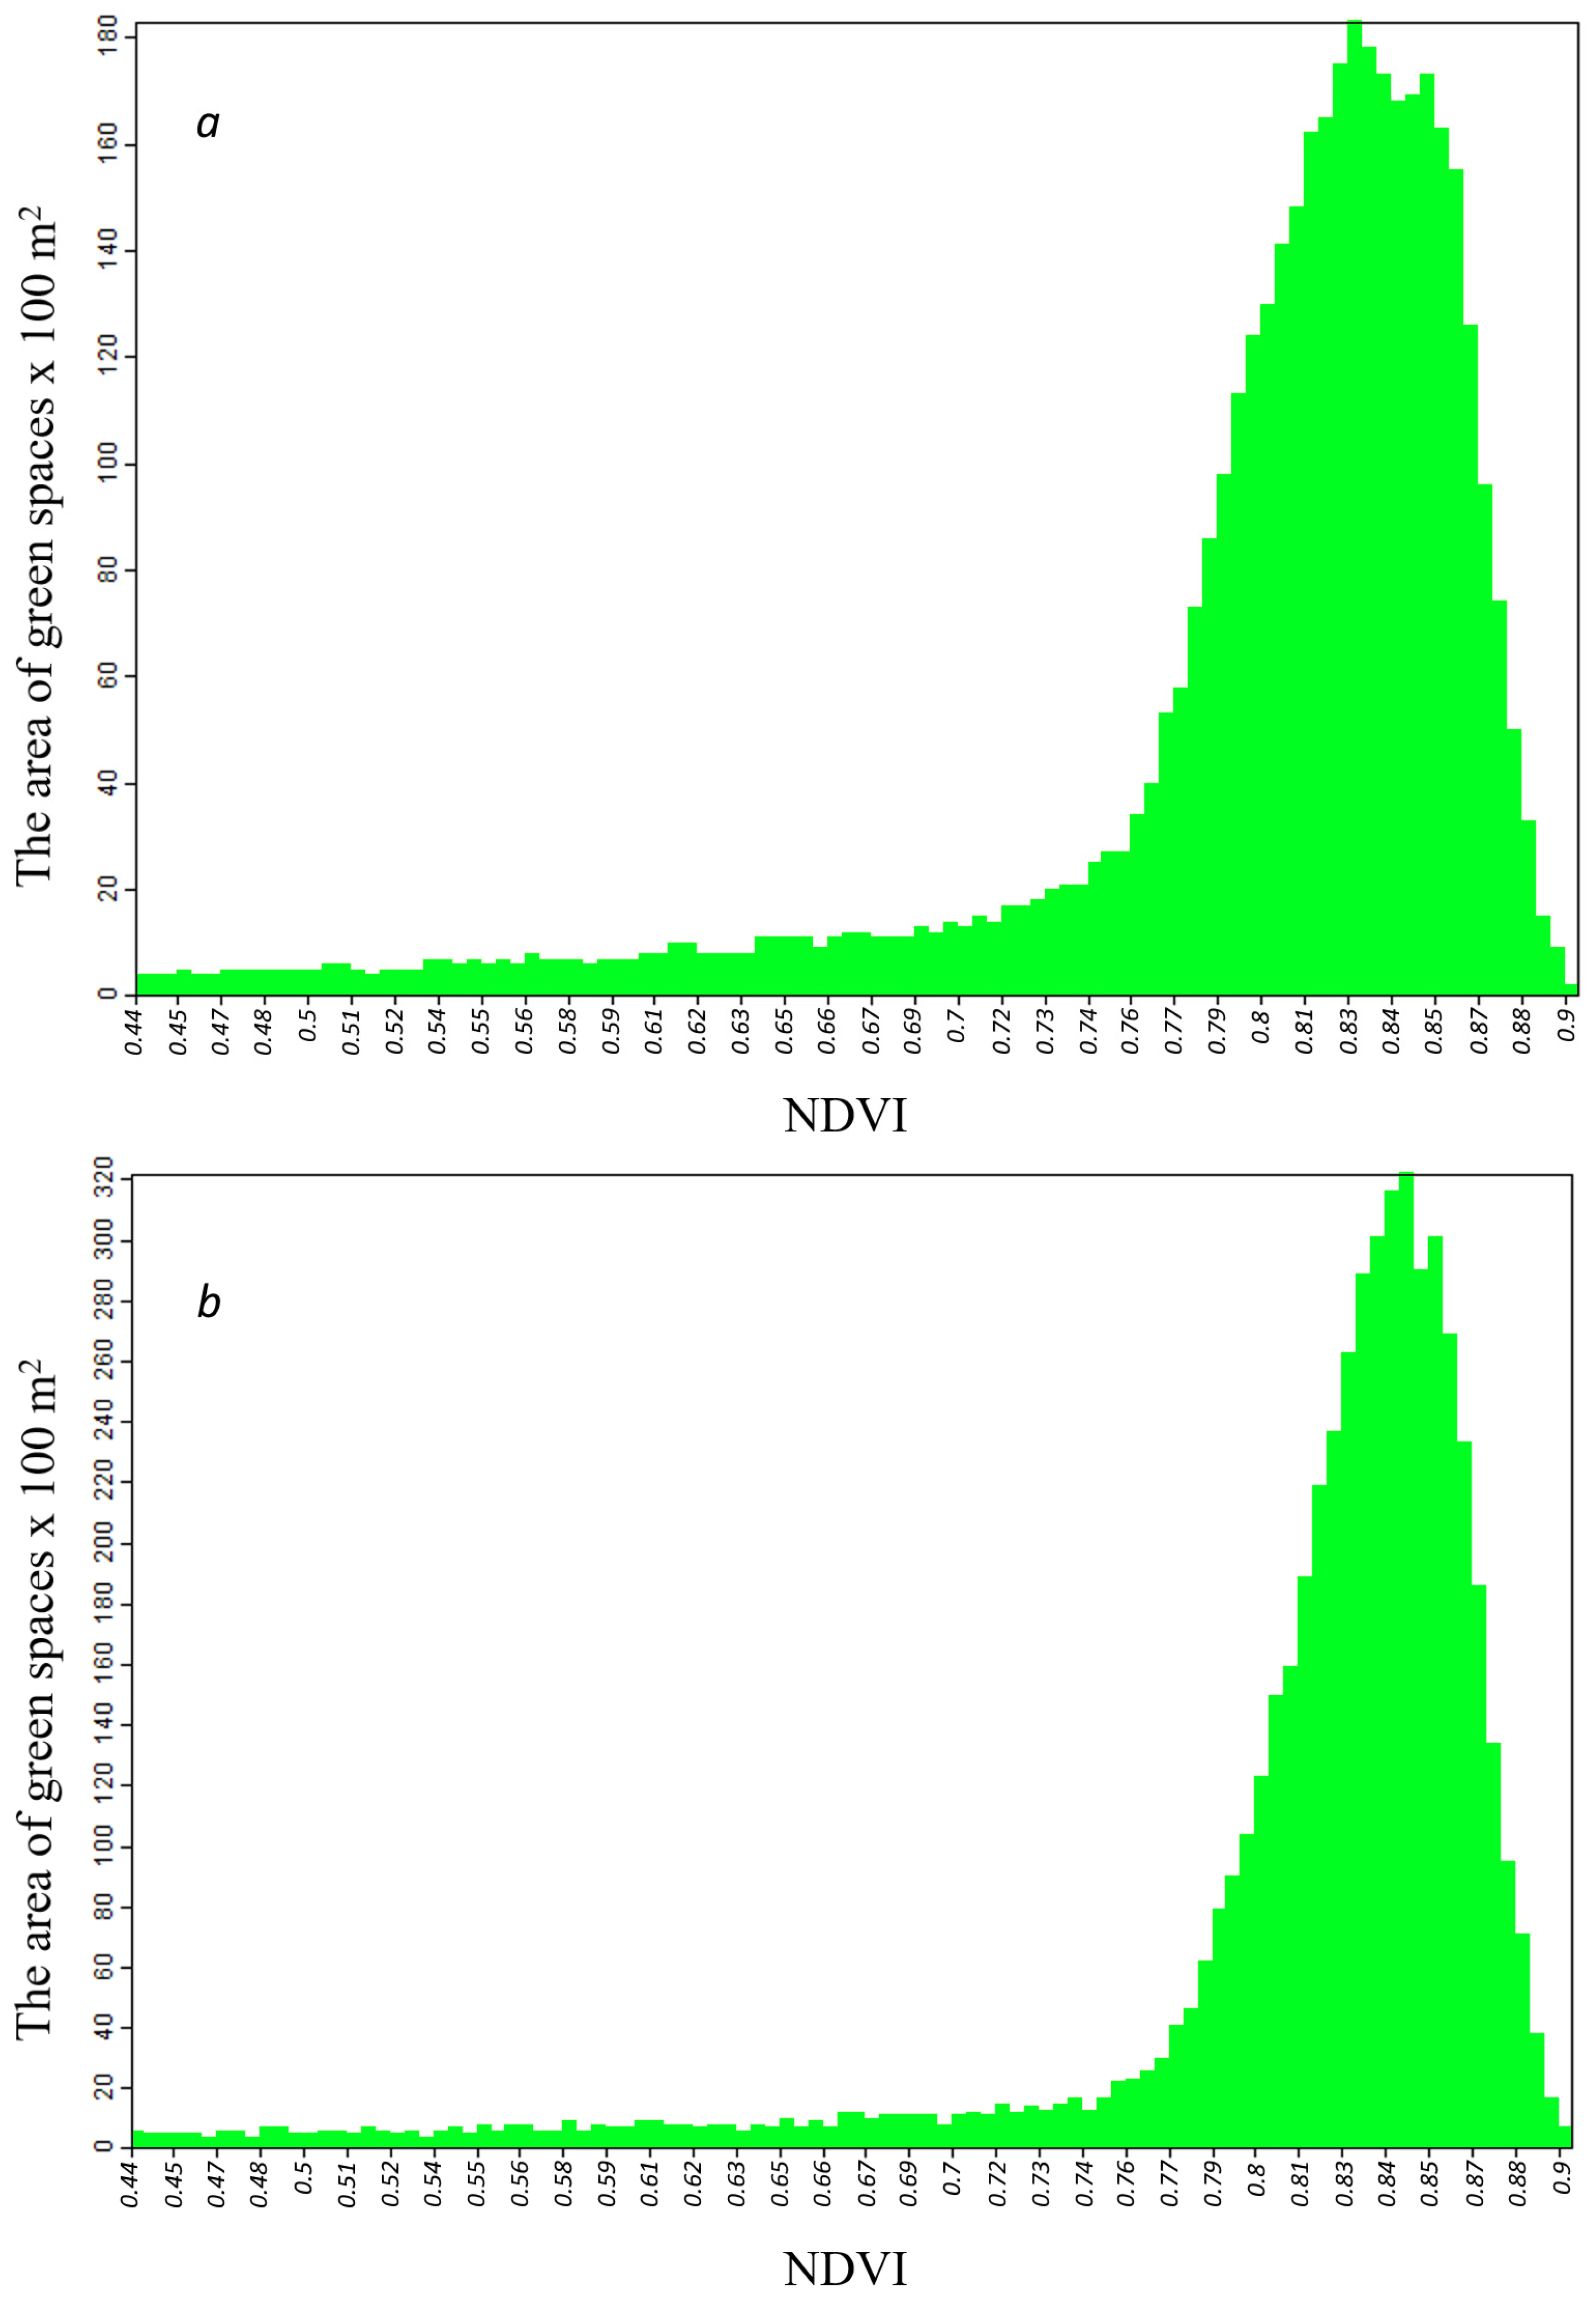
2.5. Evaluating the Quality of Green Space
The Sentinel-2 mission’s multispectral image (the European Space Agency) was used to estimate the NDVI (normalized difference vegetation index) for evaluating the quality of the green areas (for all types of green spaces as follows: existing public green spaces, planned public green spaces, and other existing green spaces). The satellite image was made as part of the Copernicus Global Environmental and Safety Monitoring project (the data are available at:
https://scihub.copernicus.eu/dhus/ (accessed on 15 March 2023)). The image was shot on 3 August 2021, with a cloud cover of 2.8%, over the surveyed area—mostly cloudless (snapshot ID: S2A_MSIL2A_20210803T072621_N0301_R049_T40UDF_20210803T103255). The image is processed at the 2A level and contains radiometric, geometric, and atmospheric corrections. NDVI was calculated using the following formula (Equation (1)):
where NIR denotes the near-infrared spectrum, RED—visible red-light. These channels are designated as Sentinel 2 channels B08 and B04, respectively.
The resulting raster is cropped separately for public green spaces, planned public green spaces, and other green spaces. The SAGA GIS tool (System for Automated Geoscientific Analyses ver. 7.9.1,
http://www.saga-gis.org (accessed on 12 March 2023)) was used for creating digital greenery maps and analysing the data. Statistical data for each raster were acquired using the tool “Save Grid Statistics to Table” and a histogram of NDVI value distribution was constructed using the tool “Histogram”.
2.6. Finding Key Indicators for Major Russian Cities
Open sources were used to compile key metrics defining Russia’s major cities (
Table S1). The data were taken from the Unified Interdepartmental Statistical Information System (
https://rosstat.gov.ru/emiss (accessed on 20 February 2023)), a repository for official statistical data, assembled by government statistical entities. As part of the creation of the Russian Federation’s Open Data Portal (
https://data.gov.ru/frontpage?language=en (accessed on 20 February 2023)), these statistics were gathered by the Federal State Statistics Service and then made public by the Russian Federation’s Ministry of Digital Development, Communications, and Mass Media. The following metrics were used: population size, total urban land area, number of stationary sources of air pollution, and volume of dangerous compounds released by motor vehicles into the air.
The Federal Service for Supervision of Natural Resources’ data, section “information on air protection” (
https://rpn.gov.ru/open-service/analytic-data/statistic-reports/air-protect/ (accessed on 20 February 2023)), provided information on pollutant emissions to the air from stationary sources including total emissions and the volume of emissions for specific compounds. Additionally, information was collected from the State Report “On the State of Natural Resources and Environment of the Republic of Bashkortostan” [
55].
For comparison, the findings of research by the company “TerraTech” [
56], which evaluated the level of greening (percentage of green space by area) in major cities in Russia, were used. The Kanopus-B satellite series, owned by the Russian state-owned satellite constellation, provided the data for this study. The limits of the areas with the densest residential areas, where most people live and spend their time, were used to determine the size of each city’s green space. The borders of the densest residential areas were expertly identified (specific boundary definition criteria are not provided). Areas of at least 0.01 ha with tree stands (parks and squares), as well as relatively large courtyard tree clusters, were discovered using a neural network based on space images with a resolution of 2 m per pixel. The total area of green space and its proportion in each city’s densest residential areas were estimated.
4. Discussion
Estimating the number of green stands involves rationing these. The London Department for Communities and Local Government has set a standard of 40% green infrastructure as a percentage of the city’s total land [
58,
61]. However, the notion of green infrastructure goes beyond green spaces. For instance, according to the European Commission for Environmental Protection, green infrastructure is a strategic network of natural and “seminatural” complexes combined with all environmental features capable of delivering a wide range of ecosystem services. Its components include territories within protected areas and their buffers, sustainable ecosystems beyond protected areas, natural complexes able to serve as ecological corridors, restored habitats, artificial transitions, urban landscaping features (parks, green walls and roofs, watertight sidewalks), and aquatic areas to help sustain priority ecosystems [
62].
In Russia until 2016, there was a rule that set the norm of green spaces for various purposes at least 40% within the boundaries of urban development and not less than 25% within the limits of the residential sector [
63]. These recommendations are not included in the updated version of the standard [
59]. In Russia, the area of public green spaces is regulated legislatively. Thus, for the largest and large cities, this area should be at least 10 m
2 per person, and in the residential areas of those cities, it should be at least 6 m
2. Large forest parks equal to or greater than 0.5 km in width must represent at least 10% of the public green space. In addition, public green spaces must be designed and equipped with small architectural forms such as fountains and pools, stairs, ramps, retaining walls, pavilions, and lamps [
59]. It should be noted that in general Russia is the largest forested (56 m
2 per capita) country in the world; thus, the initial conditions of existing or future city greenery were/will be favourable.
The World Health Organization recommends the minimum availability of green space per inhabitant to −9 m
2 per person and the ideal −50 m
2 per person [
9]. Each city resident should have a green space within a 15 min walk [
60,
61]. The 15 min walking distance to green areas has also been defined as an indicator of urban environmental quality at the European level. In most European cities, over half of the population has access to green spaces following this criterion [
64].
In parallel, European cities have standards for providing and making green spaces accessible. For example, in Germany: in Berlin, it is −6 m
2, in Leipzig, it is −10 m
2 per person. The Senate Department for Urban Development and Environment (Berlin) recommends that every resident should have access to a green area of at least 0.5 ha at a distance of 500 m [
65]. The Dutch project “Guide to the Green City” recommends that each household is less than 500 m from the green area [
66]. In the Belgian city of Ghent, each resident must have a public green area of at least 10 m
2 less than 400 m from the house [
67]. In the United Kingdom, criteria relating to the size and distance of public green spaces have been established regarding their attraction to residents and biodiversity conservation. Based on the established criteria, no one resident should live over 300 m from the nearest natural green area of at least 2 ha; less than 2 km from the house, there should be at least one approachable area of 20 ha of green space; within 5 km, there should be an accessible area of 100 ha; within a 10 km radius, there should be an accessible area of 500 ha. Local protected areas should also be at least 1 ha per 1000 inhabitants [
68,
69,
70]. The amount of public green space that residents wish to visit regularly should be at least 2 ha. These small green spaces can be more attractive if they are connected through walkways [
71].
In Russia, following existing law, urban residents should have access to green spaces, considering the number of stories of urban development. Analysis of the structure of urban land has shown that 35% of Ufa’s territory comprises green areas. The calculated 35.5% of Ufa City’s total area that is made up of green space is broadly comparable with another study [
56]. These statistics show that Ufa is one of the greenest Russian millionaire-cities, with green space making up 30.9% of the densest residential areas. Only the cities of Perm (where green space makes up 35.9% of the urban area) and Yekaterinburg (with an index of 31.0%) are somewhat superior to Ufa in this parameter [
72]. The details of estimating the extent of the city may be used to explain why our data and the “TerraTech” survey data differ (35.5% versus 30.9%). The Dyomsky district, which makes up approximately 8% of the city’s total size, and several comparatively significant urban microdistricts (Zaton, Shaksha, and others) that are located relatively distant from the city’s centre territory were excluded from the “TerraTech” research, which only considered the densest residential areas.
In Ufa, three sizable refineries have been built and are now in operation: the Ufa oil refinery in 1937, the Novo-Ufa oil refinery in 1951, and the Ufa oil refinery named after the XXII Congress in 1954. Refineries had to be built because of the 1930s Volga-Urals oil field’s discovery of sizable oil reserves near the city of Ishimbay (~150 km from Ufa) [
73]. These enterprises have an annual raw material processing capability of up to 23.5 million tonnes of oil [
74]. A huge number of pollutants are released into the city’s atmosphere because of extensive oil refining. The city of Ufa ranks the top among Russian cities’ millionaires in terms of emissions from stationary sources (
Table S1). Ufa also ranked top in terms of emissions per stationary source and emissions per unit area of the city (per densest residential area). Three refineries produce 76.9% of all air emissions from stationary sources in the city of Ufa [
55]. Sulphur dioxide (33,466 tonnes, 24.5% of all emissions) and volatile organic compounds (70,995 tonnes, 51.9% of all emissions) account for most air emissions [
75].
The green spaces in the city of Ufa are negatively impacted by considerable toxicant emissions. Most urban tree plantings are currently in a depressed state. Deciduous green plantations, particularly poplar [
76], birch [
77], and linden stands [
78], are the most depressed. According to estimates, the condition of coniferous trees in the city is likewise generally poor [
79].
The walking accessibility of green spaces varies significantly in large cities. Residents do not have sufficient access to green spaces, according to studies conducted in major Chinese cities, including Shanghai [
80], Beijing [
81], Hangzhou [
82], Shenzhen [
83], and Wuhan [
84]. According to a 2011 study of 7036 participants in 148 cities across 30 provinces of China, 47.45% of urban residents resided within 500 m and 77.28% within 1 km of green spaces [
20]. For ten urbanised areas in the US, an unbalanced spatial distribution of green spaces and their asymmetric distribution has been determined [
85]. Only a tiny percentage of residents had extremely high levels of access to green spaces, and the unequal distribution of these areas was mostly related to conventional socioeconomic divisions. A study based on The Trust for Public Land’s [
86] data also uncovered significant disparities in the quality and accessibility of urban park systems in 99 of the top 100 most populated US cities. The socioeconomic status and ethnic composition of cities are the key factors influencing these discrepancies [
87].
The availability of green spaces for urban residents is inconsistent, according to a meta-analysis of 299 EU cities’ green areas [
19]. Low forest cover and the history of these towns may both be used to explain why southern European cities have a lower than average availability of green space. Due to the significant amount of wooded land and Northern Europeans’ positive attitude towards urban living, which appreciated the presence of trees nearby, the availability of green space in Northern European cities was higher than usual. Historical disparities in green space accessibility, such as those found in post-socialist cities, are more closely associated with highly segregated regions with concentrations of urban poor and new upscale housing construction [
88]. Additionally, urban expansion decreases the availability of green space since it is linked to the destruction of vegetation brought on by new construction [
21]. Such deforestation could lead to the development of soil degradation processes. For example, research conducted in Ufimsky district (adjacent to Ufa city) showed that only forested areas protect soil from erosion (runoff and soil loss), regardless of intensive rainfall or snowmelt [
89].
Is it feasible to design a 15 min city where all urban infrastructure, including green areas, is accessible to all citizen groups [
90] regardless of where they live in the city? For the most part, local officials should not have too much trouble creating “new” infrastructure. It is possible to build new retails, transportation hubs, and other municipal infrastructure without drastically altering the urban layout of a specific city area. However, several issues make it difficult to create additional green spaces in cities. The first requirement for creating green spaces is the availability of sizable areas free of urban development. This is a serious restriction since urban land is expensive. Second, due to the lengthy growth of trees [
91], it takes a while to create green spaces. The abundance of green spaces and their accessibility to urban residents are also greatly influenced by the city’s location, its proximity to a particular type of terrestrial ecosystem and relief. The dispersion of urban development and the urban environment’s structure, as well as the city’s history, are all equally crucial factors.
In comparative studies on urban greening and the availability of green spaces, the following research limitations should be taken into account. This is a potential change of regulatory laws, city boundaries, the evolution of buildings (construction/demolition), and greenery (aging, cutting down, and planting), using (and its availability) data (city documentation, remote sensing data (RSD), etc) and software. For example, the limitations related to software. Many GIS programmes are utilised in scientific research and are available as both freeware and commercial software [
92]. For our study, we used GIS (QGIS software, ver. 3.16.10-Hannover) that was available under an open-source licence. Algorithms and procedures for creating a GIS project will vary when using programmes other than those we use. The usage of open access maps and documents is an extra limitation. Finding publicly accessible urban planning materials is a limitation in this instance. Regional limits on the placement of material in open access (legislative restrictions [
93]) may be a limitation for the city of Ufa and the country as a whole (the other Russian cities). We based the findings on publicly available urban planning materials. Language features also limit the options for exploring and utilising documents (finding information and translating it from Russian to English).
The limitations related to RSD. The seasons (autumn–winter and spring–summer) are the main limitation in this situation. The summer season (June–August), when green space growth is at its peak, is the only time when satellite images that may be utilised for analysis should be taken. Furthermore, satellite photos with the least amount of cloud cover must be chosen, which limits the search for usable space data for analysis. Another limitation factor is availability (open access) and quality/resolution of RSD; most probably that use of unmanned aerial vehicles (UAV) and special tool scanning (e.g., LiDAR) could provide a rapid/actual data acquisition with high quality. However, in this case, the size of the analysed city/area could be faced as an extra limitation.
Most green spaces in Ufa are in suburban areas. The sufficiency of residents with all types of green spaces, both in the city and in administrative districts, complies with existing standards. However, it is worth noting that the availability of public green spaces in some districts of the city is below the standard of 10 m2 per person. In most cases, residents cannot access public green spaces within 400 m of multi-story residential areas and low-rise residential areas within 800 m. If all green areas are considered, accessibility is guaranteed within a 15 min walk. However, in reality, some of the available green areas may have natural or artificial barriers or limited usage. Consequently, further research should focus on assessing the true availability of green spaces for urban residents.
5. Conclusions
If we consider all the greenery of the city, including not only forests, forest parks, gardens, and squares but also interdistrict stands, limited use, and for special purposes, situated in the territories of hospitals, schools, industrial companies, allotments and backyards, as well as the territory of sanitary and protective areas, graveyards, and tree nurseries, then the city of Ufa is rightfully regarded as one of the greenest cities in Russia. Greenery occupies approximately 35% of the city area, but most of it is located outside the city centre. Less than 5% of the land is a public green space and is unequally distributed among the city’s administrative districts. Taking into consideration the road and pathway network as well as the fragmented greenery, the inhabitants of 14.1% of Ufa’s residential areas have no access to green spaces (greater than one ha) within a 15 min walk. Recreation facilities are primarily located in the downtown area.
Municipalities must consider the existence of green spaces while developing urban infrastructure and building new residential neighbourhoods. Ideal city planning—when any area allotting for creating green spaces, construction of infrastructure, and residential areas is considered complex. In Ufa city, land-use planning documents show that additional public green space is being envisaged in the northeastern, southern, southwestern, and western parts of the city.
Cities are changing continually, new residential areas are being created (in some cases old areas/buildings are abandoned/demolished), and new green spaces need to be designed, old—renovated. Laws, regulations, and standards for urban and landscape planning are also evolving. Therefore, the monitoring of green space availability in cities and policy issues related to it are needed.
Thus, the qualitative, quantitative, and spatial indicators of urban greenery considered not only provide a mean characterisation of the city’s greenness, which is generally optimistic, but also deepen the study of the structure of green spaces and identify places where there are not enough green spaces and where activities are required to create green spaces.

 ,
, 


