Abstract
Anthropogenic activities have drastically increased nitrogen (N) deposition, resulting in increased N availability. The continuous increase of N availability may exacerbate phosphorus (P) deficiency, which would limit forest productivity in subtropical forests. Effects of long-time N and N + P additions on SOC turnover in subtropical forests is therefore crucial for understanding the global carbon (C) cycle. The argument of whether N and N + P addition accelerates or slows SOC turnover has been under debate, particularly in P-limited subtropical forests. This study mainly aims to confirm this argument. A ten-year field experiment was conducted in a subtropical evergreen broad-leaved forest in southern Anhui, China. We measured the soil δ13CSOC contents and physicochemical properties under N (100 kg N·ha−1·a−1), N + P (100 kg N ha−1·a−1 + 50 kg P ha−1·a−1) additions, and the control (CK, no N and P additions). We also estimated the β value, which represents the soil organic carbon (SOC) turnover rate, from the slope of the regression between the log10-transformed SOC content and δ13CSOC in soil depth profiles. Our findings revealed that N addition significantly affected soil δ13CSOC compared to CK on both mid-slope and flat ridge sites. The β values responded differently to various treatments and sites. On the mid-slope, the β values did not show significant change with N and N + P additions. On the flat ridge, however, the β value decreased significantly in N and N + P additions, implying an increased SOC turnover rate. In addition, analysis of soil C–N–P stoichiometric ratios and physicochemical properties showed that N and N + P additions could affect β values by modifying soil nutrient content and composition. In general, our findings indicate that N and N + P additions could accelerate the SOC turnover in subtropical forest ecosystems, albeit with close dependence on site-specific factors.
1. Introduction
Nitrogen (N) is increasingly deposited from the atmosphere to soils worldwide as a result of fossil fuel combustion and fertilizer application [1,2]. By increasing the N availability, intense N deposition may exacerbate phosphorus (P) deficiency, especially in the subtropical regions, and the close association of P with Fe and Al oxides exacerbates the stoichiometric nutrient imbalance in highly weathered soil [3,4], which contributes to low total P content and availability [5,6,7]. Previous studies investigating the combined effects of N enrichment and P additions have indicated that the limitation of P is expected to become more severe under continued or increasing N deposition [8]. Meanwhile, this process may affect soil organic carbon (SOC) turnover by changing the soil physicochemical properties. SOC plays a significant role in global C cycling in the Earth system [9]; thus, changes in SOC have the potential to impact C balance and cycling in terrestrial ecosystems.
SOC turnover has emerged as a significant source of uncertainty in estimating the potential for carbon sequestration in forest soils. SOC exhibits characteristics, including large scales, lengthy cycles, and large spatial heterogeneity, making it challenging to detect statistical changes in a short time [10,11]. Currently, P and its interaction with N in SOC dynamics are poorly understood [12]. The continuous influx of reactive N has significant influenced soil substrates, microbial biomass, composition, and enzyme activity, all of which can impact the rate of SOC decomposition [13,14]. Previous studies have demonstrated diverse effects of N addition on SOC stocks, ranging from positive to negative, or neutral consequences, depending on the dynamic balance between C inputs and outputs across sites [15]. It has been discovered that P fertilization has a negative impact on SOC stocks due to a decrease in the efficiency of microbial C consumption [16]. Additionally, P fertilization inhibits the activity of the enzymes necessary for the labile-C processing in alpine grassland environment [17] and induces secondary N-limitation in plant growth in tropical forests [5]. Consequently, P addition affects SOC stock and interacts with N addition to affect SOC stock. Therefore, it is crucial to clarify SOC turnover and its association with soil nutrient composition within the context of N and N + P additions. This knowledge is essential for comprehending SOC dynamics and evaluating the C balance in subtropical forest ecosystems in the context of global climate change.
Evaluating the effect of N and N + P additions on SOC turnover in the field is a challenge. The traditional method involves collecting field soils for laboratory incubation; however, it is challenging to accurately simulate the field environment [18]. In addition, the 13C natural abundance (δ13CSOC) provides relatively nondisruptive insights in SOC turnover rate at the long-term scale [19,20], which could be used as an indicator of SOC dynamics. C isotope fractionation occurs during soil organic matter (SOM) decomposition. Respired CO2 indicates that 13C is being depleted, and a change in the ratio of 13C to 12C implies a shift in the dynamics of C storage [21]. During exchanges in the vegetation–soil–atmosphere cycle, the C isotopic composition of organic and inorganic compounds changes, leaving isotopic imprints on plant, soil, and atmospheric C pools and fluxes [22]. The changes of δ13CSOC with soil depth could reveal more important information on SOC turnover compared with the simple elemental concentration analysis.
Many studies have shown that the slope of the linear regression (β) between the log-transformed SOC content and δ13CSOC values in the soil profile has been verified as an indicator for the SOC turnover rate [23,24,25], which indicates that the faster SOC turnover, the lower the β values. Furthermore, the validity of β value has been confirmed through laboratory analyses of SOC decomposition [26], C isotope mass balance modeling, and meta-analysis of the relevant literature [24]. The complex interactions among climatic, edaphic, and biotic variables, which also affect the depth of soil 13C, govern SOC dynamics. Each δ13C depth profile signifies distinct dynamic processes, and such analysis may uncover some significant changes that are not discernible through elemental concentration analyses alone [27].
A few studies have been conducted on soil 13C natural abundance under N and N + P additions. According to Neff et al. [28], N addition accelerated the decomposition of soil’s light C fractions while stabilizing its heavier and mineral-associated C fractions. Fang et al. [29] demonstrated that the impact of N deposition on SOC decomposition could be altered by the addition of P, which was connected to variations in microbial variables and substrate quality. In the presence of increasing N deposition, P availability may promote increased C accumulation. Comparable to N deposition, P addition in P-limited forest soils may cause microorganisms to prioritize the breakdown of labile organic matter over complex organic matter [30]. Through increasing the decomposition of labile C with 13C-depleted signals, this mechanism may lead to an increase in 13C. Therefore, it is largely unknown how the coupling effect of P and N additions affects 13C abundance in SOC in subtropical forest ecosystems.
The subtropical region of China is distinguished by high vegetation coverage across a wide range of latitudes, which is a strong C sink compared to other regions of the world [31]. In this study, we mainly aimed to confirm how long-term N and N + P additions affect SOC turnover in P-limited subtropical forests. For this purpose, we examined SOC and δ13CSOC along a soil profile (0–40 cm), as well as the physicochemical characteristics of the soil, under N and N + P addition treatments at two sites in a mature subtropical forest. Moreover, the variations in δ13CSOC and β values, and their controlling factors were analyzed. We hypothesized that (1) N and N + P additions enhance the pattern that δ13CSOC increases with increasing soil depth, but have no effect on SOC content across the soil profile; (2) There is no effect of N addition on total N, but N + P addition increases total P and soil P use efficiency; (3) N and N + P additions affect soil physicochemical properties and influence SOC turnover by modifying the structure of soil N fraction and P availability.
2. Materials and Methods
2.1. Study Site and Experimental Design
This study was conducted in a natural secondary forest in Zawan Natural Reserve (29°37′05″ N, 117°32′30″ E) in southern Anhui Province, East China (Figure 1). The mean annual temperature (MAT) is 16.6 °C and the mean annual precipitation (MAP) is 1750 mm. The altitude of the study site ranged between 100 and 700 m a.s.l. The soil type is reddish yellow soil, which is classified as Haplic Luvisols according to the Food and Agriculture Organization (FAO) classification [32]. The dominant vegetation type in this natural reserve is evergreen broadleaf forest with the dominant tree species of Castanopsis eyrie (Champ. ex Benth.) Tutcher, Castanopsis sclerophylla (Lindl.) Schottky, Cyclobalanopsis glauca Thunb., Castanea henryi (Skan) Rehder & E. H. Wilson, and the dominant shrub species of Machilus thunbergia Sieb. et Zucc., Symplocos stellaris Brand, Loropetalum chinensis (R. Br.) Oliv., Camellia cuspidate (Kochs) H. J. Veitch Gard. Chron. and Eurya japonica Thunberg. The soil properties and environmental factors of different sites are shown in Table 1.
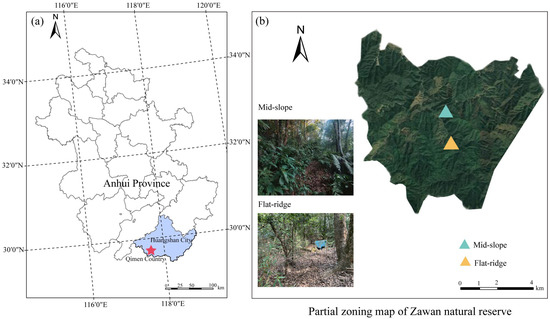
Figure 1.
Location of the study area. Location map of the study area (a) and satellite map of partial zoning of Zawan Natural Reserve and distribution of study areas (b).

Table 1.
The basic conditions of the study sites.
The N and N + P addition experiment began in July 2010. The two sites are located approximately 1.5 km apart on a mid-slope and flat ridge. A randomized block design was used with 3 treatments at each site: N addition (N, 100 kg N·ha−1·yr−1), N + P addition (N + P, 100 kg N·ha−1·yr−1 + 50 kg P·ha−1·yr−1), and the control (CK, no N and P addition). There were three replicate plots of 30 m × 15 m for each treatment, with a buffer zone of at least 10 m between plots. Ammonium nitrate (NH4NO3) was used as the N source, and calcium superphosphate (Ca(H2PO4)2) as the P source. Fertilizers were divided into three equal parts and evenly distributed across the surface of each plot in May, July, and September of the growing season of each year.
2.2. Soil Sampling
In October 2020, we collected soil samples randomly at four depths (0–10, 10–20, 20–30, and 30–40 cm) from each plot. Three replicates for each plot, and a total of 216 soil samples (18 plots × 4 soil layers × 3 replicates) were collected. Each soil sample was sieved through a 2 mm mesh to remove coarse sand and plant materials. One portion was stored at 4 °C and used for subsequent analysis of soil moisture, soil microbial biomass carbon (MBC) and nitrogen (MBN), dissolved organic carbon (DOC) and nitrogen (DON), NO3−-N, NH4+-N; the other portion was air-dried and used for the analysis of SOC, total N (TN), total P (TP), particulate organic carbon (POC) and nitrogen (PON), δ13CSOC, and other physical properties.
2.3. Laboratory Analysis
Following the sieving and homogenizing of soil samples, pH was measured using a pH meter (pH 510, Alalis, Shanghai, China) with a 1: 2.5(w/v) soil–water suspension. The soil water content (SWC) was determined by oven-drying 30 g of fresh soil sample at 105 °C for 24 h. SOC and TN content were analyzed using an elemental analyzer (EA3000, Vector, Italy). Soil TP was determined using micro-Kjeldahl digestion (HNO3: HClO4 at 3:1), and a continuous flow injection analyzer (Alliance Futura, France) was used to analyze TP. Soil NH4+-N and NO3−-N were extracted with 30 g of fresh soil with 50 mL 1 M KCl solution and their concentrations were measured using a continuous flow injection analyzer.
Chloroform fumigation extraction was used to extract MBC and MBN [33]. A subsample of 30 g sieved fresh soil was fumigated with CHCl3 for 48 h at 25 °C in the dark. After removal of the fumigant, both fumigated and unfumigated soils were extracted with 50 mL of 1 M K2SO4 and filtered with the 0.45 μm Whatman glass fiber filters. A TOC/TN analyzer (Multi N/C 3100, Analytik Jena, Germany) was used to determine the concentrations of DOC and DON in the extracts. MBC and MBN were calculated from the difference between the fumigated and unfumigated samples, and a KEC of 0.45 [33] and KEN of 0.54 [34], respectively, were used to account for the extraction efficiency.
A modified wet sieving method was used to fractionate the soil [35]. A total of 10 g air-dried soil was added to a 30 mL plastic bottle with 5 g·L−1 sodium hexametaphosphate solution as dispersant. The bottles were placed on a shaker for 18 h. Slurries of the bottle were transferred and filtered through 0.053 mm steel sieve. Meanwhile, continuous and steady deionized water was flowing through the sieve to facilitate the dispersion of the organic matter protected in aggregates. All fractions were dried in an oven at 60 °C to constant weight. Finally, we obtained particle size class > 53 µm: particulate organic matter (POM). POC and PON were measured with an elemental analyzer (EA3000, Vector, Italy).
Stable C isotope composition (δ13C) in soil samples were measured using an automated isotope ratio mass spectrometer (Delta V Advantage, Thermo Fisher, Germany). The C stable isotope value was expressed in parts per thousand (‰) relative to PDB (Pee Dee Belemnite) for 13C/12C which were expressed in standard delta (δ) notation [36]. Due to the high acidification of soils (Table 1), the inorganic C contents were negligible. We therefore had no treatment to remove inorganic C before elemental and isotopic analysis.
2.4. Data Analysis
The β value, which represents the SOC turnover rate, was determined by ordinary least squares (OLS) regression analysis between the log10-transformed SOC content and δ13CSOC for each soil depth profile [37]. The slope of the regression gave the β value as follows:
where δ13CSOC is the δ13C in SOC in the corresponding soil profile, SOC is the SOC content in the corresponding soil layer of δ13CSOC, the β value is the regression coefficient, and the α value is a constant number associated with the logarithm base.
SPSS statistical software (SPSS Statistics 21) and R (R 4.2.1) were utilized for the statistical analyses. One-way ANOVA combined with the Fisher’s least significant difference (LSD) test was used to analyze the differences in SOC, TN, TP, δ13CSOC, and soil stoichiometric ratios across treatments at each soil depth, respectively, as well as among different sites. Principal component analysis (PCA) was used to analyze the clustering of all soil physicochemical properties and SOC turnover characteristics among different sites. Significant differences were assessed at the level of p < 0.05. Correlation analyses were used to test the relationships between δ13CSOC or β values and soil physicochemical properties.
3. Results
3.1. δ13CSOC and β Value
In comparison with SOC content, δ13CSOC was more sensitive to different treatments (Table 2, Figure 2). SOC contents were significantly influenced by sites and soil layers (p < 0.001), and showed a decrease with soil depth (Figure 2). However, the patterns of SOC contents decreased with soil depth not significantly promoted in N and N + P additions at both sites (p > 0.05; Table 1). Only on the mid-slope, SOC content was significantly higher in CK than in N + P addition for the 30–40 cm layer (p < 0.05). In contrast, the δ13CSOC values showed significant differences among treatments, sites, and soil depths, and were also influenced by the two-factor interaction between treatment and site, and depth and site (p < 0.01; Table 2). In both sites, δ13CSOC values showed an increasing trend with soil depth. Moreover, the increasing trend of δ13CSOC values across the soil profile was significantly increased in N and N + P additions on the flat ridge. The δ13CSOC values were significantly higher in N addition than in CK, but they responded to N + P addition differently at two sites. On the mid-slope, δ13CSOC did not vary significantly after N + P addition, but on the flat ridge, the δ13CSOC was significantly higher in N + P addition than in CK (p < 0.05; Figure 2).
Table 2.
Three-factor ANOVA for soil chemical properties.
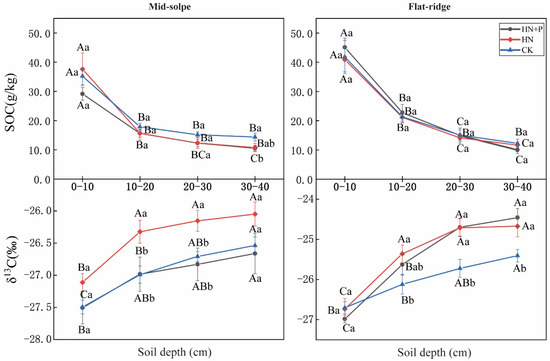
Figure 2.
Effect of N and N + P additions on soil organic carbon and δ13CSOC. Note: lowercase letters indicate significant differences between different treatments in the same soil layer; uppercase letters indicate significant differences among different soil layers under the same treatment (p < 0.05).
The β values were significantly higher on the mid-slope than on the flat ridge (Figure 3). At the same time, β values were significantly higher in CK than in N and N + P additions on the flat ridge. This indicated a faster turnover rate of SOC in N and N + P addition on the flat ridge.
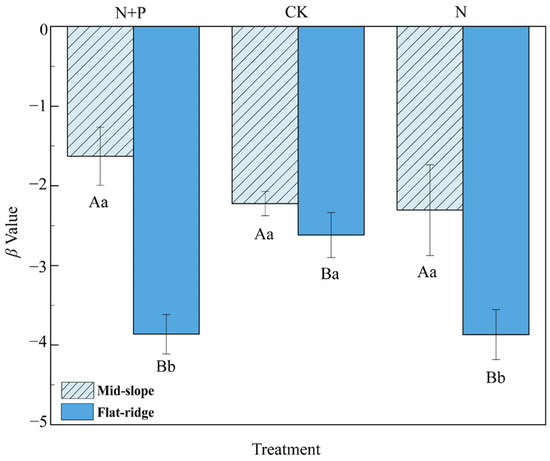
Figure 3.
Effect of N and N + P additions on β values at different sites. The uppercase letters indicate differences between sites; the lower case letters indicate differences between treatments (p < 0.05).
3.2. Soil N and P Contents and Stoichiometric Ratio
The TN contents decreased significantly in N + P addition in 20–30 and 30–40 cm layers on the mid-slope (p < 0.5; Figure 4). The TP contents were not changed significantly among treatments on the mid-slope. However, TP contents reduced significantly in N and N + P addition in each soil layer on the flat ridge (Figure 4). The responses of C/N, C/P, and N/P to treatment, site, and soil depth were extremely significant (p < 0.001; Table 2). The C/N was highest in N + P addition on the mid-slope, and was lowest in N addition on the flat ridge (p < 0.05; Figure 5). C/P and N/P decreased with soil depth with inconsistent response to N and N + P addition treatments at both sites. On the mid-slope, there was no significant trend in C/P, N/P among treatments. However, C/P and N/P showed similar significant trend: N + P > N > CK on the flat ridge, (p < 0.05; Figure 5).
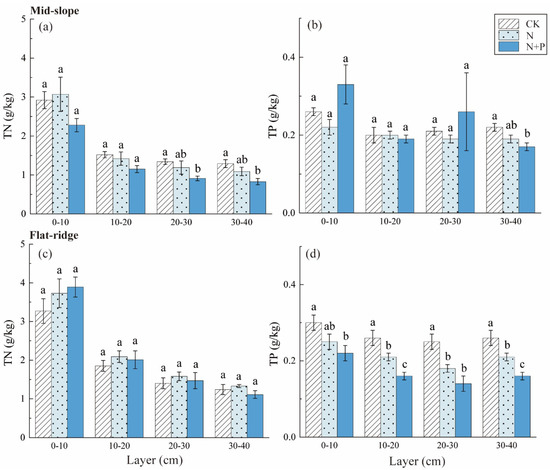
Figure 4.
Response of soil TN and TP to different N and N + P additions at the two sites. The response of soil total nitrogen (TN) (a), total phosphorus (TP) (b) to different N and N + P additions in the mid-slope, the response of TN (c), TP (d) to different N and N + P additions in the flat ridge. Note: lowercase letters indicate significant differences between treatments in the same soil layer (p < 0.05).
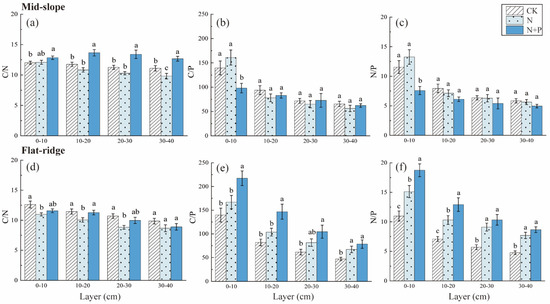
Figure 5.
Response of soil C, N and P stoichiometric ratio to N and N + P additions at the two sites. The response of C/N ratio (a), C/P ratio (b), N/P ratio (c)to different N and N + P additions in the mid-slope; the response of C/N ratio (d), C/P ratio (e), N/P ratio (f) to different N and N + P additions in the flat ridge. Note: Lowercase letters indicate significant differences between treatments in the same soil layer (p < 0.05).
3.3. Factors Affecting Soil δ13CSOC and β Value
The PCA results showed that the different treatments were grouped on the PC2 axis at the two sites, but clustered in different ways (Figure 6). The top 4 contributors in the PC2 axis were EC, NO3−-N, DON, NH4+-N on the mid-slope, while were β, MBC, TP, and N/P in the PC2 axis on the flat ridge.
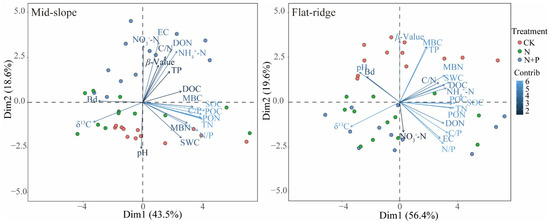
Figure 6.
Principal component analysis of soil physicochemical properties at both sites. Note: SOC = soil organic carbon; δ13CSOC = δ13C in SOC; the β value was given by the slope of the regression between δ13CSOC and the logarithm of SOC; TN = Total nitrogen; TP = Total phosphorus; pH = potential of hydrogen; EC = Electrical conductivity; BD = Bulk density; SWC = Soil water content; MBC = Microbial biomass carbon; MBN = Microbial biomass nitrogen; DOC = Dissolved organic carbon; DON = Dissolved organic nitrogen; POC = Particulate organic carbon; PON = Particulate organic nitrogen; C/N = C/N ratio; C/P = C/P ratio; N/P = N/P ratio; NO3−-N = Nitrate nitrogen; NH4+-N = Ammonium nitrogen. The same below. On the mid-slope, δ13CSOC was significantly correlated with most of soil physicochemical indicators except for NO3−-N and pH, but β was significantly correlated only with δ13CSOC, NO3−-N and DOC (p < 0.05; Figure 7). The results of stepwise regression analysis showed that NO3−-N, DOC, and DON were the main drivers of β values with a cumulative model explanation of 70.7%, and DOC, MBC, and NH4+-N were the main drivers of δ13CSOC with a cumulative model explanation of 63.6% (Table S1).
On the flat ridge, except for NO3−-N, all other soil factors were significantly correlated with δ13CSOC, while pH, EC, TP, C/P, N/P, and MBC were significantly correlated with β (p < 0.05; Figure 7). The results of stepwise regression analysis showed that TP, TN, and BD were the main drivers of β value and the explanation of the cumulative model was 80.7% (Table S1). TP, C/P, and EC were the main drivers of the δ13CSOC, and the explanation of the cumulative model is 92.3%.
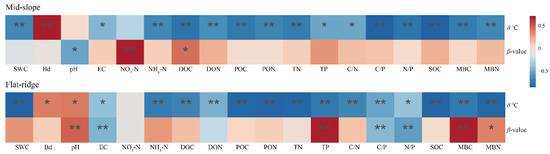
Figure 7.
Correlations between δ13C, β value, and soil physicochemical properties at both sites by principal component analysis. Note: * p < 0.05; ** p < 0.01.
4. Discussion
4.1. Effects of NP Addition on δ13CSOC, SOC, and β Value
Our results at both sites confirmed the widely reported results of the enrichment of δ13C in SOC with soil depth [10,38,39]. Two main processes can explain the δ13CSOC enrichment with soil depth. One explanation is the Suess effect [40]. Due to the fossil fuels and biomass burning, atmospheric δ13-CO2 has decreased by about 1.99% since 200 years ago [41]. This phenomenon would lead to the depletion of the source of δ13CSOC in the surface layer. Another mechanism is isotopic fractionation [42]. Commonly, the increase in δ13C with soil depth was owing to isotopic fractionation during microbial activity and metabolism [43]. Furthermore, soil microbes can discriminate against 13C during the utilization of C compounds [44], and tend to the 12C component during SOC decomposition, for the purpose that 13C components accumulate in the decomposed substrate, resulting in the gradual 13C-enrichment in the residual SOC. Compared to topsoil, as the soil layer deepens and the organic matter decomposes, SOC in deep horizons becomes richer in 13C. On the condition that the isotopic fractionation is the dominant mechanism for δ13CSOC enrichment along the soil profile, the increasing trend of soil δ13CSOC could be utilized as a robust indicator for SOC turnover dynamics [37,45]. According to several studies, roots from the same plant were typically more 13C-enriched than leaves and branches; consequently, the 13C value of the soil surface may be lower than that of the deeper layers [20].
Consistent with hypothesis 1, our results demonstrated that SOC content responded little to N and N + P additions. It is consistent with the previous studies [46,47,48]. The SOC content in deep soils (10–40 cm) tended to decrease in the addition of exogenous N and P on the mid-slope. Generally, SOC contents are determined by the balance between plant C input and subsurface C output. The primary routes of subsurface C export are soil leaching, respiration, and microbial decomposition. Increased exogenous N input may promote the flow of DOC from the relatively stable soil C pool, thus increasing the loss of SOC [49]. Additionally, the excitation effect may also lead to a decrease in SOC. The increase in N availability alleviates microbial N limitation, promotes the use of readily decomposable organic C by microorganisms, increases their heterotrophic respiration, and reduces the original SOC content [15,50]. Therefore, the increased C input from above- and belowground plant biomass growth was balanced by the accelerated N-induced C release and leaching.
Nevertheless, we observed that the values of δ13CSOC increased significantly at both sites in N addition. On the flat ridge, the pattern that δ13CSOC increased with increasing soil depth enhanced in N and N + P additions is consistent with hypothesis 1. The increasing tendency of δ13CSOC indicates that the C lost from the SOC pool would be depleted in 12C. In principle, there are two ways that SOC can be lost from the soil: either upwardly by gas emission or downwardly through dissolved C, which appears to be richer in 12C relative to SOC. Accordingly, the losses of dissolved C would tend to reduce the amount of 12C in the remaining SOC. Our findings supported this hypothesis, and yet the change was not significant in N + P addition on the mid-slope. We hypothesize that this may be due to differences in P nutrient use resulting from variation in vegetation type at two sites. Our results showed that different treatments had significant effect on β value on the flat ridge. In addition, the β value was significantly decreased in N and N + P additions, indicating that exogenous nutrient inputs promoted the turnover of SOC. Interestingly, the β value showed little response to N and N + P additions on the mid-slope, being significantly higher than that on the flat ridge. This indicates that different sites may also lead to contrasting patterns of SOC turnover in response to N and P additions. It is probably attributed to the differences in altitude and slope at the two sites. Compared to the mid-slope, the flat ridge is at a relatively high altitude and exposed to strong wind, which results in changes in vegetation composition with a high proportion of deciduous tree species that contributed 15–20% of the annual litterfall production [51]. Due to the difference in stand structure between the two sites, the soil microorganisms on the flat ridge have a higher diversity and more even distribution, resulting in a higher use efficiency of C sources and stronger microbial activity [52], which could cause rapid turnover of SOC and the decrease of β value.
4.2. Effects of NP Addition on Soil Stoichiometric Ratio
It is presumed that soil properties play an essential role in regulating the dynamics of SOC turnover across different scales [53]. Our results indicated that TN decreased in N + P addition at both sites in comparison with N addition. Vitousek et al. [5] concluded that increasing P availability tended to exacerbate the N limitation of biological productivity. Consequently, the decrease of TN in N + P addition may be attributed to the increased P availability of plants, which increases the plant demand for soil N and leads to lower soil TN content. Compared to the soil C and N cycles, the soil P cycle is relatively simple, including P input and export, transport, and transformation within the soil. In addition, the process of soil P export consists of two main components, the uptake and use of P by plants and microbes and the leaching loss of soluble P from the soil. On the mid-slope, the TP did not change significantly in N and N + P additions, while it decreased significantly on the flat ridge. Thus, we speculate that the main reason for this phenomenon is the different demand of P for the various dominant species between the mid-slope and flat ridge. N and N + P addition could promote the uptake and utilization of P by plants by alleviating the N limitation in the ecosystem. Meanwhile, Pleioblastus amarus (Keng) dominated the undergrowth on the flat ridge and tended to absorb more P from the soil. Moreover, the foliar P content of the dominant tree species increased significantly after the N and N + P additions (unpublished data). In addition, TP content was lower in N addition than in CK at both sites. Schleuss et al. [54] indicated that exchanging N for P likely was considered a synergistic strategy for plant growth. Plants can readily activate and absorb P from organic sources after N addition.
Our results further demonstrated that N additions reduced C/N; in contrast, long-term N + P addition increased C/N significantly. Consistent with previous findings, increased P availability decreased soil N availability and slowed soil N use efficiency. However, the inhibitory effect of P was weakened on the flat ridge. This is consistent with the previous speculation; it may contribute to the development of distinct understory vegetation (bamboo species) with higher P demand, resulting in the decrease of soil P available. In addition, N and P additions promoted SOC turnover by affecting N use efficiency in the soil, which was consistent with the results of soil δ13CSOC and β values, and confirmed that the mechanisms by which N and P influence soil C pools are different.
C/P showed a significant increasing trend in N and N + P additions on the flat ridge, indicating that soil P use efficiency was decreased and plant P use may be more efficient. According to Marklein and Houlton [55], long-term N addition could increase soil phosphatase activity and encourage P mineralization. In humid regions, the mineralized P is vulnerable to leaching loss [5]. Thus, the availability of P in the soil is subsequently reduced. On the other hand, subtropical forests in high-deposition regions may be N-saturated, in which case plants would tend to recycle P efficiently and reduce P content in plant litter. Consequently, less P would then be released into the soil during decomposition. Deng et al. [56] demonstrated that in a variety of terrestrial habitats, the addition of N increased plant P uptake in aboveground biomass. In both sites, our findings showed the decrease in soil P availability in N + P addition compared to in N addition.
4.3. Effect of Soil Physicochemical Factors on δ13CSOC and β Value
δ13CSOC closely corresponds to soil physicochemical properties. Previous studies demonstrated that edaphic variables play a vital roles in shaping patterns of δ13CSOC [42,57]. Our results indicated that the physicochemical properties and SOC turnover characteristics at the two sites clustered significantly (Figure 6), indicating that the mechanisms of soil physicochemical properties on SOC turnover differed between the two sites. It is consistent with Hypothesis 3. Soil properties basically explained the change of SOC turnover and δ13CSOC, which is consistent with the study of Yu et al. [45].
On the mid-slope, the soil physicochemical properties in N + P addition were significantly different from the other treatments (Figure 6), and had relatively higher contents of EC, inorganic N, and dissolved N. In addition, the correlation analysis showed that β values had a significant negative correlation with NO3−-N and DOC. The stepwise regression model demonstrated that NO3−-N, DOC, and DON explained the changes in SOC turnover on the mid-slope. Consequently, we can speculate that the main factors affecting SOC turnover on the mid-slope are probably the distinct active N fractions. Dissolved C and N are more mobile compared to other N fractions. Our long-time and previous short-term N and N + P addition experiments [58] revealed that pH and slope could be the main controls of DOC production. DOC is a product of litter and soil organic matter decomposition and easily leaches. Therefore, the quantity of litter input and the rate of organic matter decomposition may influence the effect of N + P addition on DOC. On the other hand, the increase of inorganic N content can cause soil acidification, and it may inhibit soil microbial activity, resulting in a relatively slow rate of SOC turnover.
On the flat ridge, the β value was strongly influenced by N and N + P additions (Figure 3). Compared to CK, TP was lower and SOC turnover was accelerated in N and N + P additions (Figure 6). Furthermore, the correlation analysis showed that β values had a significant positive correlation with pH, TP, and MBC, as well as MBN. The model of stepwise regression revealed that TP, C/P, and EC explained the variations in SOC turnover. In addition, we observed that P and the P use efficiency may be important factors driving SOC turnover on the flat ridge. A previous study concluded that the dynamics of soil δ13C are mainly controlled by C inputs from vegetation and subsequent microbial decomposition [59]. In addition, the turnover rate of soil microorganisms largely depends on their selection of C source, Zhang et al. [60] proposed that N and N + P addition can accelerate microbial activity through increasing rhizosphere C activity, thereby driving SOC turnover. According to the theory of Syers et al. [61], soil inorganic P is reversible in the soil and plant roots while exogenous P is added, and it may promote the P uptake by plants; therefore, the soil TP was reduced. The flow of inorganic P into the plant pool could stimulate the P availability of plants; it may weaken the P availability in the soil. It increased the accumulation of plant root C, and the microbial turnover was accelerated, which reduced the accumulation of MBC in the soil; consequently, the β value decreased with the decrease of MBC.
Furthermore, the correlation analysis revealed a significant negative correlation (p < 0.05) between δ13CSOC values and C/N at both sites, which is consistent with the majority of previous studies [42,62]. This indicates that δ13CSOC is, indeed, an effective method for determining the degree of decomposition of soil organic matter and the minor transformation and transport of nutrients.
5. Conclusions
Based on a long-time N deposition experiment conducted over one decade, we observed two different patterns of SOC turnover in response to N and N + P additions. The drivers of SOC turnover differed between the two sites due to differences in altitude and stand structure. On the flat ridge, the presence of deciduous tree species contributes to a higher turnover of SOC compared to the mid-slope. The long-term N and N + P additions increased the nutrient use by the plant growth leading to the translocation of P in the plant, and reducing the TP and P availability in soil on the flat ridge. This further accelerated the decomposition and utilization of SOC. Therefore, the change in soil P emerges as a crucial factor influencing SOC turnover in P-limited subtropical forests.
Supplementary Materials
The following supporting information can be downloaded at: https://www.mdpi.com/article/10.3390/f14071314/s1, Table S1. Stepwise regression analyses for β value and δ13Csoc with soil physicochemical properties, after model recognition, the regression takes the following form.
Author Contributions
Conceptualization and methodology, X.X. and L.C.; software, L.C. and P.D.; formal analysis, Z.W.; investigation, L.C., Z.W. and R.Y.; experiment analysis, R.Y. and Y.G.; data curation, R.Y.; writing—original draft preparation, L.C.; writing—review and editing, X.X. and Z.W.; visualization, L.C., P.D. and H.X.; supervision, project administration, funding acquisition, X.X. All authors have read and agreed to the published version of the manuscript.
Funding
This research was financially supported by the National Natural Science Foundation of China (NSFC, No. 31370626 and 31770672).
Data Availability Statement
Not applicable.
Acknowledgments
We gratefully acknowledge the help from the Zawan Nature Reserve, Anhui Province, for providing the fertilization experiment.
Conflicts of Interest
The authors declare no conflict of interest.
References
- Wang, S.; Fan, J.; Song, M.; Yu, G.; Zhou, L.; Liu, J.; Zhong, H.; Gao, L.; Hu, Z.; Wu, W. Patterns of SOC and soil 13 C and their relations to climatic factors and soil characteristics on the Qinghai–Tibetan Plateau. Plant Soil 2013, 363, 243–255. [Google Scholar] [CrossRef]
- Zhou, Y.; Zhang, W.; Cheng, X.; Harris, W.; Schaeffer, S.M.; Xu, X.; Zhao, B. Factors affecting 13 C enrichment of vegetation and soil in temperate grasslands in Inner Mongolia, China. J. Soils Sediments 2019, 19, 2190–2199. [Google Scholar] [CrossRef]
- Craine, J.M.; Brookshire, E.; Cramer, M.D.; Hasselquist, N.J.; Koba, K.; Marin-Spiotta, E.; Wang, L. Ecological interpretations of nitrogen isotope ratios of terrestrial plants and soils. Plant Soil 2015, 396, 1–26. [Google Scholar] [CrossRef]
- Huang, Z.; Liu, B.; Davis, M.; Sardans, J.; Peñuelas, J.; Billings, S. Long-term nitrogen deposition linked to reduced water use efficiency in forests with low phosphorus availability. New Phytol. 2016, 210, 431–442. [Google Scholar] [CrossRef]
- Vitousek, P.M.; Porder, S.; Houlton, B.Z.; Chadwick, O.A. Terrestrial phosphorus limitation: Mechanisms, implications, and nitrogen–phosphorus interactions. Ecol. Appl. 2010, 20, 5–15. [Google Scholar] [CrossRef]
- Yu, Z.; Wang, M.; Huang, Z.; Lin, T.C.; Vadeboncoeur, M.A.; Searle, E.B.; Chen, H.Y. Temporal changes in soil C-N-P stoichiometry over the past 60 years across subtropical China. Glob. Change Biol. 2018, 24, 1308–1320. [Google Scholar] [CrossRef]
- Zhang, C.; Tian, H.; Liu, J.; Wang, S.; Liu, M.; Pan, S.; Shi, X. Pools and distributions of soil phosphorus in China. Glob. Biogeochem. Cycles 2005, 19, GB1020. [Google Scholar] [CrossRef]
- Li, Y.; Niu, S.; Yu, G. Aggravated phosphorus limitation on biomass production under increasing nitrogen loading: A meta-analysis. Glob. Change Biol. 2016, 22, 934–943. [Google Scholar] [CrossRef]
- Liang, C.; Amelung, W.; Lehmann, J.; Kästner, M. Quantitative assessment of microbial necromass contribution to soil organic matter. Glob. Change Biol. 2019, 25, 3578–3590. [Google Scholar] [CrossRef]
- Li, H.; Yan, F.; Tuo, D.; Yao, B.; Chen, J. The effect of climatic and edaphic factors on soil organic carbon turnover in hummocks based on δ13C on the Qinghai-Tibet Plateau. Sci. Total Environ. 2020, 741, 140141. [Google Scholar] [CrossRef]
- Van Groenigen, K.J.; Qi, X.; Osenberg, C.W.; Luo, Y.; Hungate, B.A. Faster decomposition under increased atmospheric CO2 limits soil carbon storage. Science 2014, 344, 508–509. [Google Scholar] [CrossRef]
- Yuan, X.; Qin, W.; Xu, H.; Zhang, Z.; Zhou, H.; Zhu, B. Sensitivity of soil carbon dynamics to nitrogen and phosphorus enrichment in an alpine meadow. Soil Biol. Biochem. 2020, 150, 107984. [Google Scholar] [CrossRef]
- Camenzind, T.; Homeier, J.; Dietrich, K.; Hempel, S.; Hertel, D.; Krohn, A.; Leuschner, C.; Oelmann, Y.; Olsson, P.A.; Suárez, J.P. Opposing effects of nitrogen versus phosphorus additions on mycorrhizal fungal abundance along an elevational gradient in tropical montane forests. Soil Biol. Biochem. 2016, 94, 37–47. [Google Scholar] [CrossRef]
- Liu, L.; Gundersen, P.; Zhang, T.; Mo, J. Effects of phosphorus addition on soil microbial biomass and community composition in three forest types in tropical China. Soil Biol. Biochem. 2012, 44, 31–38. [Google Scholar] [CrossRef]
- Lu, M.; Zhou, X.; Luo, Y.; Yang, Y.; Fang, C.; Chen, J.; Li, B. Minor stimulation of soil carbon storage by nitrogen addition: A meta-analysis. Agric. Ecosyst. Environ. 2011, 140, 234–244. [Google Scholar] [CrossRef]
- Luo, R.; Kuzyakov, Y.; Liu, D.; Fan, J.; Luo, J.; Lindsey, S.; He, J.-S.; Ding, W. Nutrient addition reduces carbon sequestration in a Tibetan grassland soil: Disentangling microbial and physical controls. Soil Biol. Biochem. 2020, 144, 107764. [Google Scholar] [CrossRef]
- Jing, X.; Yang, X.; Ren, F.; Zhou, H.; Zhu, B.; He, J.-S. Neutral effect of nitrogen addition and negative effect of phosphorus addition on topsoil extracellular enzymatic activities in an alpine grassland ecosystem. Appl. Soil Ecol. 2016, 107, 205–213. [Google Scholar] [CrossRef]
- Feng, W.; Shi, Z.; Jiang, J.; Xia, J.; Liang, J.; Zhou, J.; Luo, Y. Methodological uncertainty in estimating carbon turnover times of soil fractions. Soil Biol. Biochem. 2016, 100, 118–124. [Google Scholar] [CrossRef]
- Garten, C.T., Jr.; Cooper, L.W.; Post, W., III; Hanson, P.J. Climate controls on forest soil C isotope ratios in the southern Appalachian Mountains. Ecology 2000, 81, 1108–1119. [Google Scholar] [CrossRef]
- Powers, J.S.; Schlesinger, W.H. Geographic and vertical patterns of stable carbon isotopes in tropical rain forest soils of Costa Rica. Geoderma 2002, 109, 141–160. [Google Scholar] [CrossRef]
- Gao, J.; Zhang, X.; Lei, G.; Wang, G. Soil organic carbon and its fractions in relation to degradation and restoration of wetlands on the Zoigê Plateau, China. Wetlands 2014, 34, 235–241. [Google Scholar] [CrossRef]
- Werner, C.; Schnyder, H.; Cuntz, M.; Keitel, C.; Zeeman, M.J.; Dawson, T.; Badeck, F.-W.; Brugnoli, E.; Ghashghaie, J.; Grams, T.E. Progress and challenges in using stable isotopes to trace plant carbon and water relations across scales. Biogeosciences 2012, 9, 3083–3111. [Google Scholar] [CrossRef]
- Gautam, M.K.; Lee, K.-S.; Song, B.-Y.; Bong, Y.-S. Site related δ 13 C of vegetation and soil organic carbon in a cool temperate region. Plant Soil 2017, 418, 293–306. [Google Scholar] [CrossRef]
- Wang, C.; Houlton, B.Z.; Liu, D.; Hou, J.; Cheng, W.; Bai, E. Stable isotopic constraints on global soil organic carbon turnover. Biogeosciences 2018, 15, 987–995. [Google Scholar] [CrossRef]
- Xiong, X.; Liu, J.; Zhou, G.; Deng, Q.; Zhang, H.; Chu, G.; Meng, Z.; Zhang, D. Reduced turnover rate of topsoil organic carbon in old-growth forests: A case study in subtropical China. For. Ecosyst. 2021, 8, 58. [Google Scholar] [CrossRef]
- Wang, C.; Wei, H.; Liu, D.; Luo, W.; Hou, J.; Cheng, W.; Han, X.; Bai, E. Depth profiles of soil carbon isotopes along a semi-arid grassland transect in northern China. Plant Soil 2017, 417, 43–52. [Google Scholar] [CrossRef]
- Diochon, A.; Kellman, L. Natural abundance measurements of 13C indicate increased deep soil carbon mineralization after forest disturbance. Geophys. Res. Lett. 2008, 35, L14402. [Google Scholar] [CrossRef]
- Neff, J.C.; Townsend, A.R.; Gleixner, G.; Lehman, S.J.; Turnbull, J.; Bowman, W.D. Variable effects of nitrogen additions on the stability and turnover of soil carbon. Nature 2002, 419, 915–917. [Google Scholar] [CrossRef]
- Fang, X.-M.; Zhang, X.-L.; Chen, F.-S.; Zong, Y.-Y.; Bu, W.-S.; Wan, S.-Z.; Luo, Y.; Wang, H. Phosphorus addition alters the response of soil organic carbon decomposition to nitrogen deposition in a subtropical forest. Soil Biol. Biochem. 2019, 133, 119–128. [Google Scholar] [CrossRef]
- Anderson-Teixeira, K.J.; Davies, S.J.; Bennett, A.C.; Gonzalez-Akre, E.B.; Muller-Landau, H.C.; Joseph Wright, S.; Abu Salim, K.; Almeyda Zambrano, A.M.; Alonso, A.; Baltzer, J.L. CTFS-Forest GEO: A worldwide network monitoring forests in an era of global change. Glob. Change Biol. 2015, 21, 528–549. [Google Scholar] [CrossRef]
- Yu, G.; Chen, Z.; Piao, S.; Peng, C.; Ciais, P.; Wang, Q.; Li, X.; Zhu, X. High carbon dioxide uptake by subtropical forest ecosystems in the East Asian monsoon region. Proc. Natl. Acad. Sci. USA 2014, 111, 4910–4915. [Google Scholar] [CrossRef]
- Baxter, S. World Reference Base for Soil Resources. World Soil Resources Report 103. Rome: Food and Agriculture Organization of the United Nations. Exp. Agric. 2006, 43, 264. [Google Scholar] [CrossRef]
- Vance, E.D.; Brookes, P.C.; Jenkinson, D.S. An extraction method for measuring soil microbial biomass C. Soil Biol. Biochem. 1987, 19, 703–707. [Google Scholar] [CrossRef]
- Brookes, P.; Landman, A.; Pruden, G.; Jenkinson, D. Chloroform fumigation and the release of soil nitrogen: A rapid direct extraction method to measure microbial biomass nitrogen in soil. Soil Biol. Biochem. 1985, 17, 837–842. [Google Scholar] [CrossRef]
- Marriott, E.E.; Wander, M. Qualitative and quantitative differences in particulate organic matter fractions in organic and conventional farming systems. Soil Biol. Biochem. 2006, 38, 1527–1536. [Google Scholar] [CrossRef]
- Griffis, T.J. Tracing the flow of carbon dioxide and water vapor between the biosphere and atmosphere: A review of optical isotope techniques and their application. Agric. For. Meteorol. 2013, 174, 85–109. [Google Scholar] [CrossRef]
- Acton, P.; Fox, J.; Campbell, E.; Rowe, H.; Wilkinson, M. Carbon isotopes for estimating soil decomposition and physical mixing in well-drained forest soils. J. Geophys. Res. Biogeosc. 2013, 118, 1532–1545. [Google Scholar] [CrossRef]
- Guillaume, T.; Damris, M.; Kuzyakov, Y. Losses of soil carbon by converting tropical forest to plantations: Erosion and decomposition estimated by δ13C. Glob. Change Biol. 2015, 21, 3548–3560. [Google Scholar] [CrossRef]
- Xiong, X.; Zhang, H.; Deng, Q.; Hui, D.; Chu, G.; Meng, Z.; Zhou, G.; Zhang, D. Soil organic carbon turnover following forest restoration in south China: Evidence from stable carbon isotopes. For. Ecol. Manag. 2020, 462, 117988. [Google Scholar] [CrossRef]
- Revelle, R.; Suess, H.E. Carbon dioxide exchange between atmosphere and ocean and the question of an increase of atmospheric CO2 during the past decades. Tellus 1957, 9, 18–27. [Google Scholar] [CrossRef]
- Pu, Y.; Nace, T.; Meyers, P.A.; Zhang, H.; Wang, Y.; Zhang, C.L.; Shao, X. Paleoclimate changes of the last 1000 yr on the eastern Qinghai–Tibetan Plateau recorded by elemental, isotopic, and molecular organic matter proxies in sediment from glacial Lake Ximencuo. Palaeogeogr. Palaeoclimatol. Palaeoecol. 2013, 379, 39–53. [Google Scholar] [CrossRef]
- Yang, Y.; Ji, C.; Chen, L.; Ding, J.; Cheng, X.; Robinson, D. Edaphic rather than climatic controls over 13C enrichment between soil and vegetation in alpine grasslands on the Tibetan Plateau. Funct. Ecol. 2015, 29, 839–848. [Google Scholar] [CrossRef]
- Garten, C.T., Jr. Relationships among forest soil C isotopic composition, partitioning, and turnover times. Can. J. For. Res. 2006, 36, 2157–2167. [Google Scholar] [CrossRef]
- Menichetti, L.; Houot, S.; Van Oort, F.; Kätterer, T.; Christensen, B.T.; Chenu, C.; Barré, P.; Vasilyeva, N.A.; Ekblad, A. Increase in soil stable carbon isotope ratio relates to loss of organic carbon: Results from five long-term bare fallow experiments. Oecologia 2015, 177, 811–821. [Google Scholar] [CrossRef]
- Yu, H.; Wei, X.; Tan, W. High nitrogen enrichment increases the allocation of new organic carbon to deep soil layers. Geoderma 2022, 406, 115515. [Google Scholar] [CrossRef]
- Chen, J.; Xiao, W.; Zheng, C.; Zhu, B. Nitrogen addition has contrasting effects on particulate and mineral-associated soil organic carbon in a subtropical forest. Soil Biol. Biochem. 2020, 142, 107708. [Google Scholar] [CrossRef]
- Cusack, D.F.; Torn, M.S.; McDOWELL, W.H.; Silver, W.L. The response of heterotrophic activity and carbon cycling to nitrogen additions and warming in two tropical soils. Glob. Change Biol. 2010, 16, 2555–2572. [Google Scholar] [CrossRef]
- Huang, S.; Peng, X.; Huang, Q.; Zhang, W. Soil aggregation and organic carbon fractions affected by long-term fertilization in a red soil of subtropical China. Geoderma 2010, 154, 364–369. [Google Scholar] [CrossRef]
- Monteith, D.T.; Stoddard, J.L.; Evans, C.D.; De Wit, H.A.; Forsius, M.; Høgåsen, T.; Wilander, A.; Skjelkvåle, B.L.; Jeffries, D.S.; Vuorenmaa, J. Dissolved organic carbon trends resulting from changes in atmospheric deposition chemistry. Nature 2007, 450, 537–540. [Google Scholar] [CrossRef]
- Boot, C.M.; Hall, E.K.; Denef, K.; Baron, J.S. Long-term reactive nitrogen loading alters soil carbon and microbial community properties in a subalpine forest ecosystem. Soil Biol. Biochem. 2016, 92, 211–220. [Google Scholar] [CrossRef]
- Yu, X.; Xu, C.; Zhu, Y.; Xu, X. Litterfall production and its relation to stand structural factors in a subtropical evergreen broadleaf forest. J. Zhejiang AF Univ. 2016, 33, 991–999. [Google Scholar]
- Dai, Y.; Fu, X.; Zhang, S.; Guan, M.; Zhang, D.; Xu, X. Metabolic characteristics of soil microbial community in different forest stands of subtropical evergreen broad-leaved forest at Chaiwan Natural Reserve in Qimen, Anhui. Ecol. Environ. Sci. 2017, 26, 1114–1121. [Google Scholar] [CrossRef]
- Xu, X.; Shi, Z.; Li, D.; Rey, A.; Ruan, H.; Craine, J.M.; Liang, J.; Zhou, J.; Luo, Y. Soil properties control decomposition of soil organic carbon: Results from data-assimilation analysis. Geoderma 2016, 262, 235–242. [Google Scholar] [CrossRef]
- Schleuss, P.M.; Widdig, M.; Heintz-Buschart, A.; Kirkman, K.; Spohn, M. Interactions of nitrogen and phosphorus cycling promote P acquisition and explain synergistic plant-growth responses. Ecology 2020, 101, e03003. [Google Scholar] [CrossRef]
- Marklein, A.R.; Houlton, B.Z. Nitrogen inputs accelerate phosphorus cycling rates across a wide variety of terrestrial ecosystems. New Phytol. 2012, 193, 696–704. [Google Scholar] [CrossRef]
- Deng, Q.; Hui, D.; Dennis, S.; Reddy, K.C. Responses of terrestrial ecosystem phosphorus cycling to nitrogen addition: A meta-analysis. Glob. Ecol. Biogeogr. 2017, 26, 713–728. [Google Scholar] [CrossRef]
- Peri, P.L.; Ladd, B.; Pepper, D.A.; Bonser, S.P.; Laffan, S.W.; Amelung, W. Carbon (δ13 C) and nitrogen (δ15 N) stable isotope composition in plant and soil in S outhern P atagonia’s native forests. Glob. Change Biol. 2012, 18, 311–321. [Google Scholar] [CrossRef]
- Yang, J.; Ke, L.; Cui, J.; Xu, X. Effects of N and P Addition on Soil Dissolved Organic Carbon and Microbial Biomass Carbon in a Subtropical Evergreen Broad-leaved Forest. Chin. J. Soil Sci. 2014, 45, 876–883. [Google Scholar] [CrossRef]
- Zhao, X.; Xu, X.; Wang, F.; Greenberg, I.; Liu, M.; Che, R.; Zhang, L.; Cui, X. Climatic, edaphic and biotic controls over soil δ13C and δ15N in temperate grasslands. Forests 2020, 11, 433. [Google Scholar] [CrossRef]
- Zhang, Y.; Qiang, W.; Luo, R.; Wang, M.; Pang, X. Effects of nitrogen and phosphorus addition on soil microbial growth, turnover, and carbon use efficiency: A review. Chin. J. Appl. Environ. 2022, 28, 526–534. [Google Scholar] [CrossRef]
- Syers, J.K.; Johnston, A.E.; Curtin, D. Efficiency of Soil and Fertilizer Phosphorus: Reconciling Changing Concepts of Soil Phosphorus Chemistry with Agronomic Information. In Proceedings of the The 18th World Congress of Soil Science, Philadelphia, PA, USA, 9–15 July 2006. [Google Scholar]
- Zhou, G.; Xu, S.; Ciais, P.; Manzoni, S.; Fang, J.; Yu, G.; Tang, X.; Zhou, P.; Wang, W.; Yan, J. Climate and litter C/N ratio constrain soil organic carbon accumulation. Natl. Sci. Rev. 2019, 6, 746–757. [Google Scholar] [CrossRef]


Disclaimer/Publisher’s Note: The statements, opinions and data contained in all publications are solely those of the individual author(s) and contributor(s) and not of MDPI and/or the editor(s). MDPI and/or the editor(s) disclaim responsibility for any injury to people or property resulting from any ideas, methods, instructions or products referred to in the content. |
© 2023 by the authors. Licensee MDPI, Basel, Switzerland. This article is an open access article distributed under the terms and conditions of the Creative Commons Attribution (CC BY) license (https://creativecommons.org/licenses/by/4.0/).