Article

Transcriptomic Determination of the Core Genes Regulating the Growth and Physiological Traits of Quercus mongolica Fisch. ex Ledeb

1
Forestry College, Hebei Agricultural University, Baoding 071000, China
2
Hongyashan State-Owned Forest Farm in Hebei Province, Baoding 074200, China
*
Authors to whom correspondence should be addressed.
Forests 2023, 14(7), 1313; https://doi.org/10.3390/f14071313
Submission received: 15 May 2023 / Revised: 20 June 2023 / Accepted: 21 June 2023 / Published: 26 June 2023
(This article belongs to the Section Genetics and Molecular Biology)

Abstract

:
Quercus mongolica is a multipurpose forest species of high economic value that also plays an important role in the maintenance and protection of its environment. Consistent with the wide geographical distribution of Q. mongolica, differences in the growth and physiological traits of populations of different provenances have been identified. In this study, the molecular basis for these differences was investigated by examining the growth, physiological traits, and gene expression of Q. mongolica seedlings from six provenances in northern China. The results showed that there were significant differences in growth and physiological traits, except for the ground diameter (p < 0.05), and identified abscisic acid (ABA), indole-3-acetic acid (IAA), and soluble sugar contents as important physiological traits that distinguish Q. mongolica of different provenances. The transcriptome analysis showed that the largest difference in the total number of differentially expressed genes (DEGs) was between trees from Jilin and Shandong (6918), and the smallest difference was between trees from Heilongjiang and Liaoning (1325). The DEGs were concentrated mainly in the Gene Ontology entries of metabolic process, catalytic activity, and cell, and in the Kyoto Encyclopedia of Genes and Genomes metabolic pathways of carbohydrate metabolism, biosynthesis of other secondary metabolites, signal transduction, and environmental adaptation. These assignments indicated that Q. mongolica populations of different provenances adapt to changes in climate and environment by regulating important physiological, biochemical, and metabolic processes. A weighted gene co-expression network analysis revealed highly significant correlations of the darkmagenta, grey60, turquoise, and plum1 modules with ABA content, IAA content, soluble sugar content, and soluble protein content, respectively. The co-expression network also indicated key roles for genes related to the stress response (SDH, WAK5, APA1), metabolic processes (UGT76A2, HTH, At5g42100, PEX11C), signal transduction (INPS1, HSD1), and chloroplast biosynthesis (CAB13, PTAC16, PNSB5). Functional annotation of these core genes implies that Q. mongolica can adapt to different environments by regulating photosynthesis, plant hormone signal transduction, the stress response, and other key physiological and biochemical processes. Our results provide insight into the adaptability of plants to different environments.

1. Introduction

Quercus, the largest genus of Fagaceae, includes 400–500 species of deciduous and evergreen trees found throughout the world [1]. In the Northern Hemisphere, it is one of the most widely distributed woody plant groups [2]. Quercus includes excellent timber forest species that also play important roles in maintaining the environmental balance, fostering ecosystem restoration, and protecting biodiversity [3]. In China, Quercus is highly abundant, ranking first among the top 10 tree species groups in terms of forest area and volume, and it is the main timber species in secondary forests in temperate and warm-temperate regions [4]. Quercus mongolica Fisch. ex Ledeb is a second-class protected tree species in China. It has a highly developed root system, prefers sunny conditions, and is highly resistant and adaptable. In addition to its economic value as a timber and fuel species, it promotes water conservation, protects against wind and fire, and stabilizes the soil [5].
The phenotypic and physiological traits of trees belonging to the same species can vary widely depending on the environment. Indeed, through long-term adaptation to local environmental conditions, extensive intra-species variation has occurred in different geographical provenances. Q. mongolica has a relatively wide geographical distribution and is found in very different environments [6], thereby affecting species regeneration and population dynamics [7]. The research on the provenance of Q. mongolica has focused mainly on screening excellent provenances based on growth and physiological traits [8,9]; little is known about the expression and regulation of the core genes involved in the species’ geographical adaptation.
With the rapid development of molecular biology and continuous reductions in the cost of high-throughput sequencing [10], multi-sample transcriptome sequencing can be applied to the systematic study of complex biological problems [11]. However, the traditional methods of comparison can no longer effectively deal with the massive amounts of biological data generated by today’s advanced methodologies [12]; instead, network-based approaches have been developed. One such approach is weighted gene co-expression network analysis (WGCNA), which enables the assessment of gene expression patterns, and thus gene regulatory networks, among multiple samples [13,14]. WGCNA is based on the principle that the gene network conforms to a scale-free distribution, such that genes with different expression levels can be clustered accordingly and genes with similar expression patterns can be assigned to the same gene module. The correlations of different modules with target traits and phenotypes can thus be analyzed, and specific modules containing the target traits and core genes can be identified. A co-expression regulatory network is then constructed based on the results of gene clustering and association analyses [15]. WGCNA, as a systems biology tool [16], has been used widely to assess specific biological processes, abiotic stresses, and disease resistance, among other topics in biology [17].
In this study, transcriptome sequencing of samples from Q. mongolica seedlings of six provenances from northern China was performed. Data on the trees’ growth and physiological traits were obtained, and a WGCNA was performed to construct a weighted gene co-expression network in which gene modules were established. Correlations of the gene modules with growth and physiological trait data from the seedlings of different provenances were assessed. Relevant specific modules were screened, and the core genes in each module and the regulatory networks were explored in detail. Our results provide a scientific theoretical basis and reference for studies of the mechanisms regulating the growth and development of Q. mongolica of different provenances.

2. Materials and Methods

2.1. Collection and Cultivation of Plant Materials

In September 2020, Q. mongolica seeds were collected from six provinces corresponding to the main distribution areas of the species in China: Beijing (BJ), Hebei (HB), Heilongjiang (HLJ), Jilin (JL), Liaoning (LN), and Shandong (SD). The locations of the sampling sites are shown in Supplementary Table S1. Ten trees were selected from each province, and the seeds were sown in nutrient cups containing perlite mountain surface soil nutrient soil (at a volume-based ratio of 1:1:1) for cultivation in the greenhouse of the Qiliting Demonstration Farm of Hongyashan National Forest Farm, HB Province. The seedlings from the different provinces represented their different provenances. Triplicate samples of 70 sown seeds each were established.

2.2. Determination of Q. mongolica Growth and Physiological Traits

For each replicate, 10 well-growing healthy seedlings (3 replicates, 30 plants/provenance in total) that were relatively similar and disease-and pest-free were selected for the study. In September 2021, when the seedlings had mostly stopped growing but continued to thrive, their growth traits (seedling height and ground diameter) were measured using a steel tape and vernier caliper, respectively.
In July 2021, when the seedlings had reached a height of 10 cm, five seedlings were selected randomly from each replicate and one second functional leaf (3 replicates, 15 in total) was removed from the top of each seedling for the determination of photosynthetic pigment content (chlorophyll a content, chlorophyll b content, and carotenoid content), mineral nutrient element content (nitrogen content and phosphorus content), hormone content (indole-3-acetic acid (IAA) and abscisic acid (ABA) contents), soluble protein content, and soluble sugar content. The leaves were rinsed with double-distilled water (ddH2O), dried with absorbent paper, quickly wrapped in tinfoil, frozen in liquid nitrogen, and stored at −80 °C. The five leaves from each replicate were pooled, with each pooled leaf sample weighing 0.2 g.
The chlorophyll a, chlorophyll b, and carotenoid contents were determined using the ethanol immersion method [18]; the soluble protein content was obtained using Coomassie brilliant blue G-250 staining [19]; the soluble sugar content was acquired using the anthrone sulfate method [20]; the nitrogen content was determined using the Kjeldahl method [21]; and the phosphorus content was obtained using molybdenum-antimony colorimetry [21]. Enzyme-linked immunosorbent assay kits (Shanghai Ruixin Biotechnology Co., Ltd., Shanghai, China) were used to measure the leaf IAA and ABA contents according to the manufacturer’s instructions.
In July 2021, one well-growing and consistently growing seedling was selected from each of the three replicates from each provenance. One second functional leaf was removed from each seedling for the determination of the net photosynthetic rate and measured between 9:00 a.m. and 11:00 a.m. on a sunny and windless day using an LI-6800 portable photosynthetic instrument (Li-COR Biosciences, Lincoln, NE, USA).

2.3. Transcriptome Analysis

In July 2021, one complete and mature functional leaf was selected randomly from each of five seedlings for each replicate from each provenance (3 replicates, total of 15). The leaves were washed with ddH2O, dried with absorbent paper, and pooled. The pooled samples were quick-frozen in liquid nitrogen and stored at −80 °C until needed.
Total RNA was extracted from each sample using the TRIzol plant total RNA extraction kit (Invitrogen, Carlsbad, CA, USA) as described in the instructions. RNA quality and DNA contamination were checked by agarose gel electrophoresis. The concentration and purity of the RNA were determined using a NanoDrop (USA) 2000 ultraviolet micro-spectrophotometer, and RNA integrity was checked using an Agilent 2100 bioanalyzer (Agilent Technologies, Santa Clara, CA, USA). The mRNA was reverse transcribed to obtain cDNA, followed by double-end repair, polyA-tail addition, and linkage of the sequencing connector. A library was constructed after polymerase chain reaction (PCR) amplification and its quality was confirmed using the DNA 1000 assay kit (5067-1504; Agilent Technologies). Illumina HiSeq 4000 high-throughput sequencing was then carried out at Gene Denovo Biotechnology Co., Ltd. (Guangzhou, China). The original sequencing data have been submitted to the National Center for Biotechnology Information project database (project number PRJNA979329; NCBI, Bethesda, MD, USA).
The raw transcriptome sequencing data were filtered using Fastp software [22] to obtain high-quality, clean data. The retained unmapped reads were compared with the reference genome of Quercus robur using HISAT2.2.4 [23], and the differences between the groups were analyzed using DESeq2 software [24]. Genes showing significant differential expression between groups were identified using the screening conditions of log2 fold change > 1 and false discovery rate < 0.05 as screening conditions.
Gene Ontology (GO; http://geneontology.org/, access on 15 May 2022) is an internationally standardized gene function classification system used to comprehensively describe the traits of genes and their products in any organism. The library is typically employed to annotate screened differentially expressed genes (DEGs). GO is applied to recognize three functional categories (molecular function, biological process, and cellular component) and then determine the main physiological and biochemical metabolic pathways, biological functions, and signal transduction pathways of the target genes [25]. In this study, GO screening of the genes in specific modules was followed by Kyoto Encyclopedia of Genes and Genomes (KEGG; http://www.genome.jp/kegg/, access on 17 May 2022) metabolic pathway analysis [26]. The significance level for DEGs examined in the GO and KEGG analyses was set to p < 0.05.

2.4. Weighted Gene Co-Expression Network Analysis

The WGCNA was carried out using the Omicsmart (https://www.omicsmart.com/, access on 19 June 2022) platform. The accuracy and reliability of the WGCNA were ensured by filtering out DEGs with fragments per kilobase of exon per million mapped fragments (FPKM) values < 1, leading to the inclusion of 16,196 genes in the analysis. To ensure that the WGCNA conformed to the scale-free network distribution, the soft threshold (β), correlation coefficients, and average connectivity of genes (1–20 connections) were calculated separately. R2 values > 0.8 and a β value of 8 as the weighting coefficient ensured gene connectivity. A gene cluster tree was constructed according to the correlations of the expressed genes. The dynamic hybrid cutting method was used to cut the generated cluster tree into modules. The minimum number of modules was set to 50, the cut height was set to 0.20, and the fusion threshold for similar modules was set to 0.80. GO [25] and KEGG [26] enrichment analyses of the selected genes in specific modules were then performed.
The genes in the selected modules were sorted according to their weight, and the top 50 relationship pairs with the greatest weights were selected. The regulatory network between genes was constructed using Cytoscape software (version 3.7.1) [27]. Each node in the network represents a gene, and each edge represents the regulatory relationship between genes. A gene regulatory relationship network diagram enables the accurate identification of genes with a potential regulatory relationship to the target gene, with the functions of known genes then used to predict those of unknown genes.

2.5. Verification of Core Genes by qRT-PCR

After transcriptome sequencing, total RNA was reverse transcribed into cDNA using the M5 Sprint qPCR RT kit and the gDNA removal kit (mei5 Biotechnology Co., Beijing, China). Twelve screened core genes were randomly selected for fluorescence-based quantitative expression analysis, with the β-actin gene used as the internal reference [28]. Transcriptome data were verified by quantitative reverse transcription (qRT)-PCR. The primers were designed according to the gene sequences using Prime6 software. Primer information is provided in Supplementary Table S2. The 20 μL reaction contained 2 μL DNA, 10 μL 2× MagicSYBR mixture, forward and reverse primers (each 1 μL (10 μM)), 0.2 μL ROX reference dye I, and 5.8 μL ddH2O. The reaction conditions were as follows: 40 cycles of 95 °C for 30 s, 95 °C for 5 s, and 60 °C for 30 s, followed by extension at 72 °C for 60 s. The relative expression of each target gene was calculated using the 2−ΔΔCt method [29].

2.6. Statistical Analysis

The growth and physiological biochemical indicators of Q. mongolica of different provenances were analyzed using single-factor analysis of variance (ANOVA) and Duncan multiple comparisons with IBM SPSS Statistics 23 (IBM Corp., Armonk, NY, USA). Transcriptome data were analyzed using Omicsmart (https://www.omicsmart.com/, accessed on 10 April 2022).

3. Results

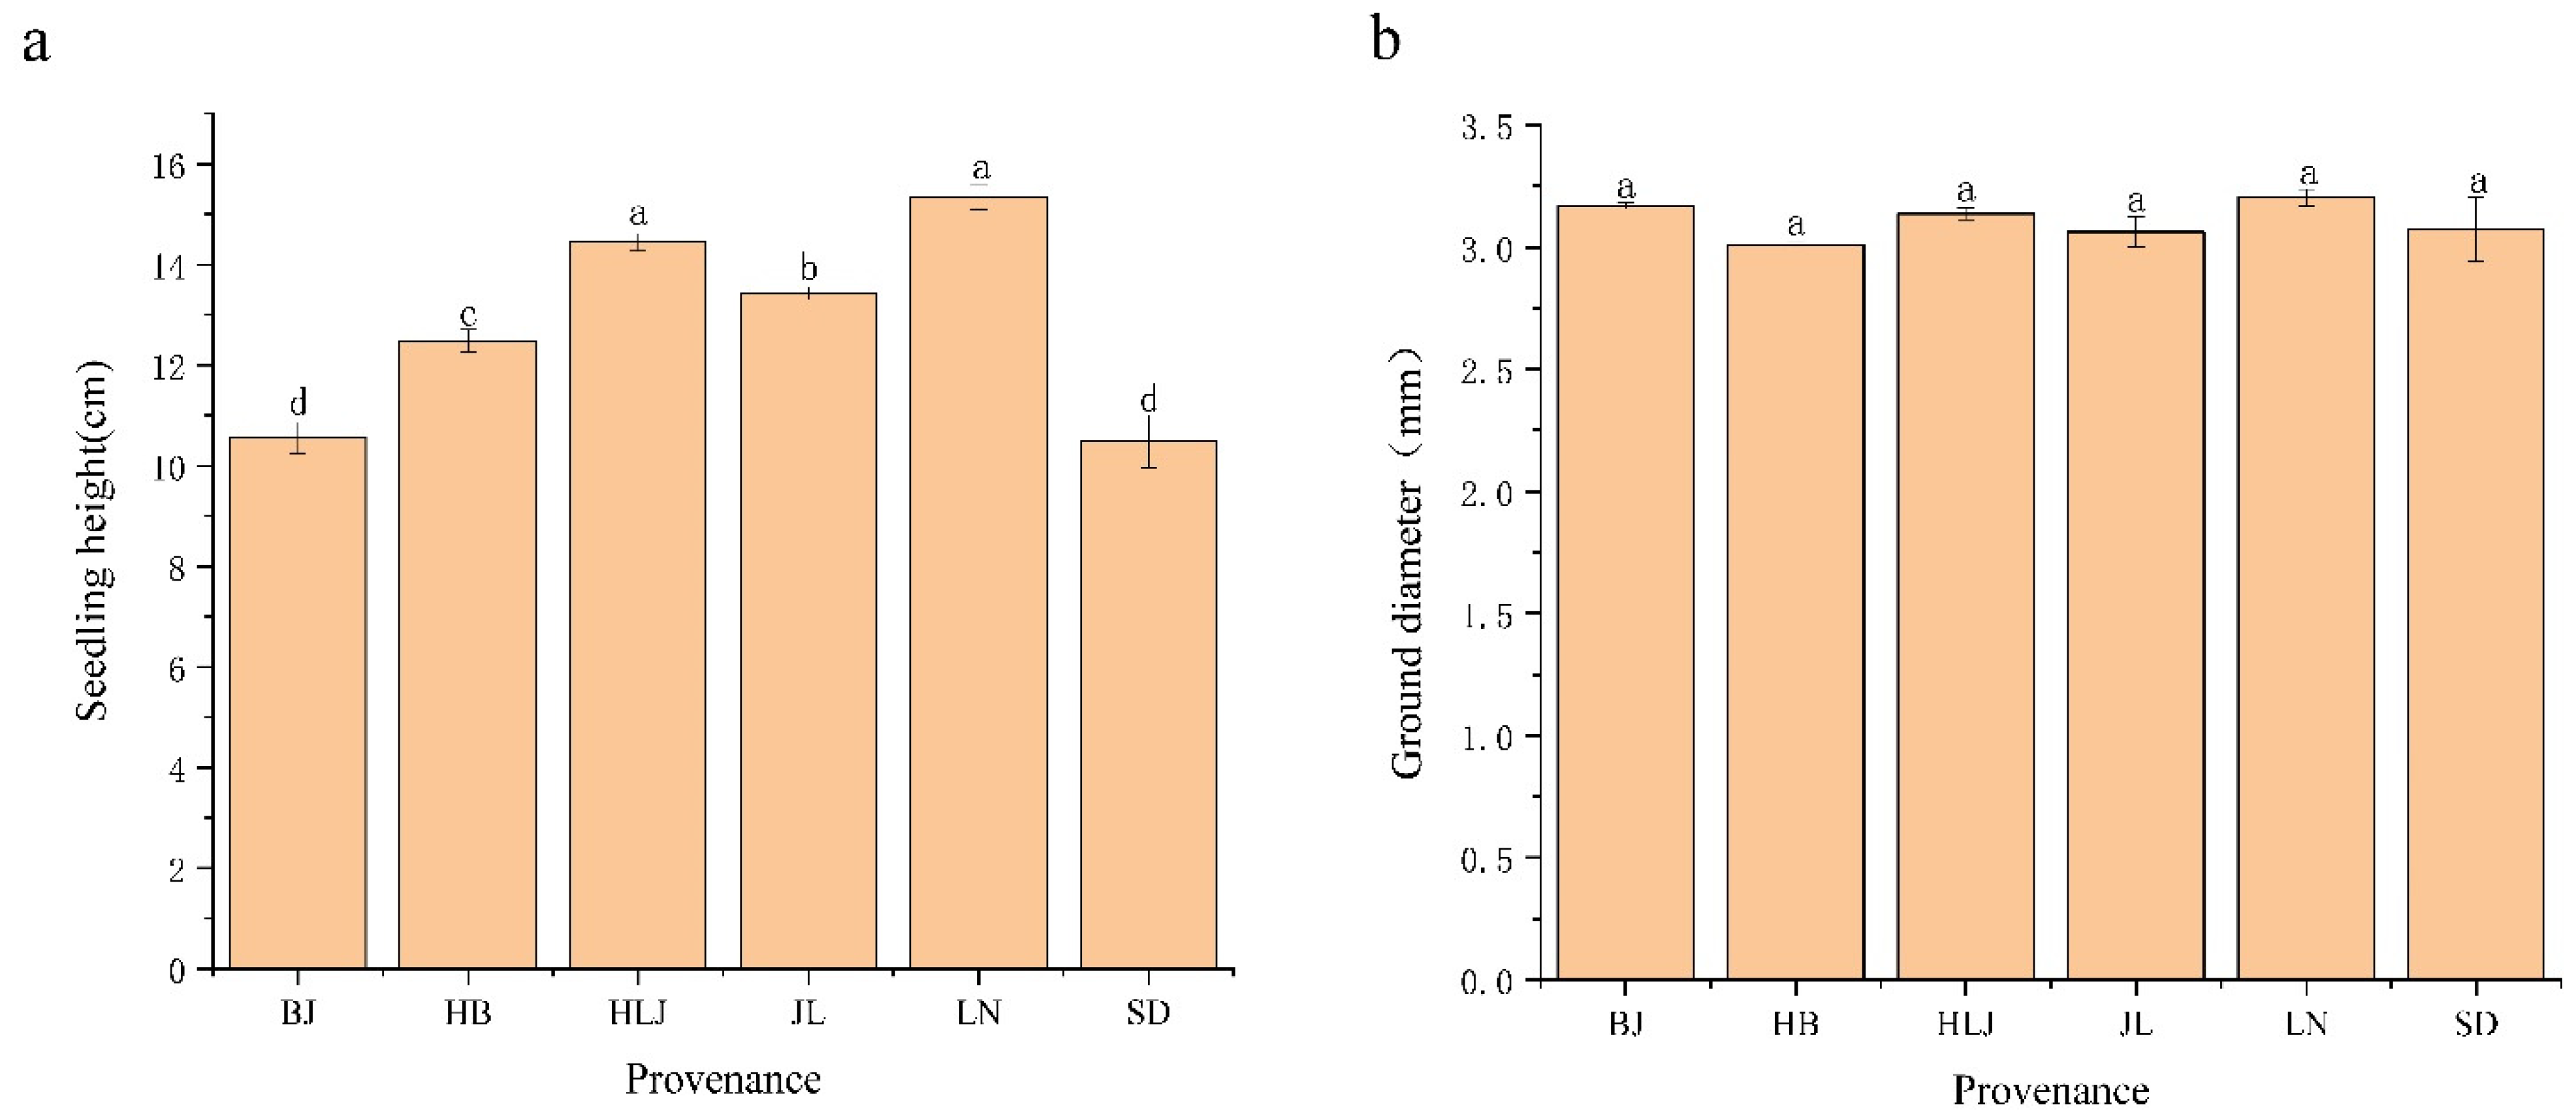
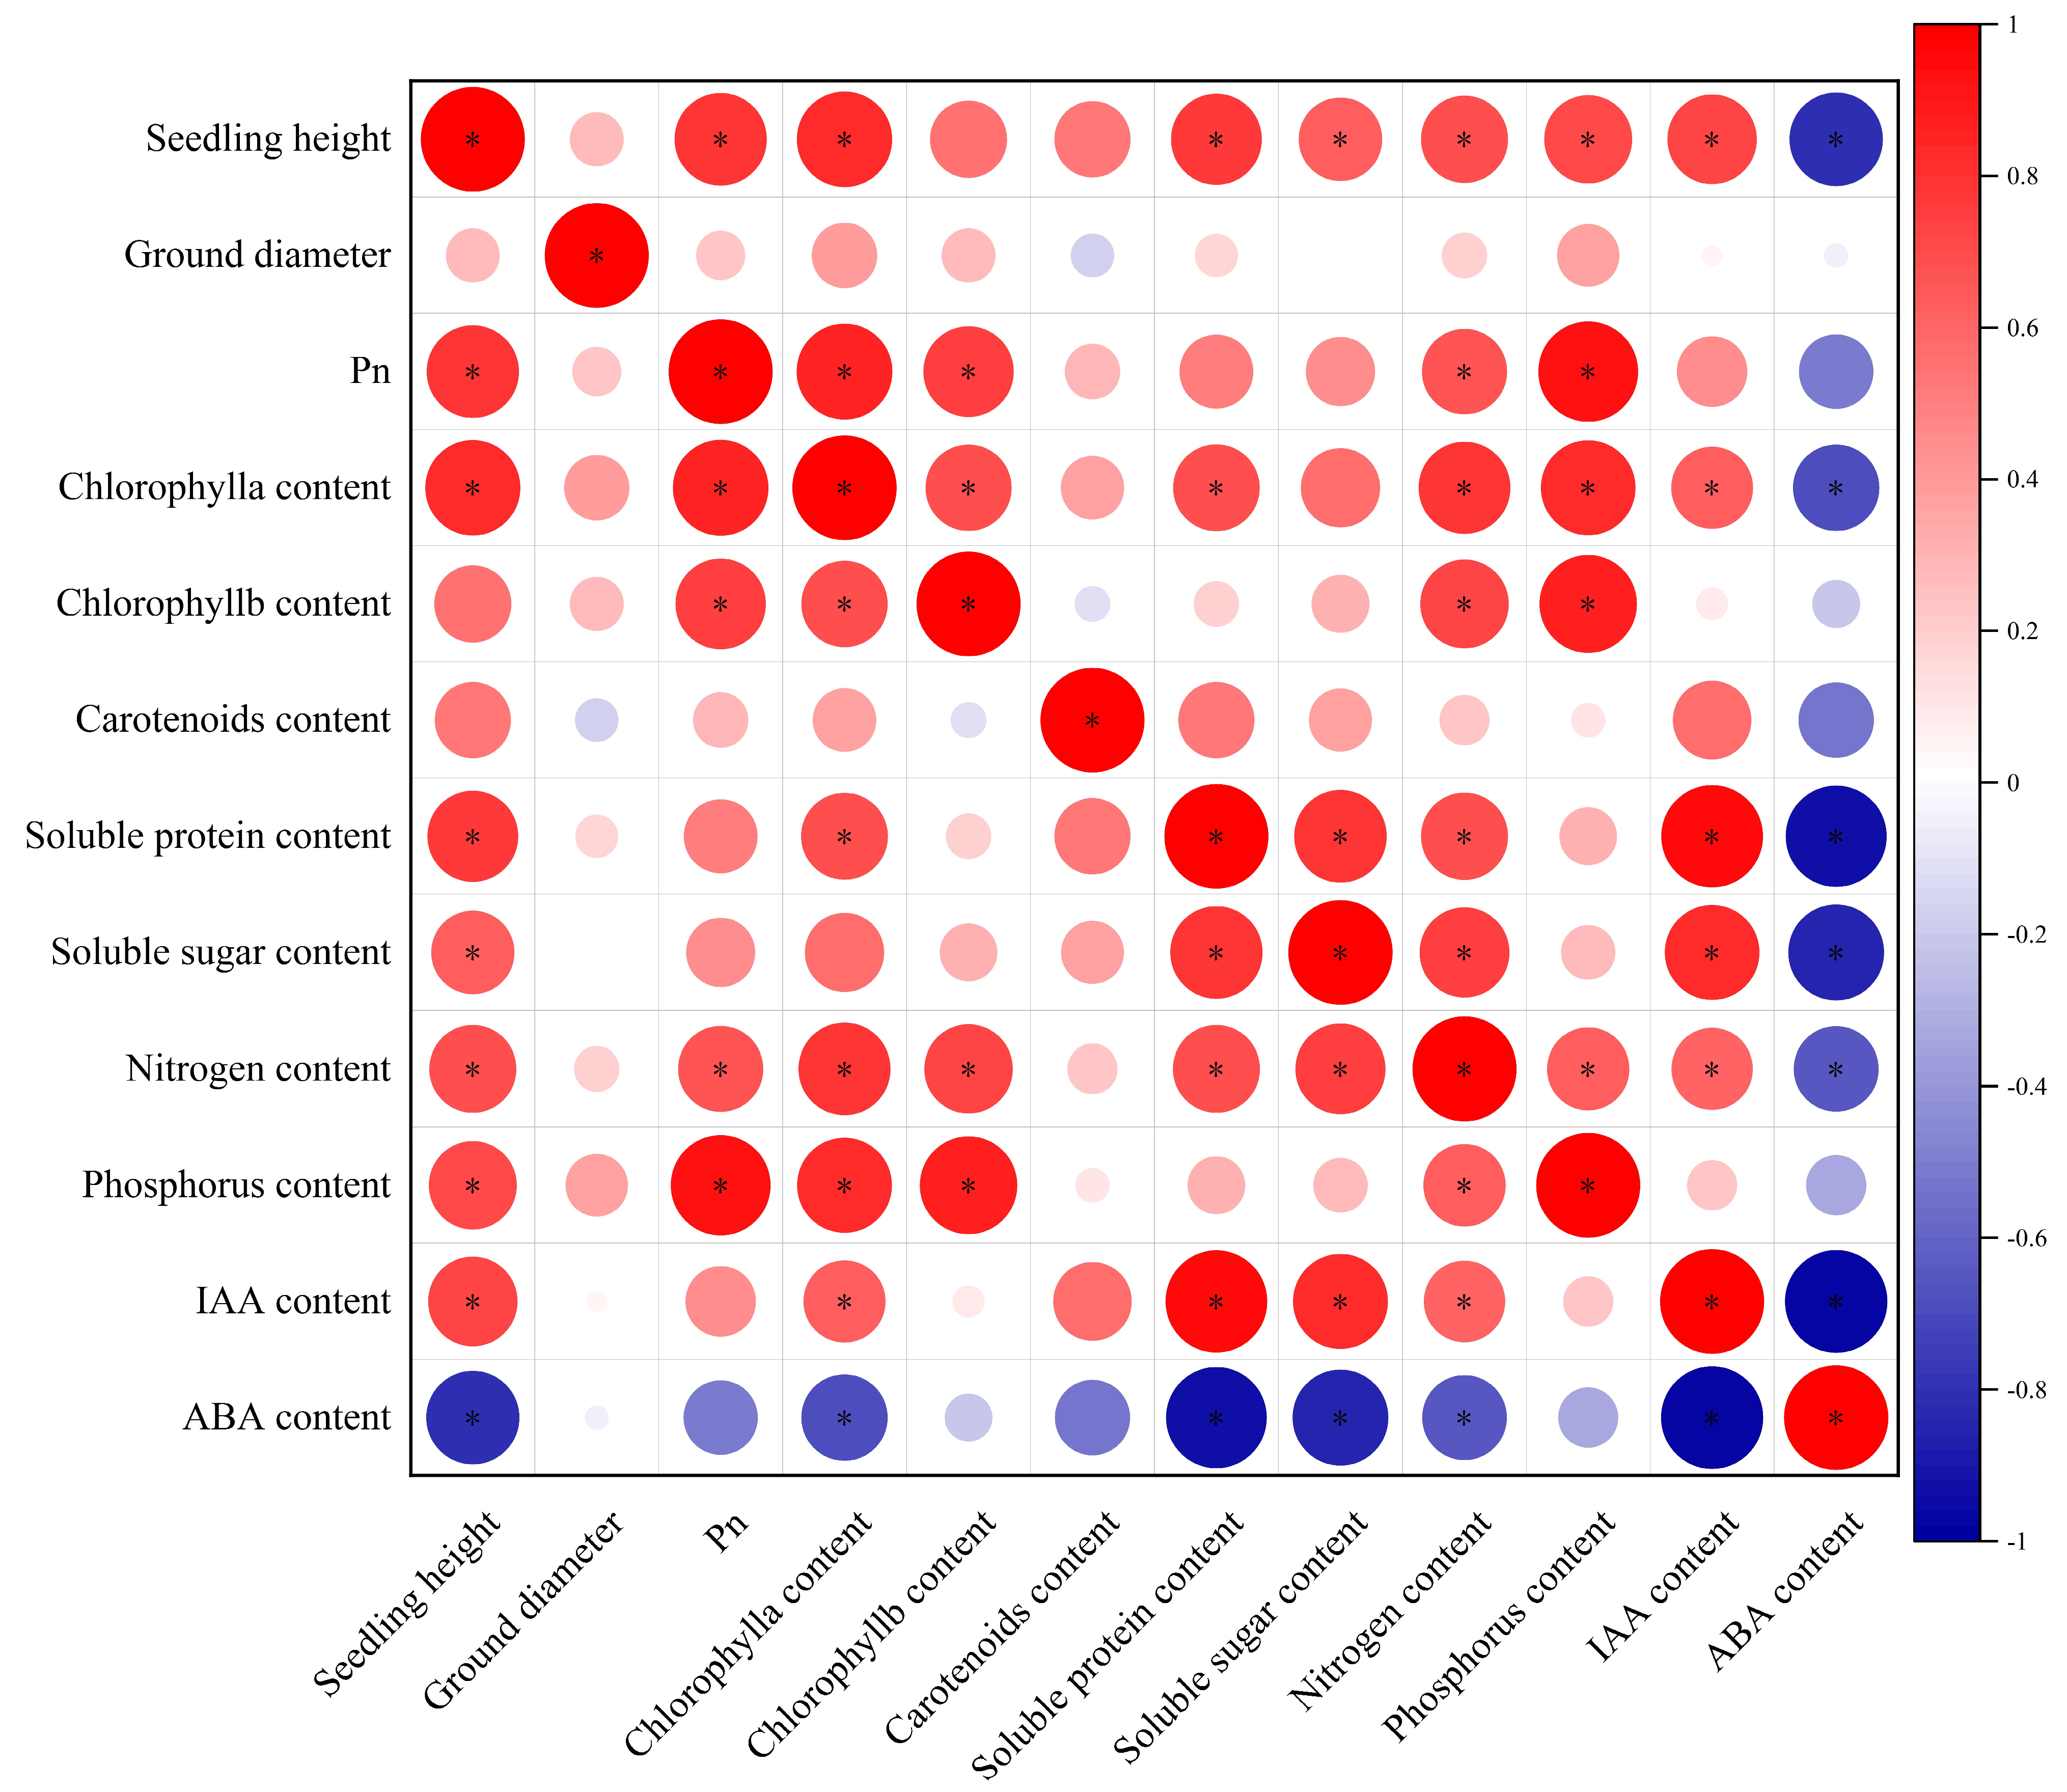
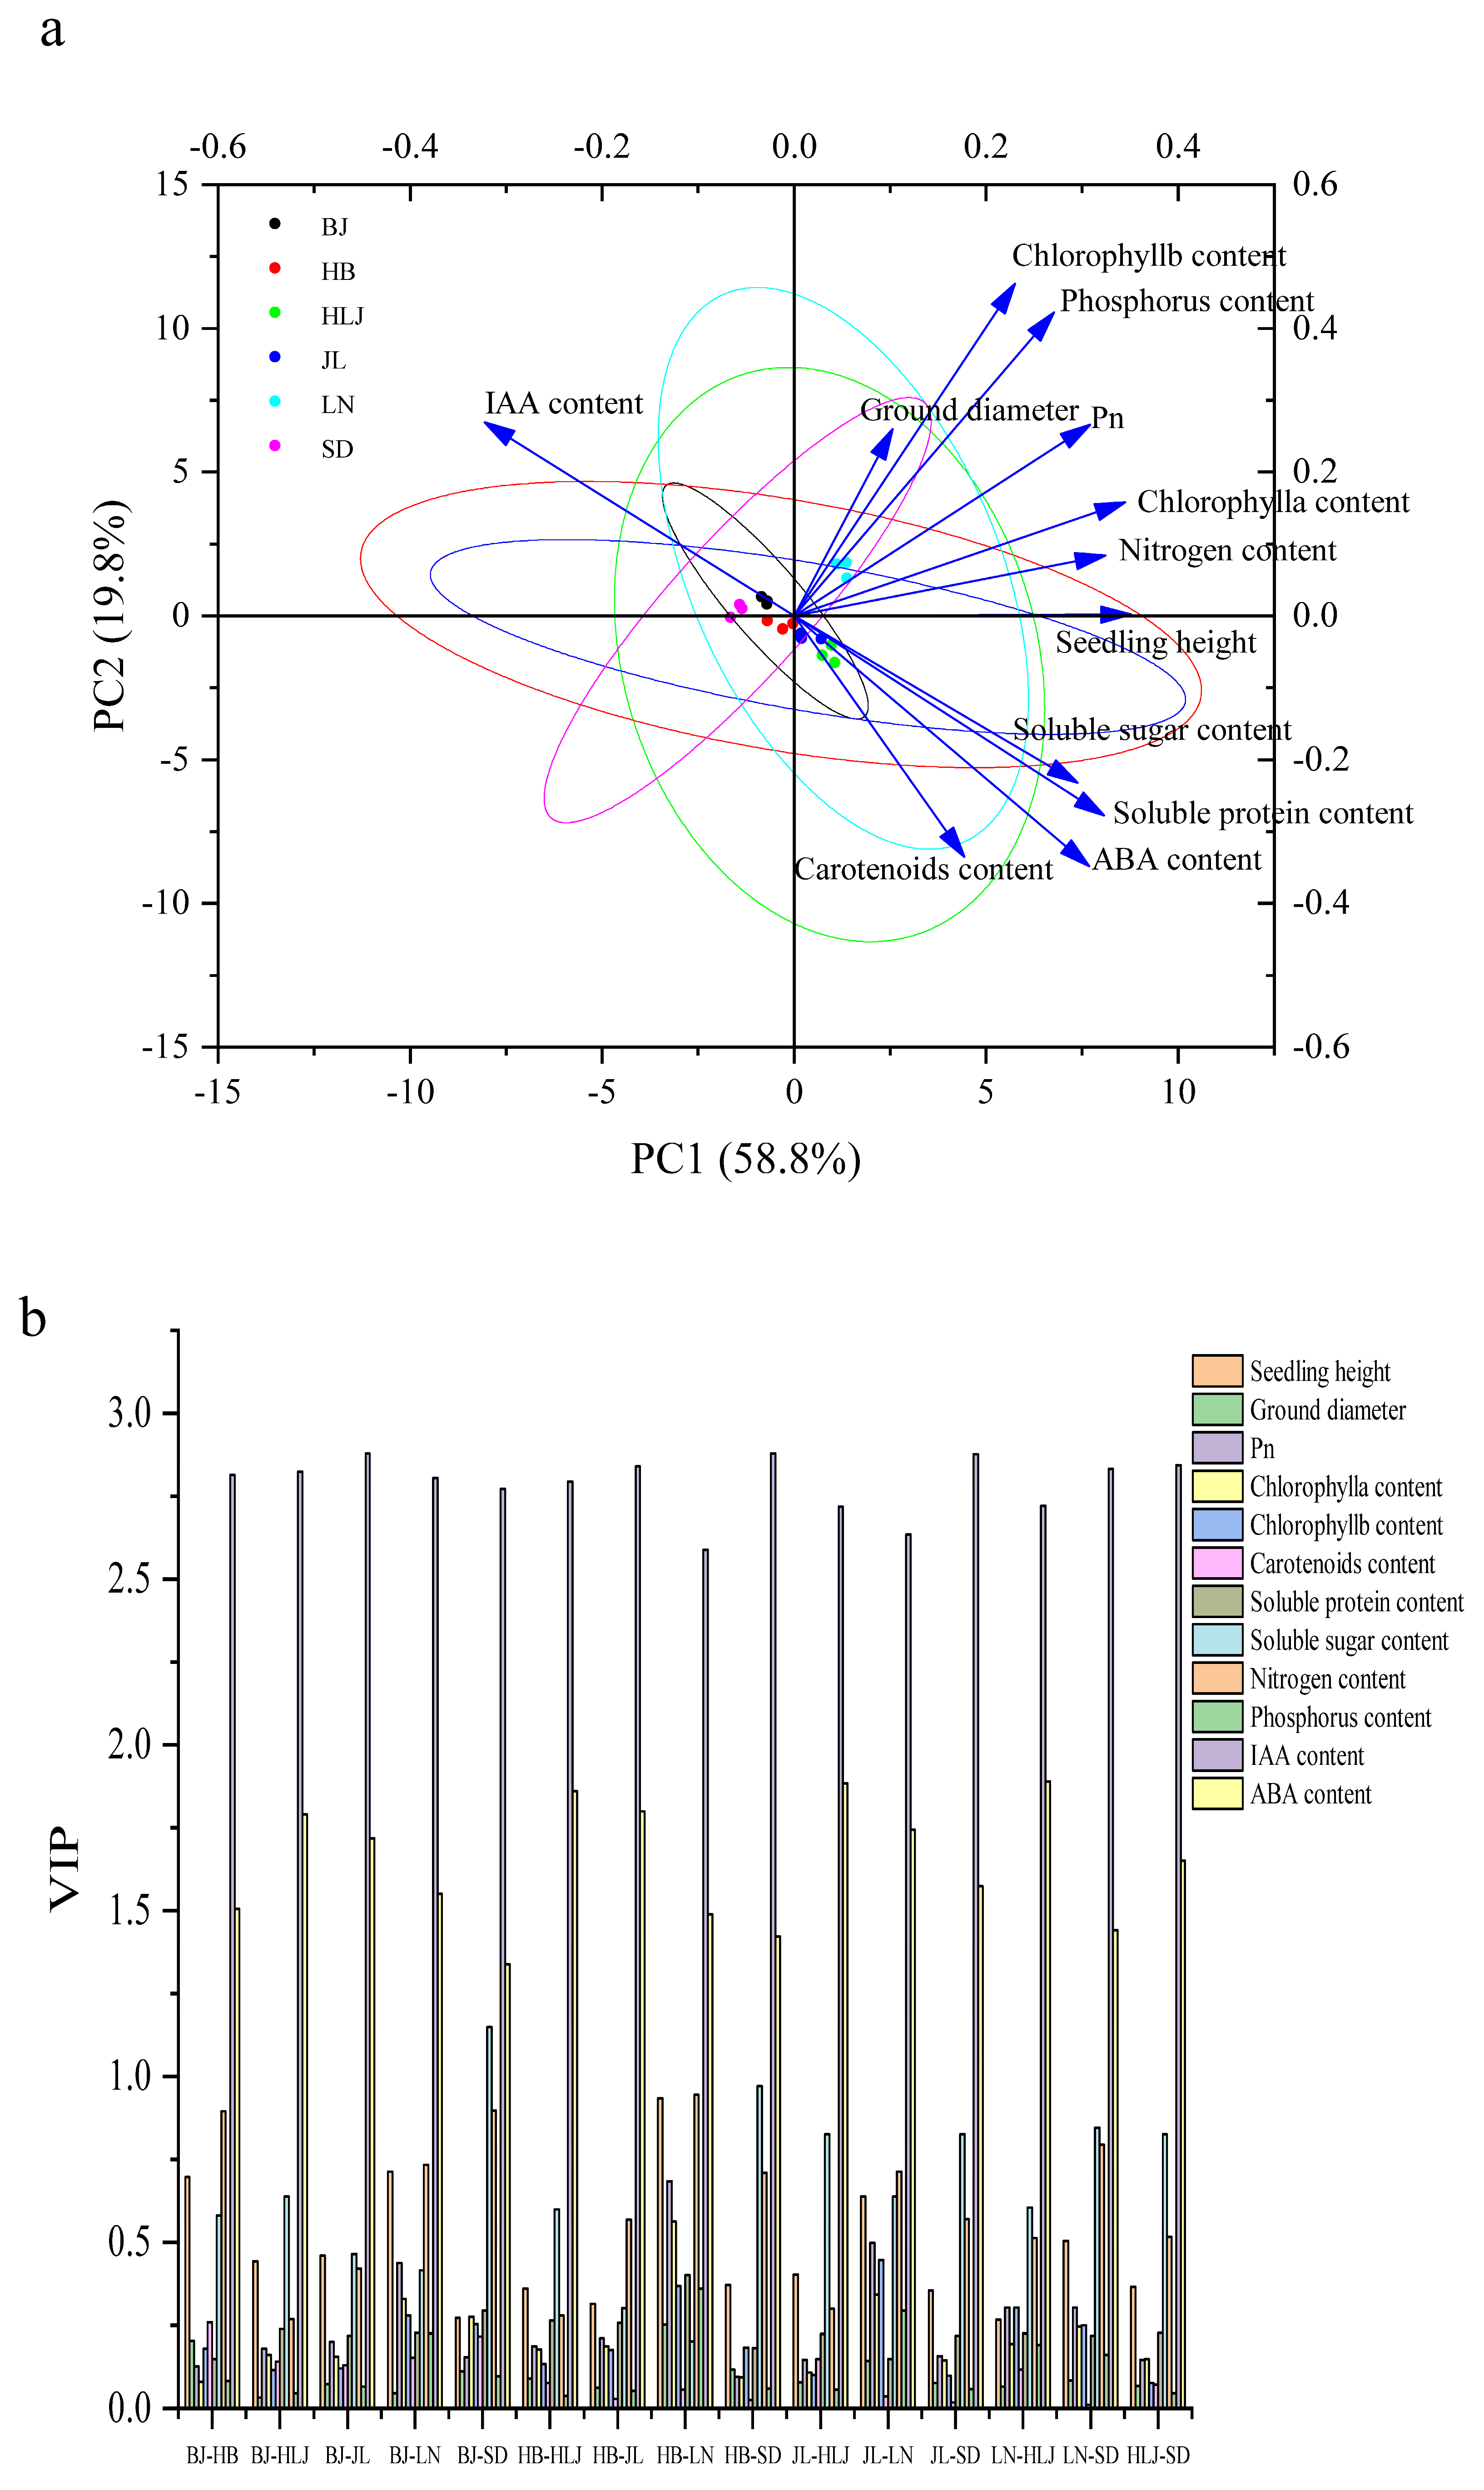
3.1. Growth and Physiological Biochemical Indicators of Q. mongolica of Different Provenances

The seedling heights and ground diameters of Q. mongolica seedlings of six provenances were analyzed using one-way ANOVA (Figure 1a,b). Both traits differed, but only the difference in height was significant (p < 0.05)
The results of one-way ANOVA of physiological biochemical indicators of the Q. mongolica seedlings of six provenances are shown in Figure 2. The net photosynthetic rate, chlorophyll a content, chlorophyll b content, carotenoid content, soluble protein content, soluble sugar content, nitrogen content, phosphorus content, IAA content, and ABA content differed significantly between seedlings of different provenances (p < 0.05), suggesting that geographical adaptation had occurred.
The soluble sugar, soluble protein, and ABA contents increased, and the IAA content decreased gradually from southern to northern provenances. According to the average values of ABA, soluble sugar, and soluble protein contents in Q. mongolica seedlings of different provenances, the order from high to low was HLJ > JL > LN > HB > BJ > SD. Among them, the ABA, soluble sugar, and soluble protein contents of HLJ sources were 34.28%, 73.37%, and 134.65% higher than SD sources, respectively, while the IAA content was 52.89% lower. The binary linear regression analysis (Supplementary Table S3) showed that latitude had a significant impact on these contents.
Figure 3 shows the correlation analysis between the growth and physiological biochemical, and darker colors indicate a higher correlation. There were highly significant positive correlations between seedling height and net photosynthetic rate, chlorophyll a, soluble protein, soluble sugar, nitrogen, phosphorus, and IAA contents; between net photosynthetic rate and chlorophyll a, chlorophyll b, nitrogen, and phosphorus contents; and between chlorophyll a, soluble protein, soluble sugar, and nitrogen contents and the IAA content. The nitrogen and phosphorus contents significantly affected the contents of chlorophyll b, soluble protein, and soluble sugar. Except for ABA content, there were positive correlations between various growth and physiological biochemical indicators, while ABA content correlated negatively with various growth and physiological biochemical indicators.
The data on the measured growth and physiological biochemical indicators were standardized and then examined in a chemometrics analysis. The results of a principal component (PC) analysis of the growth and physiological traits of Q. mongolica of different provenances are shown in Figure 4a. PC1 and PC2 accounted for 58.8% and 19.8% of the total variance, respectively, The SD, BJ, and LN provenances were on the positive axis, and the HB, JL, and HLJ provenances were on the negative axis. In PC1, the highest load of IAA content and the IAA content had a negative load and all other physiological traits had positive loads. In PC2, the highest load corresponded to that of the chlorophyll b content and seedling height. The net photosynthetic rate, ground diameter, and the nitrogen, chlorophyll a, phosphorus, chlorophyll b, and IAA contents had positive loads, and soluble sugar, soluble protein, ABA, and carotenoid contents had negative loads. Differences among varieties were distinguished by PC1, and differences with respect to the provenance were distinguished by PC2. In summary, it is possible to distinguish Q. mongolica of different provenances through PC analysis.
An orthogonal partial least squares discriminant analysis (OPLS-DA) of the growth and physiological biochemical indicators of Q. mongolica of different provenances was conducted. The impact intensity standard was variable importance in projection (VIP) score = 1 (Figure 4b). Among the 15 comparisons, VIP scores for the IAA and ABA contents exceeded 1, indicating the importance of these traits as physiological indicators. In the BJ-SD comparison, in addition to the IAA and ABA contents, the content of soluble sugar was an important physiological trait (VIP score > 1).

3.2. DEGs in the Leaves of Q. mongolica of Different Provenances

The transcriptome data for Q. mongolica leaves of different provenances were analyzed to identify DEGs (Figure 5). The largest number of DEGs was observed between seedlings of the JL and SD provenances (6918), comprising 3284 differentially upregulated and 3634 differentially down-regulated genes (Figure 5). The smallest number of DEGs was observed between seedlings of the HLJ and LN provenances (1325), comprising 748 differentially upregulated and 577 differentially down-regulated genes. In total, 57,804 DEGs were identified; upregulated DEGs accounted for 50.07% (28,943) and down-regulated DEGs accounted for 49.93% (28,861) of this total. In summary, the difference between JL and SD provenances was the largest, while the difference between HLJ and LN sources was the smallest.
The biological functions of the DEGs in the Q. mongolica seedlings of different provenances were explored in a GO enrichment analysis. The DEGs were enriched in three main functional categories: biological process, molecular function, and cell component. Of the 266,425 DEGs in these categories, 142,413 (53.45%) were upregulated and 124,012 (46.55%) were down-regulated. In each comparison group, DEGs corresponding to metabolic process, catalytic activity, and cells were the most abundant in the respective categories (Supplementary Figure S1), indicating significant physiological and metabolic differences among the seedlings related to their adaptations to different living environments. KEGG functional annotation revealed that the DEGs were enriched in metabolic pathways such as carbohydrate metabolism, biosynthesis of other secondary metabolites, signal transduction, and environmental adaptation (Supplementary Figure S2). Together, these results show that complex transcriptional regulation enables Q. mongolica to respond to different environmental conditions.

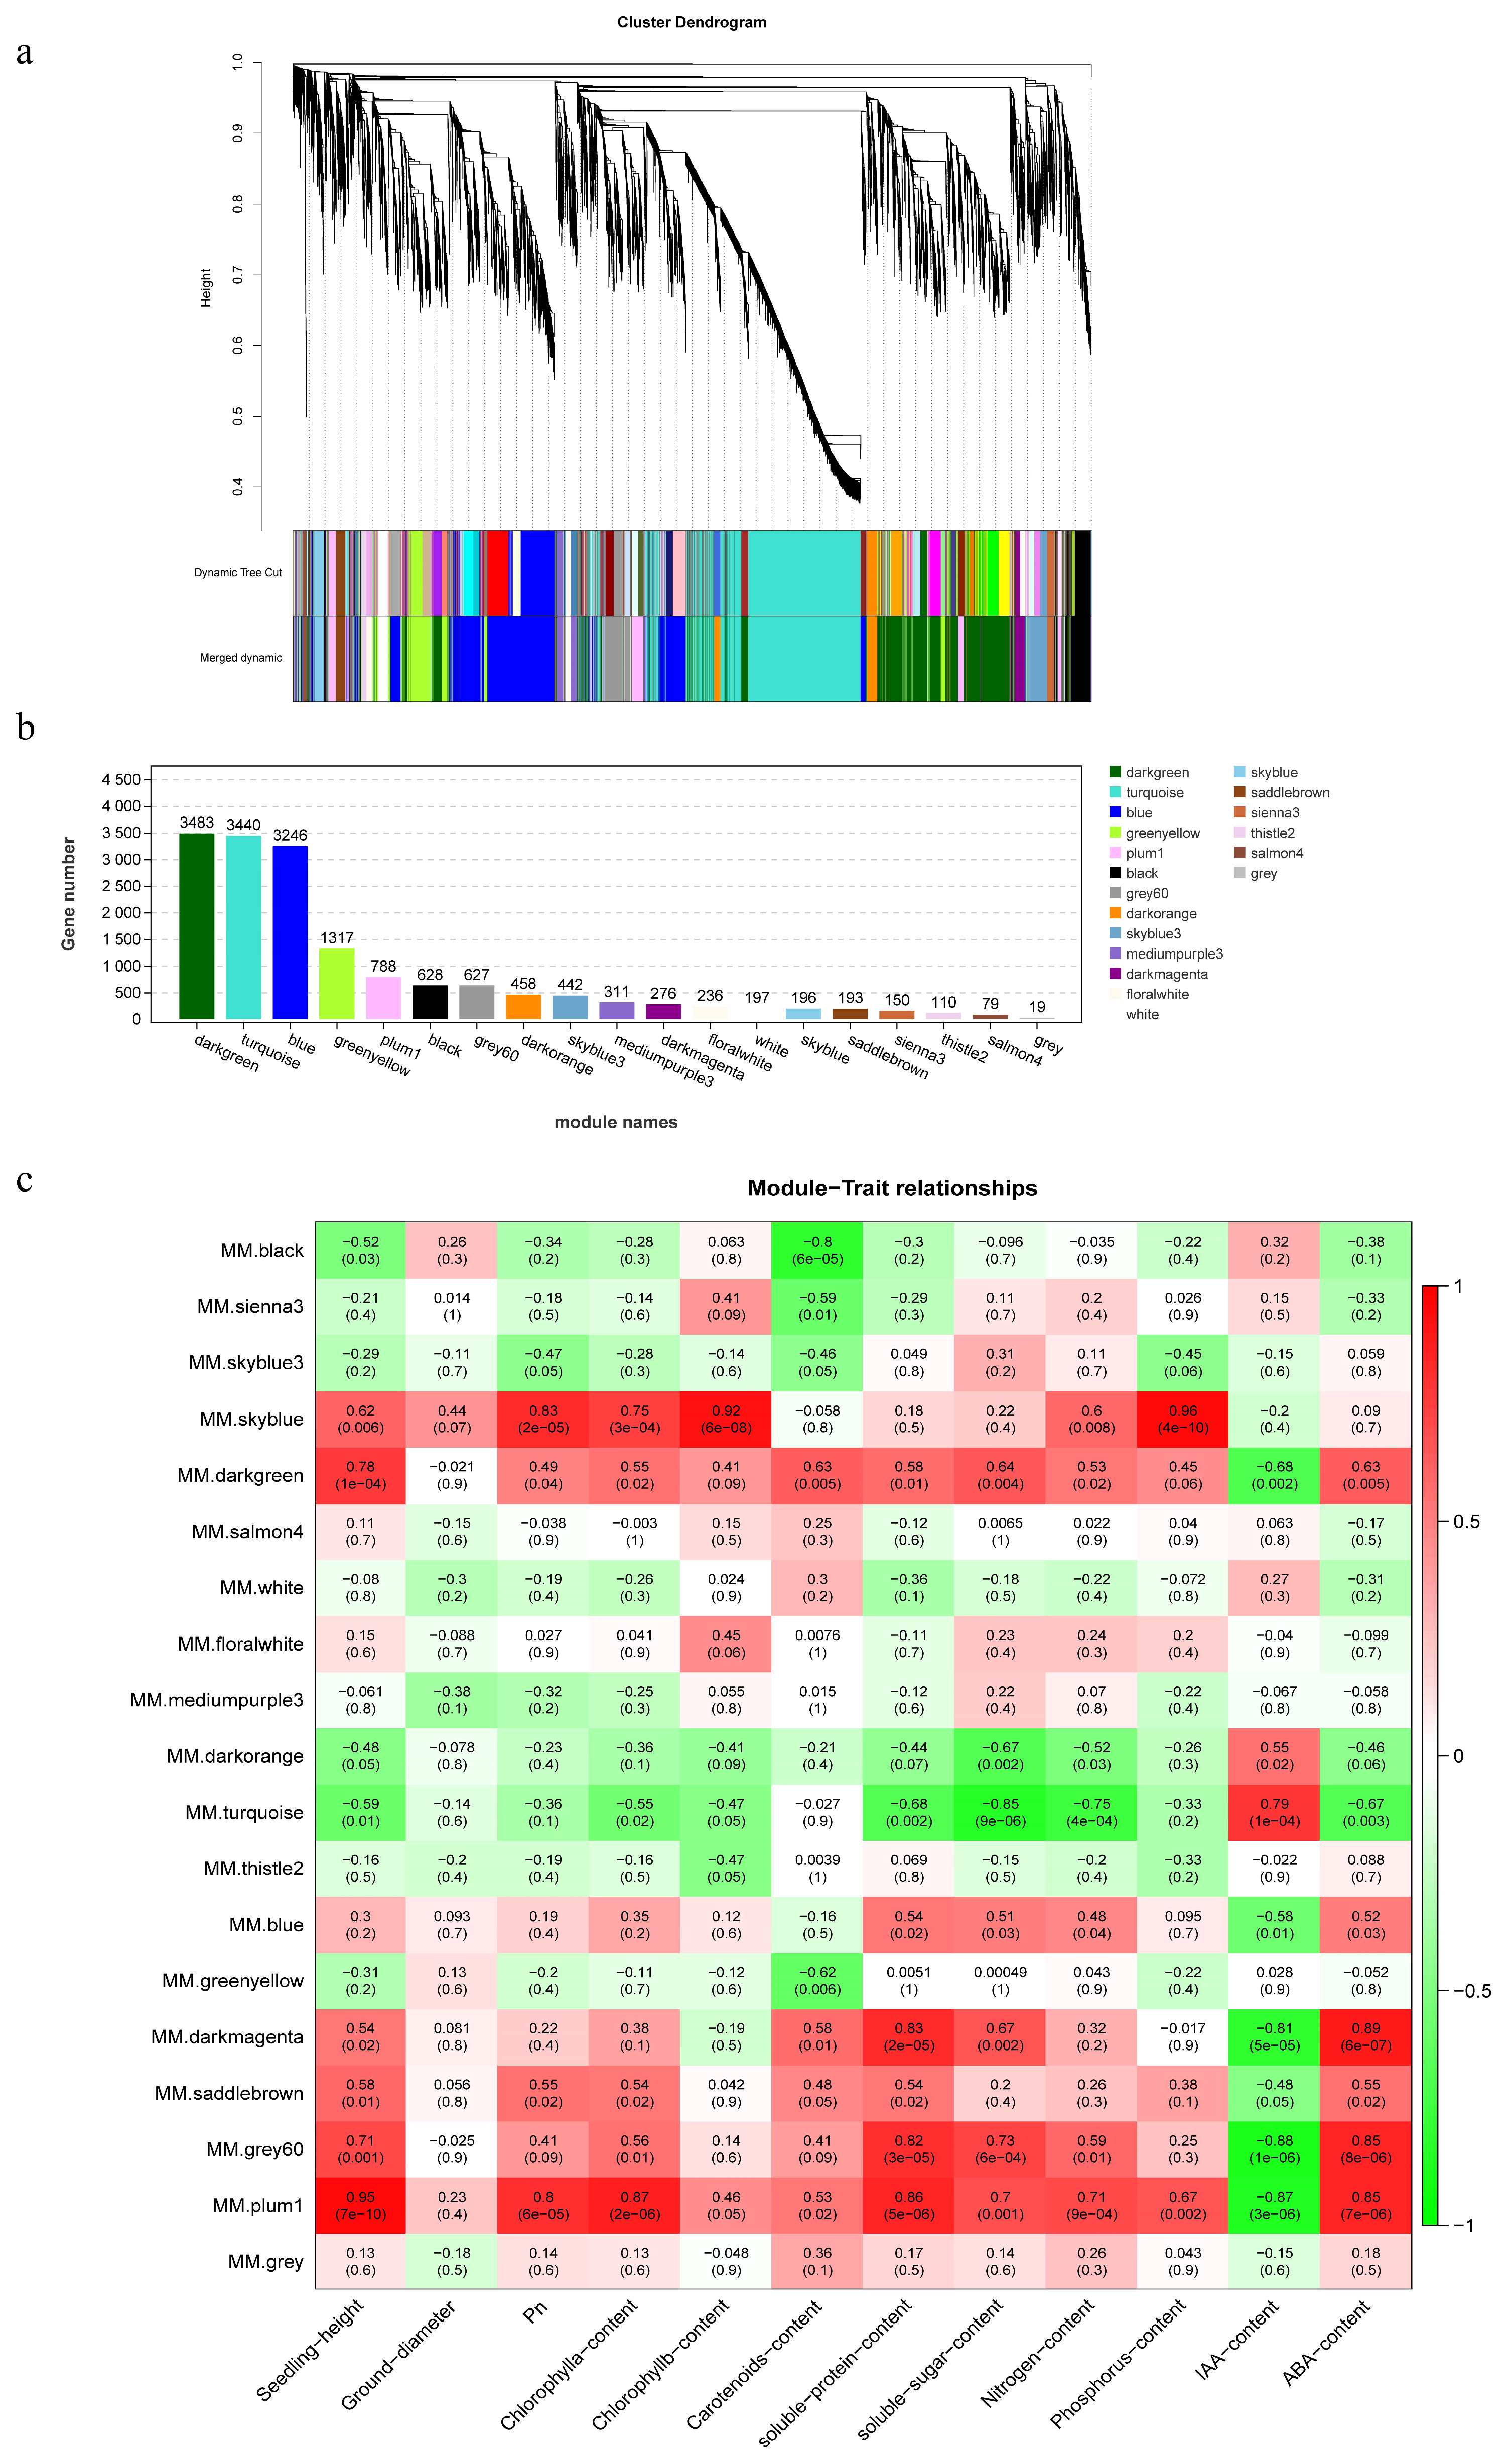
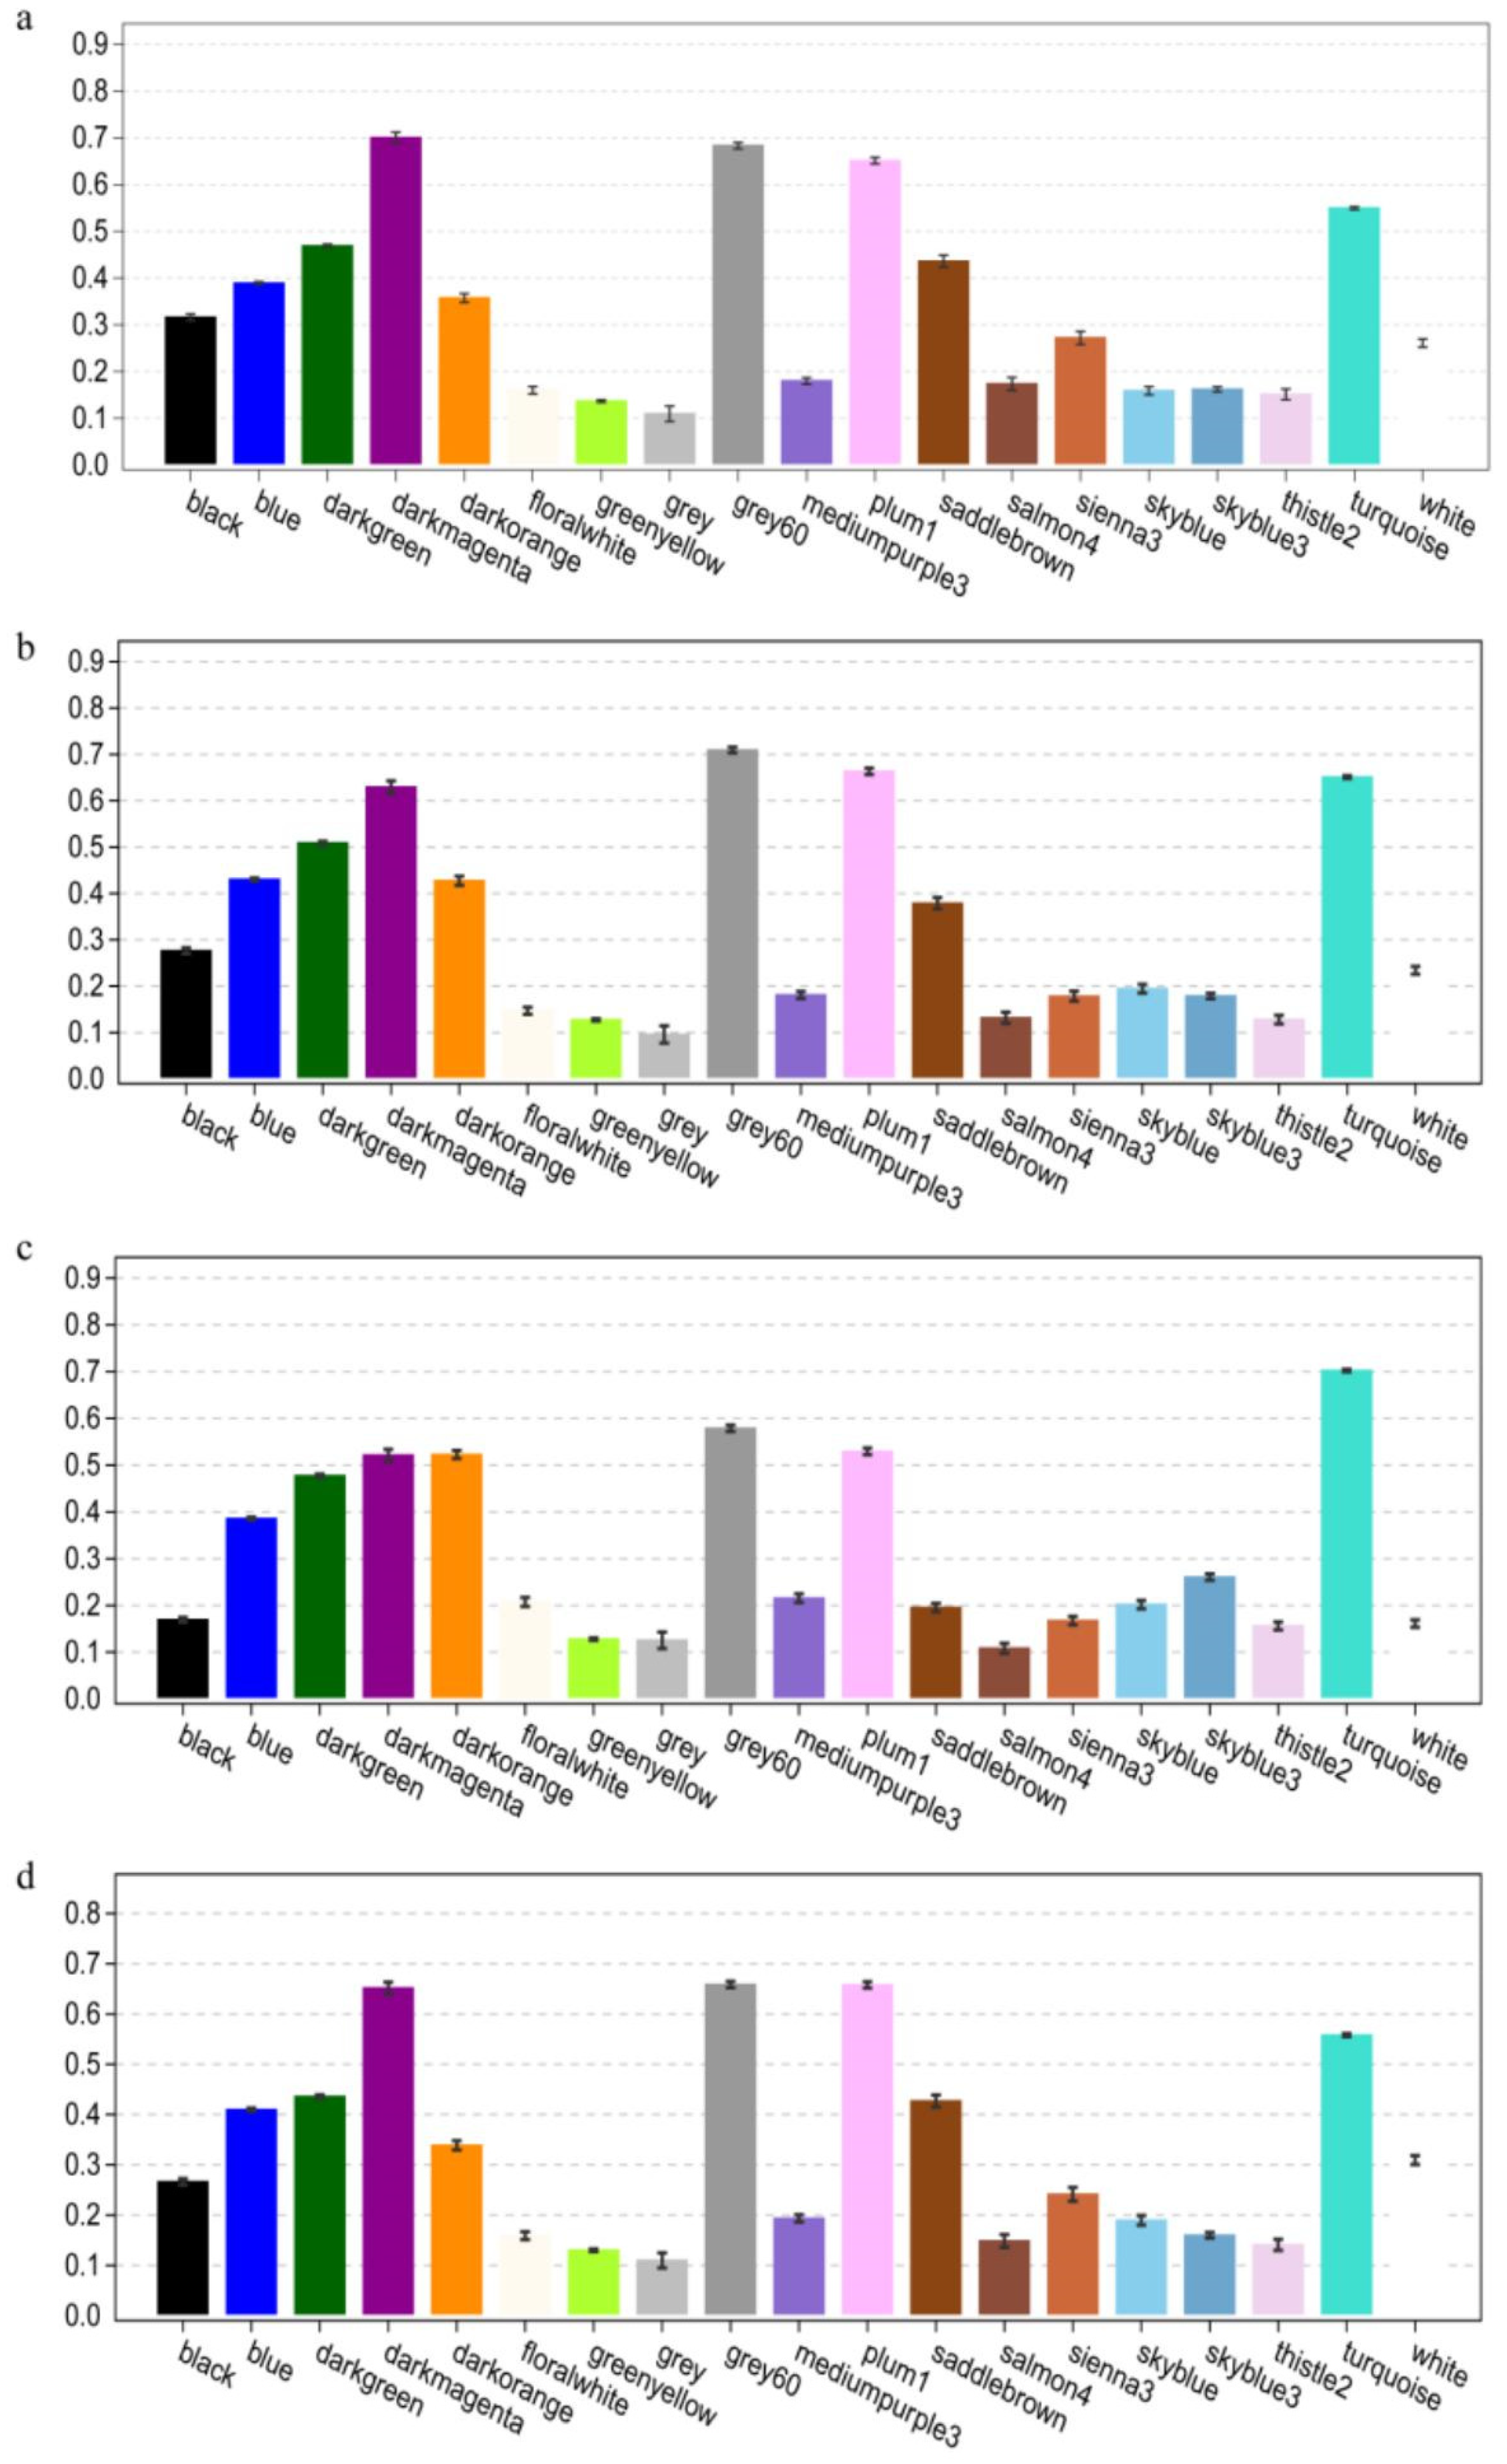
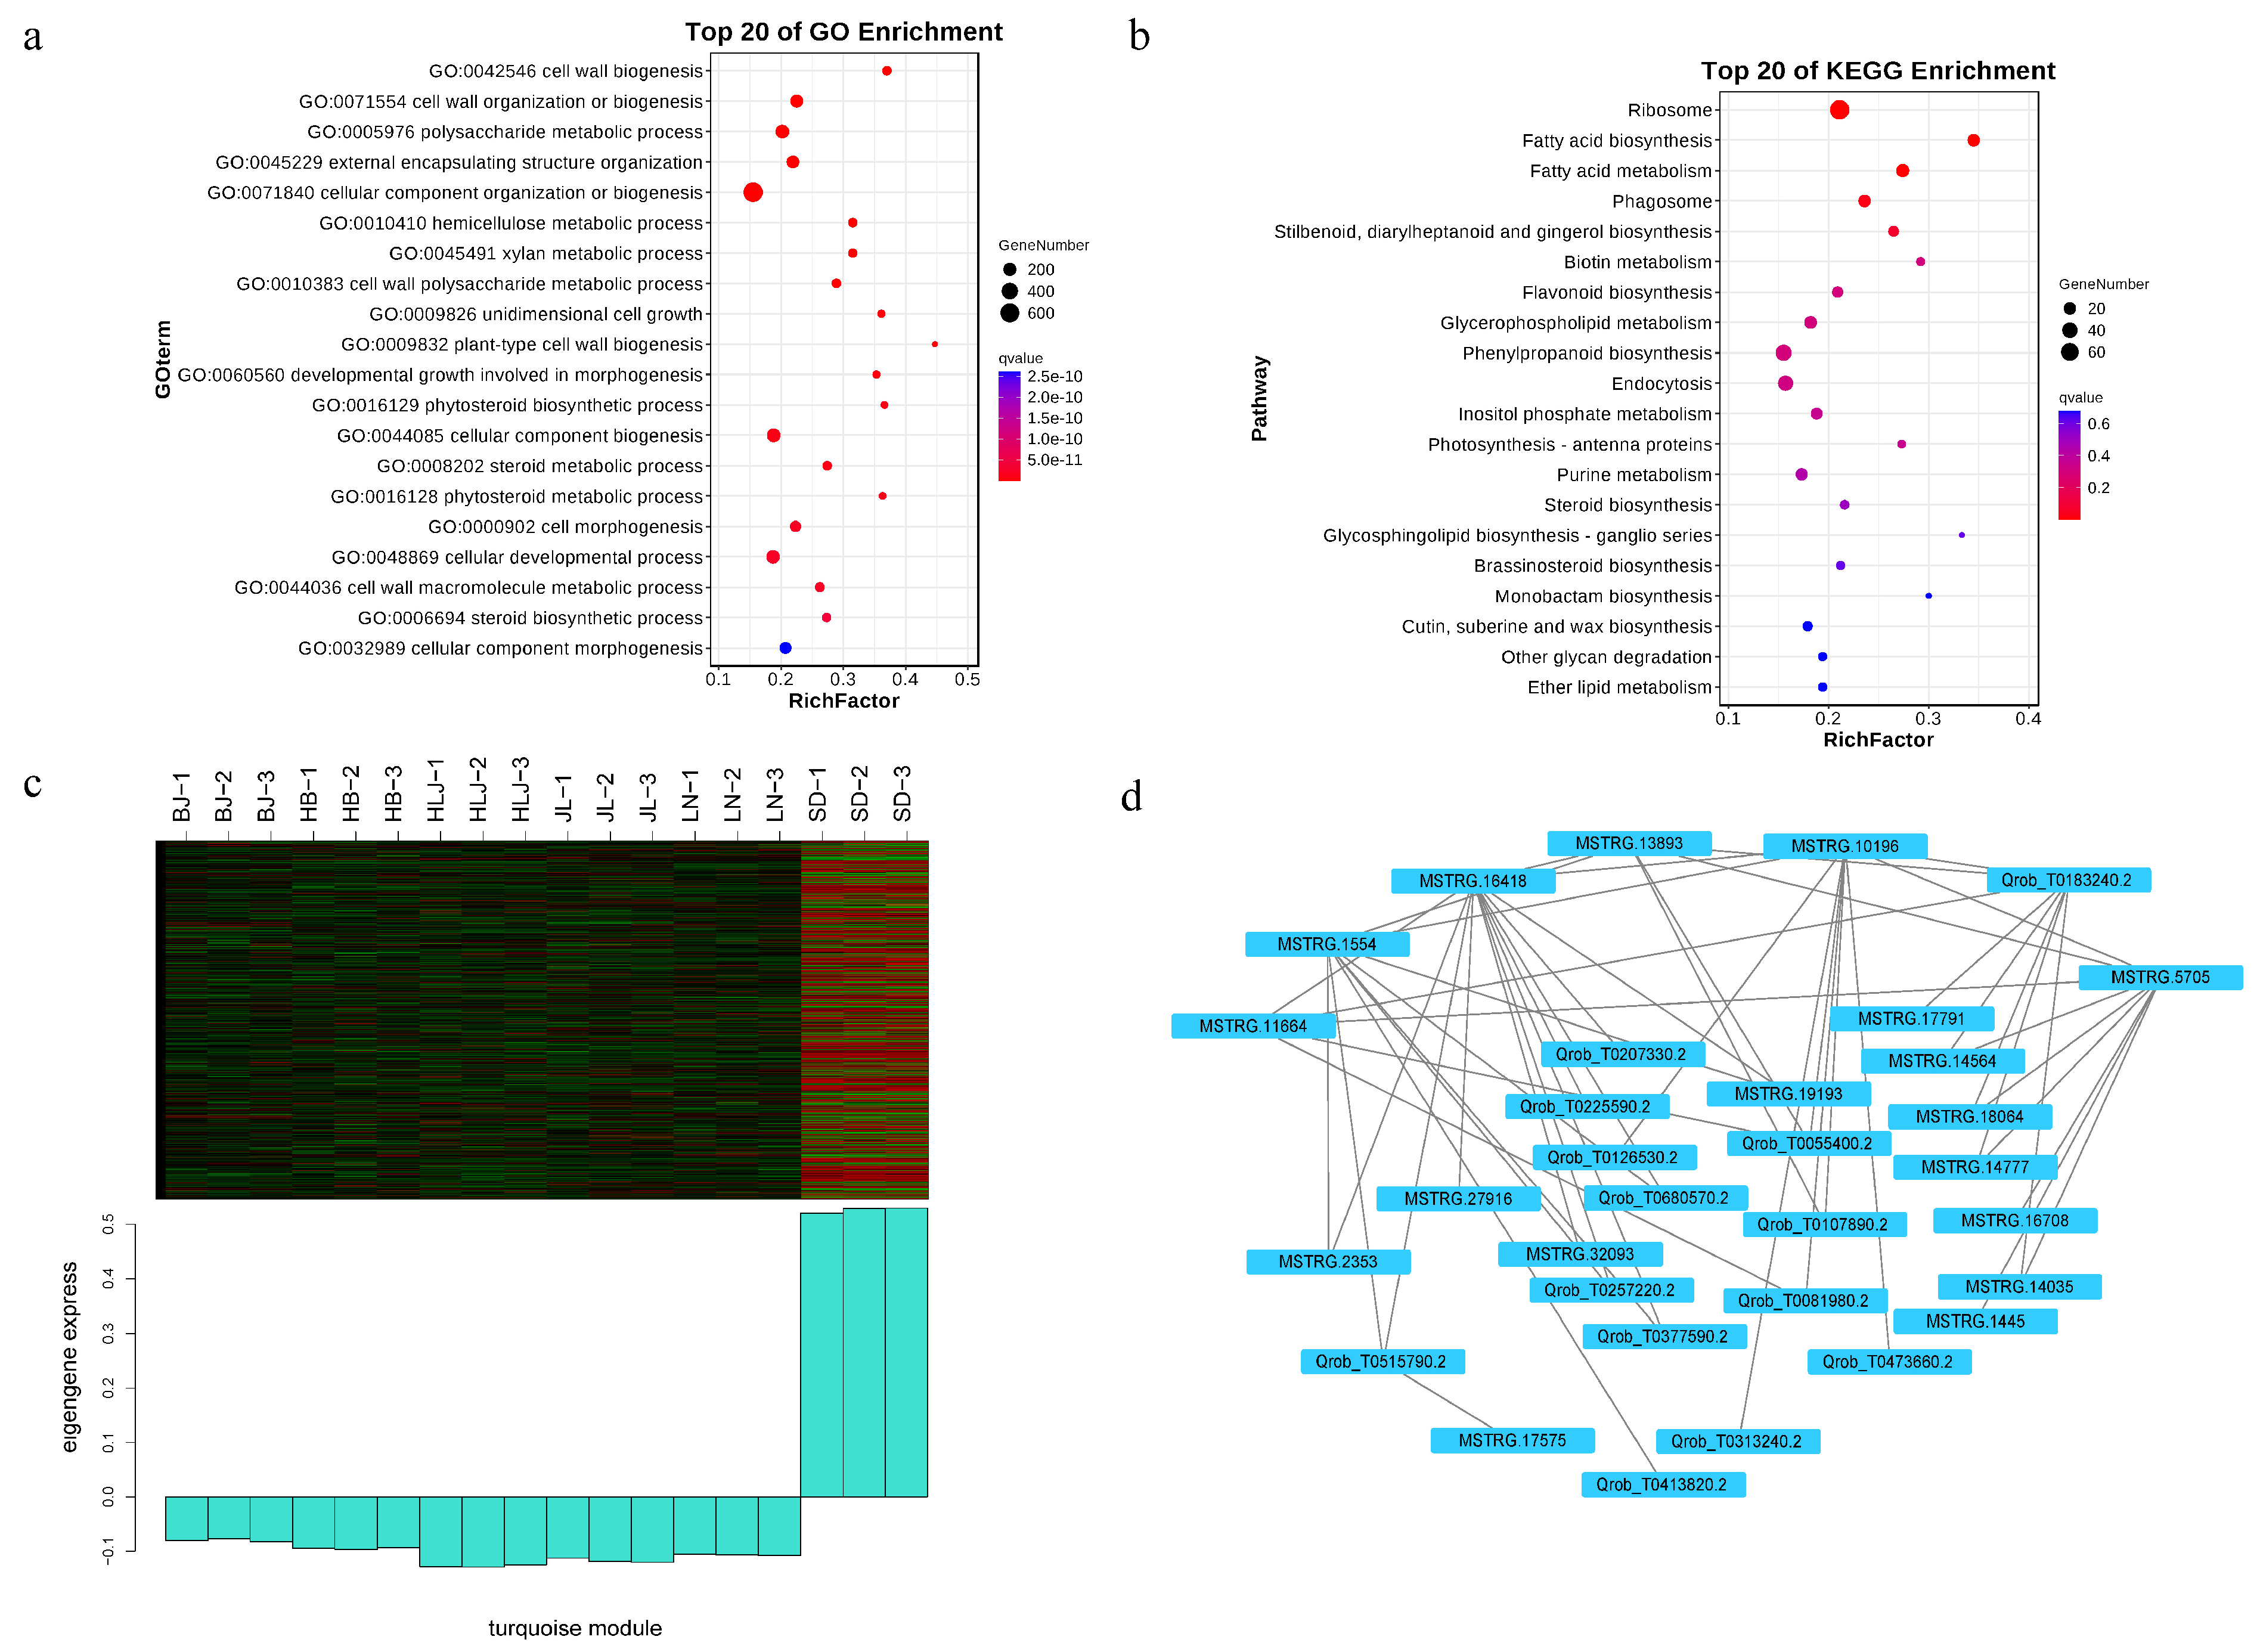
3.3. Co-Expression Network and Core Gene Mining Results

To further investigate the regulatory network of genes related to the growth and physiological biochemical indicators of Q. mongolica seedlings of different provenances, core genes were identified in a WGCNA using source data on 16,196 DEGs with FPKM values > 1 in transcriptome sequencing and meeting the soft threshold of β = 8 (Supplementary Figure S3). A gene cluster tree was constructed according to correlations between the expressed genes, with each branch corresponding to a gene cluster with highly correlated expression. The dynamic hybrid cutting method was used to cut the tree into modules. Based on the criterion of module similarity >0.8, 18 co-expression modules were obtained (Figure 6a). The numbers of genes contained in those modules varied greatly, ranging from 3483 (darkgreen module) to 79 (salmon4 module), with 19 genes not assigned to any module (Figure 6b). There was a highly significant positive correlation between plant height and the plum1 module (r = 0.95, p = 7 × 10⁻¹⁰) and between the net photosynthetic rate and the skyblue module (r = 0.83, p = 2 × 10⁻⁵) and plum1 (r = 0.80, p = 6 × 10⁻⁵) (Figure 6c). There was also a highly significant positive correlation between chlorophyll a content and plum1 (r = 0.87, p = 2 × 10⁻⁶) and between chlorophyll b content and the skyblue module (r = 0.92, p = 6 × 10⁻⁸). There was a highly significant negative correlation between carotenoids and the black module (r = −0.80, p = 6 × 10⁻⁵) and a highly significant positive correlation between phosphorus content and the skyblue module (r = 0.96, p = 4 × 10⁻¹⁰).
Correlations between the modules and the studied growth and physiological biochemical indicators were analyzed (Figure 6c andFigure 7). Strong positive or negative correlations of the black, skyblue, darkgreen, turquoise, darkmagenta, grey60, and plum1 modules with the growth and physiological traits were observed (|r| > 0.7, p < 0.01). Calculation of the mean gene significance (GS) value for each module and the diagramming of the relationships between the module and each trait showed that the critical GS threshold was ≥0.60 and that four modules (darkmagenta, grey60, turquoise, and plum 1) held the highest correlation and GS value to ABA, IAA, soluble sugar, and soluble protein contents as important physiological indicators of the provenance-related variation in Q. mongolica.

3.4. Core Genes Related to the Abscisic Acid Content

The ABA content of Q. mongolica seedlings of different provenances correlated with the darkmagenta (r = 0.89, p = 6 × 10⁻⁷, GS = 0.70), grey60 (r = 0.85, p = 8 × 10⁻⁶, GS = 0.68), and plum1 (r = 0.85, p = 7 × 10⁻⁶, GS = 0.65) modules (Figure 6c and Figure 7a). We chose the darkmagenta module with the highest correlation with ABA content and the highest GS value for a detailed discussion. Genes in the darkmagenta module were significantly enriched in 22 GO entries, including the establishment of cell polarity (GO: 0030010), arginine biosynthetic process (GO: 006526), regulation of sister chromatid cohesion (GO: 007063), and aldonic acid metabolic process (GO: 0019520) (Figure 8a). These genes were significantly enriched in 11 KEGG metabolic pathways, including diterpenoid biosynthesis; valine, leucine, and isoleucine degradation; limonene and pinene degradation; and glutathione metabolism (Figure 8b). The expression of these genes was increased in Q. mongolica of the HLJ and JL provenances and decreased in Q. mongolica of other provenances, which was consistent with the gradual north-south decrease in the seedling ABA content (Figure 8c). Qrob-T0206670.2 (sorbitol dehydrogenase), MSTRG.28728 (protein FORGETTER 1-like), Qrob-T0087750.2 (wall-associated receptor kinase 2-like), and MSTRG.30403 (probable rhamnogalacturonate lyase B) had high connectivity and played central roles in the co-expression network (Figure 8d).

3.5. Core Genes Related to Indole-3-Acetic Acid Content

The IAA content of the Q. mongolica seedlings of different provenances correlated negatively with the grey60 (r = −0.88, p = 1 × 10⁻⁶, GS = 0.71), plum1 (r = −0.87, p = 3 × 10⁻⁶, GS = 0.66), and darkmagenta (r = −0.81, p = 5 × 10⁻⁵, GS = 0.63) modules (Figure 6c and Figure 7b). We chose the grey60 module with the highest correlation with IAA content and the highest GS value for a detailed discussion. The genes in the grey60 module were significantly enriched in 106 GO entries, including organic substance catabolic process (GO: 1901575), catabolic process (GO: 0009056), single-organism catabolic process (GO: 0044712), and cell protein catabolic process (GO: 0044257) (Figure 9a). They were also significantly enriched in nine KEGG metabolic pathways, including the citrate cycle, carbon metabolism, photosynthesis-antenna proteins, and peroxisomes (Figure 9b). According to the heatmap of gene expression patterns in the darkmagenta module (Figure 9c), expression in Q. mongolica of the HLJ, JL, and LN (HB, BJ, and SD) provenances showed an upward (downward) trend, which was consistent with the gradual north–south increase in the seedling IAA content. Based on the co-expression network (Figure 9d), four core genes with high connectivity were identified after filtering: Qrob-T0320010.2 (late embryogenesis abundant protein At1g64065-like), MSTRG.19625 (aspartic proteinase-like isoform X1), Qrob-T0523900.2 (chlorophyll a- and -b binding protein 13, chloroplast), and Qrob-T0584120.2 (protein PLASTID TRANSCRIPTIONALLY ACTIVE 16, chloroplastic).

3.6. Core Genes Related to the Soluble Sugar Content

The soluble sugar content of Q. mongolica seedlings of different provenances correlated negatively with genes in the turquoise module (r = −0.85, p = 9 × 10⁻⁶, GS = 0.70) (Figure 6c and Figure 7c). These genes were significantly enriched in cell wall biogenesis (GO: 0042546), cell wall organization or biogenesis (GO: 0071554), polysaccharide metabolism process (GO: 005976), external encapsulation structure organization (GO: 0045229), and 264 other GO entries (Figure 10a). They were also significantly enriched in 13 KEGG metabolic pathways, including ribosomes, fatty acid biosynthesis, and phages (Figure 10b). Figure 10c is a heatmap of the expression pattern of each gene in the turquoise module based on all samples. The expression of genes in Q. mongolica of the SD provenance was increased, whereas that in the seedlings of all the other provenances was reduced, which is consistent with the gradual decrease in the soluble sugar content of the seedlings along a north–south gradient. This finding can be explained by the direct or indirect effect of soluble sugar content on the adaptability of plants to cold; higher contents confer greater cold resistance. Figure 10d shows the gene co-expression network for the turquoise module. Seven genes with high connectivity serving as the core gene were identified: MSTRG.1554 (UDP glucoside glycosyltransferase-like), MSTRG.10196 (uclacyanin-3-like), MSTRG.13893 (beta-glucuronosyl transferase GlcAT14C-like), MSTRG.5705 (PREDICTED: pollen-specific protein-like At4g18596), MSTRG.16418 (protein MID1-COMPLEMENTING ACTIVITY 1), MSTRG.11664 (protein HOTHEAD), and Qrob-T0183240.2 (inositol-3-phosphate synthase).

3.7. Core Genes Related to the Soluble Protein Content

The soluble protein content of Q. mongolica seedlings of different provenances correlated with the plum1 (r = 0.86, p = 5 × 10⁻⁶, GS = 0.66), darkmagenta (r = 0.83, p = 2 × 10⁻⁵, GS = 0.66), and grey60 (r = 0.82, p = 3 × 10⁻⁵, GS = 0.66) modules (Figure 6c and Figure 7d). We chose the plum1 module with the highest correlation with soluble protein content and the highest GS value for a detailed discussion. Genes of the plum1 module were significantly enriched in the cell nitrogen compound metabolic process (GO: 0034641), nitrogen compound metabolic process (GO: 006807), heterocycle metabolic process (GO: 0046483), cell nitrogen compound biosynthetic process (GO: 0044271), and 270 other GO entries (Figure 11a). These genes were also significantly enriched in five KEGG metabolic pathways, including beta-alanine metabolism, photosynthesis, pyrimidine metabolism, and the pentose phosphate pathway (Figure 11b). The expression levels of genes in the plum1 module showed a downward trend in Q. mongolica seedlings of the BJ, HB, and SD provenances and an upward trend in those of the HLJ, JL, and LN provenances (Figure 11c), which is consistent with the gradual decrease in the seedlings’ soluble protein content from north to south. This finding can be explained by the indirect or direct effects of soluble protein on the stress adaptations of plants. Cytoscape software was used to draw a co-expression network diagram for the plum1 module genes (Figure 11d). After screening, six core genes with high connectivity were identified: Qrob-T0589140.2 (glucan endo-1,3-beta-glucosidase 11-like), Qrob-T0275190.2 (11-beta-hydroxysteroid dehydrogenase 1B-like), Qrob-T0510430.2 (peroxisomal membrane protein 11C-like), Qrob-T0035580.2 (photosynthetic NDH subunit of subcomplex B 5, chloroplastic), Qrob-T0035840.2 (auxin-responsive protein IAA14-like), and Qrob-T0137410.2 (glycine cleavage system H protein, mitochondrial).

3.8. Verification of Core Genes by qRT-PCR

The accuracy and reliability of the transcriptome sequencing results were verified using qRT-PCR. From the 21 core genes screened, 12 genes with relatively high FPKM values were selected for qRT-PCR verification (Supplementary Table S4). The results were highly consistent with the trend of the transcriptome sequencing results; this indicates that the core genes screened in this study are accurate and that the transcriptome sequencing results are reliable (Figure 12).

4. Discussion

Complex and changing environmental conditions, as well as long-term geographical isolation and natural selection, can result in intra-specific phenotypic and physiological variations in plants. That the same tree species can be distributed in geographical regions with different supplies of light, water, nutrients, and auxins can be attributed to a combination of genetic and environmental factors [30]. The response and adaptation of plants to environmental changes is an important component of the study of the relationship between plants and the environment, and the functional traits of plants are a bridge connecting them with their living environment, reflecting information on changes in the living environment of plants and their adaptation strategies [31]. During the growth and development process, plants can respond positively to changes in the external environment by changing their external morphology and internal physiological and other functional traits, demonstrating good adaptability [32]. In this study, there were significant differences in the photosynthetic pigment, soluble sugar, soluble protein, nutrient element, and hormone contents of Q. mongolica seedlings of different provenances. OPLS-DA analysis and binary linear regression analysis revealed that ABA, IAA, soluble sugar, and soluble protein contents are important physiological and biochemical indicators of the variation of Q. mongolica seedlings of different provenances. Numerous scholars have found in their research on Q. mongolica that under different shade conditions [33], drought stress levels [34], phosphorus treatments [35], nitrogen deposition levels [36], and cultivation measures [14], Q. mongolica seedlings respond to changes in environmental conditions by regulating their own metabolic processes, physiological biochemical indicators, as well as gene transcription regulation to enhance their adaptability to environmental conditions. Zhou R. L. explored the role of antioxidant enzyme activity and osmotic regulatory substances in the adaptation of sandy plants to desert environments in three temperate sandy lands, as well as their physiological regulatory mechanisms. The results showed that although different types of sandy plants have different physiological regulatory mechanisms for desert environment adaptation, different plants can adapt to different environmental conditions by regulating their own physiological, biochemical, and metabolic processes [37], which is consistent with the results of this study.
In this study, the ABA content increased gradually, and the IAA content decreased gradually, from the southern to the northern Q. mongolica provenances. The main reason is that as the Q. mongolica seedlings of different provenances move from south to north, the temperature gradually decreases. To adapt to changing climate conditions, the physiological activities of plants slow down, and the ability to adapt to adversity increases, resulting in an increase in ABA content and a decrease in IAA content. ABA, also known as the stress hormone, is a signal transduction substance in plants’ response to stress. Under stress, ABA usually accumulates in the form of stress signaling factors in plants, regulating many important physiological and biochemical processes [38]. Plants themselves also induce stomatal closure, protect against photoinhibition, and increase ABA levels, which induces or enhances the expression of resistance genes and other physiological mechanisms to enable the adaptability of plants to adverse environmental conditions [39]. In this study, the average ABA content of Q. mongolica populations from different provenances followed the order HLJ > JL > LN > HB > BJ > SD; the ABA content of the HLJ provenance was 34.28% higher than that of the SD provenance. Yue D. studied the relationship between endogenous hormone content and the cold resistance of apricot trees and found that different apricot varieties showed a continuous upward trend in ABA content with a decrease in temperature [40].
As the main active component of the plant hormone auxin, IAA promotes cell polarity development, elongation, and division and regulates root metabolic processes [41]. In this study, the average IAA content of the Q. mongolica population from the SD provenance was the highest, while the HLJ provenance was the lowest; the IAA content was 52.89% lower in the HLJ provenance compared to the SD provenance. Xie J. R. studied the changes in low-temperature semi-lethal temperature and endogenous hormone content of southern Chinese yew leaves with decreasing temperature. The results showed that IAA content decreased gradually with temperature, and there was a negative correlation between IAA content and plant cold resistance [42]. Consistent with the results of this study, plants themselves tended to improve their cold resistance by increasing ABA content and reducing IAA content to adapt to low-temperature environmental conditions.
In this study, the soluble sugar and soluble protein contents of the Q. mongolica seedlings increased gradually from south to north, paralleling the gradual decrease in the average temperature. The main reason for this is that long-term adaptive evolution enables plants to have cellular structures and substances that can respond to environmental changes. Plants can respond to stress by changing their physiological state to maintain cell stability and enable normal growth and development. In previous studies, soluble sugar content and soluble protein content have been shown to play a key role in the plant response to low-temperature stress, although the cold resistance mechanisms of different types of plants vary [43]. Soluble sugars and soluble proteins are small-molecule solutes produced by plants under stress and are also important intracellular osmoregulation substances [44,45]. They can reduce the osmotic potential of cells and maintain normal physiological, biochemical, and metabolic processes in plants by participating in cellular osmoregulation. They can also reduce intracellular free water and increase bound water to lower the freezing point of cells, thereby improving the cold resistance of plants [46]. In this study, the soluble sugar and soluble protein contents of Q. mongolica populations from different provenances followed the order HLJ > JL > LN > HB > BJ > SD, with the HLJ provenance having soluble sugar and soluble protein contents 73.37% and 134.65%, respectively, higher than those of the SD provenance. Liang S. X. studied the changes in the soluble sugar and soluble protein contents of hazelnut branches during natural overwintering; as the temperature decreased gradually, the soluble sugar and soluble protein contents of each hazelnut variety showed a gradually increasing trend, and the soluble sugar and soluble protein contents were positively correlated with each variety’s cold resistance [47], which is consistent with the results of the current study. By increasing the contents of soluble sugar and soluble protein, plants can increase the content of bound water in cells, thus increasing osmotic pressure and enhancing their ability to resist cold.
Traditional analytical methods do not enable full inference of the biological principles described by large volumes of data or the regulatory relationships between genes. Both issues have been addressed with the rapid development of high-throughput sequencing technology and bioinformatics. WGCNA is a bioinformatics method for the examination of gene association patterns inferred from data obtained from high-throughput sequencing (e.g., genomic, transcriptomic, and metabolomic) analyses, which is based on the assumption that cellular activities are interconnected and interactive [48]. In WGCNA, genes with similar expression patterns are assigned to the same module, and specific modules that are strongly associated with the target trait and their core genes are identified. As an efficient data mining method, WGCNA enables the analysis of multi-sample big data [49], pointing to new lines of research and providing clues for further mining of the functional genes of the target trait.
Findings from a WGCNA and selected Q. mongolica growth and physiological traits were combined to construct a weighted gene co-expression network and identify 18 co-expression modules. Twenty-one core genes, including the SDH, cell wall-associated kinase 5 (WAK5), aspartic protease 1 (APA1), glycosyltransferase (UGT), and peroxisomal membrane protein 11 (PEX11) genes, from four specific modules were screened. SDH, a key enzyme of sorbitol metabolism in plants, catalyzes the mutual conversion of sorbitol, fructose, and glucose [50], and thus affects plant growth and development as well as fruit quality and yield. It also contributes to the resistance of abiotic stress-induced damage by regulating the polyol content of plants [51]. WAK5 encodes a functional cell wall protein [52] that regulates plant growth and development, cell expansion, and plant responses to hormones and stress signals [53]. APA1 is distributed widely in animals, plants, fungi, bacteria, and viruses and participates in plant responses to abiotic stress and in plant leaf senescence [54], seed maturation and germination [55], the immune response [56], programmed cell death and reproduction [57], and drought resistance [58]. UGT catalyzes the transfer of active sugar donors to specific receptors [59,60] during the synthesis of plant secondary metabolites [61], the glycosylation of plant hormones [62], and growth and developmental processes as stress responses [63]. PEX11 is a main structural component of the peroxisome membrane, and it regulates the number of peroxisomes in eukaryotic cells by controlling their proliferation [64]. In addition, PEX11 participates in lipid metabolism, reactive oxygen species detoxification, and many other plant physiological and biochemical processes [65]. Thus, the core genes identified in this study control plant growth, development, and metabolism, as well as responses to biological and abiotic stresses.
The above research results show that the gene modules highly related to the target traits and the core genes in the modules can be excavated through WGCNA analysis, which can more accurately reflect the effective information in the biological network, provide new research ideas for studying the gene regulatory networks of different traits, and provide an important research approach for analyzing the molecular mechanism of complex agronomic traits. This study focused on four specific modules (darkmagenta, grey60, turquoise, and plum1) significantly correlated with the ABA, IAA, soluble sugar, and soluble protein contents of Q. mongolica from different sources. Although other gene modules have not been discussed in detail, the biological significance of the genes contained in other modules can be further explored. Regulation of the growth status and physiological activities of plants is the main biological function of the core genes screened from the co-expression network. Further research involving approaches such as gene overexpression, knockout, and silencing will provide detailed insights into the molecular mechanisms enabling plant adaptation in new environments.

5. Conclusions

The growth and physiological traits of Q. mongolica of different provenances reflect the significant changes that have occurred during the geographical adaptation and evolution of this species. Q. mongolica of different provenances can improve their adaptability to the environment through changes in physiological biochemical indicators. The adaptations of Q. mongolica include adjustments to the IAA, ABA, and soluble sugar contents, as suggested by the results of an OPLS-DA. In a binary linear regression analysis of the physiological indexes affected strongly by latitude, soluble sugar, soluble protein, IAA, and ABA contents were shown to be significant traits (p < 0.01). In the WGCNA, the darkmagenta, grey60, turquoise, and plum1 modules were related significantly to all four traits. The WGCNA also led to the identification of 21 core genes related to the growth and physiological traits of Q. mongolica of different provenances, including SDH, WAK5 APA1, UGT76A2, and PEX11C. The core genes are involved mainly in major physiological and biochemical processes occurring during plant growth and development, including carbohydrate synthesis, metabolism, secondary metabolite synthesis, glycosylation, stress responses, and hormone signal transduction. Our findings provide a scientific theoretical basis for research aiming to elucidate the molecular mechanisms and genetic basis of the regulation of plant growth, development, and metabolism.

Supplementary Materials

The following supporting information can be downloaded at: https://www.mdpi.com/article/10.3390/f14071313/s1, Figure S1: Differentially Expressed Genes GO enrichment analysis; Figure S2: Differentially Expressed Genes KEGG enrichment analysis; Figure S3: Determination of Soft Threshold(β); Table S1: Sampling point information for the different provenances; Table S2: Primer information; Table S3: Binary linear regression findings for latitude, longitude, growth traits, and physiological indicators of Q. mongolica seedlings of different provenances; Table S4: Functional descriptions of the core genes in specific modules.

Author Contributions

X.L., M.J., J.W. and M.Y. designed the experiment; X.L. and M.J. writing—original draft preparation; J.R. and G.L. investigation; W.Z. data curation; Z.L. resources; X.L., J.W. and M.Y. conceived the study and edited the manuscript. All authors have read and agreed to the published version of the manuscript.

Funding

National Key R&D Program of China during the 14th Five-year Plan Period: 2021YFD2200302; Collection, Conservation and Genetic Evaluation of Quercus Mongolian Germplasm Resources: KJZXSA20220X.

Institutional Review Board Statement

Our study does not involve ethics approval and consent to participate.

Informed Consent Statement

Informed consent was obtained from all subjects involved in the study.

Data Availability Statement

The original sequencing data have been submitted to the National Center for Biotechnology Information project database (project number PRJNA979329; NCBI, Bethesda, MD, USA).

Conflicts of Interest

The authors declare no conflict of interest.

References

  1. Daghlian, C.P.; Crepet, W.L. Oak catkins, leaves and fruits from the Oligocene Catahoula Formation and their evolutionary significance. Am. J. Bot. 1983, 70, 639–649. [Google Scholar] [CrossRef]
  2. Xu, X.H.; Yang, B.S.; Wang, H.; Cao, Y.A.; Li, K.; Gao, S.W. Temperature sensitivity of soil heterotrophic respiration is altered by carbon substrate along the development of Quercus mongolica forest in northeast China. Appl. Soil Ecol. 2019, 133, 52–61. [Google Scholar] [CrossRef]
  3. Shen, L.; Liu, P.X.; An, M.M.; Liang, R.N.; He, X.W.; Zhao, G.Z. Sphingomonas quercus sp. Nov., Isolated from Rhizosphere Soil of Quercus mongolica. Curr. Microbiol. 2022, 79, 122. [Google Scholar] [CrossRef] [PubMed]
  4. Zhang, S.Y.; Lu, X.M.; Zhou, G.S.; Ren, H.R. Spectral Characteristics during Leaf Flourishing Development of Quercus mongolica and Its Influencing Factors. Spectrosc. Spect. Anal. 2021, 41, 2924–2929. [Google Scholar]
  5. Lyu, S.N.; Wang, X.C.; Zhang, Y.D.; Li, Z.S. Different responses of Korean pine (Pinus koraiensis) and Mongolia oak (Quercus mongolica) growth to recent climate warming in northeast China. Dendrochronologia 2017, 45, 113–122. [Google Scholar] [CrossRef]
  6. Sun, Y.; Guo, J.L.; Zeng, X.R.; Chen, R.S.; Feng, Y.; Chen, S.; Yang, K. Chromosome-scale genome assembly of Castanopsis tibetana provides a powerful comparative framework to study the evolution and adaptation of Fagaceae trees. Mol. Ecol. Resour. 2022, 22, 1178–1189. [Google Scholar] [CrossRef] [PubMed]
  7. Ren, J.J.; Pang, X.B.; Liu, Z.Y.; Li, J.Y.; Zhang, W.Y.; Yin, S.L.; Wang, L.B.; Li, Y.C. Diversity of phenotypic characters of Quercus mongolica seeds from different provenances. J. Zhejiang Univ. 2022, 39, 1221–1228. (In Chinese) [Google Scholar]
  8. Chen, K.; Zhang, H.; Lei, X. Spatial pattern of Quercus mongolica in natural secondary forest. Acta Ecol. Sin. 2018, 38, 3462–3470. [Google Scholar]
  9. He, F.; Yang, B.S.; Wang, H.; Yan, Q.L.; Cao, Y.N.; He, X.H. Changes in composition and diversity of fungal communities along Quercus mongolica forests developments in Northeast China. Appl. Soil Ecol. 2016, 100, 162–171. [Google Scholar] [CrossRef]
  10. Chen, S.; Xu, Z.Y.; Adil, M.F.; Zhang, G.P. Cultivar-, stress duration- and leaf age-specific hub genes and co-expression networks responding to waterlogging in barley. Environ. Exp. Bot. 2021, 191, 104599. [Google Scholar] [CrossRef]
  11. Yang, Y.F.; Shi, D.Y.; Wang, Y.N.; Zhang, L.; Chen, X.G.; Yang, X.P. Transcript profiling for regulation of sweet potato skin color in Sushu8 and its mutant Zhengshu20. Plant Physiol. Bioch. 2020, 148, 1–9. [Google Scholar] [CrossRef]
  12. Lu, C.F.; Pu, Y.; Liu, Y.T.; Li, Y.J.; Qu, J.P.; Huang, H.; Dai, S.L. Comparative transcriptomics and weighted gene co-expression correlation network analysis (WGCNA) reveal potential regulation mechanism of carotenoid accumulation in Chrysanthemum × morifolium. Plant Physiol. Bioch. 2019, 142, 415–428. [Google Scholar] [CrossRef]
  13. He, Y.J.; Wang, Z.W.; Ge, H.Y.; Liu, Y.; Chen, H.Y. Weighted gene co-expression network analysis identifies genes related to anthocyanin biosynthesis and functional verification of hub gene SmWRKY44. Plant Sci. 2021, 309, 110935. [Google Scholar] [CrossRef]
  14. Jiang, M.; Li, X.M.; Yuan, Y.C.; Zhang, G.W.; Pang, J.S.; Ren, J.J.; Wang, J.M.; Yang, M.S. Integrated physiological and transcriptomic analyses reveal the molecular mechanism behind the response to cultivation in Quercus mongolica. Front. Plant Sci. 2022, 13, 947696. [Google Scholar] [CrossRef]
  15. Jagtap, A.B.; Yadav, I.S.; Vikal, Y.; Praba, U.P.; Kaur, N.; Gill, A.S.; Johal, G.S. Transcriptional dynamics of maize leaves, pollens and ovules to gain insights into heat stress-related responses. Front. Plant Sci. 2023, 14, 1117136. [Google Scholar] [CrossRef]
  16. Liu, X.Q.; Chen, A.P.; Wang, Y.X.; Jin, G.L.; Zhang, Y.H.; Gu, L.L.; Li, C.J.; Shao, X.Q.; Wang, K. Physiological and transcriptomic insights into adaptive responses of Seriphidium transiliense seedlings to drought stress. Environ. Exp. Bot. 2022, 194, 104736. [Google Scholar] [CrossRef]
  17. Wu, W.Q.; Liao, T.; Du, K.; Wei, H.R.; Kang, X.Y. Transcriptome comparison of different ploidy reveals the mechanism of photosynthetic efficiency superiority of triploid poplar. Genomics 2021, 113, 2211–2220. [Google Scholar] [CrossRef]
  18. Holmes, J.J.; Weger, H.G.; Turpin, D.H. Chlorophyll a Fluorescence Predicts Total Photosynthetic Electron Flow to CO2 or NO3/NO2 under Transient Conditions. J. Plant Physiol. 1989, 91, 331–337. [Google Scholar] [CrossRef] [Green Version]
  19. Bradford, M.M. A rapid and sensitive method for the quantitation of microgram quantities of protein utilizing the principle of proteindye binding. Anal. Biochem. 1976, 72, 248–254. [Google Scholar] [CrossRef]
  20. Buysse, J.; Merckx, R. An Improved Colorimetric Method to Quantify Sugar Content of Plant Tissue. J. Exp. Bot. 1993, 44, 1627–1629. [Google Scholar] [CrossRef]
  21. Guinagui, N.B.; Sorho, F.; Souleymane, S.; Koné, B.; Koné, D. Effect of Rice yellow mottle virus, Sobemovirus on the Contents of N P K Ca and Mg in Leaves of Infected Rice. Annu. Res. Rev. Biol. 2019, 30, 1–10. [Google Scholar] [CrossRef] [Green Version]
  22. Chen, S.F.; Zhou, Y.Q.; Chen, Y.R.; Gu, J. fastp: An ultra-fast all-in-one FASTQ preprocessor. Bioinformatics 2018, 34, i884–i890. [Google Scholar] [CrossRef] [PubMed]
  23. Kim, D.; Langmead, B.; Salzberg, S.L. HISAT: A fast spliced aligner with low memory requirements. Nat. Methods 2015, 12, 357–630. [Google Scholar] [CrossRef] [PubMed] [Green Version]
  24. Love, M.I.; Huber, W.; Anders, S. Moderated estimation of fold change and dispersion for RNA-seq data with DESeq2. Genome Biol. 2014, 15, 550. [Google Scholar] [CrossRef] [PubMed] [Green Version]
  25. Ashburner, M.; Ball, C.A.; Blake, J.A.; Botstein, D.; Butler, H.; Cherry, J.M.; Davis, A.P.; Dolinski, K.; Dwight, S.S.; Eppig, J.T.; et al. Gene ontology: Tool for the unification of biology. Nat. Genet. 2000, 25, 25. [Google Scholar] [CrossRef] [Green Version]
  26. Kanehisa, M.; Goto, S. KEGG: Kyoto encyclopedia of genes and genomes. Nucleic Acids Res. 2000, 28, 27–30. [Google Scholar] [CrossRef]
  27. Shannon, P.; Markiel, A.; Ozier, O. Cytoscape: A software environment for integrated models of biomolecular interaction networks. Genome Res. 2003, 13, 2498–2504. [Google Scholar] [CrossRef]
  28. Chatwin, W.B.; Carpenter, K.K.; Jimenez, F.R.; Elzinga, D.B.; Johnson, L.A.; Maughan, P.J. Microsatellite primer development for Post Oak, Quercus stellata (Fagaceae). Appl. Plant Sci. 2014, 2, 3. [Google Scholar] [CrossRef]
  29. Livak, K.J.; Schmittgen, T.D. Analysis of relative gene expression data using real-time quantitative PCR and the 2−ΔΔCt. Methods 2001, 25, 402–408. [Google Scholar] [CrossRef]
  30. Nie, M.X.; Huan, J.Y.; Huang, J.L.; Chen, Z.Y.; Lin, L.Z.; Luo, F.L.; Zhang, X.; Xiao, S. Differences in the components of Neolamarckia cadamba from different provenance and the drug resistance reversal activity of characteristic alkaloid. Ind. Crop. Prod. 2022, 186, 115145. [Google Scholar] [CrossRef]
  31. Vendramini, F.; Díaz, S.; Gurvich, D.E.; Wilson, P.J.; Thompson, K.; Hodgson, J.G. Leaf traits as indicators of resource-use strategy in floras with succulent species. New Phyto. 2002, 154, 147–157. [Google Scholar] [CrossRef]
  32. Westoby, M.A. Leaf-height-seed (LHS) plant ecology strategy scheme. Plant Soil 1998, 199, 213–227. [Google Scholar] [CrossRef]
  33. Xu, Z.Q.; Huang, X.R.; Xu, L.C.; Xu, Q.; Ji, X.L. The impacts of light conditions on the growth and morphology of Quercus mongolica seedlings. Acta Ecol. Sin. 2009, 29, 1121–1128. [Google Scholar]
  34. Wang, Y.; Han, X.; Ai, W.; Zhan, H.; Ma, S.; Lu, X. Non-Structural Carbohydrates and Growth Adaptation Strategies of Quercus mongolica Fisch. ex Ledeb. Seedlings under Drought Stress. Forests 2023, 14, 404. [Google Scholar] [CrossRef]
  35. Li, H.X.; Li, Z.H.; Bai, H.; Xing, Y.J. Effects of Different Phosphorus Treatments on the Growth and Physiological Characteristics of Mongolian Oak Seedlings. For. Sci. Technol. 2021, 46, 1–3. [Google Scholar]
  36. Wang, X.Y.; Zhang, Y.; He, H.J.; Fan, X.H. Response of photosynthetic and fluorescence characteristics of Quercus mongolica seedlings to simulated nitrogen deposition in Shulan, Jilin Province. Chin. J. Appl. Environ. Biol. 2023, 1–11. [Google Scholar] [CrossRef]
  37. Zhou, R.L.; Hou, Y.P.; Zuo, J.C.; Wang, Y.F. The physiological adaptation mechanisms of four common desert species in response to desert environments. Acta Ecol. Sin. 2015, 35, 340–349. [Google Scholar]
  38. Shi, W.J.; Wang, X.J.; Liu, H.; Cai, Z.A.; Lu, C.F.; Chen, Y.Z. A novel ABA-insensitive mutant in Arabidopsis reveals molecular network of ABA-induced anthocyanin accumulation and abiotic stress tolerance. J. Plant Physiol. 2022, 278, 153810. [Google Scholar] [CrossRef]
  39. Huang, X.; Shi, H.; Hu, Z.; Liu, A.; Amombo, E.; Chen, L.; Fu, J. ABA is involved in regulation of cold stress response in bermudagrass. Front. Plant Sci. 2017, 8, 1613. [Google Scholar] [CrossRef] [Green Version]
  40. Yue, D.; Wang, Y.K. Study on the Relationship between Endogenous Hormone Content and Cold Resistance of Apricot Trees. J. Anhui Agri. Sci. 2008, 10023, 9951–9952. [Google Scholar]
  41. Jędrzejuk, A.; Kuźma, N.; Nawrot, K.; Budzyński, R.; Orłowski, A. Mechanical stimulation affects growth dynamics, IAA content and activity of POD and IAA oxidase in Petunia × atkinsiana. Sci. Hortic. 2020, 274, 109661. [Google Scholar] [CrossRef]
  42. Xie, J.R.; Xiang, D.Y.; Mei, H.; Tan, F. The Relationship between Changes in Cold Resistance of Southern Taxus and Endogenous Hormones. J. South Chin. Norm. Univ. 2002, 2, 231–234. [Google Scholar]
  43. Theocharis, A.; Clement, C.; Barka, E.A. Physiological and molecular changes in plants grown at low temperatures. Planta 2012, 235, 1091–1105. [Google Scholar] [CrossRef]
  44. Yan, L.; Shah, T.; Cheng, Y.; Lü, Y.; Zhang, X.; Zou, X. Physiological and molecular responses to cold stress in rapeseed (Brassica napus L.). J. Integr. Agric. 2019, 18, 2742–2752. [Google Scholar] [CrossRef]
  45. Wu, S.W.; Li, M.; Zhang, C.M.; Tan, Q.L.; Yang, X.Z.; Sun, X.C.; Pan, Z.Y. Effects of phosphorus on fruit soluble sugar and citric acid accumulations in citrus. Plant Physiol. Biochem. 2021, 160, 73–81. [Google Scholar] [CrossRef]
  46. Adrià, L.C.; Paula, S.; Clara, G.; Anna, A.; Elena, G.F. Quality comparison of recombinant soluble proteins and proteins solubilized from bacterial inclusion bodies. New Biotechnol. 2022, 72, 58–63. [Google Scholar]
  47. Liang, S.X.; Meng, Q.X.; Shi, M.J.; Luo, G.T.; Wang, G.Z. tudy on the Relationship between the Content of Soluble Protein and Soluble Sugar in the Branches of Hazelnut and Its Cold Resistance. Chin. Agri. Sci. Bull. 2015, 31, 14–18. [Google Scholar]
  48. Zhang, H.; Jiang, C.J.; Lei, J.N.; Dong, J.L.; Ren, J.Y.; Shi, X.L.; Zhong, C.; Wang, X.G.; Zhao, X.H.; Yu, H.Q. Comparative physiological and transcriptomic analyses reveal key regulatory networks and potential hub genes controlling peanut chilling tolerance. Genomics 2022, 114, 110285. [Google Scholar] [CrossRef]
  49. Wang, P.; Liu, D.; Yang, F.H.; Ge, H.; Zhao, X.; Chen, H.G.; Du, T. Identification of key gene networks controlling vernalization development characteristics of Isatis indigotica by full-length transcriptomes and gene expression profiles. Physiol. Mol. Biol. Plants 2021, 27, 2679–2693. [Google Scholar] [CrossRef]
  50. Jia, Y.; Wong, D.C.J.; Sweetman, C.; Bruning, J.B.; Ford, C.M. New insights into the evolutionary history of plant sorbitol dehydrogenase. BMC Plant Biol. 2015, 15, 101. [Google Scholar] [CrossRef] [PubMed] [Green Version]
  51. Archbold, D.D.; Nosarzewski, M.; Wu, B.H.; Downie, A.B. The role of sorbitol dehydrogenase in Arabidopsis thaliana. Funct. Plant Biol. 2012, 39, 462–470. [Google Scholar]
  52. Wang, N.; Huang, H.J.; Ren, S.T.; Li, J.J.; Sun, Y.; Sun, D.Y.; Zhang, S.Q. The rice wall-associated receptor-like kinase gene OsDEES1 plays a role in female gametophyte development. Plant Physiol. 2012, 160, 696–707. [Google Scholar] [CrossRef] [Green Version]
  53. Wagner, T.A.; Kohorn, B.D. Wall-associated kinases are expressed throughout plant development and are required for cell expansion. Plant Cell 2001, 13, 303–318. [Google Scholar] [CrossRef] [Green Version]
  54. Kato, Y.; Murakami, S.; Yamamoto, Y.; Chatani, H.; Kondo, Y.; Nakano, T.; Yokota, A.; Sato, F. The DNA-binding protease, CND41, and the degradation of ribulose-1,5-bisphosphate carboxylase/oxygenase in senescent leaves of tobacco. Planta 2004, 220, 97–104. [Google Scholar] [CrossRef]
  55. Asakura, T.; Watanabe, H.; Abe, K.; Arai, S. Rice aspartic proteinase, oryzasin, expressed during seed ripening and germination, has a gene organization distinct from those of animal and microbial aspartic proteinases. Eur. J. Biochem. 1995, 232, 77–83. [Google Scholar] [CrossRef]
  56. Guevara, M.G.; Oliva, C.R.; Huarte, M.; Daleo, G.R. An aspartic protease with antimicrobial activity is induced after infection and wounding in intercellular fluids of potato tubers. Eur. J. Plant Pathol. 2002, 108, 131–137. [Google Scholar] [CrossRef]
  57. Ge, X.C.; Dietrich, C.; Matsuno, M.; Li, G.J.; Berg, H.; Xia, Y.J. An Arabidopsis aspartic protease functions as an anti-cell-death component in reproduction and embryogenesis. Embo Rep. 2005, 6, 282–288. [Google Scholar] [CrossRef] [Green Version]
  58. Sebastián, D.; Fernando, F.D.; Raúl, D.G.; Gabriela, G.M. Overexpression of Arabidopsis aspartic protease APA1 gene confers drought tolerance. Plant Sci. 2020, 292, 110406. [Google Scholar] [CrossRef]
  59. Zhang, P.; Zhang, Z.; Zhang, L.J.; Wang, J.J.; Wu, C.S. Glycosyltransferase GT1 family: Phylogenetic distribution, substrates cover-age, and representative structural features. Comput. Struct. Biotechnol. J. 2020, 18, 1383–1390. [Google Scholar] [CrossRef]
  60. Yin, Q.G.; Shen, G.A.; Di, S.K.; Fan, C.Y.; Chang, Z.Z.; Pang, Y.Z. Genome-wide identification and functional characterization of UDP-glucosyltransferase genes involved in flavonoid biosynthesis in Glycine max. Plant Cell Physiol. 2017, 58, 1558–1572. [Google Scholar] [CrossRef] [Green Version]
  61. Zheng, R.R.; Zhu, Z.Y.; Wang, Y.L.; Hu, S.Y.; Xi, W.; Xiao, W.; Qu, X.L.; Zhong, L.L.; Fu, Q.; Wang, C.Y. UGT85A84 catalyzes the glycosylation of aromatic monoterpenes in Osmanthus fragrans Lour. flowers. Front. Plant Sci. 2019, 10, 1376. [Google Scholar] [CrossRef] [PubMed]
  62. Chen, L.; Huang, X.X.; Zhao, S.M.; Xiao, D.W.; Xiao, L.T.; Tong, J.H.; Wang, W.S.; Li, Y.J.; Ding, Z.J.; Hou, B.K. IPyA glucosylation mediates light and temperature signaling to regulate auxin -dependent hypocotyl elongation in Arabidopsis. Proc. Natl. Acad. Sci. USA 2020, 117, 6910. [Google Scholar] [CrossRef]
  63. Mohnike, L.; Rekhter, D.; Huang, W.J.; Feussner, K.; Tian, H.Y.; Herrfurth, C.; Zhang, Y.L.; Feussne, L. The glycosyltransferase UGT76B1 modulates N-hydroxy-pipecolicacid homeostasis and plant immunity. Plant Cell 2021, 33, 735–749. [Google Scholar] [CrossRef] [PubMed]
  64. Nayidu, N.K.; Wang, L.; Xie, W.B.; Zhang, C.J.; Fan, C.Z.; Zhang, Q.F.; Xiong, L.Z. Comprehensive sequence and expression profile analysis of PEX11 gene family in rice. Gene 2008, 412, 59–70. [Google Scholar] [CrossRef] [PubMed]
  65. Mindthoff, S.; Grunau, S.; Steinfort, L.L.; Girzalsky, W.; Hiltunen, J.K.; Erdmann, R.; Antonenkov, V.D. Peroxisomal Pex11 is a pore-forming protein homologous to TRPM channels. BBA-Mol. Cell Res. 2016, 1863, 271–283. [Google Scholar] [CrossRef] [PubMed]
Figure 1. Growth traits of Q. mongolica of different provenances: (a) seedling height; (b) ground diameter. The lines represent the standard error of the mean. Different lowercase letters represent significant differences among seedlings of different provenances (p < 0.05). The same lowercase letter indicates no significant difference.
Forests 14 01313 g001
Figure 2. Physiological biochemical indicators of Q. mongolica seedlings of different provenances. (a) Chlorophyll a content and net photosynthetic rate; (b) carotenoid and chlorophyll b contents; (c) nitrogen and soluble sugar contents; (d) phosphorus and soluble protein contents; and (e) abscisic acid (ABA) and indole-3-acetic acid (IAA) contents. The lines represent the standard error of the mean. Different lowercase letters represent significant differences among seedlings of different provenances (p < 0.05). The same lowercase letter indicates no significant difference.
Forests 14 01313 g002
Figure 3. Heatmap of correlations among growth and physiological biochemical indicators of Q. mongolica of different provenances. Note: * p < 0.01.
Forests 14 01313 g003
Figure 4. Chemometrics analysis results for the growth and physiological biochemical indicators of Q. mongolica of different provenances. (a) Principal component analysis and (b) orthogonal partial least squares discriminant analysis.
Forests 14 01313 g004
Figure 5. Number of differentially expressed genes in leaves of Q. mongolica from different provenances.
Forests 14 01313 g005
Figure 6. Construction of the weighted gene co-expression network. (a) Gene cluster tree and module cutting. (b) Numbers of genes in the modules. Different colors represent different modules; grey indicates genes not assigned to any module. (c) Correlation analysis between module-trait.
Forests 14 01313 g006
Figure 7. Gene significance for physiological biochemical indicators modules: (a) ABA content, (b) IAA content, (c) soluble sugar content, and (d) soluble protein content.
Forests 14 01313 g007
Figure 8. Co-expression network for the darkmagenta module. (a) Gene Ontology (GO) enrichment analyses. (b) Kyoto Encyclopedia of Genes and Genomes (KEGG) enrichment. (c) Heatmap of the expression of genes in the module (top) and expression levels per sample (bottom). (d) Co-expression network of core genes. to Figure 8. Co-expression network for the darkmagenta module. (a) Gene Ontology (GO) enrichment analyses. (b) Kyoto Encyclopedia of Genes and Genomes (KEGG) enrichment. (c) Heatmap of the expression of genes in the module (top) and expression levels per sample (bottom), red represents gene upregulation in the sample, while green represents gene downregulation in the sample. (d) Co-expression network of core genes.
Forests 14 01313 g008
Figure 9. Co-expression network for the grey60 module. (a) GO enrichment analyses. (b) KEGG enrichment analyses. (c) Heatmap of the expression pattern of genes in the module (top) and expression levels per sample (bottom). (d) Co-expression network of core genes.to Figure 9. Co-expression network for the grey60 module. (a) GO enrichment analyses. (b) KEGG enrichment analyses. (c) Heatmap of the expression pattern of genes in the module (top) and expression levels per sample (bottom), red represents gene upregulation in the sample, while green represents gene downregulation in the sample. (d) Co-expression network of core genes.
Forests 14 01313 g009
Figure 10. Co-expression network for the turquoise module. (a) GO enrichment analyses. (b) KEGG enrichment analyses. (c) Heatmap of the expression pattern of genes in the module (top) and expression levels per sample (bottom). (d) Co-expression network of core genes.to Figure 10. Co-expression network for the turquoise module. (a) GO enrichment analyses. (b) KEGG enrichment analyses. (c) Heatmap of the expression pattern of genes in the module (top) and expression levels per sample (bottom),red represents gene upregulation in the sample, while green represents gene downregulation in the sample. (d) Co-expression network of core genes.
Forests 14 01313 g010
Figure 11. Co-expression network for the plum1 module. (a) GO enrichment analyses. (b) KEGG enrichment analyses. (c) Heatmap of the expression pattern of genes in the module (top) and expression levels per sample (bottom). (d) Co-expression network of core genes.to Figure 11. Co-expression network for the plum1 module. (a) GO enrichment analyses. (b) KEGG enrichment analyses. (c) Heatmap of the expression pattern of genes in the module (top) and expression levels per sample (bottom),red represents gene upregulation in the sample, while green represents gene downregulation in the sample. (d) Co-expression network of core genes.
Forests 14 01313 g011
Figure 12. Transcription-level qRT-PCR and RNA-seq data for 12 core genes.
Forests 14 01313 g012
Disclaimer/Publisher’s Note: The statements, opinions and data contained in all publications are solely those of the individual author(s) and contributor(s) and not of MDPI and/or the editor(s). MDPI and/or the editor(s) disclaim responsibility for any injury to people or property resulting from any ideas, methods, instructions or products referred to in the content.

