Article

Impacting Factors of Changes in Dynamic Viscosity and Interfacial Tension of Wood Xylem Sap

1
Co-Innovation Center of Efficient Processing and Utilization of Forest Resources, College of Materials Science and Engineering, Nanjing Forestry University, Nanjing 210037, China
2
Research Institute of Wood Industry of Chinese Academy of Forestry, Beijing 100091, China
*
Author to whom correspondence should be addressed.
Forests 2023, 14(7), 1344; https://doi.org/10.3390/f14071344
Submission received: 8 May 2023 / Revised: 12 June 2023 / Accepted: 26 June 2023 / Published: 29 June 2023
(This article belongs to the Section Wood Science and Forest Products)

Abstract

:
The growth of trees is inseparable from the water transpiration in the xylem. To explore the mechanism of sap rising in the xylem, the monthly variation of the dynamic viscosity and interfacial tension of the xylem sap of different tree species and their impacting factors were analyzed. In this experiment, the dynamic viscosity and interfacial tension of the xylem sap of poplar and metasequoia were measured within one year, as well as the sap velocity of poplar. Gas chromatography–mass spectrometry and atomic absorption spectroscopy were used to detect the organic components and inorganic cations of the xylem sap of poplar and metasequoia. By analyzing the influence of organic components and the inorganic cation concentration of xylem sap on the dynamic viscosity and interfacial tension of xylem sap, this study revealed that the dynamic viscosity and the interfacial tension of poplar and metasequoia samples in different months changed in basically the same manner. However, the dynamic viscosity and the interfacial tension of the metasequoia samples were generally higher than those of the poplar samples. The dynamic viscosity of the xylem sap had an obvious exponential relationship with temperature, while the interfacial tension of the xylem sap had an inconspicuous linear relationship with temperature. In addition, disparate xylem structures of the broad-leaved tree poplar and the coniferous tree metasequoia led to different concentrations of organic components and inorganic cations in their xylem sap, which made a difference in the dynamic viscosity and interfacial tension between poplar and metasequoia samples.

1. Introduction

During the growth of trees, the water absorbed from the roots is transferred to the canopy, and the nutrients produced by photosynthesis are transported downwards [1]. Adequate water can maintain the biological activity of trees, while a lack of water causes stomatal closure, leading to a decrease in photosynthesis and the transpiration rate [2]. Severe water deficit can induce biochemical limitations [3,4], and the moderation of water shortage can induce the diffusion of the limitations and influence transpiration [5]. To make trees grow vigorously, it is imperative to ensure water transport in the trees.
As with any fluid system, water encounters a viscous resistance to flow during the rise of sap. The viscous resistance is reflected in the dynamic viscosity of the xylem sap. Tension is exerted on the water columns, maintaining sap in a metastable state [6], which is closely related to the interfacial tension of xylem sap. If this tension is too great, sap vaporizes and forms an embolism [7]. The increasing number of embolisms decreases the hydraulic conductivity of the xylem and eventually leads to hydraulic failure [8]. Therefore, the dynamic viscosity and interfacial tension of the xylem sap are vital parameters for studying the rise of xylem sap. Holtta et al. [9] simulated viscosity as an explicit function of solute concentration and established a water and solute flow model in the coupled system of the xylem and phloem. Denny [10] used sap viscosity and interfacial tension to simulate the flow of xylem sap in many branches and calculated the maximum height of water that can rise in trees. Nevertheless, the results of the calculations were much smaller than the actual tree height.
However, when these studies used the sap viscosity and interfacial tension to construct a model of hydraulic drainage, they were only experiments that were conducted in specific seasons. The impact of environmental factors on water transport in different seasons was not considered. The difference between the hardwood tree and the conifer tree has not been analyzed. Therefore, before using dynamic viscosity and interfacial tension to model the rise of sap in different species, it is imperative to investigate the impacting factors of dynamic viscosity and interfacial tension changes.
Liquid has cohesion and adhesion, which are manifestations of molecular gravity. Cohesion force allows liquid to resist tensile gravitational force, while adhesion force allows liquid to adhere to other objects. The interfacial tension is at the boundary between liquid and gas [11]. Due to the attractive force between molecules, the slight pulling force makes the surface as small as possible. There are differences in the interfacial tension of xylem sap from different wood species. Christensen-Dalsgaard et al. [12] studied the interfacial tension changes of the xylem sap of three temperate porous wood species using the hanging drop method. The interfacial tension of the xylem sap of the three types of wood was smaller than that of pure water and gradually decreased as time passed due to gravity. In addition, some studies explored the correlation between liquid interfacial tension and temperature [13,14].
The morphological characteristics of the xylem elements of different tree species influence the sap rising [15,16], causing the different concentrations of organic components and inorganic ions in the xylem sap of different tree species. The concentration of organic components and inorganic ions in the xylem sap affects the dynamic viscosity and interfacial tension of the xylem sap. Furthermore, changes in the dynamic viscosity and interfacial tension of xylem sap affect the sap velocity.
Therefore, the impacting factors of the dynamic viscosity and interfacial tension of xylem sap were investigated in this study. The morphological characteristics of the xylem elements of different tree species were also investigated. Subsequently, the correlation between the sap velocity and the viscosity and interfacial tension of the xylem sap was deduced, which improves the theoretical reference for perfecting the law of xylem sap rising.

2. Materials and Methods

2.1. Materials

Three Populus euramericana trees and three Metasequoia glyptostroboides trees free of pests and diseases were selected. The age, diameter at breast height (DBH), and height of the different trees are presented in Table 1. From May 2020 to April 2021, 5–7 branches with a diameter of 18.25 ± 1.71 mm were collected from each tree at the end of each month. As is well known, the repeated wounding of plants triggers immune responses which can influence the type of chemicals transported in the xylem [17]. Therefore, the likelihood of tree damage was reduced as much as possible. The 5 cm long samples at the end of the branch were cut and placed in a formaldehyde–acetic acid–ethanol (FAA) fixative solution for later use. The remaining branches at both ends were sealed with plastic films and shipped to the laboratory, where the xylem sap was collected immediately.
The samples used in this experiment were taken from the test site on the campus of Nanjing Forestry University, Nanjing, China, located in a subtropical monsoon climate zone with abundant rainfall and acidic soil with pH values of 4–6.

2.2. Morphological Analysis

The samples stored in the FAA fixative solution were dissociated using acetic acid and hydrogen peroxide (1:1) in a water bath at 70 °C. When the samples were slightly whitish, the dissociation ended. After rinsing the sample to neutral, a drop of crosé solution was added to the samples. After shaking the samples evenly, the diameters of poplar conduits and metasequoia tracheid were measured under a 400× microscope produced by Leica, Weztlar, Germany.

2.3. Sap Velocity Measurement

The Flow32a-1K wrapping stem flowmeter produced by Dynamax, Houston, TX, USA, was used to measure the sap velocity of the poplar trees by wrapping the branches with wrapping sensors. The data logger collected instantaneous sap velocity every 10 s, then the average sap flow rate was calculated and saved every 15 min. Sap velocity often reaches the maximum between 3 p.m. and 4 p.m. in the summer and between 1 p.m. and 2 p.m. in the winter. The branches were collected when instantaneous sap velocity reached the maximum and started to decline.

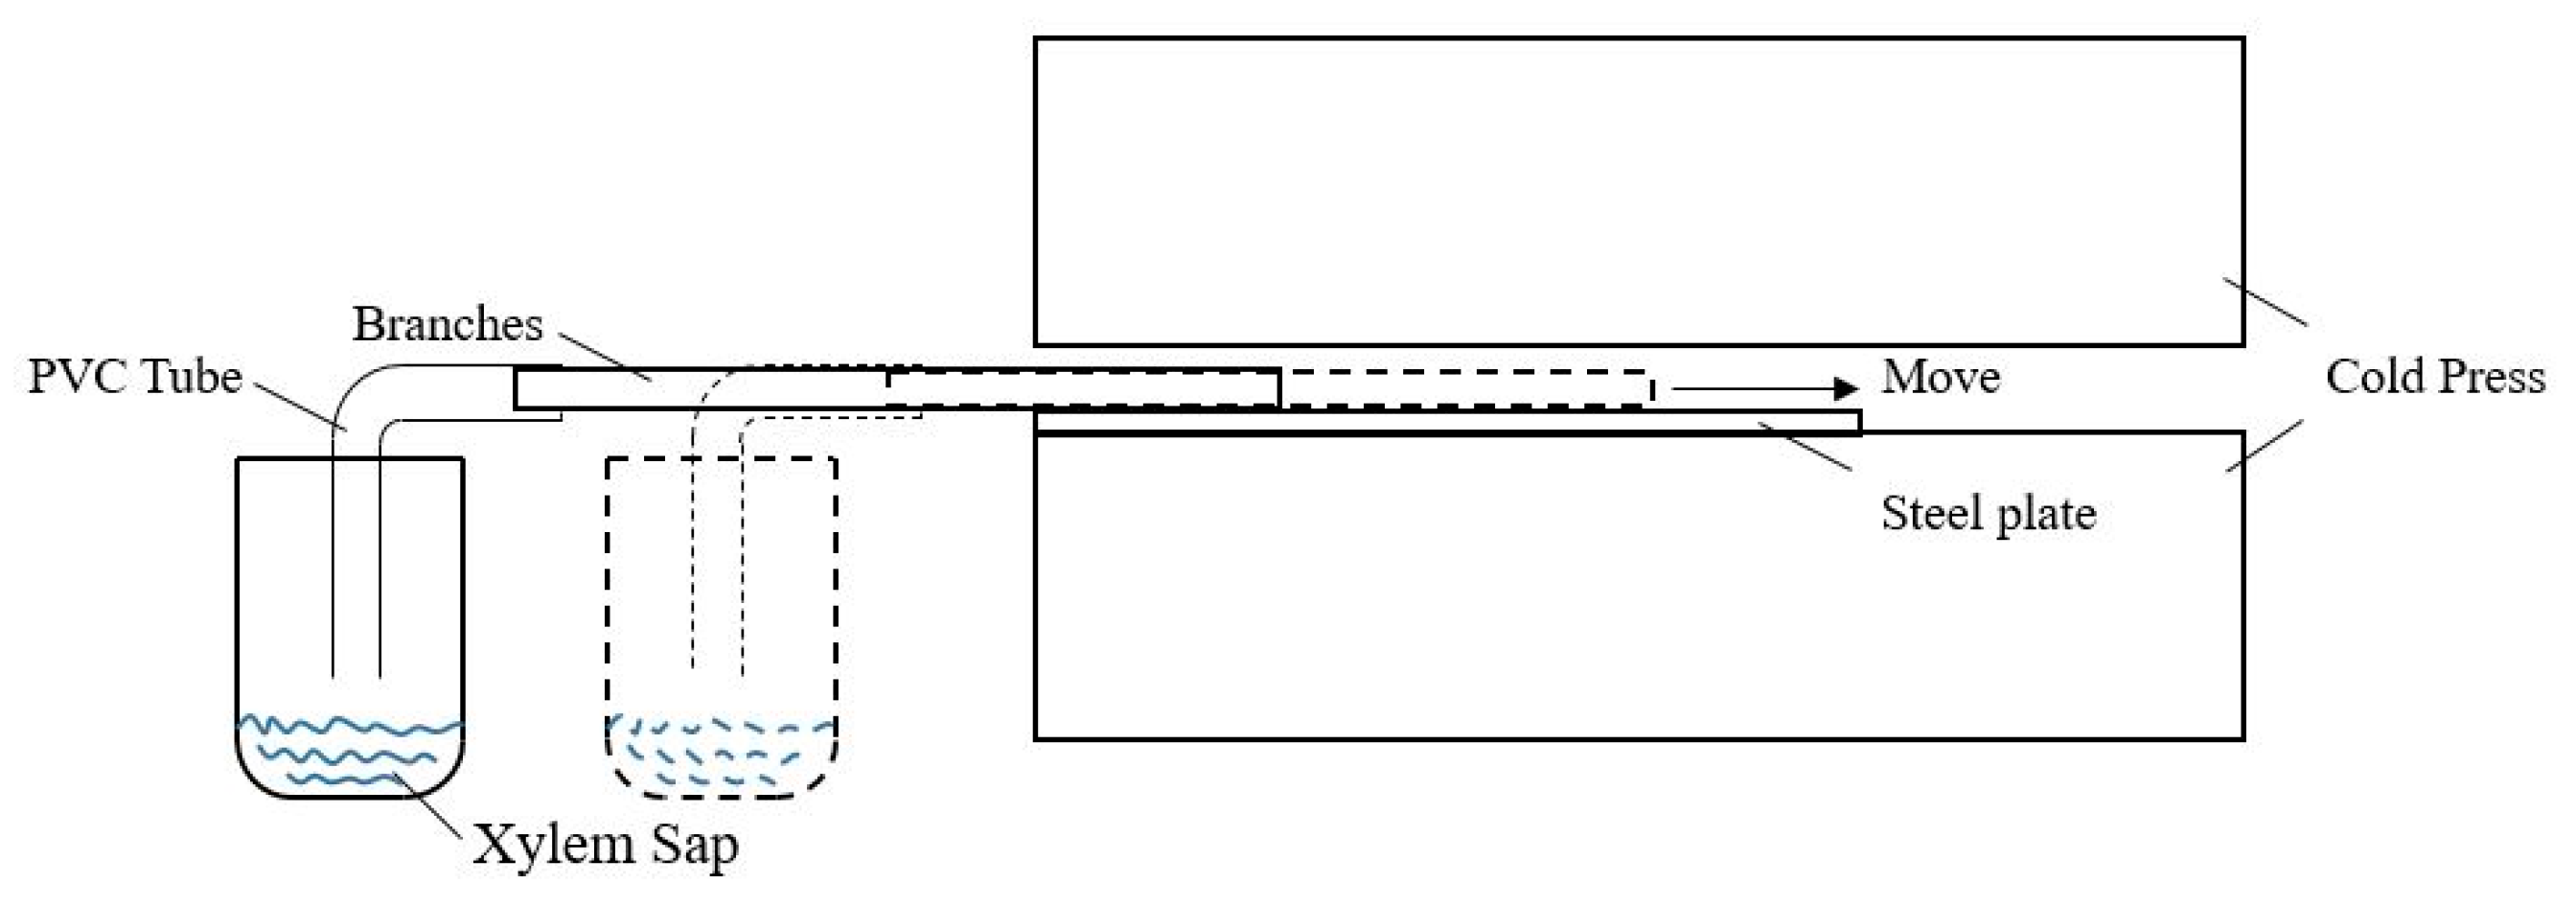
2.4. Xylem Sap Extraction

The collected branches were cut underwater with a sharp blade to remove the bark. The cut sections were washed with clean water for 2–3 min to remove cell debris and cytoplasm from the surface. After cleaning with a cotton cloth wipe, one end of the branches was placed on a steel plate with a size of 100 cm × 50 cm. Both of them were placed in the cold press. The steel plate was coated with releasing films to prevent the cold press from being stuck. In the beginning, the branches were controlled to avoid rotating. The distal end of the branches was pressed by 10 cm pressing, followed by successive 5 cm pressings to all the side branches until sap was observed. Then, the xylem sap was collected with beakers or other containers on the other end face of the branches hanging outside the cold press. A schematic diagram of the extraction is shown in Figure 1. The collected sap was transferred into the corresponding airtight test tubes for different tests. The remaining samples were sealed and kept in the refrigerator.
The principle of the extraction method used in this experiment was the same as that of Schenk et al. [18], which indicates that there are contaminants that originate from the repeated pressing of branches during the extraction in the xylem sap. Therefore, tests for contamination control from living cell remnants were conducted.

2.5. Contamination Control

The branches harvested in August 2022 were divided into two parts. One part of the branch was used to extract the xylem sap. The other part of the branch was sliced and placed in a 500 mL Erlenmeyer flask. A 300 mL amount of distilled water was poured into the flask. The flask was shaken frequently for 48 h at room temperature. After suction with a filter, the chemical composition of the water extract was analyzed.
The wood water extract obtained by the water extraction method was used as a control sample for contamination control and analyzed simultaneously with the collected xylem sap using gas chromatography–mass spectrometry (GC-MS).

2.6. Dynamic Viscosity Measurement

Dynamic viscosity measurements were conducted according to the national recommended standard GB/T 22235-2008 Determination of Liquid Viscosity [19]. An Ostwald viscometer with a diameter of 4 mm was used to measure the dynamic viscosity of the sample by calculating the time it takes for the liquid to fall at a certain height. The viscometer constant of the viscometer was 0.0032 mm2/s2. Every sample was measured five times and averaged to reduce error. During the test, the temperature of the samples was recorded.
At temperature t, the dynamic viscosity of the specimen (ηt) was calculated as follows:
ηt = C * τ * ρt
  • ηt—the dynamic viscosity of the specimen at temperature t, mPa·s;
  • C—viscometer constant, mm2/s2;
  • τ—the average flow time of the specimen, s;
  • ρt—the density of the specimen at temperature t, g/cm3.

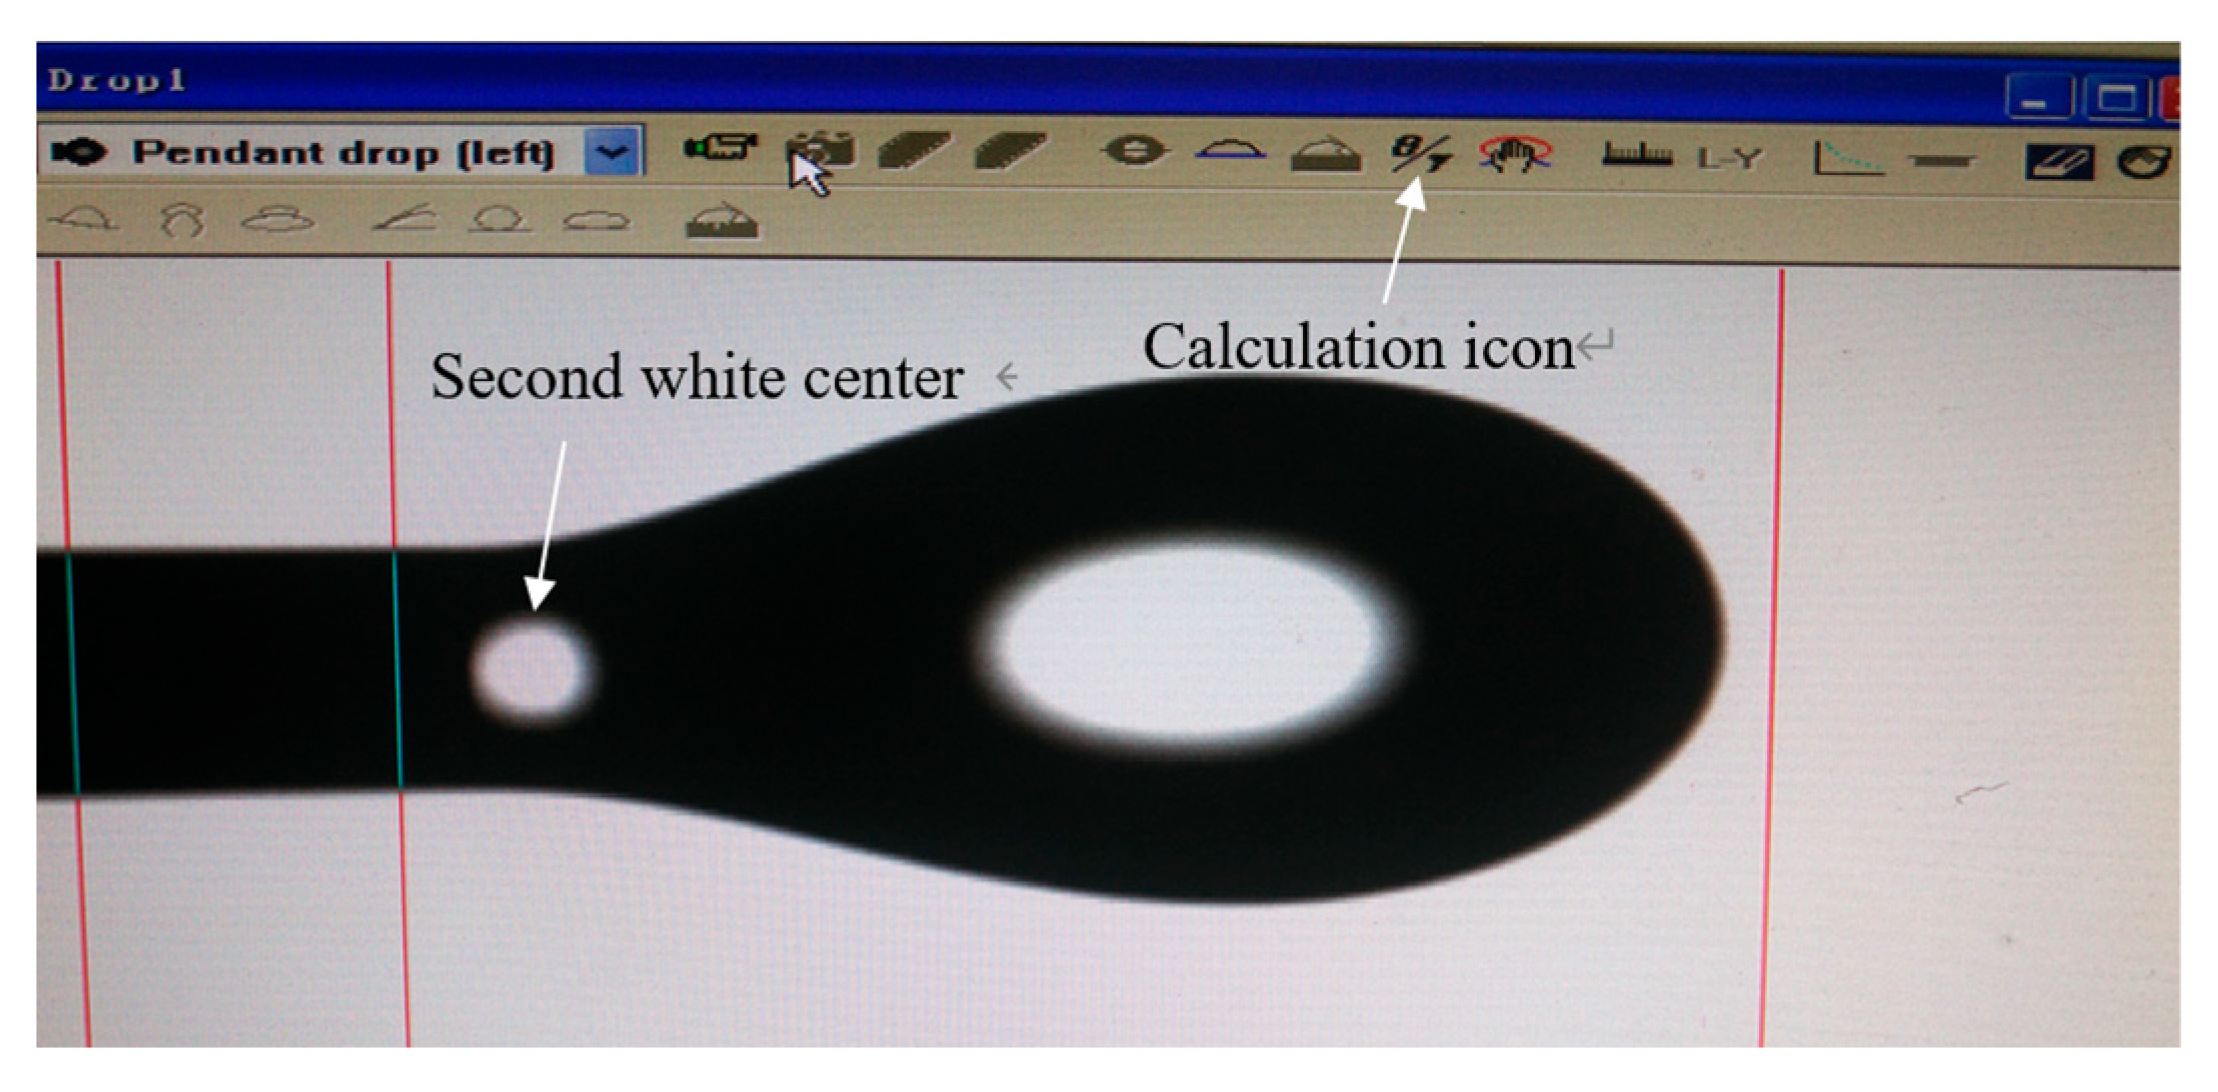
2.7. Interfacial Tension Measurement

Interfacial tension is usually measured using the hanging droplet method [12], which calculates the interfacial tension from the shape of the droplet naturally formed on a horizontal surface. The interfacial tension of the liquid was measured by an automatic droplet contact angle measuring instrument.
The 0.5 mL sample was aspirated into a flat-tipped syringe dedicated to measurement. The syringe was fixed to the instrument, and the position of the syringe needle was adjusted to appear in the image. The density of the sample was entered into the software SCA20 (version 4.3.19) to provide parameters for the calculation. The computer-controlled syringe pump moved down to push the droplet. The pump stopped pushing until the second white center just appeared in the image (Figure 2). The digital image of a hanging droplet was not captured until it reached a static equilibrium (interfacial tension versus gravity). The interfacial tension was obtained by analyzing the profile of the droplet. Every sample was measured five times and averaged to reduce errors. To prevent the liquid from evaporating, the liquid was tested in a special box. During the test, the temperature of the samples was recorded.

2.8. Organic Component Analysis

Gas chromatography–mass spectrometry was used for the determination of organic components’ concentration.
Sample preparation: 10 mL xylem sap was freeze-dried to remove moisture. After drying, the sample was placed in a derivative test tube, and a 2 mg of a mixture of bis-(trimethylsilyl) trifluoroacetamide (BSTFA) and dimethylformamide (DMF) (volume ratio of 1:1) was added and heated in a water bath at 80 °C for 45 min. After the sample was cooled, 0.5 mL acetone was added and the sample fully oscillated. After filtration with a 0.22 μm water filter, the sample was well prepared for the examination of gas chromatography–mass spectrometry.
The Trace ISQ 1300 GC-MS was used for the gas chromatography–mass spectrometry, and the sample size was 1 μL. The gas chromatographic separation was carried out using a DB-5MS capillary column. The carrier gas was He (≥99.999%). The inlet temperature was 250 °C. The column temperature program was from 60 °C (60 °C for 1 min) to 280 °C at a heating rate of 15 °C/min, then remained at 280 °C for 8 min.

2.9. Inorganic Cation Analysis

The atomic absorption spectrum was used for the determination of inorganic cations’ concentration.
Sample preparation: Each 1 mL sample was accurately poured into a Petri dish and then 2.5 mL nitric acid and 0.5 mL hydrogen peroxide were added. Covered with the lid, the Petri dish was placed on the electric heating plate for digestion. The solution was digested at room temperature for 1–2 h and then heated to 140 °C for 3 h to prevent sample carbonization in the middle of the process. When the white smoke appeared in the digestion solution and the white powder crystallized, the conical flask was removed and cooled. Then, about 2 mL of water was added. After repeating the process, the digestion solution was transferred into a 100 mL volumetric flask with a constant volume. At the same time, the blank sample was treated using the same method. After standing, the sample was well prepared for the examination of the atomic absorption spectrum.
Standard solution preparation: The single-element control solution respectively containing K, Na, Ca, and Mg was diluted with 10% nitric acid solution to prepare a solution containing 10 μg/mL, 0.5 μg mL, 1 μg/mL, 1 μg/mL, and 1 μg/mL of K, Na, Ca, and Mg.
The Platinum Elmer AA900T was used for the atomic absorption spectrum, and the sample size was 20μL. The gas type was air-acetylene, which uses 10 cm single-slit combustion. The flow rate of air was 15 L/min, and the flow rate of the acetylene was 2.3 L/min.

3. Results

3.1. Comparisons of Xylem Sap and Contamination Controls

In Figure 3, the concentrations of lipid, soluble sugar, and inositol in the poplar obtained in August are, respectively, 0.013 g/L, 0.156 g/L, and 0.161 g/L, which is slightly lower than those of metasequoia (0.032 g/L, 0.283 g/L, and 0.222 g/L). The concentrations of lipid, soluble sugar, and inositol in the xylem sap were not different from those in the wood, clearly demonstrating that the organic components in the xylem sap did not originate from cells cut open during the sap extraction.

3.2. Morphological Characteristics of Xylem Elements in Different Tree Species

The diameter frequency distribution and the mean diameter of metasequoia tracheids and poplar conduits are shown in Figure 4a,b. It shows a normal distribution for the mean diameters according to the Shapiro–Wilk test (p > 0.05). For the metasequoia tracheids, 53% of diameters varied between 30.0 and 35.0 µm, while 33% of the poplar conduits altered between 80.0 and 90.0 µm, respectively.
Poplar is a broad-leaved tree with large and numerous conduits. As exhibited in Figure 4c, the top and bottom end walls of the conduits penetrate one another, which is convenient for the transmission of xylem sap. Metasequoia is a conifer, thus xylem sap is mainly transported through tracheids. As shown in Figure 4d, the tracheids are closed up, and xylem sap can only pass through the pits on the two end walls of the tracheids.

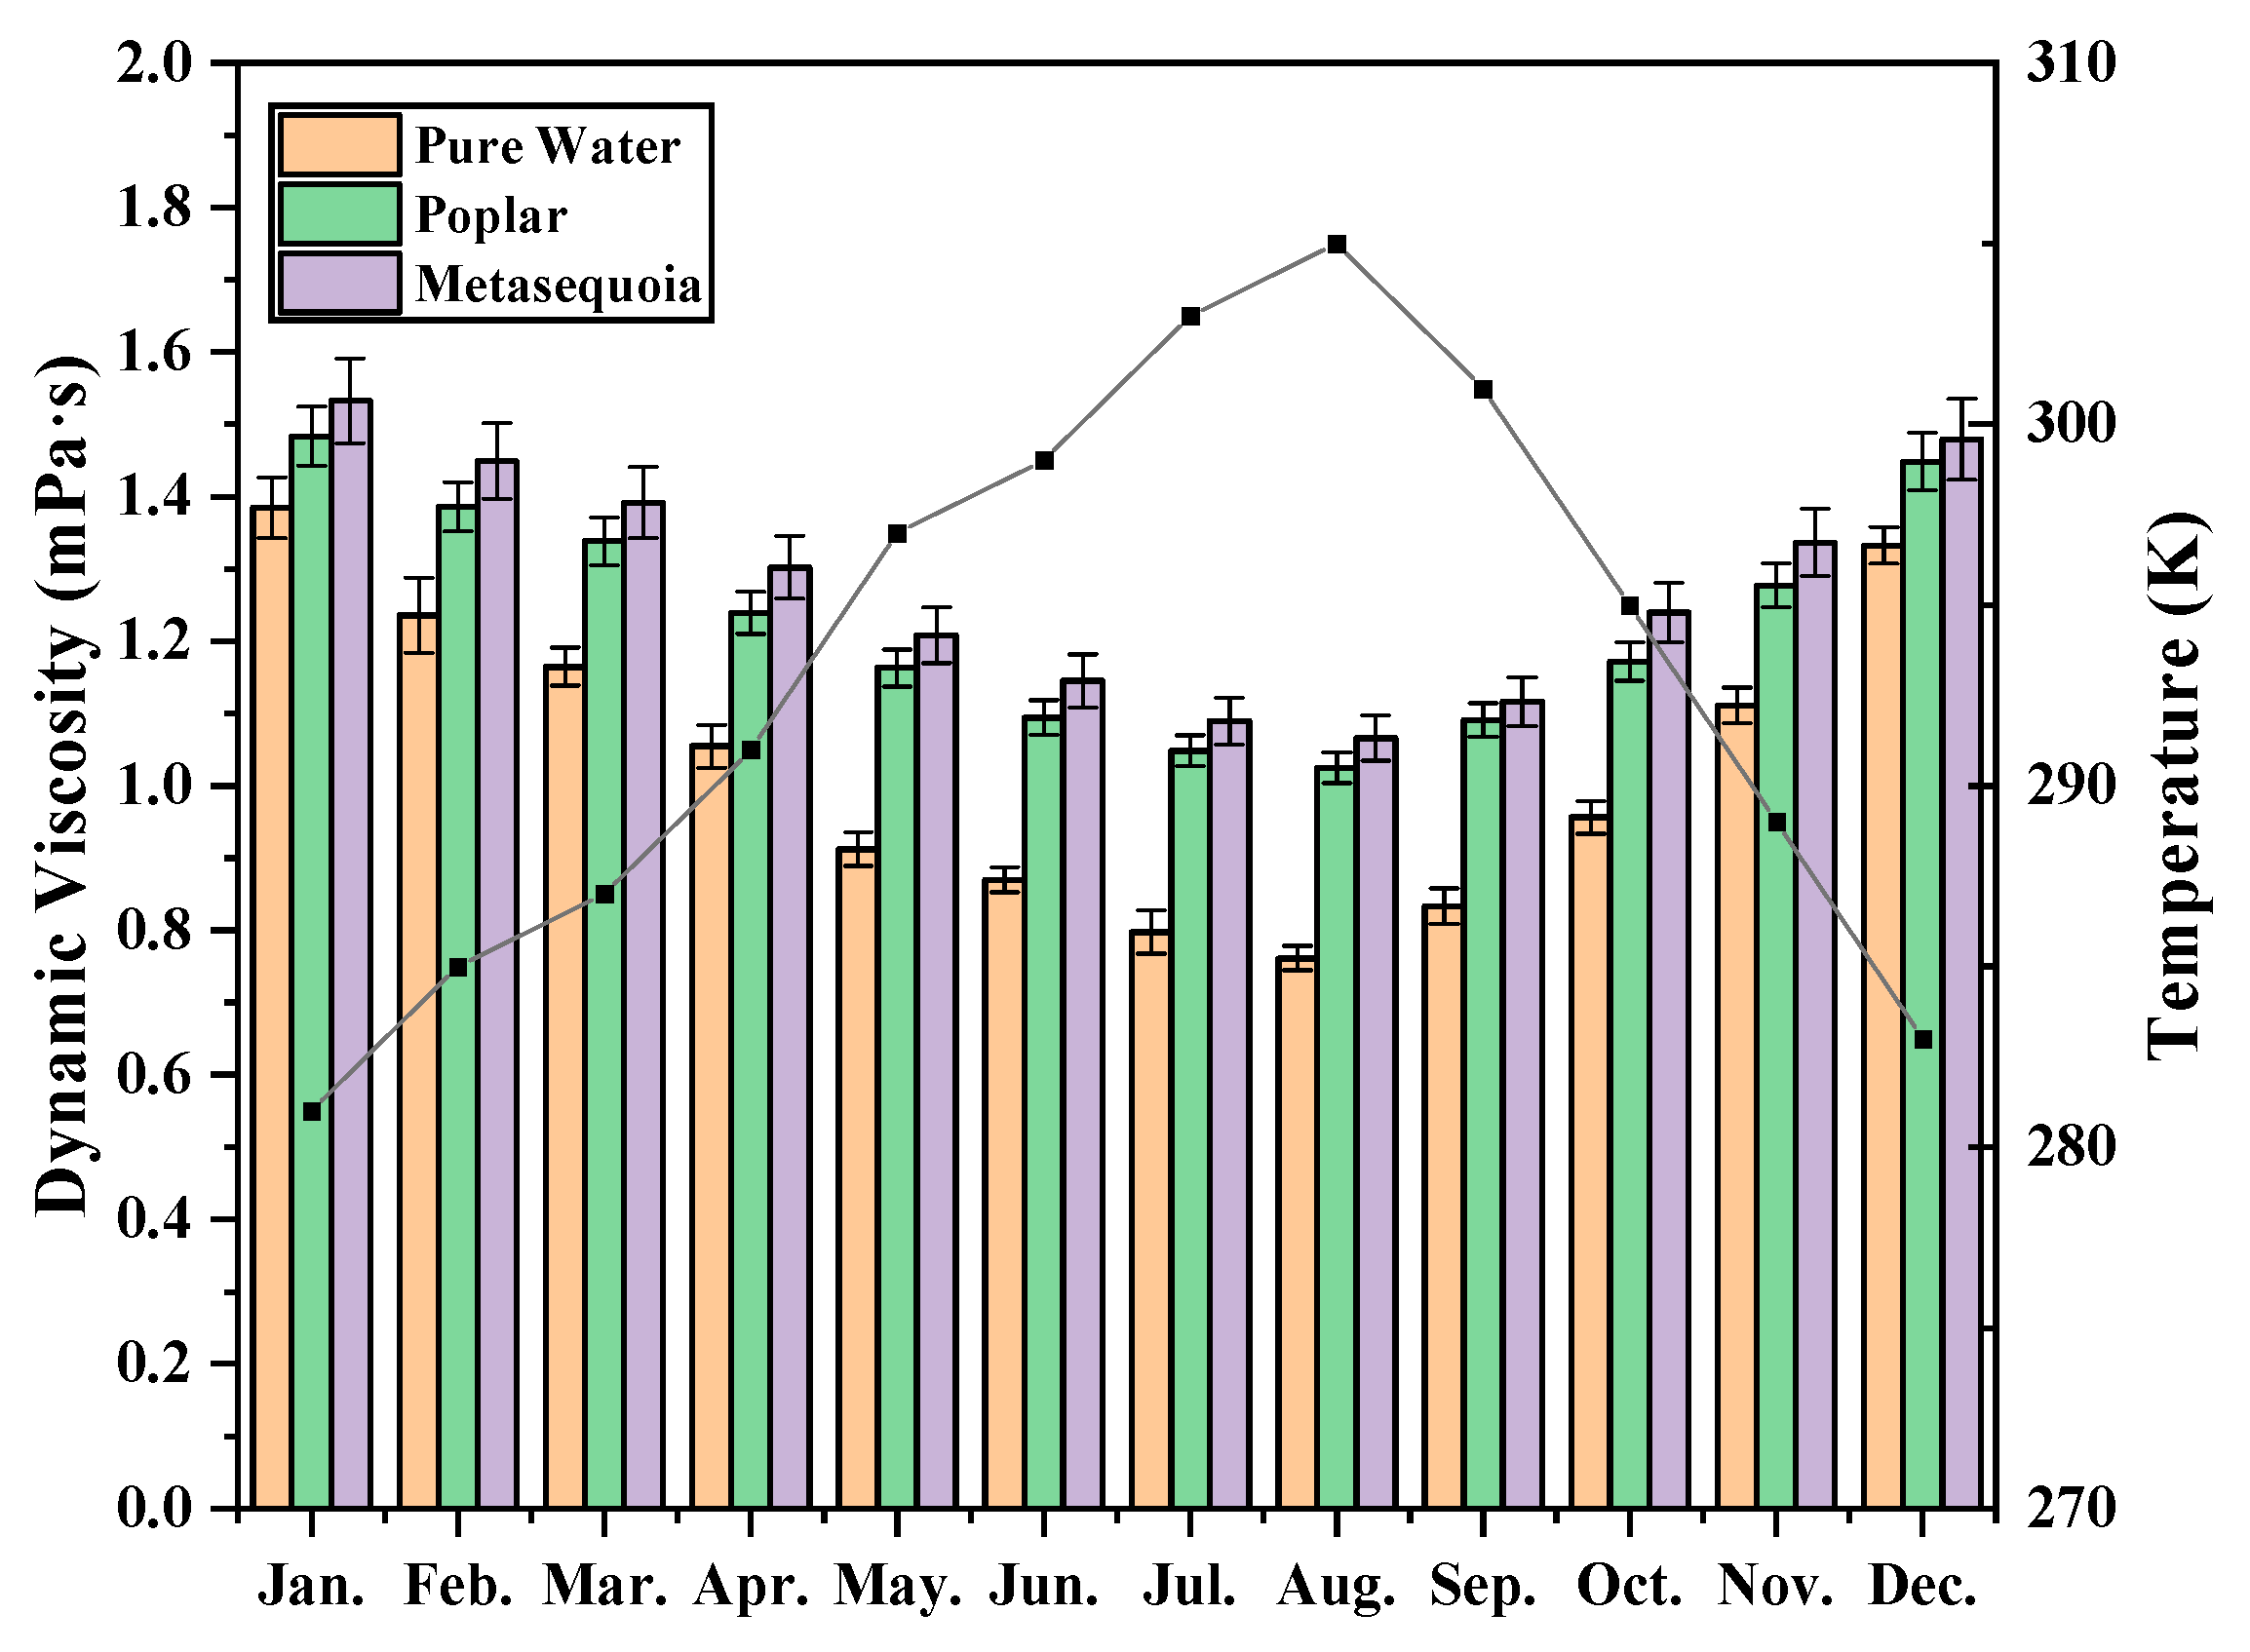
3.3. Monthly Variation of Dynamic Viscosity

As exhibited in Figure 5, the dynamic viscosity changes of poplar and metasequoia samples were basically the same in different months, and both showed an upward trend first and then a downward trend. The dynamic viscosity of xylem sap was the largest in January and the smallest in August. It showed a declining trend from January to August and then gradually increased again from September to December. Meanwhile, there was the same tendency for the monthly change of test temperature.
In the same month, the dynamic viscosity values of the poplar xylem sap were smaller than those of the metasequoia xylem sap. However, both were greater than the dynamic viscosity of pure water. Within a year, the maximum dynamic viscosity values of the xylem sap of poplar and metasequoia were 1.4835 mPa·s and 1.5330 mPa·s, and the minimum values were 1.0251 mPa·s and 1.0664 mPa·s, respectively. From September to December, the dynamic viscosity values of poplar sap and metasequoia sap gradually recovered, reaching 1.4486 mPa·s and 1.4796 mPa·s in December, respectively.

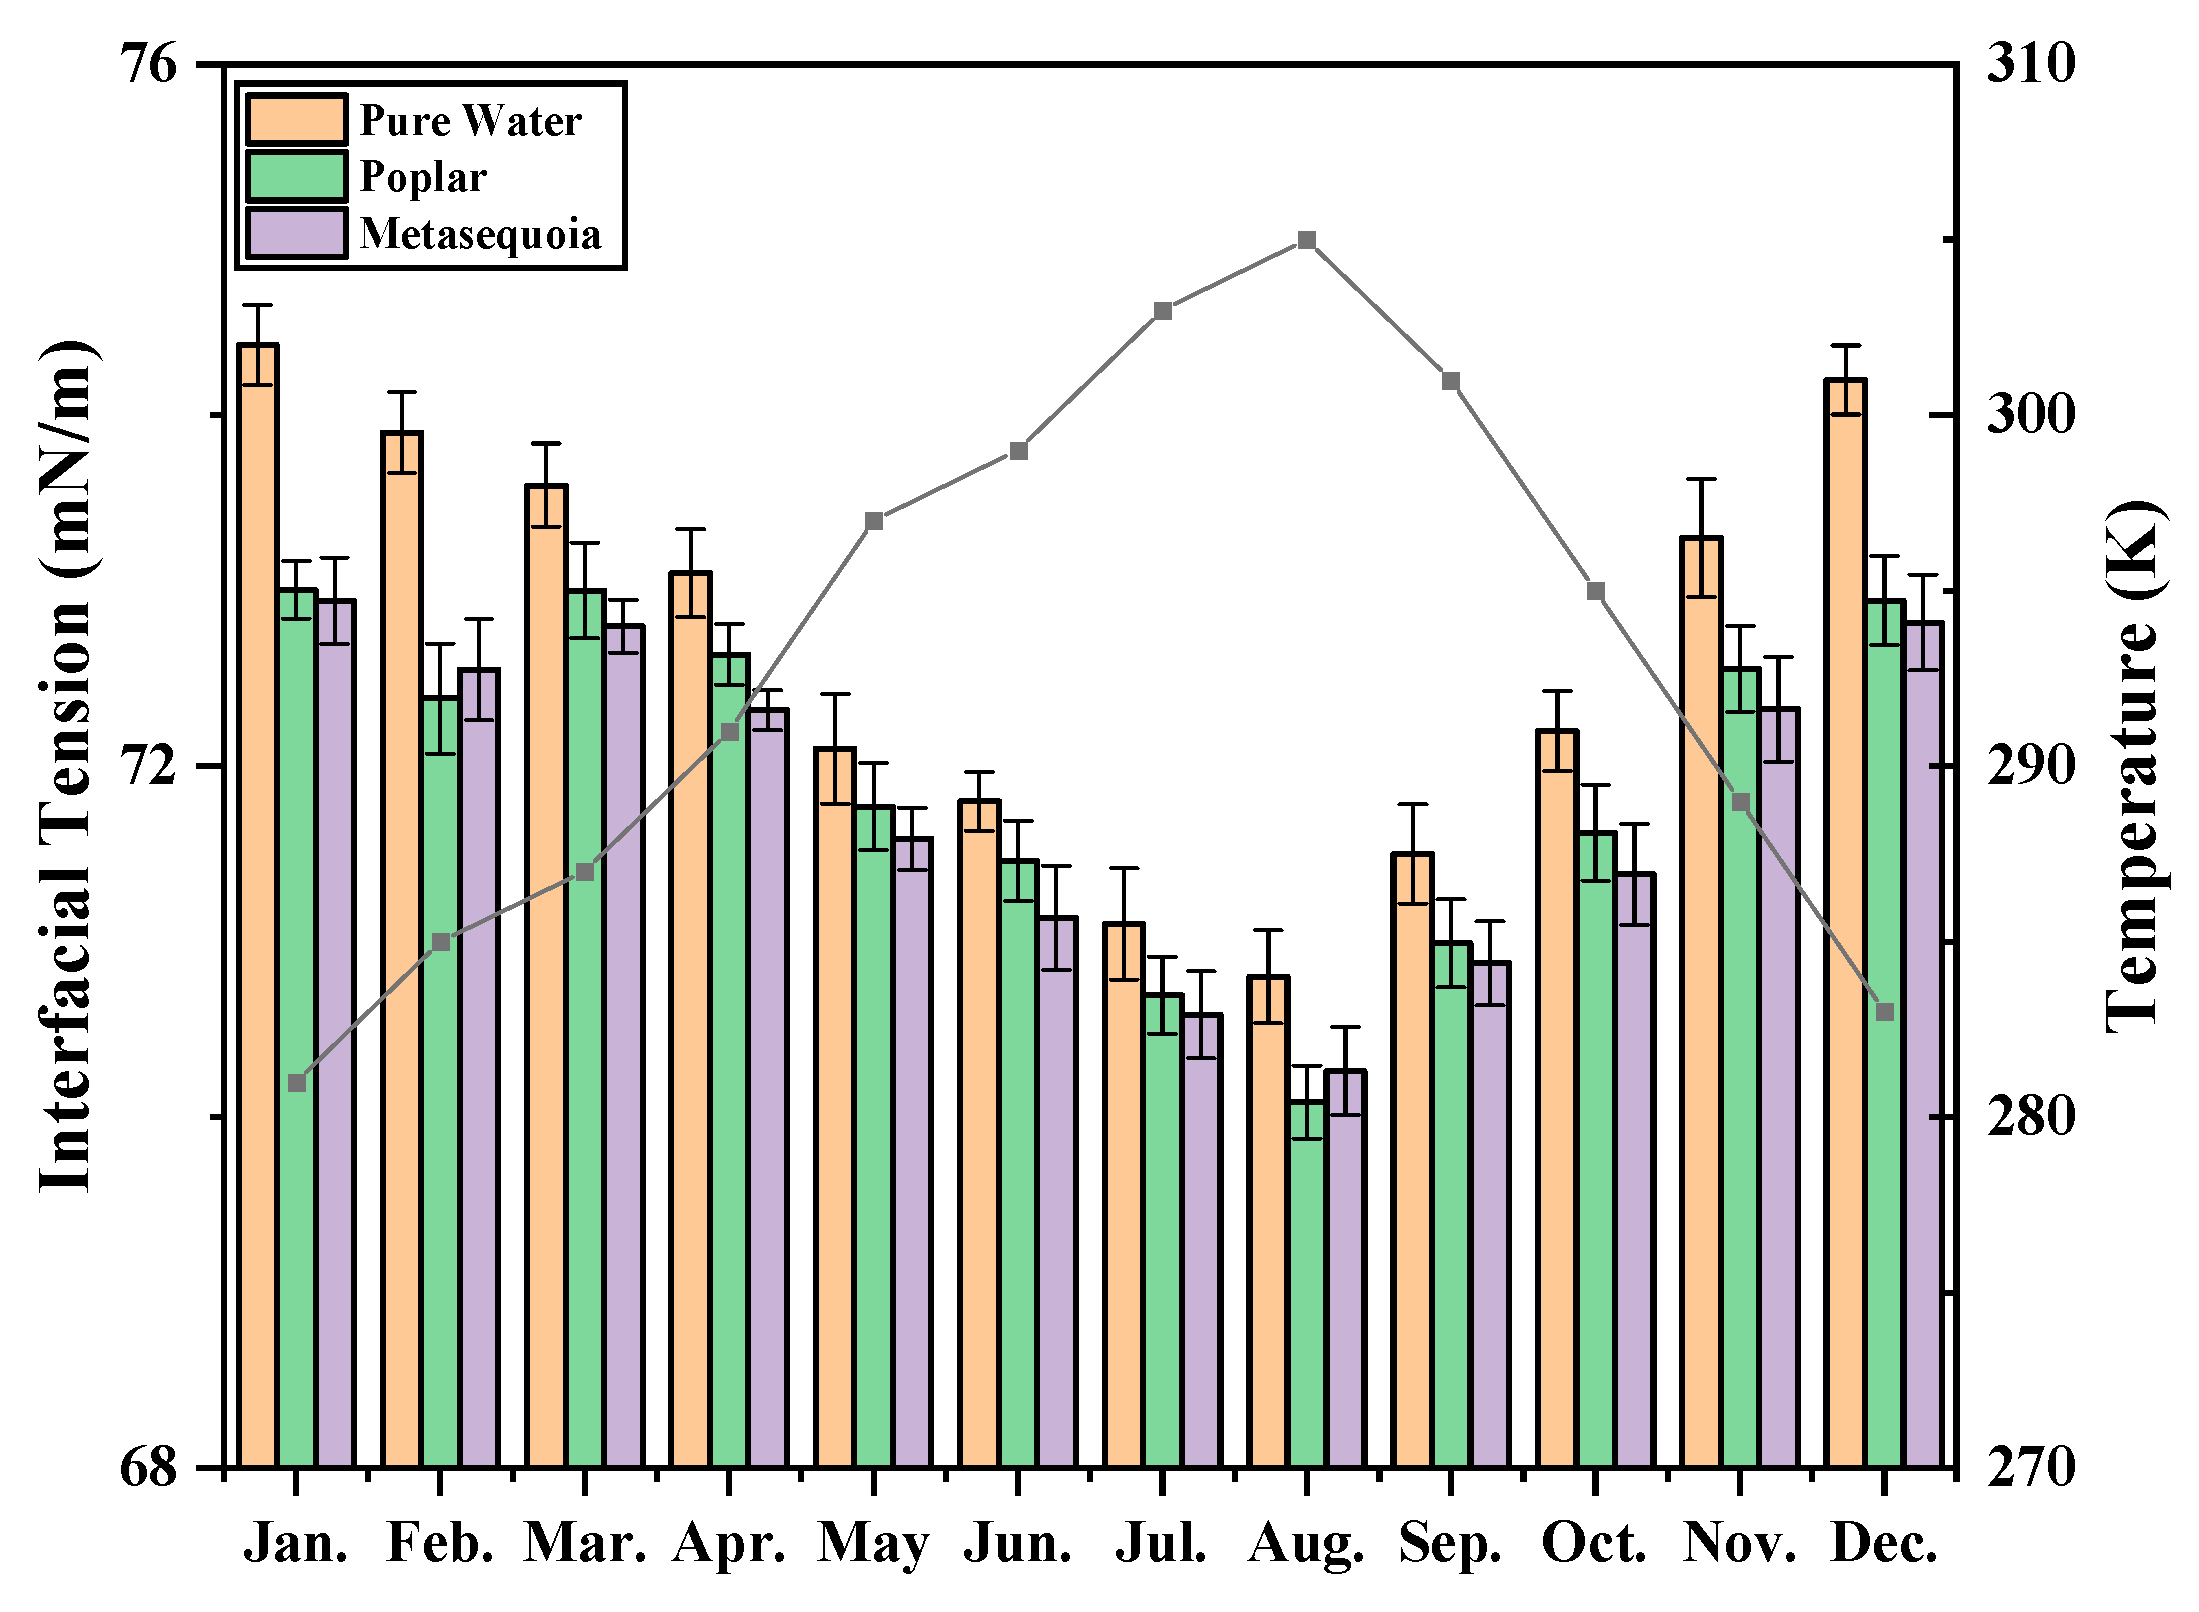
3.4. Monthly Variation of Interfacial Tension

As exhibited in Figure 6, the changing trend of the interfacial tension of the poplar and metasequoia samples in different months was basically the same, both showing a trend of decreasing first and then increasing. In January, the interfacial tension of the xylem sap was at its highest point, and the interfacial tension of the xylem sap reached its lowest point in August; from January to August, the interfacial tension of the xylem sap samples generally showed a declining trend; from September to December, the interfacial tension of the xylem sap gradually rose again. At the same time, the test temperature of every month followed the same trend.
During the year, the interfacial tension values of pure water were higher than those of the poplar xylem sap and metasequoia xylem sap. The maximum interfacial tension values of the poplar and metasequoia sap were 73.01 mN/m and 72.94 mN/m, and the minimum values were 70.08 mN/m and 70.26 mN/m, respectively. From September to December, the interfacial tension of the saps from poplar and metasequoia gradually recovered, reaching 72.94 mN/m and 72.82 mN/m in December, respectively.

3.5. Monthly Variation of Daily Maximum Sap Velocity

Figure 7 displays the unimodal monthly variation of the sap velocity of poplar within a year. The peak occurred in August, followed by a sharp decrease from September to December, eventually reaching the bottom. Within a year, the maximum sap velocity was 572.1 g/h, and the minimum was 26.33 g/h. From January to July, the sap velocity of poplar gradually recovered.

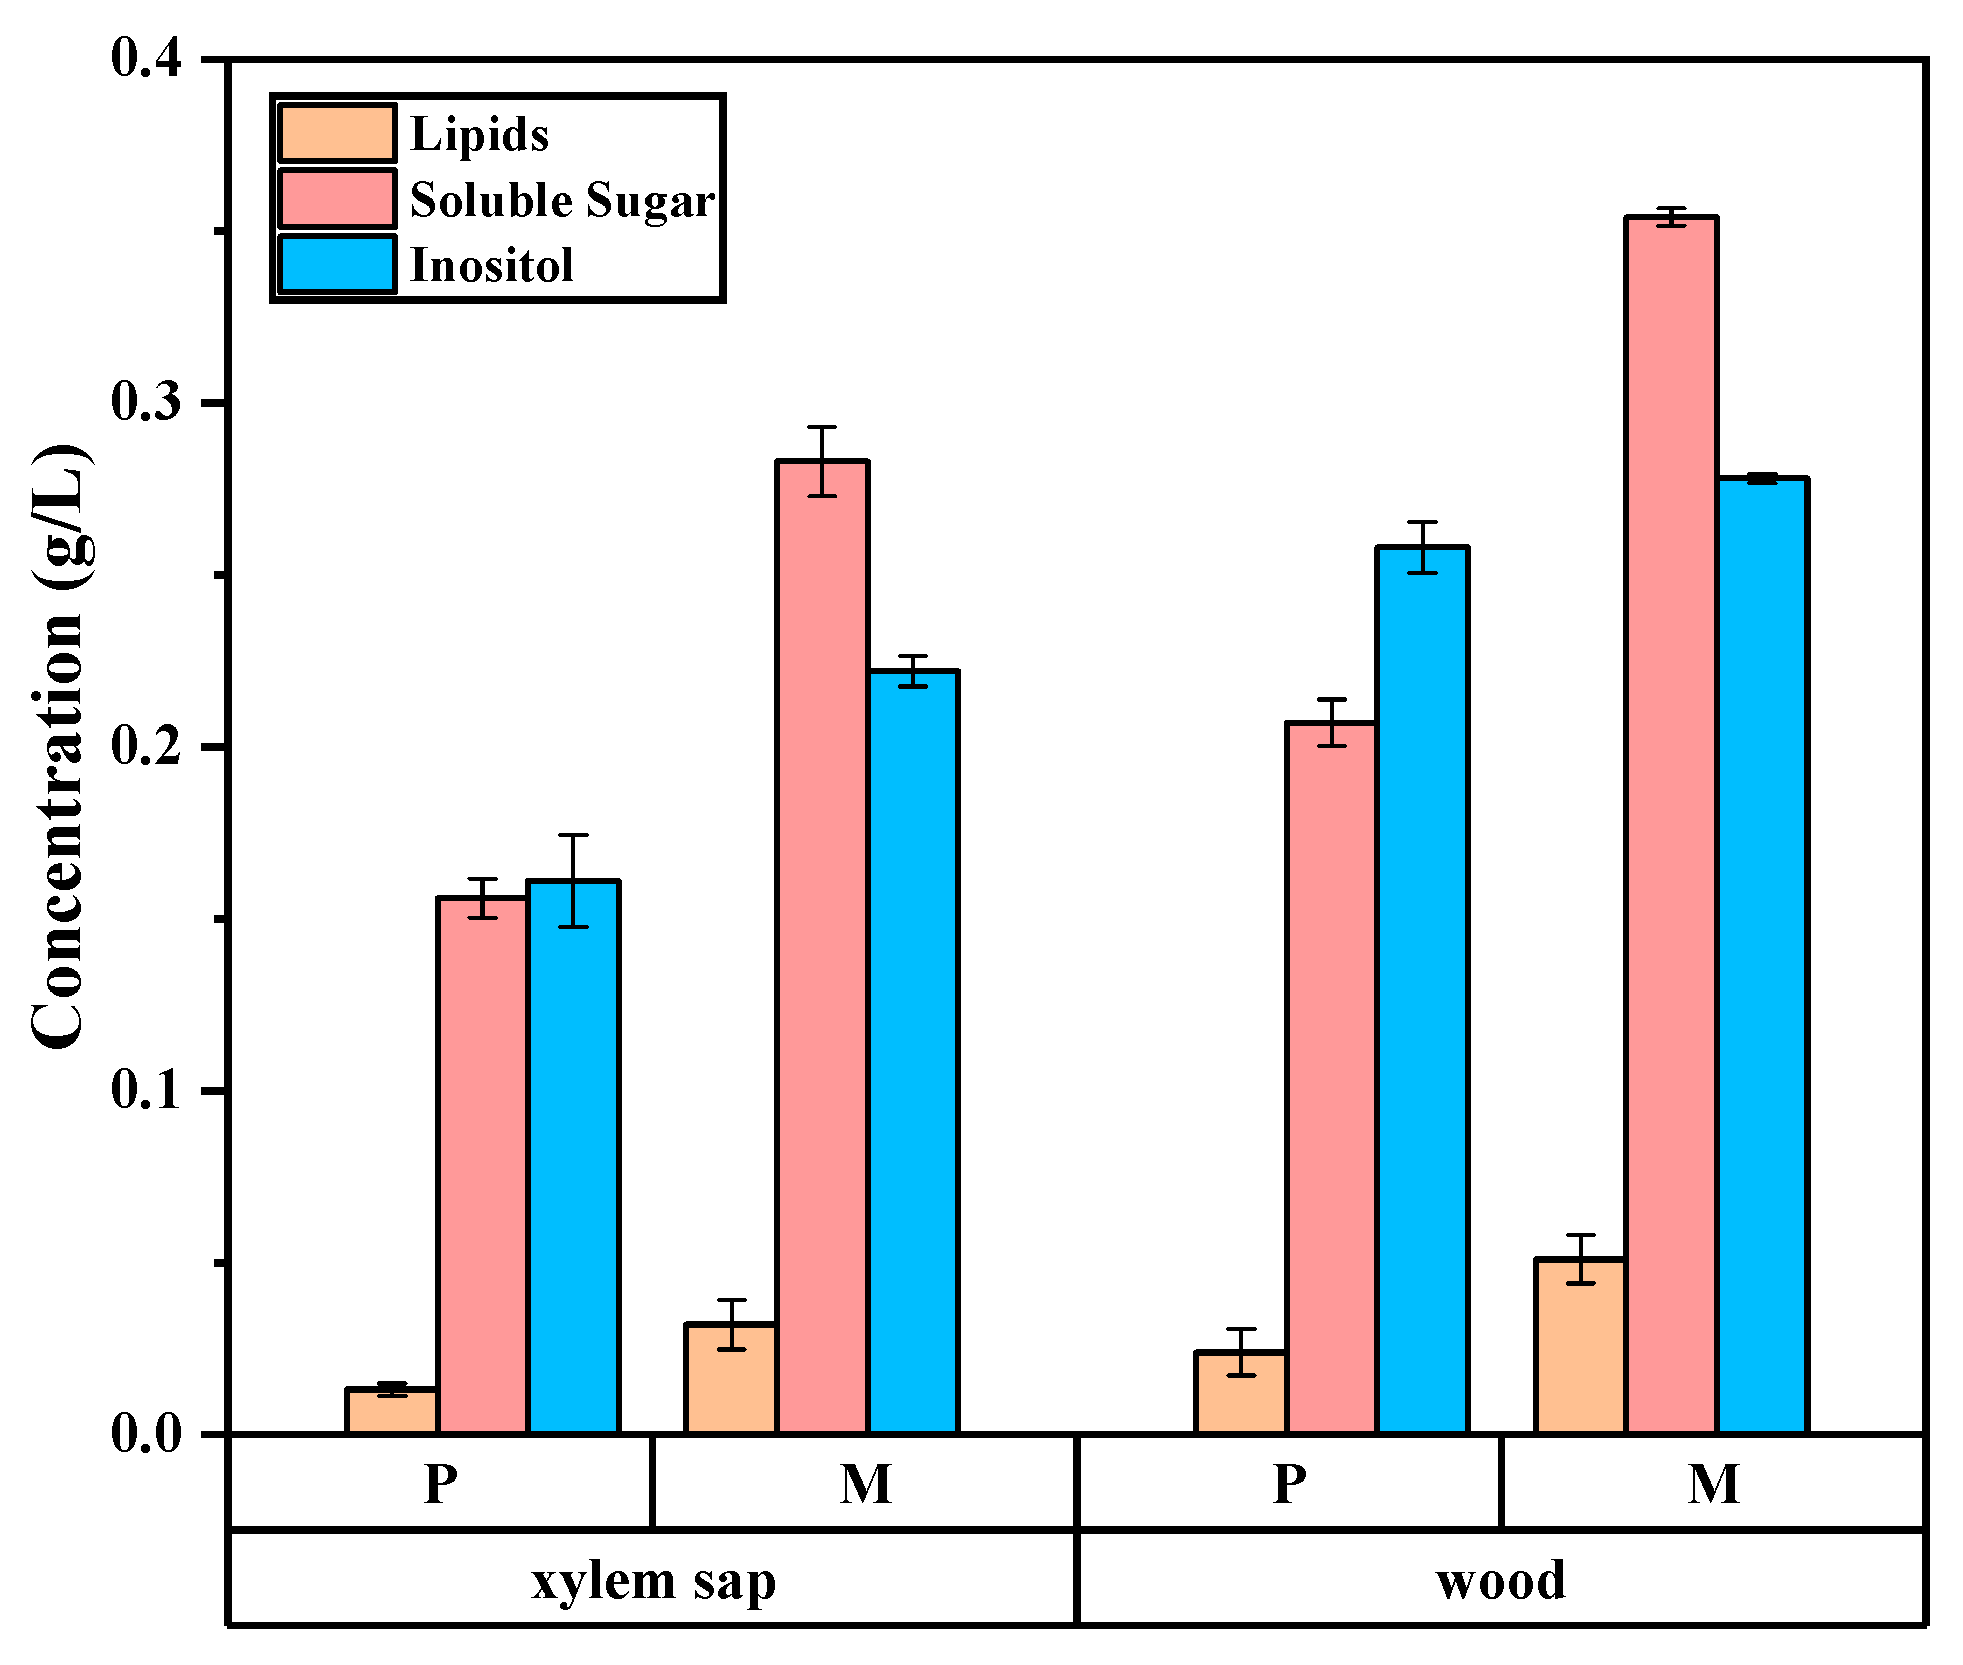
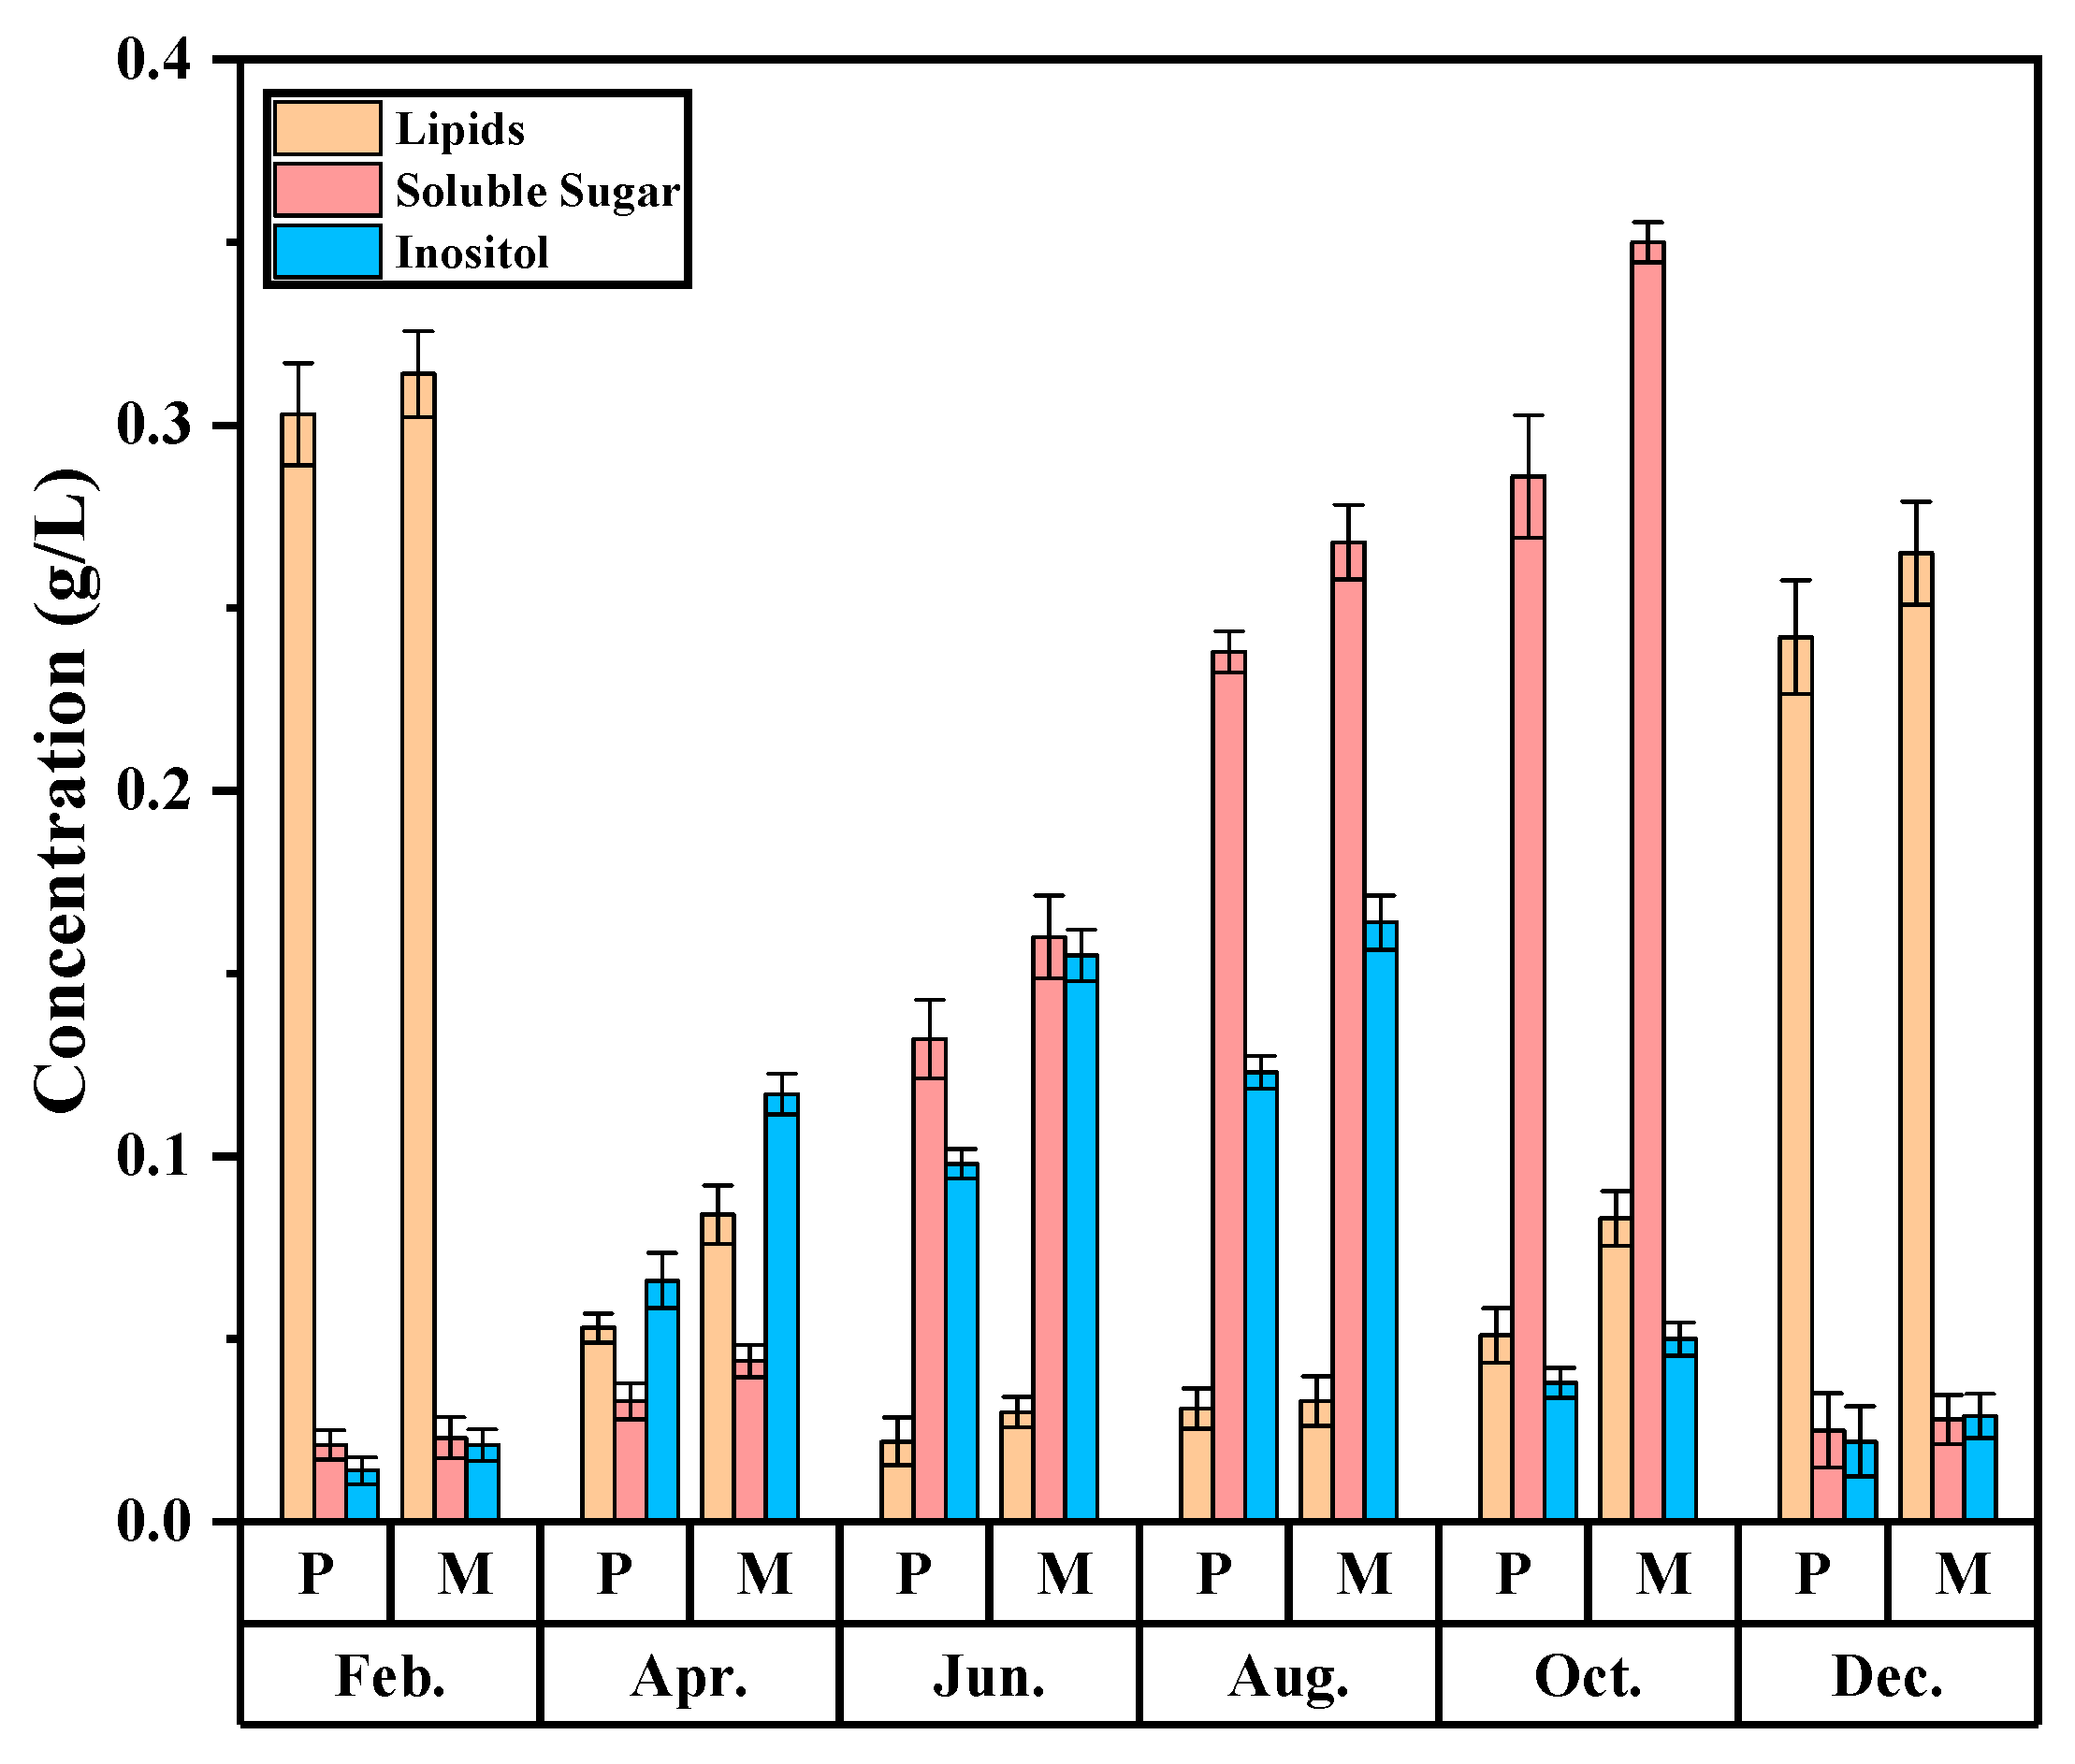
3.6. Monthly Variation of Organic Component

A total of 20 organic components were detected in all samples, mainly lipid, soluble sugar, and inositol. In autumn and winter, the main organic components of the poplar xylem sap were oleic acid and palmitic acid, and the main organic components of the metasequoia sap were oleic acid and lauric acid. They are long-chain lipids. In spring and summer, the main organic components of the poplar and metasequoia saps were fructose and D-pinitol. They are soluble sugars and inositol. Figure 8 was obtained by sorting the concentration of the main organic components.
In winter, trees are in the dormant period, and the carbohydrates in their bodies generate intermediate products through glycolysis and then synthesize long-chain lipids [20]. Grease is a highly efficient energy storage substance which can provide energy for the germination of spring buds. Therefore, the concentration of soluble sugars and inositol in the sap of poplar and metasequoia in February and December was relatively low, and that of various lipids was relatively high.
In April, due to the arrival of spring, trees begin to sprout, consuming a large number of lipids; thus, the lipid concentration rapidly decreases. Inositol is the precursor substance in the synthesis process of pectin and hemicellulose [21]. As the cell meristem accelerates, the concentration of inositol increases rapidly. In June and August, the cells in the summer trees continue to meristem, and the inositol concentration gradually increases. The dense leaves produce a large amount of sugar during photosynthesis, and the soluble sugar concentration increases significantly. In October, the cell meristem slows down significantly, so the inositol concentration decreases. At this time, the poplar and metasequoia still had some leaves, and sugars continued to accumulate.

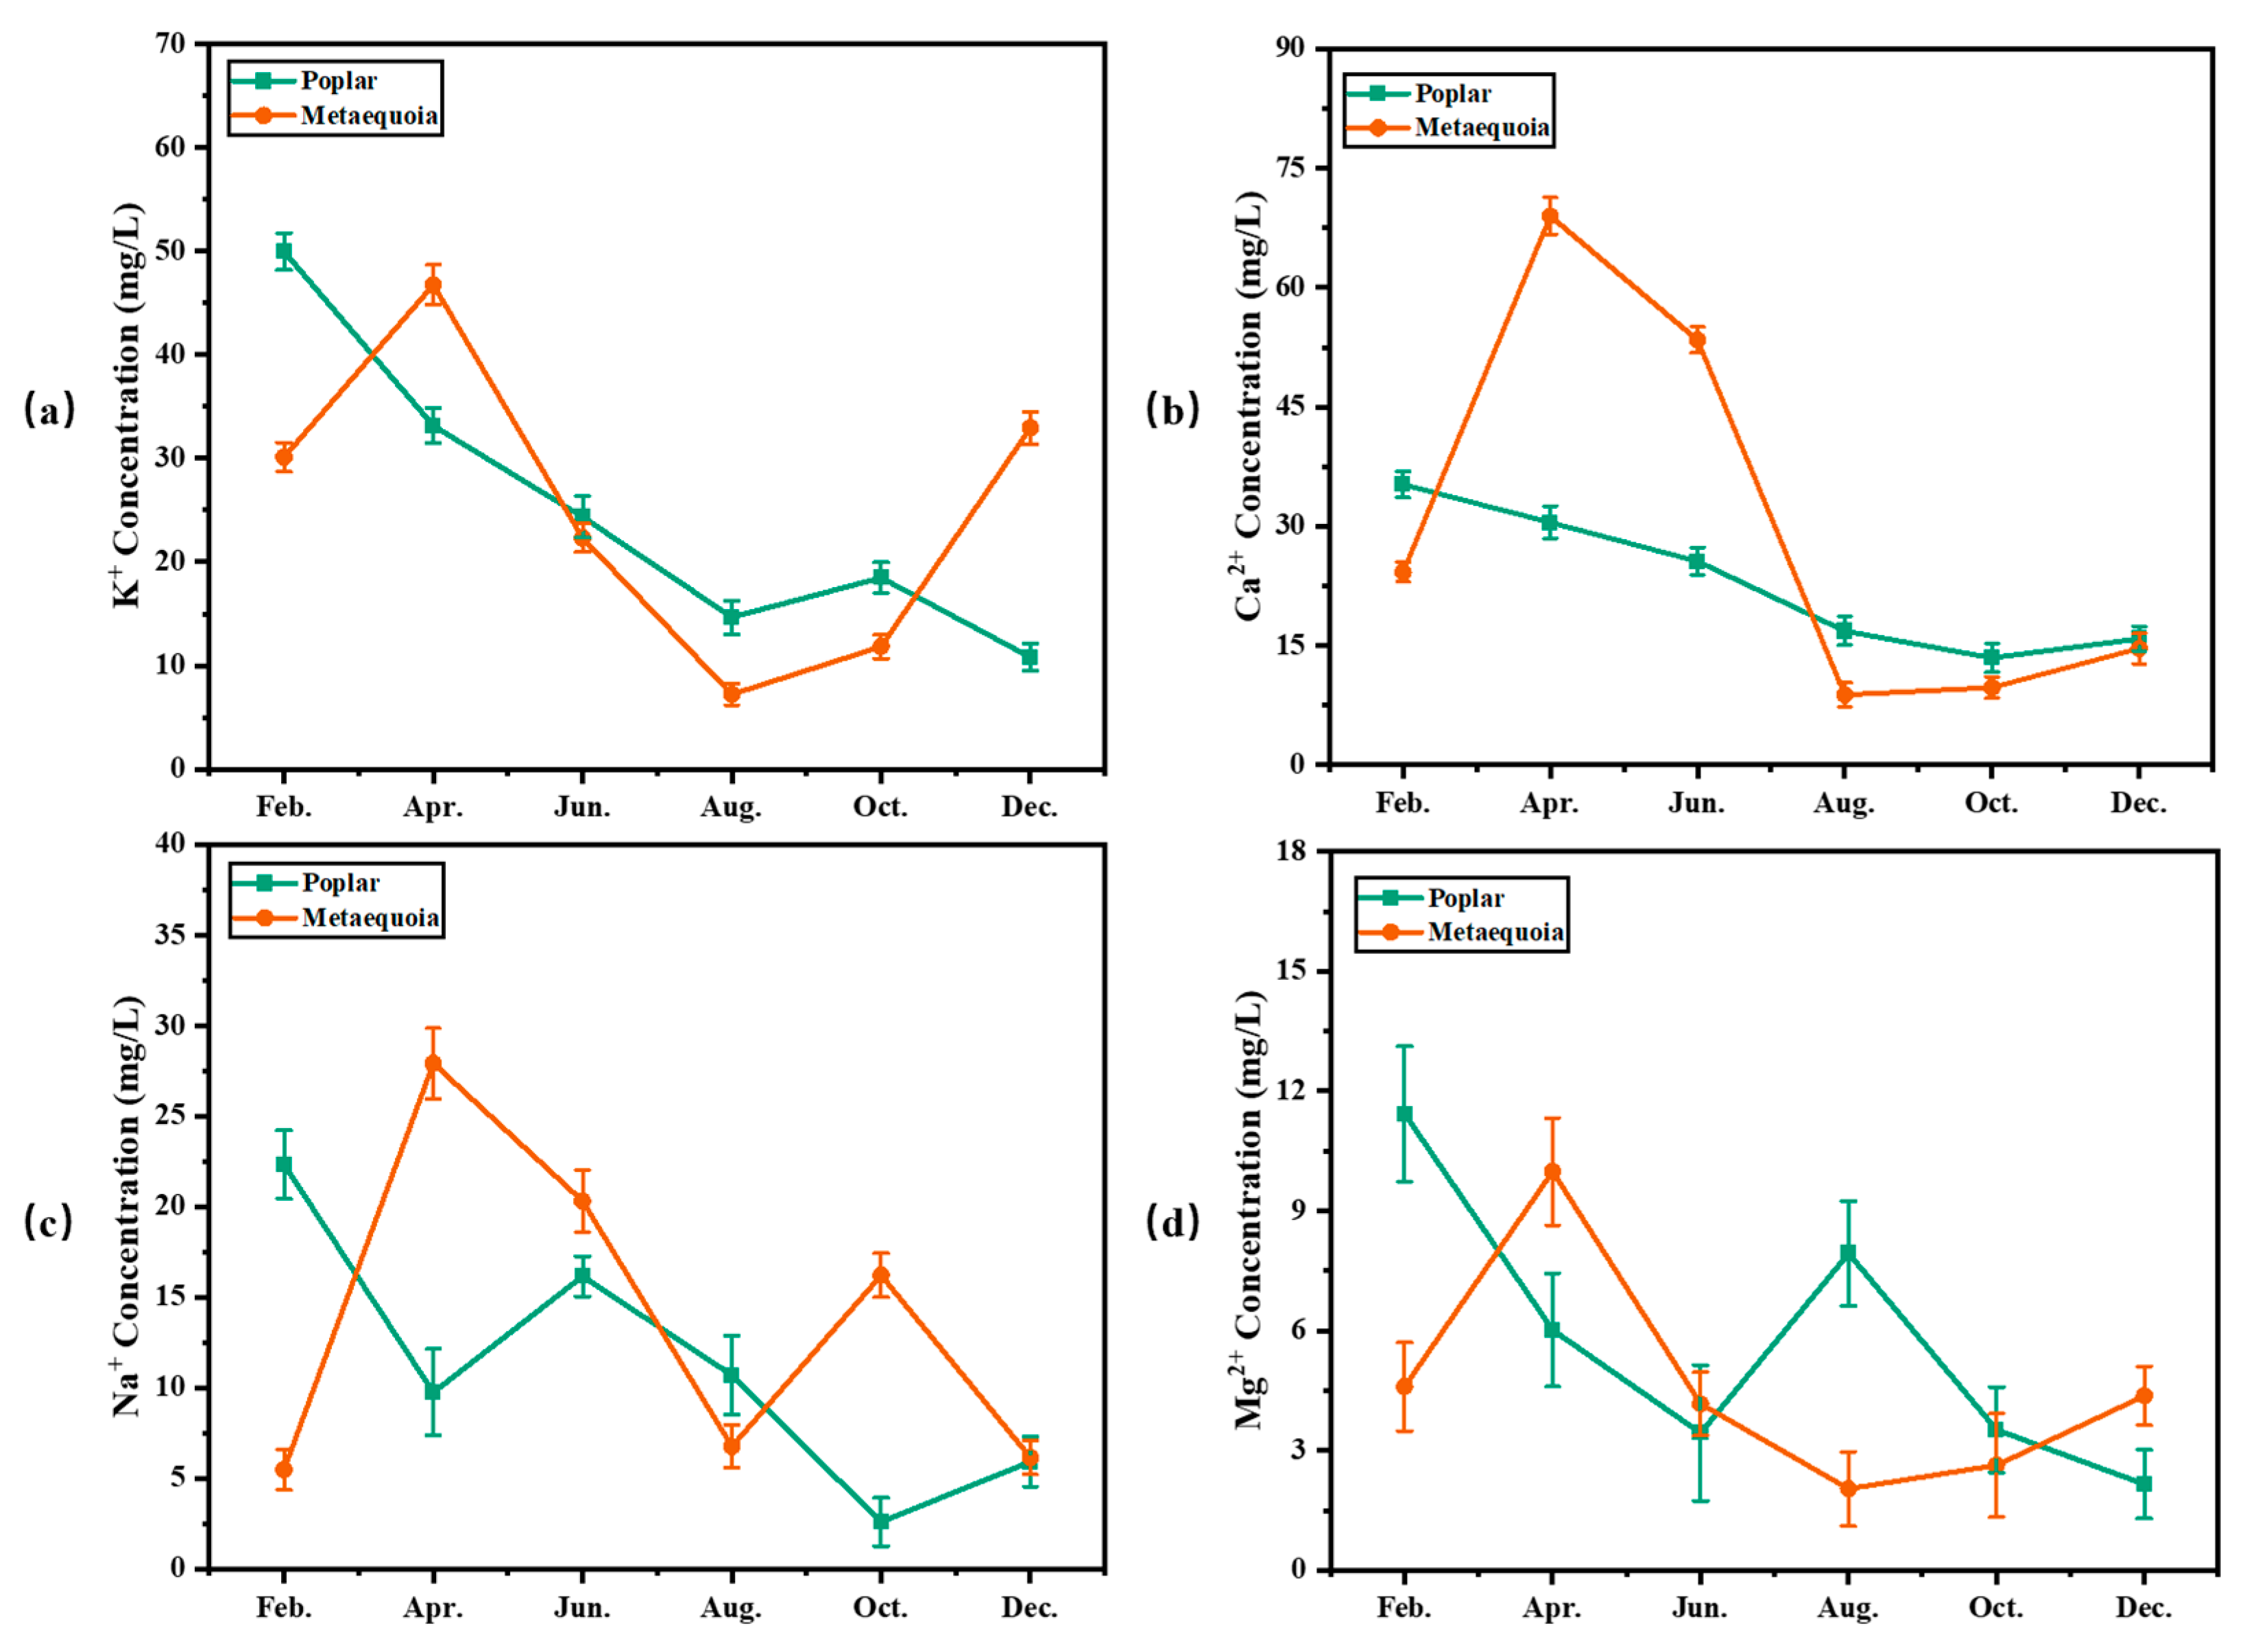
3.7. Monthly Variation of Inorganic Component

Figure 9 presents the variation curve of the main cation concentration in the xylem sap of poplar and metasequoia in different months. As shown in Figure 9, the concentration of K+ and Ca2+ in the xylem sap generally displayed a downward trend, while the concentration of Na+ and Mg2+ in the xylem sap fluctuated wildly. The concentration of K+ and Ca2+ in the xylem sap of the poplar gradually decreased in different months, while that in the xylem sap of metasequoia rose rapidly in April and suddenly fell in August.
In April, the high concentration of K+ can improve the efficiency of water conduction and increase the amount of water transport, which is conducive to the growth of trees in spring [22]. K+ and Ca2+ are significant signal components of controlling the stomata opening and closing, and guard cells take up K+ and Ca2+ from June to August, resulting in a descent of K+ concentration [23,24].

4. Discussion

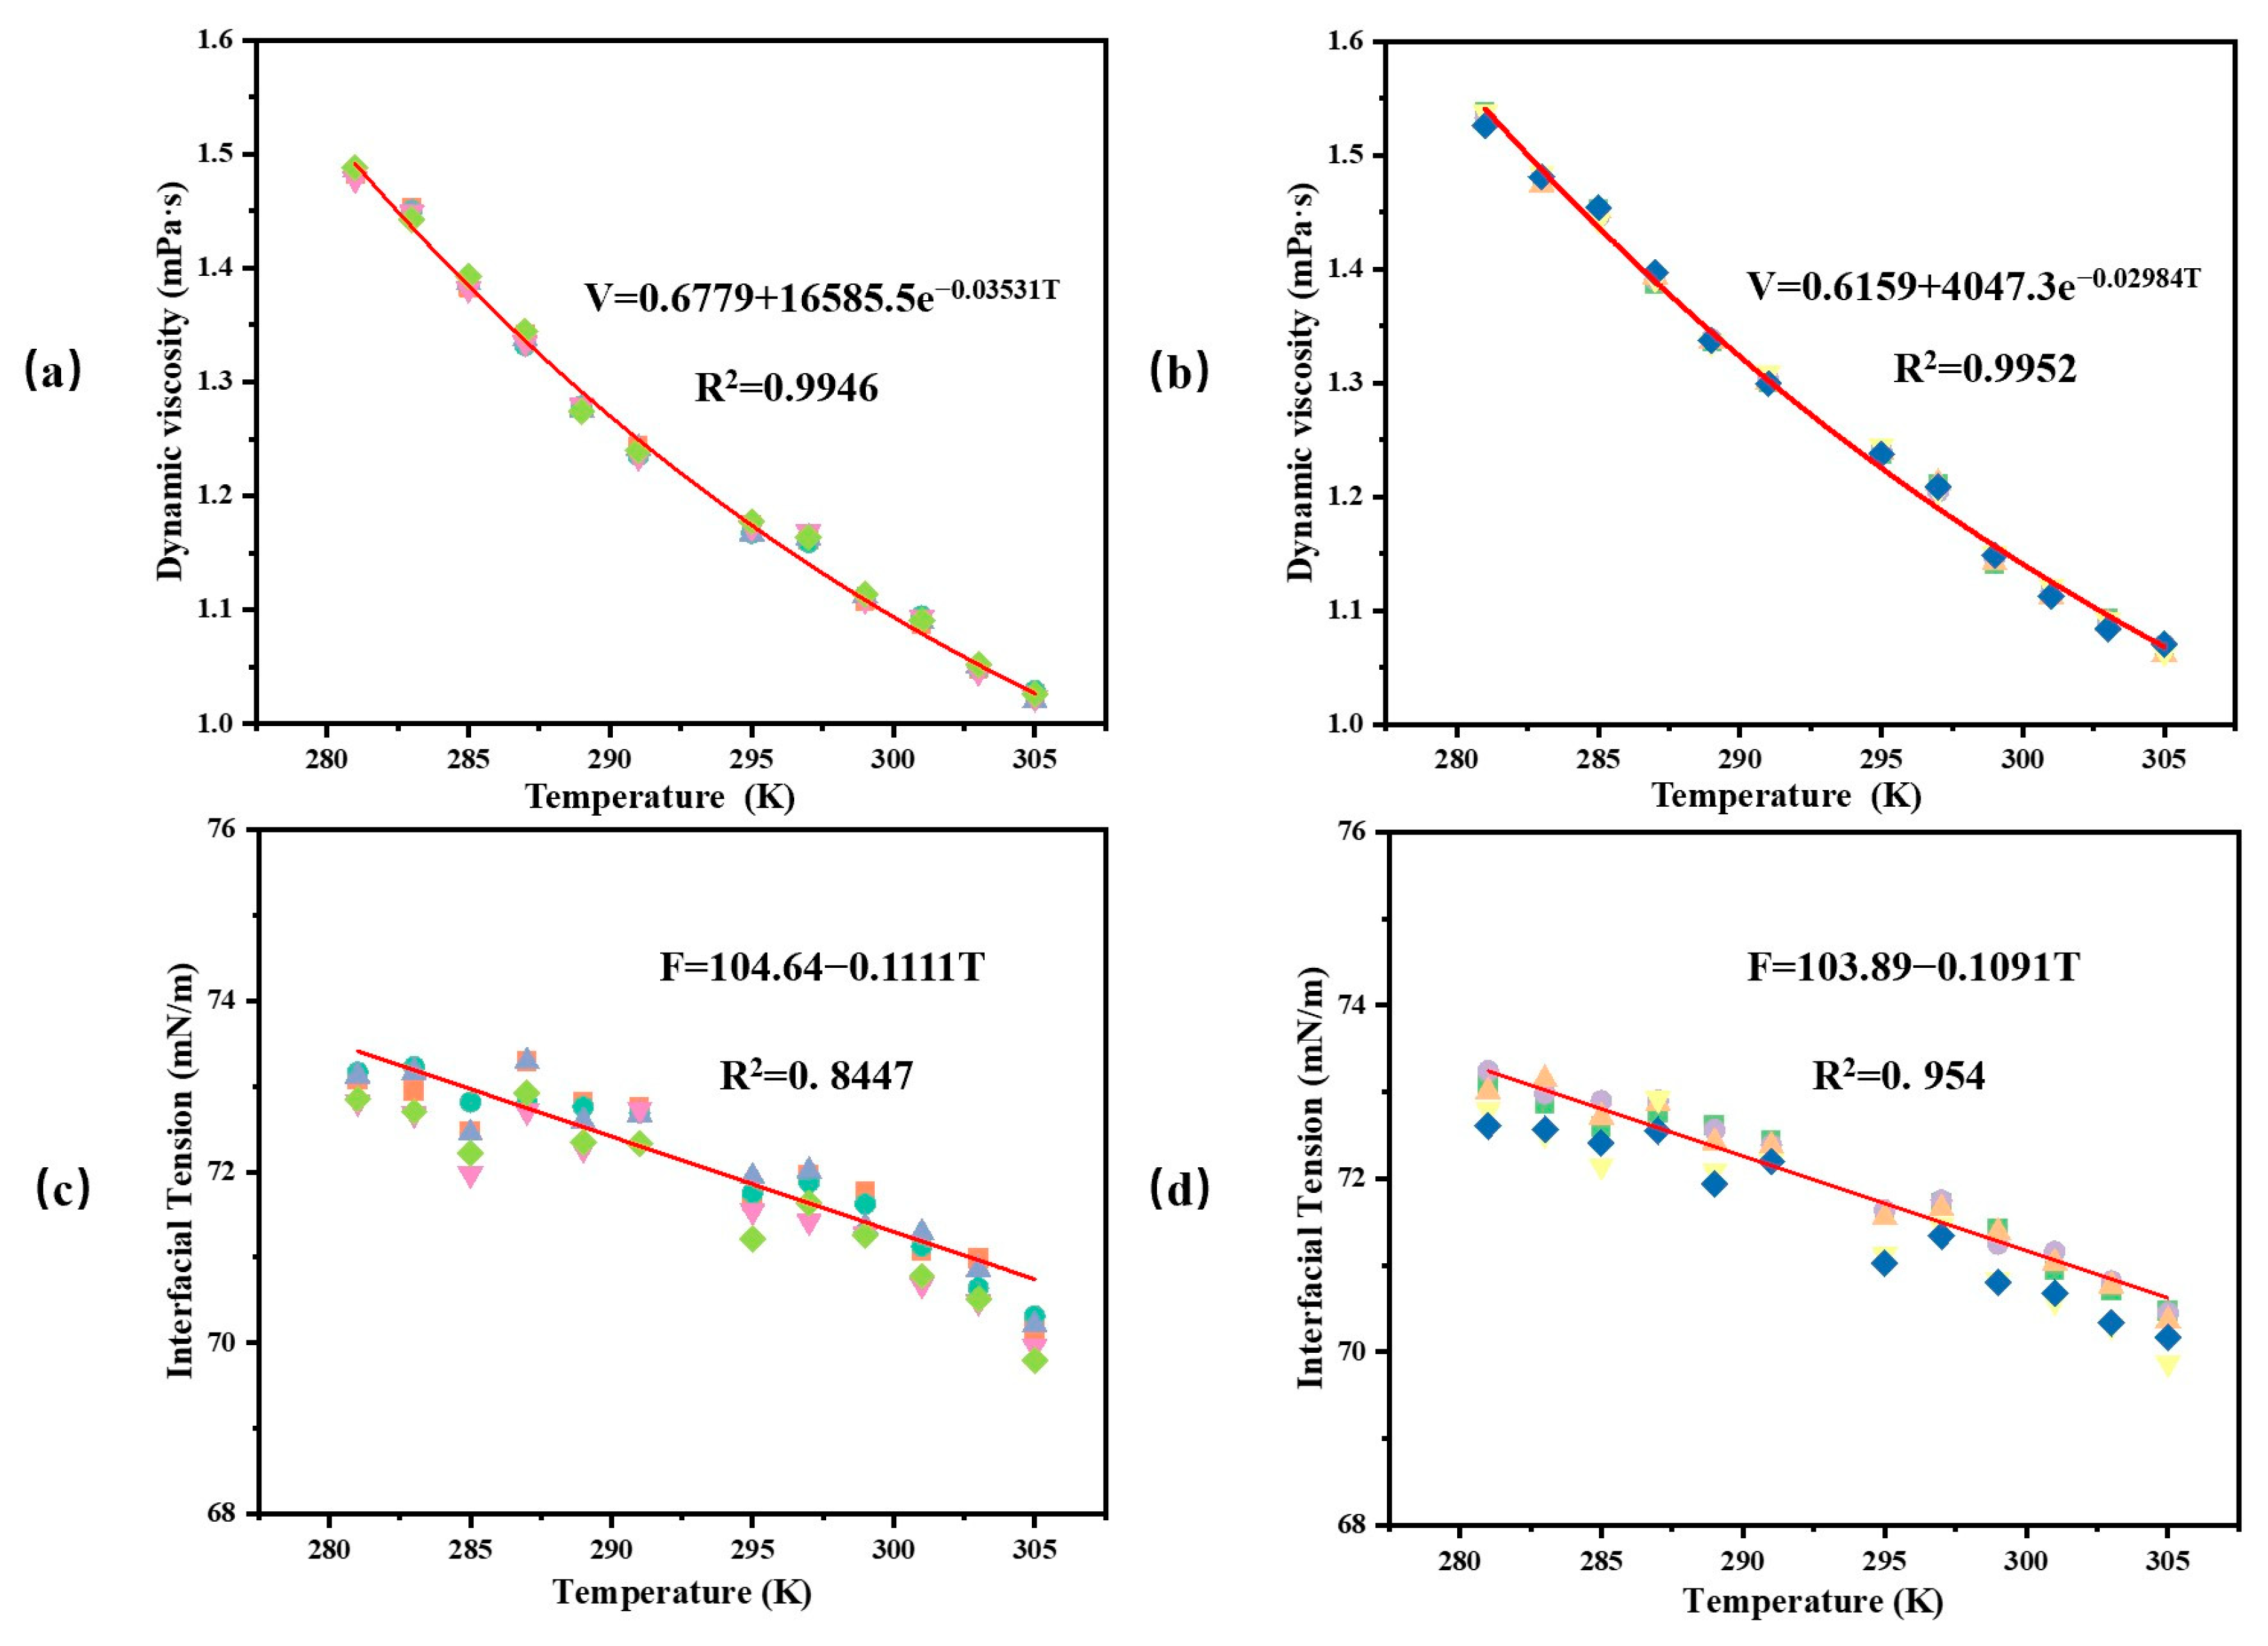
4.1. Effect of Temperature on Dynamic Viscosity and Interfacial Tension of Xylem Sap

Many factors affect the dynamic viscosity and interfacial tension of a fluid, but the temperature is a relatively closely correlated factor. According to the measured dynamic viscosity and interfacial tension of the poplar and metasequoia samples and their test temperatures in Figure 5 and Figure 6, the four scatter plots are shown in Figure 10. It was revealed that the dynamic viscosity of the poplar xylem sap and metasequoia xylem sap decreased with the increase in temperature. As the temperature increased from 281 K to 305 K, the dynamic viscosity of the poplar xylem sap decreased from 1.4835 mPa·s to 1.0251 mPa·s, and that of the metasequoia xylem sap decreased from 1.5330 mPa·s to 1.0664 mPa·s. The interfacial tension of the poplar xylem sap decreased from 73.01 mN/m to 70.08 mN/m, and that of the metasequoia xylem sap decreased from 72.94 mN/m to 70.26 mN/m. The intermolecular force limited the molecular power. When the temperature increased, the thermal diffusion increased the intermolecular distance. The molecular thermal energy increased, making the molecules freer, whereas the intermolecular force weakened. Thus, the dynamic viscosity and interfacial tension decreased [25]. Because of the highest test temperature in August, the dynamic viscosity and interfacial tension of the xylem sap were the lowest.
To determine the correlation of the dynamic viscosity and interfacial tension of poplar and metasequoia xylem sap with temperature, the relationship equations between the dynamic viscosity of poplar and metasequoia xylem sap and temperature were established using nonlinear regression, based on the classic Arrhenius equation and Liew equation. The relationship equations between the interfacial tension of poplar and metasequoia xylem sap and temperature were established using linear regression. From the fitting equation and R-square, it was revealed that the viscosity had an obvious exponential relationship with temperature. The degree of the fitting was relatively high, which was similar to the results of Ding et al. [26]. The interfacial tension of the xylem saps of poplar and metasequoia was negatively correlated with temperature.

4.2. The Dynamic Viscosity Difference between the Xylem Sap of Poplar and Metasequoia in Different Months

In Figure 5, it can be seen that the dynamic viscosity of pure water samples was lower than that of the poplar samples and metasequoia samples every month throughout the year. The dynamic viscosity of the metasequoia samples throughout the year was higher than that of the poplar samples. Due to the different concentrations of the organic components contained in the xylem sap of the poplar and metasequoia samples, the viscosity of their xylem saps varied. The viscosity depends on the size of the atomic groups in their chemical composition and the strength of the association between the atomic groups. Larger atomic groups and stronger associations can make the viscosity of a liquid larger, and, vice versa, the viscosity is smaller [27].
The concentration of organic components in the xylem sap of different wood species is different, making differences in its viscosity. Studies showed that, in low-concentration sugar solutions, the viscosity of the solution increased with the increase in sugar concentration [28]. When the concentration increased from 0 to 10 g/L, the viscosity of the sugar solution increased by 0.085 mPa·s [29]. Although lipids and water are insoluble, they are both fluids. At the same temperature, the viscosity of lipids (1–39 mPa·s) is much greater than that of water [30]. Though the concentration of soluble sugar and lipid in the xylem sap of poplar and metasequoia was low, the viscosity of poplar and metasequoia samples was higher than that of pure water. As the concentration of soluble sugar and the long-chain lipid in the sap of metasequoia was higher than that in the sap of poplar, the dynamic viscosity of metasequoia xylem sap was higher than that of poplar xylem sap.
As displayed in Figure 8, the lipid, soluble sugar, and inositol concentrations of the metasequoia samples were higher than those of poplar samples throughout the year. As displayed in Figure 4, the closed structure at both ends of the metasequoia tracheids and the small tracheid diameter led to the slow longitudinal transport speed. Therefore, more organic components were dissolved in the xylem sap, and the concentration was high. However, the opening structure at both ends of poplar and large conduit diameters led to sped up longitudinal transmission, so the concentration of organic components in the xylem sap was relatively low.

4.3. The Interfacial Tension Difference of the Xylem Sap of Poplar and Metasequoia in Different Months

As shown in Figure 6, the interfacial tensions of poplar and metasequoia samples were lower than those of pure water every month throughout the year, which may be related to the chemical composition in the xylem sap of the poplar and metasequoia samples. As displayed in Figure 8, many known non-surface-active factors changed the interfacial tension of the xylem saps, including sugars and lipids. Both lipids and sugars have much lower interfacial tension than that of pure water. Therefore, the interfacial tensions of poplar and metasequoia were smaller than that of pure water. Studies showed that, in low-concentration sugar solutions, the interfacial tension of the solution decreased with the increase in sugar content, and there was an exponential relationship with sugar content. When the concentration increased from 0 to 10 g/L, the surface tension of the sugar solution decreased to 68 mN/mm [31]. A decrease in lipid concentration increases the interfacial tension of the solution, making the droplet an oval, not round [32,33]. The lipid concentrations in the February and December samples were higher. Thus, there was a sharp decrease in the interfacial tension in February and December compared with that of pure water. The sugar concentration in the samples from April to October was higher, but sugar had less effect on surface tension than lipids [34]. Therefore, compared with pure water, there was a slow decrease in the interfacial tension from April to October.
It can be seen from Figure 6 that, except for in February and August, the interfacial tension of the sap of poplar was greater than that of metasequoia. Since the concentration of organic components in the metasequoia samples was higher than that in poplar samples, if there are no other factors, the interfacial tension of metasequoia samples should be smaller than that of poplar samples. In addition, concentration changes of K+, Na+, and other inorganic ions that regulate the transportation of plants also have a great impact on the interfacial tension of xylem sap [35]. The ion effect induces the rise of xylem sap in the process of hydraulic unblocking [36,37,38], so it is imperative to investigate the effect of different inorganic ions on the interfacial tension of xylem sap.
The difference in the interfacial tension of the poplar and metasequoia xylem sap in February and August was mainly related to the concentration of all the main cation concentrations in the samples. Due to the low electrostatic potential of the monovalent K+ and Na+ cations, their effects on interfacial tension were reduced. Although the concentration of Mg2+ in the sap of poplar and metasequoia was low, Mg2+ caused a higher interfacial tension reduction than Ca2+. Mg2+ has a smaller ionic radius and a higher charge density, leading to a higher surface coverage and increased adsorption of organic components [39]. In February and August, the total concentrations of all the main cation concentrations in the poplar sample were twice as high as those of metasequoia. As the interfacial tension of the solution decreased with the increase of ion concentration [40], the interfacial tension of poplar xylem sap decreased more than that of metasequoia xylem sap. Therefore, the interfacial tension of the poplar xylem sap was lower than that of metasequoia in February and August.

4.4. Correlation between Sap Velocity and the Dynamic Viscosity and Interfacial Tension of Xylem Sap

The trend of sap velocity was synchronized with the corresponding decrease in dynamic viscosity. As the temperature increased, the dynamic viscosity decreased. The viscous resistance decreased, making it easier for xylem sap to move faster. The decline of the interfacial tension of xylem sap meant that the capillary force reduced as the sap rose. As is well known, when the capillary tension is too large, the liquid vaporizes to form an embolism, which is not conducive to water transport. Therefore, a reduction in the interfacial tension within a certain range contributes to the hydraulic conductivity.

5. Conclusions

To explore the changes in the rising power and flow resistance of the xylem sap during the ascent process, the dynamic viscosity and interfacial tension of the poplar and metasequoia xylem sap in different months were examined. The changes in the concentration of organic components and inorganic ions were analyzed to understand their effect on the dynamic viscosity and interfacial tension of the xylem sap of poplar and metasequoia at different growth stages. It can be observed from this research that the dynamic viscosity of the poplar and metasequoia xylem sap exhibited an inverted parabolic change throughout the year which was mainly affected by the change in temperature. The viscosity of xylem sap decreased with the increasing temperature and increased with the increasing organic concentration. The interfacial tension of the xylem sap from poplar and metasequoia showed a trend of decreasing first and then increasing, which was mainly affected by the concentration of organic components. The interfacial tension of xylem sap decreased with the increase in the concentration of organic components.

Author Contributions

Conceptualization, L.W. and Y.Z.; methodology, X.W.; software, Q.X.; validation, L.W., W.Z. and X.W.; formal analysis, L.W.; investigation, J.T.; resources, X.W. and L.W.; data curation, W.Z.; writing—original draft preparation, L.W.; writing—review and editing, L.C.; visualization, L.W.; supervision, Y.Z., C.X. and J.L.; project administration, Y.Z.; funding acquisition, Y.Z. All authors have read and agreed to the published version of the manuscript.

Funding

This research was funded by the National Natural Science Foundation of China, grant number 31670558.

Data Availability Statement

Data will be made available on request.

Conflicts of Interest

The authors declare no conflict of interest.

References

  1. Loepfe, L.; Martinez-Vilaltaa, J.; Piñol, J.; Mencuccini, M. The relevance of xylem network structure for plant hydraulic efficiency and safety. J. Theor. Biol. 2007, 247, 788–803. [Google Scholar] [CrossRef] [PubMed]
  2. De Cannière, S.; Herbst, M.; Vereecken, H.; Defourny, P.; Jonard, F. Constraining water limitation of photosynthesis in a crop growth model with sun-induced chlorophyll fluorescence. Remote Sens. Environ. 2021, 267, 112715–112729. [Google Scholar] [CrossRef]
  3. Tankari, M.; Wang, C.; Ma, H.; Li, X.; Li, L.; Soothar, R.K.; Cui, N.; Zaman-Allah, M.; Hao, W.; Liu, F.; et al. Drought priming improved water status, photosynthesis and water productivity of cowpea during post-anthesis drought stress. Agric. Water Manag. 2021, 245, 106565–106574. [Google Scholar] [CrossRef]
  4. Baret, M.; Pepin, S.; Pothier, D. Hydraulic limitations in dominant trees as a contributing mechanism to the age-related growth decline of boreal forest stands. For. Ecol. Manag. 2018, 427, 135–142. [Google Scholar] [CrossRef]
  5. Roig-Oliver, M.; Fullana-Pericas, M.; Bota, J.; Flexas, J. Adjustments in photosynthesis and leaf water relations are related to changes in cell wall composition in Hordeum vulgare and Triticum aestivum subjected to water deficit stress. Plant Sci. 2021, 311, 111015–111022. [Google Scholar] [CrossRef]
  6. Brodribb, T.J. Xylem hydraulic physiology: The functional backbone of terrestrial plant productivity. Plant Sci. 2009, 177, 245–251. [Google Scholar] [CrossRef]
  7. Gleason, S.M.; Cooper, M.; Wiggans, D.R.; Bliss, C.A.; Romay, M.C.; Gore, M.A.; Mickelbart, M.V.; Topp, C.N.; Zhang, H.; DeJonge, K.C.; et al. Stomatal conductance, xylem water transport, and root traits underpin improved performance under drought and well-watered conditions across adverse panel of maize inbred lines. Field Crops Res. 2019, 234, 119–128. [Google Scholar] [CrossRef]
  8. Lens, F.; Tixier, A.; Cochard, H.; Sperry, J.S.; Jansen, S.; Herbette, S. Embolism resistance as a key mechanism to understand adaptive plant strategies. Curr. Opin. Plant Biol. 2013, 16, 287–292. [Google Scholar] [CrossRef] [Green Version]
  9. Hölttä, T.; Vesala, T.; Sevanto, S.; Perämäki, M.; Nikinmaa, E. Modeling xylem and phloem water flows in trees according to cohesion theory and Münch hypothesis. Trees 2006, 20, 67–78. [Google Scholar] [CrossRef]
  10. Denny, M. Tree hydraulics: How sap rises. Eur. J. Phys. 2012, 33, 43–53. [Google Scholar] [CrossRef]
  11. Elustondo, D. Semi-empirical linear correlation between surface tension and thermodynamics properties of liquid and vapours. Chem. Phys. 2021, 545, 111145–111155. [Google Scholar] [CrossRef]
  12. Christensen-Dalsgaard, K.K.; Tyree, M.T.; Mussone, P.G. Surface tension phenomena in the xylem sap of three diffuse porous temperate tree species. Tree Physiol. 2011, 31, 361–368. [Google Scholar] [CrossRef] [PubMed]
  13. Wang, G.; Dong, P.; Lu, Y.; Zeng, M.; Zhang, Q. Experimental and theoretical investigation on the surface tension of nano-Lithium Bromide solution. Int. Commun. Heat Mass Transf. 2021, 123, 105231–105238. [Google Scholar] [CrossRef]
  14. Santos, M.S.C.S.; Reis, J.C.R. Surface tension of liquid mixtures and metal alloys. Thermodynamic conditions for the occurrence of a positive temperature coefficient. J. Alloys Compd. 2021, 864, 158839–158849. [Google Scholar] [CrossRef]
  15. Dai, Y.; Wang, L.; Wan, X. Frost fatigue and its spring recovery of xylem conduits in ring-porous, diffuse-porous, and coniferous species in situ. Plant Physiol. Biochem. 2021, 146, 177–186. [Google Scholar] [CrossRef]
  16. De Moraes, D.H.M.; Mesquita, M.; Graciano-Ribeiro, D.; de Araújo, D.S.; Battisti, R.; Flores, R.A.; de Melo, H.C.; Casaroli, D. The effect of xylem vessel diameter on potential hydraulic conductivity in different rice stem longitudinal positions. Flora 2022, 295, 152147–152153. [Google Scholar] [CrossRef]
  17. Cunha, A.F.A.; Rodrigues, P.H.D.; Anghinoni, A.C.; de Paiva, V.J.; Pinheiro, D.G.S.; Campos, M.L. Mechanical wounding impacts the growth versus defense balance in tomato (Solanum lycopersicum). Plant Sci. 2023, 329, 111601–111608. [Google Scholar] [CrossRef]
  18. Schenk, H.J.; Michaud, J.M.; Mocko, K.; Espino, S.; Melendres, T.; Roth, M.R.; Welti, R.; Kaack, L.; Jansen, S. Lipids in xylem sap of woody plants across the angiosperm phylogeny. Plant J. 2021, 1056, 1477–1494. [Google Scholar] [CrossRef]
  19. Xu, S.; Wang, X.; Han, S.; Mei, J.; Cui, H.; Li, J.; Zhou, W.; Guo, G.; Guo, J.; Zhang, J. GB/T 22235-2008; Determination of Liquid Viscosity. National Standardization Administration Committee: Beijing, China, 2008. [Google Scholar]
  20. Sun, L.; Ma, L.; Gao, S.; Zhao, H.; Zhu, S. Research Achievement on Sugar Metabolism in Deciduous Fruit Trees During Dormancy Period. North. Fruits 2019, 2, 1–4. [Google Scholar]
  21. Yang, N. Expression and Function of Inositol Metabolism Key Enzyme Gene in Poplar; Ludong University: Yantai, China, 2017. [Google Scholar]
  22. Losso, A.; Nardini, A.; Dämon, B.; Mayr, S. Xylem sap chemistry: Seasonal changes in timberline conifers Pinus cembra, Picea abies, and Larix decidua. Biol. Plant. 2018, 62, 157–165. [Google Scholar] [CrossRef]
  23. Anschütz, U.; Becker, D.; Shabala, S. Going beyond nutrition: Regulation of potassium homoeostasis as a common denominator of plant adaptive responses to environment. J. Plant Physiol. 2014, 171, 670–687. [Google Scholar] [CrossRef] [PubMed]
  24. Rothwell, S.A.; Dodd, I.C. Xylem sap calcium concentrations do not explain liming-induced inhibition of legume gas exchange. Plant Soil 2014, 382, 17–30. [Google Scholar] [CrossRef]
  25. Nazmabadi, M.; Shirdast, A.; Sharif, A.; Aalaie, J. Aqueous/brine solutions viscosity and surface properties of hydrophobically modified scleroglucans: Role of grafted chain length. Carbohydr. Polym. 2020, 229, 115519–115525. [Google Scholar] [CrossRef] [PubMed]
  26. Ding, H.; Wang, C.; Zhu, X. Estimation of the kinematic viscosities of bio-oil/alcohol blends: Kinematic viscosity-temperature formula and mixing rules. Fuel 2019, 254, 115687–115695. [Google Scholar] [CrossRef]
  27. Abdullah, A.M.; Chowdhury, A.R.; Yang, Y.; Vasquez, H.; Moore, H.J.; Parsons, J.G.; Lozano, K.; Gutierrez, J.J.; Martirosyan, K.S.; Uddin, M.J. Tailoring the viscosity of water and ethylene glycol based TiO2 nanofluids. J. Mol. Liq. 2020, 297, 111982–111993. [Google Scholar] [CrossRef]
  28. Benìtez, E.I.; Genovese, D.B.; Lozano, J.E. Effect of typical sugars on the viscosity and colloidal stability of apple juice. Food Hydrocoll. 2009, 232, 519–525. [Google Scholar] [CrossRef]
  29. Qi, Z.; Gu, G. Effect of dissolved impurities on water viscosity. Guangxi Phys. 2006, 272, 32–33. [Google Scholar]
  30. Gössi, A.; Riedl, W.; Schuur, B. Mass transfer analysis and kinetic modeling for process design of countercurrent membrane supported reactive extraction of carboxylic acids. Chem. Eng. Sci. 2022, 13, 100119–100130. [Google Scholar] [CrossRef]
  31. Duan, X. The Influence of Different Sucrose Solution Concentration on Surface Tension. J. Shanxi Datong Univ. Nat. Sci. 2019, 35, 13–14+73. [Google Scholar]
  32. Riehm, D.A.; Rokke, D.J.; Paul, P.G.; Lee, H.S.; Vizanko, B.S.; McCormick, A.V. Dispersion of oil into water using lecithin-Tween 80 blends: The role of spontaneous emulsification. J. Colloid Interface Sci. 2017, 487, 52–59. [Google Scholar] [CrossRef]
  33. Pierantozzi, M.; Nicola, G.D. Surface tension correlation of carboxylic acids from liquid viscosity data. Fluid Phase Equilibria 2019, 482, 118–125. [Google Scholar] [CrossRef]
  34. Soultani, S.; Ognier, S.; Engasser, J.M.; Ghoul, M. Comparative study of some surface active properties of fructose esters and commercial sucrose esters. Colloids Surf. A Physicochem. Eng. Asp. 2003, 227, 35–44. [Google Scholar] [CrossRef]
  35. Chen, L.; Cao, Y.; Zhang, Z.; Liu, X.; Teramage, M.T.; Zhang, X.; Sun, X. Characteristics of chemical components in the trunk xylem sap of pine trees by means of a centrifugation collection method. Plant Physiol. Biochem. 2019, 142, 482–489. [Google Scholar] [CrossRef] [PubMed]
  36. Ieperen, W. Ion-mediated changes of xylem hydraulic resistance in planta: Fact or fiction. Trends Plant Sci. 2007, 124, 137–142. [Google Scholar] [CrossRef] [PubMed]
  37. Meitern, A.; Õunapuu-Pikas, E.; Sellin, A. Circadian patterns of xylem sap properties and their covariation with plant hydraulic traits in hybrid aspen. J. Plant Physiol. 2017, 213, 148–156. [Google Scholar] [CrossRef]
  38. Trifilò, P.; Lo Gullo, M.A.; Salleo, S.; Callea, K.; Nardini, A. Xylem embolism alleviated by ion-mediated increase in hydraulic conductivity of functional xylem: Insights from field measurements. Tree Physiol. 2008, 2810, 1505–1512. [Google Scholar] [CrossRef] [Green Version]
  39. Mahmoudvand, M.; Javadi, A.; Pourafshary, P.; Vatanparast, H.; Bahramian, A. Effects of cation salinity on the dynamic interfacial tension and viscoelasticity of a water-oil system. J. Pet. Sci. Eng. 2021, 206, 108970–108979. [Google Scholar] [CrossRef]
  40. Olesena, K.B.; Foganga, L.T.; Palm-Henriksena, G.; Alyafeib, N.; Sølling, T.I. How a range of metal ions influence the interfacial tension of n-decane/carboxylic acid/water systems: The impact of concentration.; molecular- and electronic structure. J. Pet. Sci. Eng. 2019, 182, 106307–106313. [Google Scholar] [CrossRef]
Figure 1. The schematic diagram of xylem sap extraction.
Forests 14 01344 g001
Figure 2. The schematic diagram of interfacial tension measurement.
Forests 14 01344 g002
Figure 3. Organic components concentrations in wood and xylem sap of poplar (P) and metasequoia (M) in August.
Forests 14 01344 g003
Figure 4. Frequency distributions of (a) poplar conduit diameters and (b) metasequoia tracheid diameters and microscopic images of (c) poplar conduit diameters and (d) metasequoia tracheids.
Forests 14 01344 g004
Figure 5. Monthly variation of the dynamic viscosity of pure water, poplar (n = 3), and metasequoia (n = 3).
Forests 14 01344 g005
Figure 6. Monthly variation of the interfacial tension of pure water, poplar (n = 3), and metasequoia (n = 3).
Forests 14 01344 g006
Figure 7. Monthly variation of the sap velocity of poplar (n = 3).
Forests 14 01344 g007
Figure 8. Changes of main components in the sap of poplar (P) (n = 3) and metasequoia (M) (n = 3) in different months.
Forests 14 01344 g008
Figure 9. The interfacial tension and main cation concentration of the sap from poplar (n = 3) and metasequoia (n = 3) in different months. (a) is the K+ concentration, (b) is the Ca2+ concentration, (c) is the Na+ concentration, and (d) is the Mg2+ concentration.
Forests 14 01344 g009
Figure 10. The relationship between temperature and the dynamic viscosity and interfacial tension change of poplar and metasequoia xylem sap in different months, where (a) is the dynamic viscosity of the poplar samples tested five times, (b) is the dynamic viscosity of the metasequoia samples tested five times, (c) is the interfacial tension of the poplar samples tested five times, (d) is the interfacial tension of the metasequoia samples tested five times.
Forests 14 01344 g010
Table 1. The age, diameter at breast height (DBH), and height of the different tree species.
AgeDBH (cm)Height (m)
poplar4534.91 ± 1.5912.16 ± 0.35
metasequoia5036.18 ± 1.4414.26 ± 0.25
Disclaimer/Publisher’s Note: The statements, opinions and data contained in all publications are solely those of the individual author(s) and contributor(s) and not of MDPI and/or the editor(s). MDPI and/or the editor(s) disclaim responsibility for any injury to people or property resulting from any ideas, methods, instructions or products referred to in the content.

