Article

Method of Wildfire Risk Assessment in Consideration of Land-Use Types: A Case Study in Central China

1
College of Geomatics and Geoinformation, Guilin University of Technology, 319 Yanshan Street, Guilin 541006, China
2
Guangxi Key Laboratory of Spatial Information and Geomatics, 319 Yanshan Street, Guilin 541006, China
*
Author to whom correspondence should be addressed.
Forests 2023, 14(7), 1393; https://doi.org/10.3390/f14071393
Submission received: 5 June 2023 / Revised: 2 July 2023 / Accepted: 6 July 2023 / Published: 7 July 2023
(This article belongs to the Special Issue Wildfire Monitoring and Risk Management in Forests)

Abstract

:
Research on wildfire risk can quantitatively assess the risk of wildfire damage to the population, economy, and natural ecology. However, existing research has primarily assessed the spatial risk of wildfires across an entire region, neglecting the impact of different land-use types on the assessment outcomes. The purpose of the study is to construct a framework for assessing wildfire risk in different land-use types, aiming to comprehensively assess the risk of wildfire disasters in a region. We conducted a case study in Central China, collecting and classifying historical wildfire samples according to land-use types. The Light Gradient Boosting Machine (LGBM) was employed to construct wildfire susceptibility models for both overall and individual land-use types. Additionally, a subjective and objective combined weighting method using the Analytic Hierarchy Process (AHP) and Entropy Weight Method (EWM) was utilized to build the wildfire vulnerability model. By integrating susceptibility and vulnerability information, we comprehensively assessed the combined risk of wildfire disasters across land-use types. The results demonstrate the following: (1) Assessing wildfire susceptibility based on different land-use types compensated for limitations in analyzing overall wildfire susceptibility, with a higher prediction performance and more detailed susceptibility information. (2) Significant variations in wildfire susceptibility distribution existed among different land-use types, with varying contributions of factors. (3) Using the AHP-EWM combined weighting method effectively addressed limitations of a single method in determining vulnerability. (4) Land-use types exerted a significant impact on wildfire risk assessment in Central China. Assessing wildfire risk for both overall and individual land-use types enhances understanding of spatial risk distribution and specific land use risk. The experimental results validate the feasibility and effectiveness of the proposed evaluation framework, providing guidance for wildfire prevention and control.

1. Introduction

Wildfire disasters are uncontrolled fires that occur in natural environments such as forests, cultivated lands, and grasslands [1,2]. The causes of wildfires involve a combination of human and natural factors [3]. Human behavior, such as improper disposal of cigarette butts and burning garbage, contributes significantly to wildfire occurrences [4]. Additionally, natural factors such as droughts, lightning, high temperatures, and strong winds can trigger wildfires [5]. These sudden and unpredictable events have far-reaching impacts on the ecological environment and human society. Wildfires lead to the destruction of vegetation, damage to the soil, and a loss of biodiversity, disrupting the ecosystem and hindering its restoration [6,7]. They also cause casualties, property damage, and disruptions to infrastructure, affecting society’s stability and the economy [8,9]. Wildfire risk assessment plays a crucial role in preventing and mitigating the harm caused by wildfires. It provides support in protecting the ecological environment, ensuring the safety of lives and property, and promoting sustainable social and economic development [10,11]. Researchers and international organizations have shown increasing interest in wildfire risk assessment in recent years [12].
According to the definition of disaster risk by the United Nations Department of Humanitarian Affairs (UNDHA), disaster risk refers to the potential losses faced by human beings, property, livelihoods, and the environment in the event of a disaster [13]. Disaster risk is usually determined by the probability of a disaster occurring (susceptibility) and the degree of impact on the socio-economic and ecological environment when the disaster occurs (vulnerability) [14]. Susceptibility reflects the probability of wildfire occurrence and usually includes factors such as climate conditions, terrain and landforms, human interference, and land-use types [15]. The combined effect of these factors can quantitatively reflect the probability of wildfire occurrence in a particular region [16]. Vulnerability reflects the extent of losses caused by wildfires in the region, including ecological environment and population and property factors. By evaluating the impact of wildfires on the region, the vulnerability of the region can be assessed [17,18,19]. Integrating susceptibility and vulnerability indices in wildfire risk assessment provides a comprehensive understanding of the pattern of wildfire occurrence and the associated harm to the region [20,21]. This assessment helps evaluate the ecological and socio-economic losses caused by wildfires, offering a scientific basis for wildfire prevention and management strategies [22,23,24].
With the continuous development of spatial information technologies such as remote sensing and geographic information systems, significant progress has been made in the theoretical and modeling aspects of wildfire research [25]. The evolution of wildfire susceptibility analysis has transitioned from qualitative to quantitative methods, with quantitative analysis proving more accurate and objective by establishing mathematical models based on data [2,26]. The main quantitative analysis methods include physical simulation, statistics, and machine learning methods [27]. Physical simulation utilizes mathematical models to predict wildfire propagation and potential hazards based on the physical processes involved. However, its application to large-scale prediction studies is limited due to data acquisition challenges and complex calculations [28]. The statistical method is based on linear thinking and uses historical data for analysis and prediction. It is easy to implement and operate, and has stable predictive effects. However, this method is highly dependent on data and ignores the interaction and nonlinear relationships between factors [9,29]. In contrast, machine learning methods can effectively identify and extract complex relationships within data, making them suitable for wildfire susceptibility research involving multiple variables and large areas [30,31]. Based on ensemble learning, which is one of the most popular algorithms in machine learning, it has a higher predictive accuracy and improves the generalization ability and robustness of a single learning model through the fusion of multiple learners, thus having a higher predictive accuracy and applicability in wildfire susceptibility research [32,33]. Additionally, vulnerability assessment methods based on Multi-Criteria Decision Analysis allocate weights and comprehensively evaluate factors related to population, economy, environment, and more, allowing for a comprehensive evaluation of vulnerability in a region [34]. Commonly used methods include the analytic hierarchy process [35], gray correlation analysis [36], entropy weighting method [37], and principal component analysis [38]. It can be seen that the research on disaster risk assessment has made fruitful achievements, the evaluation methods are becoming increasingly refined, and the accuracy and scientificity of the evaluation results are gradually improving.
However, current wildfire risk research mainly evaluates the spatial risk of all types of wildfires in the entire region [15,39], lacking consideration of the impact of different land-use types on the assessment outcomes. Land-use type is one of the important factors affecting wildfire risk assessment [40,41]. Wildfires exhibit different selectivity for different land-use types, with some types being more prone to wildfires [42,43]. Meanwhile, the impact of topography, climate, and human activities on the occurrence of wildfires varies across different land-use types, resulting in differences in the risk assessment results [44,45]. For example, forests, grasslands, and cultivated land differ in vegetation, topography, and human activities, all of which have varying impacts on the flammability, spread speed, and degree of harm caused by wildfires [46,47]. Therefore, it is necessary to establish a wildfire risk assessment system based on different land-use types, and to quantitatively study the risk level of wildfires for different land-use types.
The purpose of the study is to construct a framework for assessing wildfire risk in different land-use types, using the case study region of Central China. Historical samples were collected and classified based on land-use types. Sixteen susceptibility conditioning factors were selected and utilized to construct wildfire susceptibility models using the light gradient boosting machine. The spatial distribution pattern of wildfire susceptibility for different land-use types was evaluated, and the importance of factors was analyzed. Additionally, vulnerability factors related to the population, material economy, and ecological environment were considered, and vulnerability assessment was conducted through a combination of objective and subjective weighting methods. Finally, based on the susceptibility and vulnerability evaluations, wildfire risk assessment and analysis for different land-use types in Central China were performed, providing scientific basis and decision-making support for wildfire prevention and control in different land-use types. This study has high practical value and reference significance for wildfire prevention and control work in other regions.

2. Study Area and Data Overview

2.1. Study Area

The Central China region, located at the heart of China’s transportation network, encompasses the Henan, Hubei, and Hunan Provinces (Figure 1). It is a significant geographical region in China, bordered by the East China Sea to the east, the South China Sea to the south, the Yellow River basin to the north, and the middle and lower reaches of the Yangtze River to the west. With coordinates ranging from 108°22′1″ E to 116°39′8″ E longitude and 24°38′11″ N to 36°22′00″ N latitude, the region’s elevation varies from 0 to 3019 m. Spanning approximately 560,000 km2, it accounts for 5.9% of China’s land area. The topography primarily comprises plains, hills, basins, rivers, and lakes, displaying intricate geological formations and undulating landscapes. The region’s climate is diverse, representing a transition zone between subtropical and temperate monsoon climates. Summers are hot and rainy, while winters are cold and dry. The southern part of Hunan Province and the southeastern part of Hubei Province enjoy a mild and humid climate, whereas Henan Province experiences relatively dry conditions. These climatic complexities create favorable conditions for wildfires to thrive. Central China holds strategic, economic, and cultural significance as a key transportation hub. The region’s dense population and developed economy contribute to an increased occurrence of wildfires in ecologically sensitive areas such as forests and grasslands. Furthermore, the fire sources and burning methods used by farmers in rural and mountainous areas are also important factors that trigger wildfires. As one of the most wildfire-prone regions in China, the severity of wildfire disasters cannot be overlooked.

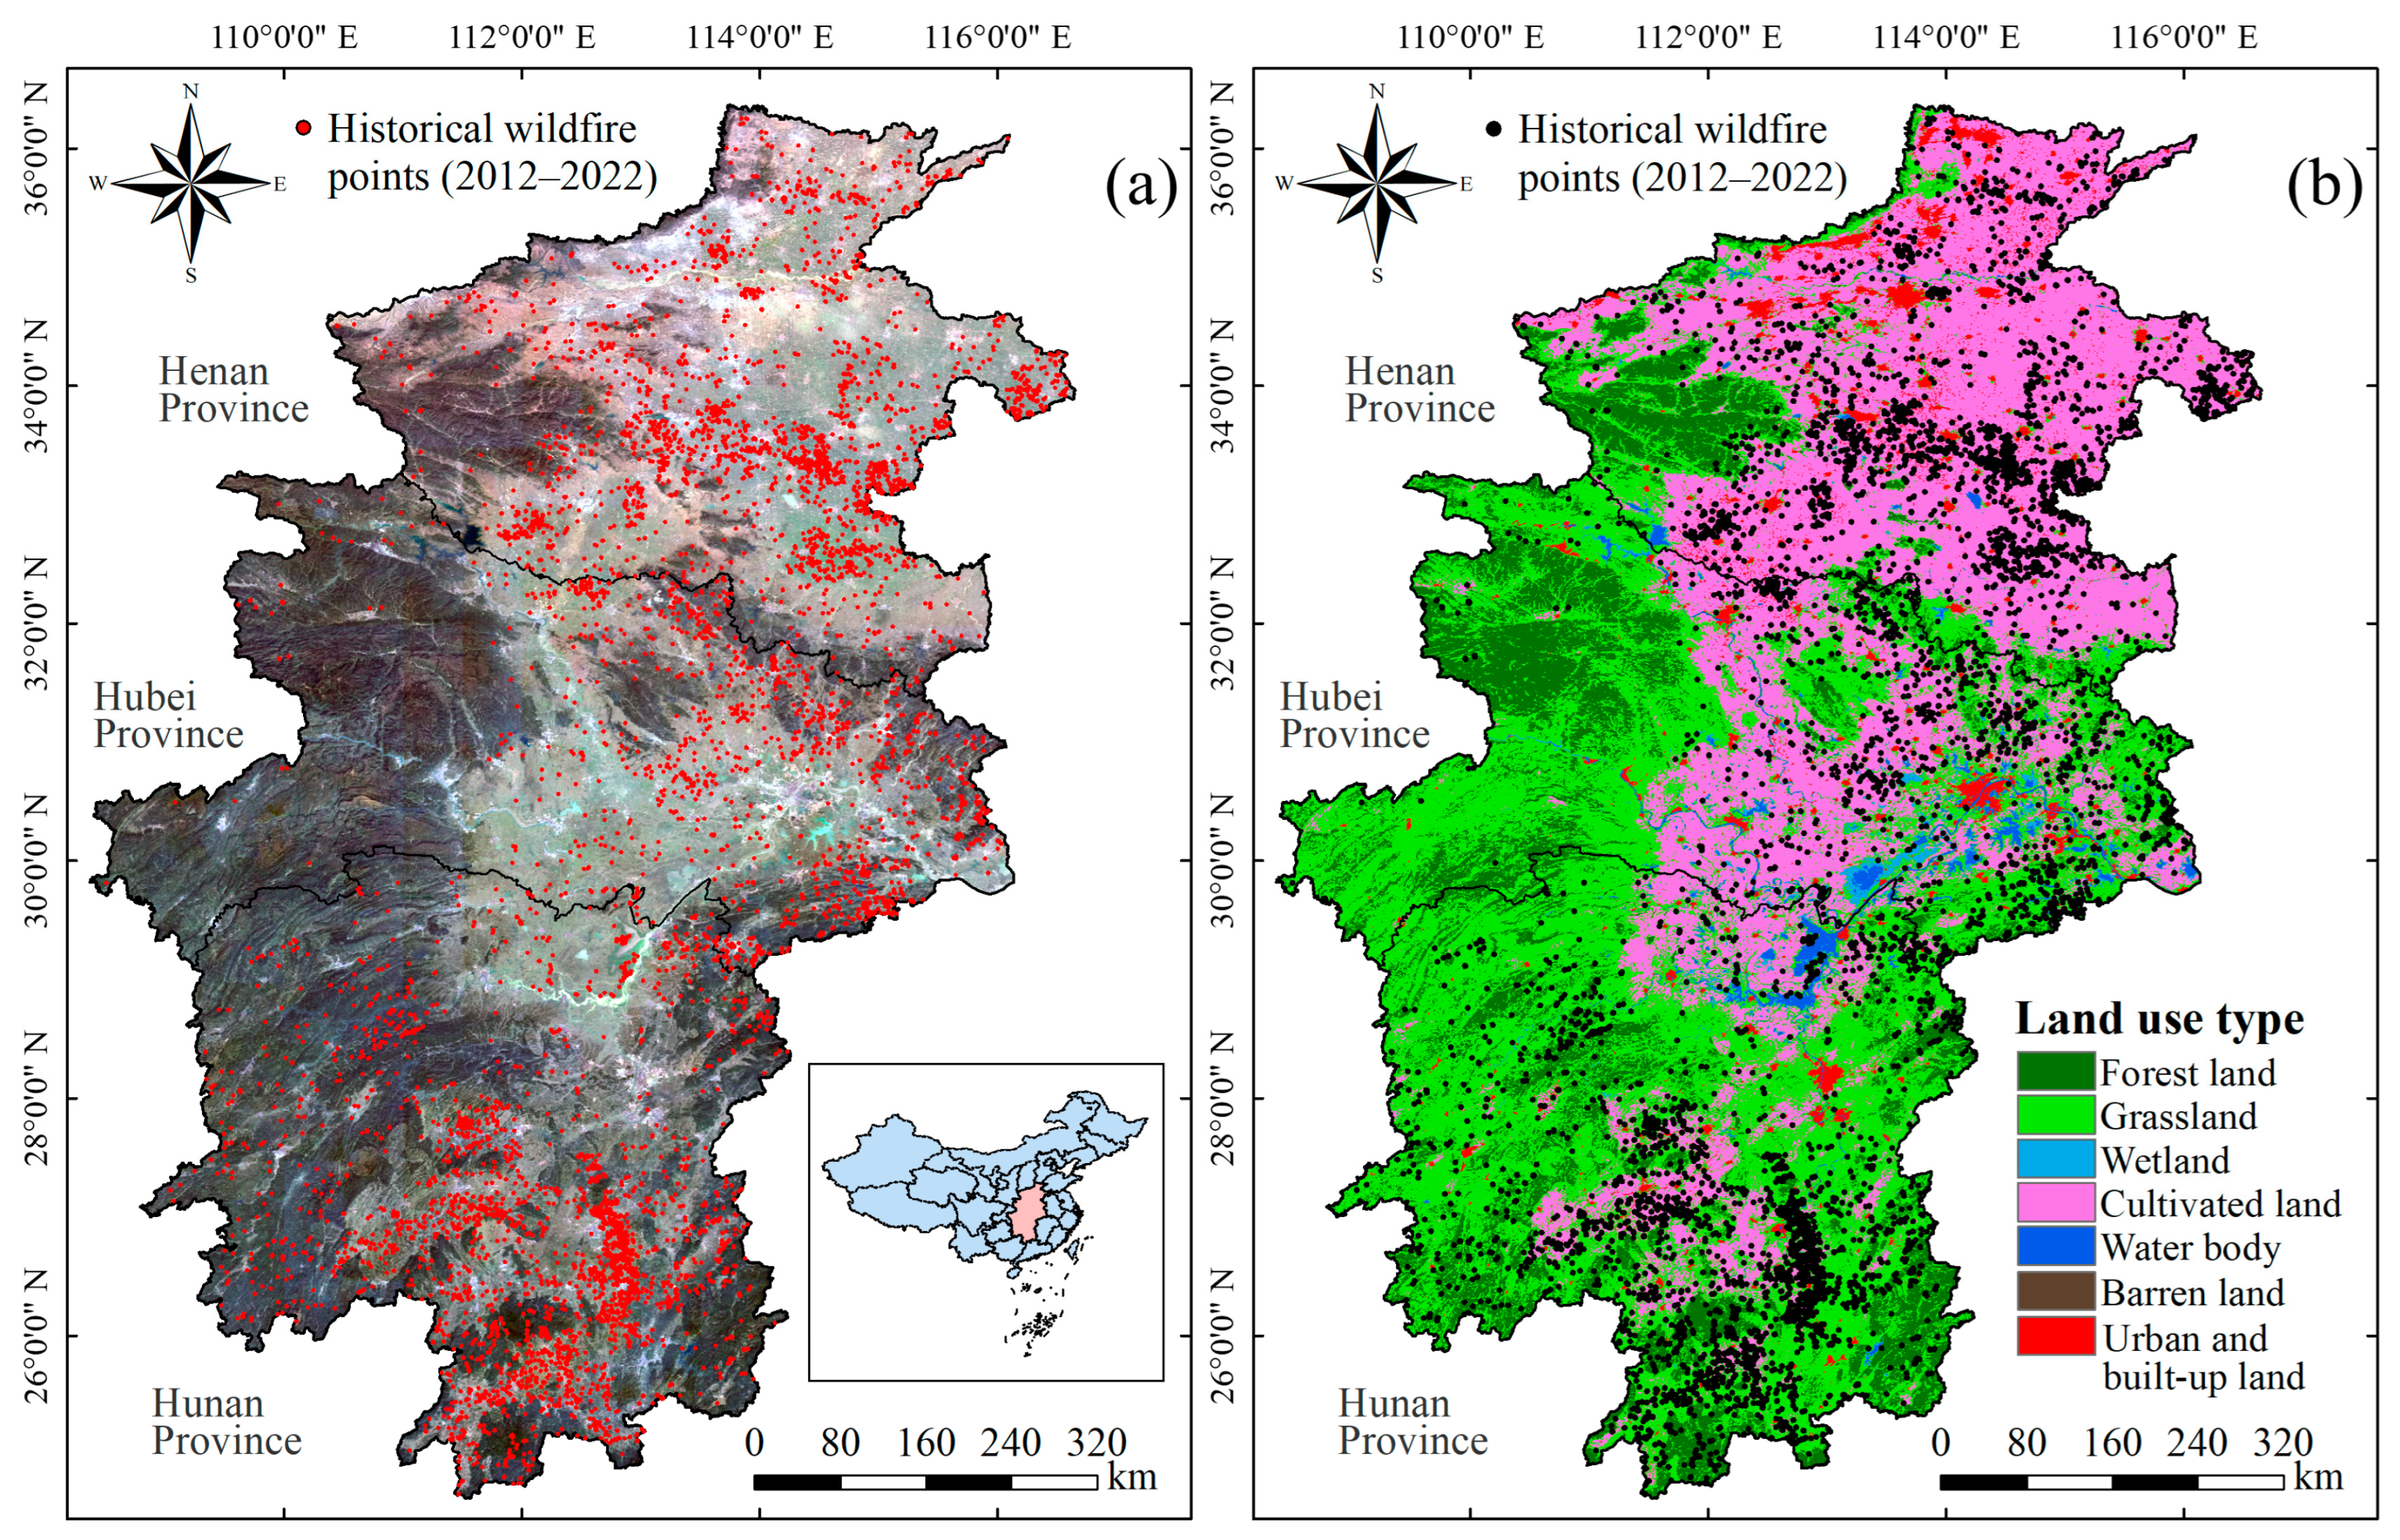
2.2. Historical Wildfire Dataset

Satellite-based wildfire data are more accessible and comprehensive compared with government-collected historical wildfire data [48]. VIIRS data, with its high resolution and daily updates, accurately detects and locates small-scale fires, making it suitable for wildfire monitoring and prediction [49,50]. Therefore, this study chose to use VIIRS data from 2012 to 2022 as the data source for central China wildfire risk assessment study.
This study followed established data selection methods used in previous studies [51,52,53]. The steps involved were as follows: (1) filtering data with “high” confidence based on the “confidence” sample attribute field; (2) excluding samples of other types based on the “type” sample attribute field, while retaining only data classified as “presumed vegetation fire”; (3) utilizing the MCD12Q1 land-use type product for 2020 to remove non-target points located in water systems, buildings, and bare land; and (4) excluding non-target points with long-term static heat anomalies located in thermal power and metallurgical plants based on sample density. Finally, a total of 7099 historical wildfire samples were obtained.
According to the user guide of the MCD12Q1 product and existing research methods [43], the land-use types were regrouped into eight categories. The result of the type division is as follows.
  • Forest land (15.956%): evergreen needleleaf forests, evergreen broadleaf forests, deciduous needleleaf forests, deciduous broadleaf forests, and mixed forests;
  • Grassland (41.876%): woody savannas, savannas, and grasslands;
  • Cultivated land (36.552%): croplands and cropland/natural vegetation mosaics;
  • Wetland (0.948%);
  • Shrubland (0.002%): closed shrublands;
  • Barren land (0.016%);
  • Water body (1.343%);
  • Urban and built-up land (3.307%).
Accordingly, the wildfire hazards were mainly distributed in forest land (389), grassland (2698), and cultivated land (4002), while the wetland had the least number of wildfire samples (10). Therefore, this study aims to investigate the characteristics and differences in wildfire susceptibility and risk across different land-use types in Central China, based on wildfire samples from all land-use types (forest land, grassland, cultivated land, and wetland) and individual land-use types, including forest land, grassland, and cultivated land.

2.3. Susceptibility Conditioning Factors

The purpose of wildfire susceptibility assessment is to predict the probability of wildfire occurrence in a region based on historical data and considering various factors. Considering the climatic and environmental characteristics of Central China and the distribution of wildfire samples in different land-use types, this study selected 16 conditioning factors from four aspects, namely topography, surface environment, anthropology, and meteorology, to evaluate wildfire susceptibility [39,51,52,54]. The basic information of these factors is shown in Table 1. Topographic factors include elevation, slope, aspect, curvature, topographic wetness index (TWI), and stream power index (SPI), as shown in Figure 2. Surface environmental factors include normalized difference vegetation index (NDVI), soil type, and distance to rivers, as shown in Figure 3. Anthropogenic factors include distance to roads and distance to residential areas, as shown in Figure 4. Meteorological factors include rainfall, temperature, wind speed, potential evaporation, and solar radiation, as shown in Figure 5. After preprocessing the conditioning factors, this study projected the images of each factor onto the UTM_Zone_49N coordinate system and resampled them to a resolution of 500 m × 500 m. The entire region was divided into 1554 × 2606 with a total of 2,255,549 grids.

2.4. Vulnerability Factors

Wildfire vulnerability assessment aims to assess the potential impact and vulnerability of wildfire hazards on an area, including losses and impacts on the population, economy, and environment. In this paper, we selected six vulnerability factors from vulnerable populations, the material economy, and the ecological environment to evaluate wildfire vulnerability in Central China based on 49 cities. The above factors included female population, young and old population, population unable to attend high school, road density, gross domestic product (GDP) density, and environmental condition. In general, the larger the value of these vulnerability factors, the more vulnerable the human, material and environmental carriers in the region are to damage in the event of a wildfire. The data types and sources of the factors are listed in Table 2. For ease of subsequent statistics and analysis, this study resampled the data layers of the above factors to the same resolution of 500 m × 500 m as the susceptibility conditioning factors.
Previous studies have shown that the remote sensing ecological index (RSEI) can objectively assess the spatial distribution of the ecological environment status and represent the average ecological environment condition in a specific region [55,56]. In this study, principal components analysis (PCA) was used to integrate four indicators including greenness, dryness, wetness, and heat to calculate RSEI, in order to evaluate the ecological environment status in Central China [57,58]. NDVI was used as the greenness indicator to evaluate the vegetation cover; normalized difference built-up and soil index (NDBSI) was used as the dryness indicator to evaluate the dryness of impervious surfaces; wetness indicator was obtained by using Tasseled Cap Transformation to evaluate the soil moisture condition; and the heat indicator was obtained using the MODIS land surface temperature (LST) product.
After calculating the four ecological indices based on MODIS data, this study used P C A to integrate the indices to avoid the bias caused by subjective factors in the process of weight setting [59]. As the units of the four components were not uniform, it was necessary to normalize the indices before conducting PCA and to use the first and second principal component (84.772%) to construct R S E I [60]. These are shown in Equations (1)–(3).
N i = I I m i n I m a x I m i n
R S E I 0 = { P C A [ f ( L S T , W E T , N D B S I , N D V I ) ] }
R S E I = R S E I 0 R S E I 0 m i n R S E I 0 m a x R S E I 0 m i n
where N i is the normalized value of the four indicators, I is the pixel value of the corresponding indicator, I m i n is the minimum pixel value of the indicator, and I m a x is the maximum pixel value of the indicator. R S E I 0 is the initial remote sensing ecological index. A higher R S E I value usually indicates a better ecological environment condition in the area, while a lower value indicates a poorer ecological environment condition. Therefore, this study calculated the average R S E I of all pixels in each city to represent the eco-environmental condition of the city. The ecological indicators and the final RSEI are shown in Figure 6. The six wildfire vulnerability factors obtained are shown in Figure 7.

3. Methods

3.1. Wildfire Susceptibility Assessment Method

As shown in Figure 8, the evaluation of wildfire susceptibility for different land-use types followed 2 stages:
In the first stage, the wildfire samples were divided and the dataset was constructed. The VIIRS historical wildfire samples from 2012 to 2022 were processed and screened to ensure the accuracy of the fire location information. According to the MCD12Q1 product of land-use types, the wildfire samples were divided into four categories, namely all types, forest land, grassland, and cultivated land, and the corresponding negative samples were selected. We selected 16 factors that affect wildfire occurrence based on the geographical and natural environment of the study area and the spatial distribution of the historical wildfire samples.
In the second stage, the wildfire susceptibility model was constructed and analyzed. The sample dataset was randomly divided into a training set (70%) and a testing set (30%). The multicollinearity among susceptibility conditioning factors was analyzed based on the training set data. The LGBM algorithm was used to construct wildfire susceptibility models for different land-use types, and susceptibility maps were generated accordingly. Based on the testing set data, we evaluated the wildfire susceptibility characteristics and patterns of different land-use types in Central China by analyzing the zoning results, prediction performance, and factor contribution degree of different models.

3.1.1. Multicollinearity Test

Tolerance ( T O L ) and variance inflation factor ( V I F ) are two commonly used indicators for detecting multicollinearity. Multilinearity may result in unreliable results when performing regression analysis; therefore, collinearity testing is required [61]. Before constructing the wildfire susceptibility model using machine learning (ML) algorithms, it is necessary to calculate T O L and V I F for the 16 susceptibility conditioning factors to determine whether there are collinearity issues and to select appropriate factors for modeling. The calculation equation is as follows:
V I F = | 1 T O L | = | 1 1 R j 2 |
where R j 2 represents the degree to which factor j explains the linear relationship with other factors. It can be obtained by regressing factor j as the dependent variable and the other 15 factors as the independent variables to obtain R j 2 . The smaller the T O L and the larger the V I F , the higher the collinearity between the factors. Typically, independent variables with a T O L less than 0.1 or a V I F greater than 10 are considered to have collinearity issues [62,63].

3.1.2. Light Gradient Boosting Machine (LGBM)

In the investigation of wildfire susceptibility, we employed the light gradient boosting machine (LGBM) algorithm to construct the wildfire susceptibility model. LGBM is a machine learning algorithm based on gradient boosted decision trees (GBDT). The scalability and parallel computing properties of LGBM enable it to handle large-scale datasets with a relatively small memory footprint [64]. This feature makes LGBM particularly suitable for wildfire susceptibility research, as such studies typically involve large amounts of remote sensing data and environmental variables. Compared with algorithms such as SVM, RF, and GBDT, LGBM employs a histogram-based decision tree algorithm instead of traditional binary decision trees, reducing the possibility of overfitting. Additionally, LGBM supports L1 and L2 regularization and adopts the leaf-wise growth strategy, which can constrain model complexity and reduce the risk of overfitting while maintaining accuracy [65]. The objective equation of LGBM aims to minimize the loss function, which is commonly expressed as Equation (5).
L ( y ,   F ) = l ( y i ,   F ( x i ) ) + Ω ( f t )
where l ( y i ,   F ( x i ) ) represents the loss function, measuring the discrepancy between the predicted value F ( x i ) and the actual value y i . Ω ( f t ) denotes the regularization term used to restrict model complexity and prevent overfitting. The summation symbol ( ) indicates the summation of all data samples or base learners.
In addition to using wildfire samples as positive samples, the ML model also requires negative samples as the data foundation for constructing the wildfire susceptibility regression prediction model. In this study, we randomly selected negative samples with a quantity equal to that of specific land-use types in areas with a low historical wildfire density. The distance between samples is greater than 5000 m to ensure the randomness of negative sample regional features. Specifically, the numbers of negative samples for all types, forest land, grassland, and cultivated land were 7099, 389, 2698, and 4002, respectively. Wildfire positive samples were assigned a value of “1” and negative samples were assigned a value of “0”. We randomly selected 70% of the samples as the training set and the remaining 30% as the test set. The training set was used for model training and construction, while the test set was used to verify the predictive performance of each susceptibility model. Additionally, we utilized the K-10 cross-validation method to improve the generalization ability and stability of the models to construct a more reliable and accurate susceptibility prediction model. The hyperparameter tuning results for each period of the LGBM model are shown in Table 3.

3.1.3. Performance Assessment

The receiver operating characteristic curve (ROC) is a common method used to evaluate the performance of binary classification models [66]. The ROC curve visualizes the classifier’s prediction results by plotting the true positive rate (TPR) on the vertical axis and the false positive rate (FPR) on the horizontal axis. When evaluating the performance of wildfire susceptibility prediction, the ROC curve can be used to assess the classification ability of the model for wildfire and non-wildfire samples [67]. Using wildfire samples as positive examples and non-wildfire samples as negative examples, TPR and FPR are calculated at different thresholds based on the model’s prediction results, and the ROC curve is plotted accordingly. The closer the ROC curve is to the upper left corner, the better the predictive performance of the model. The performance of the model can be evaluated by calculating the area under the ROC curve (AUC), which has a range of [0, 1]. The closer the AUC value is to 1, the better the model’s predictive ability. When the AUC value is greater than 0.9, it indicates that the model has an excellent classification performance for wildfire and non-wildfire samples, and it can achieve accurate prediction and classification of wildfire susceptibility [68].
In addition, precision, sensitivity, specificity, F1-score, accuracy, and kappa coefficient (Kappa’C) are commonly used indicators for evaluating the predictive performance of wildfire susceptibility models. These indicators evaluate the accuracy and reliability of the model by comparing the difference between the model’s predicted results and the actual observed values [9]. Precision measures the proportion of correctly predicted wildfires among all of the predicted wildfires. Sensitivity measures the proportion of actual wildfires that are correctly predicted by the model. Specificity measures the proportion of actual non-wildfires that are correctly predicted by the model. F1 score combines the precision and sensitivity of the model’s prediction results and reflects the overall predictive performance of the wildfire susceptibility model on wildfire samples, with a range of [0, 1]. A higher value indicates a better predictive ability of the model on wildfire samples. Accuracy is a metric used to evaluate the overall predictive performance of the model, and it reflects the model’s accuracy in predicting all of the samples. Kappa’C considers the consistency and randomness of the model’s prediction and the actual observation, which can more accurately evaluate the model’s classification performance [69]. A higher Kappa’C value indicates more reliable prediction results from the model. When the value is greater than 0.6, it indicates a relatively reliable prediction ability of the model; when the value is greater than 0.8, it indicates a highly reliable prediction ability of the model, which can be used in practical applications with certain stability [70,71]. The calculation formulas are shown in Equations (6)–(11).
P r e c i s i o n = T P T P + F P
S e n s i t i v i t y = T P T P + F N
S p e c i f i c i t y = T N T N + F P
F 1 s c o r e = 2 × P r e c i s i o n × S e n s i t i v i t y P r e c i s i o n + S e n s i t i v i t y
A c c u r a c y = T P + T N T P + F N + T N + F P
K a p p a C = A c c u r a c y P e 1 P e   ( P e = ( T P + F N ) ( T P + F P ) ( T N + F N ) ( F P + T N ) ( T P + F N + F P + T N ) 2 )
where T P represents true positive, T N represents true negative, F P represents false positive, and F N represents false negative. P e represents the probability of the model making random predictions.

3.2. Wildfire Vulnerability Assessment Method

Weighting methods are used in multi-factor decision analysis to determine the weights of each factor for comprehensive evaluation and decision making. Common weighting methods include subjective weighting, objective weighting, and subjective−objective combination weighting method [72]. Among them, subjective weighting relies on the expert’s subjective experience and judgment. Although this method can reflect the complexity of the problem well, it is still influenced by the expert’s subjective experience, leading to uncertainty in the evaluation results [73]. Objective weighting analyzes the weighting based on the data and properties of each factor, which has certain objectivity and scientificity, but has high requirements for data and does not consider the actual value and significance of the factor, which can cause evaluation errors [74].
Therefore, to more accurately reflect the degree of influence of different factors on wildfire vulnerability, this study comprehensively considered the expert’s subjective opinions and objective data information, and adopted the subjective−objective combination weighting method of the Analytic Hierarchy Process−Entropy Weight Method (AHP-EWM) to determine the weights of each vulnerability factor. This method can fully utilize the advantages of both methods, make up for the shortcomings of a single method, and improve the accuracy and reliability of vulnerability assessment results [75]. The specific process is shown in Figure 9.

3.2.1. Subjective Weighting Method

Analytic Hierarchy Process (AHP) is a subjective weighting method that combines qualitative and quantitative aspects. Its main steps include (1) establishing a multi-objective hierarchy, (2) constructing a judgment matrix, (3) calculating the maximum eigenvalue, and (4) consistency check and weight determination [76]. The scale criteria for the factors in the judgment matrix are shown in Table 4. In addition, the consistency check is usually performed using the consistency ratio (CR) to determine whether the judgment matrix meets the consistency requirement. Typically, when the CR value is less than 0.1, the consistency of the judgment matrix is considered good and the weight calculation results are reliable.

3.2.2. Objective Weighting Method

The Entropy Weight Method (EWM) is a method for objectively determining the weight of factors based on their degree of dispersion [77]. The specific calculation process is as follows: (1) To avoid differences in dimensions between indicators, normalize the attribute values of each factor, as shown in Equation (12). (2) Calculate the entropy value of each factor using Equation (13). (3) Calculate the weight of each factor using Equation (14). (4) Normalize the weights of each factor so that the sum of all weights is equal to 1, as shown in Equation (15).
p i j = x i j x i _ m i n x i _ m a x x i _ m i n
e i = 1 ln ( n ) j = 1 n p i j s i ln p i j s i
w i = 1 e i j = 1 m ( 1 e i )
w n _ i = w i j = 1 m w i
where x i j represents the attribute value of the j -th sample of the i -th factor; x i _ m a x and x i _ m i n are the maximum and minimum attribute values of the i -th factor, respectively; p i j is the normalized value of the j -th sample of the i -th factor; n is the sample size; s i is the sum of normalized values of all samples of the i -th factor; and m is the number of factors.

3.2.3. Subjective−Objective Combination Weighting Method

The “combined evaluation method using distance functions” is a commonly used method for combining subjective and objective weights, and the basic idea is to transform the distances between factors into similarities to determine the weights [78,79]. Based on this method, the subjective and objective weights were organically integrated to obtain the comprehensive weight, and then multiplied with the normalized values of each factor to obtain the final evaluation result of wildfire vulnerability. The calculation formulas are as follows:
1 2 i = 1 m ( w A H P _ i w E W M _ i ) 2 = ( α β ) 2
α + β = 1 ( α > 0 , β > 0 )
W i = α w A H P _ i + β w E W M _ i
V = i = 1 m W i × p i j
where w A H P _ i represents the AHP weight of the i -th factor, and w E W M _ i represents the EWM weight of the i -th factor. α and β are the allocation coefficients of subjective and objective weights, respectively. W i represents the combined weight value of the i -th factor.

3.3. Wildfire Risk Assessment Method

Wildfire risk assessment is a comprehensive evaluation and analysis process of the likelihood of wildfire occurrence and the degree of damage it may cause [21]. Based on the wildfire susceptibility and vulnerability assessment results in Central China, this study used the “Risk = Susceptibility × Vulnerability” method to evaluate and analyze the wildfire risk of different land-use types in the area. Currently, this method has been widely applied in natural disaster risk assessment, such as landslides and floods, and has achieved certain success [80,81,82,83]. The formula is shown in Equation (20).
R j = S j × V j
where R j represents the risk index of the j -th evaluation unit, while S j and V j represent the susceptibility and vulnerability index of the same unit, respectively.

4. Results

4.1. Susceptibility Assessment

4.1.1. Multicollinearity Test Results

This study utilized the SPSS data analysis software to evaluate the multicollinearity between wildfire occurrence and susceptibility conditioning factors for different land-use types, as shown in Table 5. The TOL results for all 16 wildfire conditioning factors in different land-use types were higher than 0.1, and the VIF results were lower than 10, indicating that there was no multicollinearity among factors and no strong mutual influence, which ensured the reliability and validity of the wildfire susceptibility model.

4.1.2. Model Performance Assessment

The performance of wildfire susceptibility models based on different land-use types was assessed using a test dataset. ROC curves were used to evaluate the classification ability of each model (Figure 10). Under the same FPR, the TPRs of the wildfire susceptibility models constructed based on individual land-use types (forest land, grassland, and cultivated land) were higher than that of the model constructed based on all land-use types. The AUC values were ranked as follows: forest land (0.984) > cultivated land (0.983) > grassland (0.970) > all types (0.954). These findings indicate that both the models based on all land-use types and individual types performed well in classification. However, the models focusing on individual land-use types exhibited a better overall classification performance for the wildfire samples, surpassing the model incorporating all land-use types.
After evaluating the overall performance of wildfire susceptibility models, we used multiple metrics to assess the prediction accuracy of each model (Table 6). Compared with the models encompassing all land-use types, the models focusing on a single land-use type showed significantly improved the prediction accuracy. Precision, sensitivity, and F1-score values were ranked as follows: forest land > cultivated land > grassland > all types. Similarly, the specificity values were ranked as follows: cultivated land > forest land > grassland > all types. This indicates that models constructed using a single land-use type exhibited a higher prediction accuracy for both wildfire and non-wildfire samples. The model based on forest land type demonstrated the best prediction performance for wildfire samples, while the models based on cultivated land and grassland type performed relatively poorly. The accuracy of the single land-use type-models exceeded 0.9, and the kappa coefficient was above 0.8. These models outperformed the models based on all land-use types, yielding classification results that better aligned with the actual situation. Overall, the wildfire susceptibility models focused on a single land-use type can provide better predictions of wildfire occurrence probability and hazard level specific to that land-use type, yielding more targeted susceptibility assessment results.

4.1.3. Wildfire Susceptibility Map

The wildfire susceptibility models of all types, forest land, grassland, and cultivated land, were used to predict the wildfire susceptibility of the entire study area, and the wildfire susceptibility maps of different land-use types were drawn (Figure 11). The natural breakpoint method was used uniformly to classify the wildfire susceptibility values in the region into five susceptibility levels: very low, low, moderate, high, and very high. Visually, the zonation patterns of susceptibility models constructed using wildfire samples of different land-use types differed significantly.
The high susceptibility zones based on wildfire samples of all land-use types were mainly located in the central, eastern, and northeastern parts of Henan Province; the northeastern and southeastern parts of Hubei Province; and the central, eastern, and southern parts of Hunan Province, which reflected the spatial distribution of high susceptibility zones of wildfires in Central China. The high susceptibility zones of forest land and grassland were mainly distributed in Hubei Province and Hunan Province, while those of cultivated land were mainly distributed in Henan Province and Hubei Province. The susceptibility zoning results of wildfires for different land-use types reflected the spatial distribution of high susceptibility zones of forest land, grassland, and cultivated land in Central China. Specifically, the high susceptibility areas for forest land wildfires were located in the transitional zone between the eastern parts of Henan and Hubei Provinces, as well as the western and southeastern parts of Hunan Province. The high susceptibility areas for grassland wildfires were located in the eastern, northeastern, and southeastern parts of Hubei Province, and the northeastern, central, and southern parts of Hunan Province. The high susceptibility areas for cultivated land wildfires were located in the northern, central, eastern, and southwestern parts of Henan Province, the central-western part of Hubei Province, and the central-southern part of Hunan Province.
In this study, comprehensive analysis was conducted on the area proportion, sample number proportion, and frequency ratios of different susceptibility classes for each model to evaluate the discrepancies in susceptibility zoning details. The results are presented in Figure 12. Frequency ratios were calculated by dividing the proportion of wildfire samples in each susceptibility level by the proportion of areas in that level. The higher the frequency ratio, the greater the number of wildfire samples in a smaller range of susceptibility areas, resulting in a better fit to the wildfire samples and more reasonable zoning results. The frequency ratios for all models increased with the increase in susceptibility level, indicating reasonable zoning results. However, compared with all land-use types, the low wildfire susceptibility zones for forest land, grassland, and cultivated land were larger, with fewer wildfire samples covered and lower frequency ratios. On the other hand, the high and very high susceptibility areas were smaller, but covered a larger number of wildfire samples and had higher frequency ratios for the corresponding classes.
To sum up, the spatial distribution of wildfire susceptibility in Central China varies according to land-use type. The susceptibility model constructed using wildfire samples of all land-use types can effectively reflect the susceptibility patterns of all types of wildfires in the region. On the other hand, the susceptibility models constructed using wildfire samples of a single land-use type have a better predictive performance and more targeted assessment results.

4.1.4. Factor Contribution Analysis

The relative importance of each factor was obtained using the feature importance evaluation tool built into LGBM. As shown in Figure 13, there were significant differences in the impact of each factor on the wildfire susceptibility of different land-use types. Specifically, for predicting the wildfire susceptibility of forest land in Central China, temperature, aspect, solar radiation, NDVI, curvature, and rainfall were the most significant factors. For predicting the wildfire susceptibility of grassland and cultivated land, NDVI and meteorological factors such as rainfall, wind speed, solar radiation, temperature, and potential evaporation were the most important factors. In addition, for predicting the wildfire susceptibility of these three land-use types, factors such as SPI, soil type, distance to rivers, and distance to roads were found to be the least important.

4.2. Vulnerability Assessment

In this study, we used the AHP method to calculate the subjective weights of each susceptibility factor. To ensure consistency in the established judgment matrix, a consistency check was performed. The maximum eigenvalue was 6.113 and the CR value was 0.018 (CR < 0.1), indicating that the judgment matrix passed the consistency check and the subjective weight calculation result was qualified. Combining the subjective weights with the objective weights of the factors calculated by EWM, we obtained the formula for calculating the combined weights of wildfire vulnerability factors, as shown in Equation (21).
W = 0.572 × w A H P + 0.428 × w E W M
where W represents the combined subjective and objective weight of the factor, w A H P represents the subjective weight, and w E W M represents the objective weight.
The weight calculation results of each vulnerability factor are shown in Table 7. The combined weights and normalized results of each vulnerability factor were used to calculate the wildfire susceptibility index for each city in Central China using Equation (19), as shown in Figure 14a. Subsequently, vulnerability was classified into five levels, namely very low [0.087, 0.300], low (0.300, 0.362], moderate (0.362, 0.407], high (0.407, 0.479], and very high (0.479, 0.582], using the natural breakpoint method. The zoning results are shown in Figure 14b. As the study area consisted of 49 cities, we quantitatively analyzed the wildfire vulnerability of each city and identified the cities vulnerable to wildfire.
According to the zoning results, Zhengzhou, Xuchang, Jiaozuo, Pingdingshan, and Luohe cities in Henan Province; Qianjiang and Wuhan in Hubei Province; and the remaining 10 cities in Hunan Province, except Yiyang, Yueyang, Xiangshi, and Zhangjiajie City, were classified as very high and high vulnerability areas, covering 35.017% of the total area in Central China. Five cities in the eastern and southern part of Henan Province; Xiaogan, Tianmen, Xiantao, Huangshi, and Xianning in Hubei Province; and Xiangxi, Yiyang, and Yueyang in Hunan Province were classified as medium vulnerability areas, accounting for 25.140% of the total area. The remaining cities were classified as low and very low vulnerability areas, covering 39.843% of the total area. Hunan Province had a higher percentage of vulnerable people, a more developed economy, higher road density, and a better ecological environment. In case of a wildfire disaster, its human, economic, and ecological environments will be more vulnerable and prone to destruction. The central region of Henan Province and Qianjiang and Wuhan in Hubei Province were particularly at risk of severe damage to human safety and economic development from wildfire disasters due to their rapid economic development and dense road distribution.

4.3. Risk Assessment

In this study, Equation (21) was used to integrate the wildfire susceptibility results of the four types (all types, forest land, grassland, and cultivated land) in Central China with the wildfire vulnerability results, to calculate the wildfire risk index for all units in the region. The entire region was classified into five risk levels of very low risk, low risk, moderate risk, high risk, and very high risk using the natural breakpoint method. The zoning results of wildfire risk are shown in Figure 15 and the statistical results are shown in Table 8.
The wildfire risk varied greatly depending on the land-use type. We analyzed the wildfire risk by taking into account the characteristics of different regions and their land-use types.
According to the wildfire risk zoning results for all land-use types, the area of the very-high-risk zones in Central China was 78,955.25 km2, accounting for 14.002% of the total area. Specifically, (1) due to the large proportion of cultivated land, a high number of vulnerable people, intense human activity, and high economic level, the areas of Zhoukou, the southern part of Luohe, the southwest part of Xuchang, the eastern part of Pingdingshan and Shangqiu, the eastern and northern parts of Zhumadian, and the eastern and central parts of Nanyang in Henan Province, as well as the northeast part of Zhengzhou, were identified as very high wildfire risk zones in the province. (2) In Hubei Province, the eastern part of Wuhan, the central part of Xiaogan, the northeast part of Tianmen, the southern part of Huangshi, and the eastern and southern parts of Xianning, with abundant grassland and cultivated land, dense road distribution, developed economy and good ecological environment, were also identified as very high wildfire risk zones. (3) In Hunan Province, the very high wildfire risk zones were located in most areas of Hengyang and Yongzhou, the central and eastern parts of Shaoyang, the western and northern parts of Chenzhou, and the central parts of Zhuzhou and Loudi. Forest land, grassland, and cultivated land were distributed in an interlocking pattern in the region, with a high proportion of vulnerable people and good ecological conditions. Therefore, the occurrence of wildfire disasters in this region would result in greater losses and risks.
Based on the zoning results of the individual land-use types, it was found that there were significant differences in the distribution of areas with very high wildfire risk for different land-use types in Central China. The high-risk areas for forest land and grassland were mainly distributed in Hunan Province, while those for cultivated land were mainly distributed in Henan Province. Specifically, (1) the very high-risk area for forest land was 39,180 km2, accounting for 6.948% of the total area. It was mainly located in the southern part of Xianning; the eastern and northern parts of Changsha; the eastern and southern parts of Zhuzhou; the eastern part of Chenzhou; the central and southern parts of Yongzhou; the western part of Yiyang and Shaoyang; and the northeast, central, and southern parts of Huaihua. (2) The very-high-risk area for grassland was 73,166.5 km2, accounting for 12.976% of the total area. It was mainly located in the majority of Yongzhou and Hengyang, the southern parts of Huangshi and Xianning, the eastern part of Shaoyang, the eastern and western parts of Changsha, the central part of Zhuzhou, the western part of Chenzhou, the central part of Loudi, and the northern part of Huaihua. (3) The very-high-risk area for cultivated land was 67,928 km2, accounting for 12.047% of the total area. In Henan Province, it mainly covered most of Zhoukou, Luohe, Xuchang, and Pingdingshan; the southern part of Jiaozuo and Shangqiu; the eastern and northern parts of Zhumadian; the northeastern part of Zhengzhou; and the southern part of Nanyang. In Hubei Province, it covered the northern part of Wuhan, the central part of Xiaogan, the eastern part of Tianmen, and the southern part of Qianjiang. In Hunan Province, it covered the central and eastern parts of Shaoyang, the northern and eastern parts of Yongzhou, the central part of Loudi, and the central part of Hengyang.

5. Discussion

5.1. Additional Explanation of Wetland Wildfires in Central China

The land-use types have a significant impact on wildfire occurrence, as they influence vegetation characteristics, quantity, structure, and continuity, ultimately affecting the probability, spread rate, fire size, and environmental impacts of wildfires [52,84,85]. Generally speaking, forested, grassland, and farmland areas typically accumulate combustible vegetation, such as dry leaves and grass, making them more prone to fire occurrence and less equipped with natural and artificial fire prevention measures. In contrast, wetlands, with their high water content and moist vegetation, are less susceptible to ignition. In our study, the MCD12Q1 land use product was used to classify wildfire samples in Central China. The occurrence of wildfires in wetlands was considerably lower compared with forested, grassland, and farmland areas, with only 10 samples. Because of the limited sample size, a separate risk assessment for wetland wildfires was not conducted.
The surface water in wetlands tends to stay for a long time, which results in a high level of soil saturation and vegetation coverage. The high water content usually reduces the risk of fires in wetlands, as fires are less likely to spread in the absence of combustible materials. However, humidity is not the only factor that contributes to fires in wetlands, and other factors can also lead to fires. The wetland fire samples in our study were located on the edge of the wetlands, and when the water content of the wetland decreases and the vegetation becomes more combustible, the likelihood of the fire spreading to the wetlands increases. In addition, human activities such as burning fields and rubbish near wetlands can also cause wetland fires. Therefore, although the occurrence of wildfires in wetlands is relatively low compared with other land types, there is still a possibility of wetland fires in areas with frequent human activities and dry seasons. Therefore, measures need to be taken to strengthen fire prevention and control in wetlands in the Central China region to protect the ecological environment of wetlands and the safety of human property.

5.2. Significance of Different Dimensions of Wildfire Riskiness Assessment

In order to comprehensively understand the wildfire risk situation of different land-use types in the region, this study conducted wildfire susceptibility and risk assessments based on both the overall and individual land-use types. The spatial distribution of wildfire riskiness based on different land-use types of wildfires in the corresponding land-use types is shown in Figure 16. The statistical results of zoning are shown in Table 9.
On one hand, the advantage of evaluating the wildfire susceptibility and risk of all land-use types is that it can comprehensively consider the wildfire risk situation of different land-use types in the entire region, including forest land, grassland, and cultivated land. This method can comprehensively evaluate the potential threats of wildfires to human beings, property, and the environment by taking into account the different characteristics and probabilities of wildfire occurrence of various land-use types, and provide a comprehensive assessment of wildfire risk for the entire region. On the other hand, evaluating the wildfire susceptibility and risk of a single land-use type can provide a deeper understanding of the wildfire risk situation for that land-use type, and has higher practicality for taking targeted wildfire prevention and control measures. For example, evaluating the wildfire risk of forest land can analyze factors such as forest fire danger rating and forest vegetation cover, which is beneficial for formulating targeted forest fire prevention plans and management strategies. In addition, evaluating the wildfire risk of a single land-use type can also help to develop targeted wildfire prevention and control measures to reduce the losses caused by wildfires for that land-use type. However, if only a single land-use type is evaluated, it may ignore the impact of other land-use types on the wildfire risk evaluation.
Therefore, conducting simultaneous evaluations of both all and single land-use types for wildfire risk is advantageous. It enables us to comprehensively understand the spatial distribution of wildfire risk in the entire region and to gain in-depth knowledge of wildfire risk for specific land-use types. This comprehensive evaluation method can provide more accurate and comprehensive support and guidance for wildfire prevention and response, and help develop more targeted prevention and response measures, thereby improving their efficiency and effectiveness.

5.3. Suggestions for Wildfires Disaster Prevention and Control

The study addresses the complex impact of land-use types on wildfire susceptibility and risk in Central China. Based on the spatial distribution of wildfires, the following wildfire prevention and control suggestions are proposed for different land-use types:
(1)
Forest land: Due to the accumulation of flammable vegetation, it is recommended to enhance forest management by implementing measures such as vegetation clearing, fuel control, and firebreak construction. Additionally, improving monitoring and warning systems can aid in the early detection and extinguishing of forest fires.
(2)
Grassland: Rapid growth of grassland vegetation leads to significant environmental damage. To mitigate this risk, it is advised to regularly clear dry grass, roots, and weeds in grassland areas. Establishing fire breaks and implementing fire prevention measures will facilitate efficient firefighting and wildfire control.
(3)
Cultivated land: Loose soil, frequent tillage, and fertilization make cultivated land susceptible to wildfires caused by the accumulation of flammable waste, such as straw. To prevent fires, it is important to strengthen farmland management, regulate the burning of agricultural waste, and avoid farming during high-temperature dry weather conditions. Constructing fire breaks around farmland can also help prevent the spread of wildfires caused by human activities such as field burning.
(4)
Wetland: Wetland vegetation is more vulnerable to burning during the dry season, and human activities can contribute to the spread of wildfires. Therefore, it is recommended to enhance monitoring and patrols of wetland edge zones, promptly detect and respond to fires around wetlands, and prevent wildfires from spreading into wetland areas. Implementing stricter management of human activities around wetlands, such as garbage burning and field burning, can further minimize the risk of wetland wildfires.
For different types of land use, fire prevention and management strategies should be specific and targeted to minimize wildfire risk and damage.

5.4. Limitations and Future Works

The present paper also encountered certain limitations. In this study, the selection of land-use types from the year 2020 as the basis for dividing historical wildfire samples was done to ensure temporal consistency with vulnerability indicators for evaluating wildfire risk during that period. However, it should be noted that there can be temporal conversions among different vegetation types, despite our efforts to exclude non-vegetation areas from all historical periods. As a result, we did not incorporate land-use types as regulatory factors in the modeling of wildfire susceptibility. Instead, we examined the spatial distribution patterns of wildfire susceptibility for different land-use types by considering the attribute values of other factors and the relationship among wildfire samples; for instance, the conversions between grassland and cultivated land (Figure 17) and between grassland and forest land (Figure 18) during historical periods. It is evident that the majority of wildfire samples in the regions where conversions occurred between grassland and cultivated land or between grassland and forest land were located in the high and extremely high susceptibility zones. Based on this, future research could explore dividing wildfire samples according to annual land-use type data and constructing wildfire risk models with additional conditioning factors during these periods. This would contribute to assessing the spatiotemporal variations in wildfire risk in the region.
In addition, this study has not adequately considered the impact of lightning activity on wildfire occurrence. Lightning, as one of the primary natural ignition sources for wildfires, has been shown to play a significant role in their initiation [86,87]. The spatial and temporal distribution of lightning activity can vary in real-time, leading to unpredictable effects on wildfire disasters [88]. Notably, not all instances of lightning activity result in wildfires, as natural fires are often attributed to occurring with little or no precipitation [89]. Therefore, the frequency of lightning is likely associated with other meteorological factors, particularly short-term rainfall and thunderstorm events [90]. Land-use type is just one of the many factors that determine wildfire risk. Future research can focus on conducting more in-depth studies and assessments on the wildfires risk in different land-use types by considering the lightning activity factor along with the integration of temporal variations of meteorological factors such as rainfall, humidity, and temperature. This will help uncover the underlying mechanisms of lightning-induced wildfires in different land-use types and provide more accurate information for wildfire risk management.

6. Conclusions

This study focused on wildfires in Central China and developed a comprehensive risk assessment framework for different land-use types. Historical data were collected and classified according to land-use types, and 16 susceptibility factors were selected. Wildfire risk evaluation models were constructed using LGBM for both overall and individual land-use types, and their predictive performance was verified. The vulnerability of the region to wildfire hazards was evaluated using the AHP-EWM weighted method based on six vulnerability factors. Subsequently, wildfire risk assessment and analysis were conducted for different land-use types in Central China, taking into account the evaluation results of susceptibility and vulnerability. The results show the following:
(1)
The wildfire susceptibility model constructed based on all wildfire samples could comprehensively reflect the susceptibility pattern of all types of wildfires in the region, while the susceptibility model constructed based on single land-use types had a better predictive performance and reasonable zoning, as well as more targeted evaluation results.
(2)
There were regional differences in the wildfire susceptibility of different land-use types in Central China. The high susceptibility areas for forest land and grassland wildfires were mainly distributed in Hubei and Hunan Provinces, while the high susceptibility areas for cultivated land wildfires were mainly distributed in the Henan and Hubei Provinces. In addition, the contribution of each factor to the wildfire susceptibility of different land-use types varied greatly. Temperature, aspect, solar radiation, NDVI, curvature, and rainfall had the most significant predictive contribution to the wildfire susceptibility of forest land, while the wildfire susceptibility of grassland and cultivated land was mainly influenced by NDVI and meteorological factors.
(3)
Taking into account the vulnerable population, material economy, and ecological environment of each city, and using the subjective−objective weighting method, a more comprehensive evaluation of the wildfire vulnerability of different cities could be achieved, ensuring the accuracy and reliability of the evaluation results.
(4)
The evaluation of the wildfire risk for both overall and individual land-use types was helpful for decision makers to have a comprehensive understanding of the spatial distribution of wildfire risk in the entire region, as well as an in-depth insight into the specific wildfire risk situation of particular land-use types. This would enable them to formulate more targeted prevention and response measures, and improve efficiency and effectiveness. Moreover, conducting periodic evaluations of wildfire risk is of great significance for developing long-term prevention and response strategies, ensuring regional ecological safety and promoting socio-economic development.

Author Contributions

Conceptualization, W.Y. and C.R.; methodology, W.Y. and C.R.; validation, C.R.; formal analysis, W.Y.; resources, W.Y. and C.R.; data curation, W.Y., C.R. and X.L.; writing original draft preparation, W.Y.; writing—review and editing, W.Y., C.R. and Y.L.; visualization, W.Y. and J.L.; supervision, C.R. and Y.L. and funding acquisition, Y.L. All authors have read and agreed to the published version of the manuscript.

Funding

This work was supported by the National Natural Science Foundation of China (Grant No. 42064003) and the Guangxi Natural Science Foundation (Grant No. 2021GXNSFBA220046).

Data Availability Statement

The hotspot datasets from 2012 to 2022 utilized in this study are freely available from the Fire In-formation for Resource Management System (FIRMS) at https://firms.modaps.eosdis.nasa.gov/ (accessed on 26 April 2023). Information on roads, buildings, residential area and rivers can be obtained from the National Catalogue Service for Geographic Information (in Chinese) at https://www.webmap.cn/ (accessed on 27 April 2023). Soil type data is obtained from the Harmonized World Soil Database (HWSD) at https://www.fao.org/soils-portal/data-hub/soil-maps-and-databases/harmonized-world-soil-database-v12/en/ (accessed on 27 April 2023). All other susceptibility conditioning factors are sourced from Google Earth Engine (GEE) at https://code.earthengine.google.com/ (accessed on 1 May 2023).

Conflicts of Interest

The authors declare no conflict of interest.

References

  1. McWethy, D.B.; Schoennagel, T.; Higuera, P.E.; Krawchuk, M.; Harvey, B.J.; Metcalf, E.C.; Schultz, C.; Miller, C.; Metcalf, A.L.; Buma, B. Rethinking resilience to wildfire. Nat. Sustain. 2019, 2, 797–804. [Google Scholar] [CrossRef]
  2. Hong, H.; Jaafari, A.; Zenner, E.K. Predicting spatial patterns of wildfire susceptibility in the Huichang County, China: An integrated model to analysis of landscape indicators. Ecol. Indic. 2019, 101, 878–891. [Google Scholar] [CrossRef]
  3. Kharitonova, A.; Kharitonova, T. The effect of landscape pattern on the 2010 wildfire spread in the Mordovia State Nature Reserve, Russia. Nat. Conserv. Res 2021, 6, 29–41. [Google Scholar] [CrossRef]
  4. Hesseln, H. Wildland fire prevention: A review. Curr. For. Rep. 2018, 4, 178–190. [Google Scholar] [CrossRef]
  5. Jones, M.W.; Smith, A.; Betts, R.; Canadell, J.G.; Prentice, I.C.; Le Quéré, C. Climate change increases the risk of wildfires. Sci. Rev. 2020, 116, 117. [Google Scholar]
  6. García-Llamas, P.; Suárez-Seoane, S.; Taboada, A.; Fernández-Manso, A.; Quintano, C.; Fernández-García, V.; Fernández-Guisuraga, J.M.; Marcos, E.; Calvo, L. Environmental drivers of fire severity in extreme fire events that affect Mediterranean pine forest ecosystems. For. Ecol. Manag. 2019, 433, 24–32. [Google Scholar] [CrossRef]
  7. Yue, W.; Ren, C.; Liang, Y.; Liang, J.; Lin, X.; Yin, A.; Wei, Z. Assessment of Wildfire Susceptibility and Wildfire Threats to Ecological Environment and Urban Development Based on GIS and Multi-Source Data: A Case Study of Guilin, China. Remote Sens. 2023, 15, 2659. [Google Scholar] [CrossRef]
  8. Blanchi, R.; Leonard, J.; Haynes, K.; Opie, K.; James, M.; de Oliveira, F.D. Environmental circumstances surrounding bushfire fatalities in Australia 1901–2011. Environ. Sci. Policy 2014, 37, 192–203. [Google Scholar] [CrossRef] [Green Version]
  9. Nami, M.; Jaafari, A.; Fallah, M.; Nabiuni, S. Spatial prediction of wildfire probability in the Hyrcanian ecoregion using evidential belief function model and GIS. Int. J. Environ. Sci. Technol. 2018, 15, 373–384. [Google Scholar] [CrossRef]
  10. Ward, P.J.; Blauhut, V.; Bloemendaal, N.; Daniell, J.E.; de Ruiter, M.C.; Duncan, M.J.; Emberson, R.; Jenkins, S.F.; Kirschbaum, D.; Kunz, M. Natural hazard risk assessments at the global scale. Nat. Hazards Earth Syst. Sci. 2020, 20, 1069–1096. [Google Scholar] [CrossRef] [Green Version]
  11. Eini, M.; Kaboli, H.S.; Rashidian, M.; Hedayat, H. Hazard and vulnerability in urban flood risk mapping: Machine learning techniques and considering the role of urban districts. Int. J. Disaster Risk Reduct. 2020, 50, 101687. [Google Scholar] [CrossRef]
  12. Qayum, A.; Ahmad, F.; Arya, R.; Singh, R.K. Predictive modeling of forest fire using geospatial tools and strategic allocation of resources: eForestFire. Stoch. Environ. Res. Risk Assess. 2020, 34, 2259–2275. [Google Scholar] [CrossRef]
  13. Jiménez-Perálvarez, J. Landslide-risk mapping in a developing hilly area with limited information on landslide occurrence. Landslides 2018, 15, 741–752. [Google Scholar] [CrossRef]
  14. Fekete, A.; Nehren, U. Assessment of social vulnerability to forest fire and hazardous facilities in Germany. Int. J. Disaster Risk Reduct. 2023, 87, 103562. [Google Scholar] [CrossRef]
  15. Tavakkoli Piralilou, S.; Einali, G.; Ghorbanzadeh, O.; Nachappa, T.G.; Gholamnia, K.; Blaschke, T.; Ghamisi, P. A Google Earth Engine approach for wildfire susceptibility prediction fusion with remote sensing data of different spatial resolutions. Remote Sens. 2022, 14, 672. [Google Scholar] [CrossRef]
  16. Novo, A.; Fariñas-Álvarez, N.; Martínez-Sánchez, J.; González-Jorge, H.; Fernández-Alonso, J.M.; Lorenzo, H. Mapping forest fire risk—A case study in Galicia (Spain). Remote Sens. 2020, 12, 3705. [Google Scholar] [CrossRef]
  17. UN DHA. Internationally Agreed Glossary of Basic Terms Related to Disaster Management; United Nations Department of Humanitarian Affairs: Geneva, Switzerland, 1992. [Google Scholar]
  18. Fairbrother, A.; Turnley, J.G. Predicting risks of uncharacteristic wildfires: Application of the risk assessment process. For. Ecol. Manag. 2005, 211, 28–35. [Google Scholar] [CrossRef]
  19. Papathoma-Köhle, M.; Schlögl, M.; Garlichs, C.; Diakakis, M.; Mavroulis, S.; Fuchs, S. A wildfire vulnerability index for buildings. Sci. Rep. 2022, 12, 6378. [Google Scholar] [CrossRef]
  20. Ghorbanzadeh, O.; Blaschke, T.; Gholamnia, K.; Aryal, J. Forest fire susceptibility and risk mapping using social/infrastructural vulnerability and environmental variables. Fire 2019, 2, 50. [Google Scholar] [CrossRef] [Green Version]
  21. Miller, C.; Ager, A.A. A review of recent advances in risk analysis for wildfire management. Int. J. Wildland Fire 2012, 22, 1–14. [Google Scholar] [CrossRef] [Green Version]
  22. Van Westen, C.J. Remote sensing and GIS for natural hazards assessment and disaster risk management. In Treatise on Geomorphology; Academic Press: Cambridge, MA, USA, 2013; Volume 3, pp. 259–298. [Google Scholar]
  23. Lecina-Diaz, J.; Martínez-Vilalta, J.; Alvarez, A.; Vayreda, J.; Retana, J. Assessing the risk of losing Forest ecosystem services due to wildfires. Ecosystems 2021, 24, 1687–1701. [Google Scholar] [CrossRef]
  24. Depietri, Y. The social–ecological dimension of vulnerability and risk to natural hazards. Sustain. Sci. 2020, 15, 587–604. [Google Scholar] [CrossRef]
  25. Talukdar, S.; Das, T.; Naikoo, M.W.; Rihan, M.; Rahman, A. Forest Fire Susceptibility Mapping by Integrating Remote Sensing and Machine Learning Algorithms. In Advances in Remote Sensing for Forest Monitoring; John Wiley & Sons Ltd.: Chichester, UK, 2022; pp. 179–195. [Google Scholar]
  26. Yang, Q.; Zhang, H.; Wang, G.; Luo, S.; Chen, D.; Peng, W.; Shao, J. Dynamic runoff simulation in a changing environment: A data stream approach. Environ. Model. Softw. 2019, 112, 157–165. [Google Scholar] [CrossRef]
  27. Tang, X.; Machimura, T.; Li, J.; Yu, H.; Liu, W. Evaluating seasonal wildfire susceptibility and wildfire threats to local ecosystems in the largest forested area of China. Earths Future 2022, 10, e2021EF002199. [Google Scholar] [CrossRef]
  28. Bui, D.T.; Bui, Q.-T.; Nguyen, Q.-P.; Pradhan, B.; Nampak, H.; Trinh, P.T. A hybrid artificial intelligence approach using GIS-based neural-fuzzy inference system and particle swarm optimization for forest fire susceptibility modeling at a tropical area. Agric. For. Meteorol. 2017, 233, 32–44. [Google Scholar]
  29. Cao, Y.; Wang, M.; Liu, K. Wildfire susceptibility assessment in Southern China: A comparison of multiple methods. Int. J. Disaster Risk Sci. 2017, 8, 164–181. [Google Scholar] [CrossRef] [Green Version]
  30. Eskandari, S.; Pourghasemi, H.R.; Tiefenbacher, J.P. Fire-susceptibility mapping in the natural areas of Iran using new and ensemble data-mining models. Environ. Sci. Pollut. Res. 2021, 28, 47395–47406. [Google Scholar] [CrossRef]
  31. Ma, M.; Zhao, G.; He, B.; Li, Q.; Dong, H.; Wang, S.; Wang, Z. XGBoost-based method for flash flood risk assessment. J. Hydrol. 2021, 598, 126382. [Google Scholar] [CrossRef]
  32. He, Q.; Jiang, Z.; Wang, M.; Liu, K. Landslide and wildfire susceptibility assessment in southeast asia using ensemble machine learning methods. Remote Sens. 2021, 13, 1572. [Google Scholar] [CrossRef]
  33. Mojaddadi, H.; Pradhan, B.; Nampak, H.; Ahmad, N.; Ghazali, A.H.b. Ensemble machine-learning-based geospatial approach for flood risk assessment using multi-sensor remote-sensing data and GIS. Geomat. Nat. Hazards Risk 2017, 8, 1080–1102. [Google Scholar] [CrossRef] [Green Version]
  34. Malczewski, J. Ordered weighted averaging with fuzzy quantifiers: GIS-based multicriteria evaluation for land-use suitability analysis. Int. J. Appl. Earth Obs. Geoinf. 2006, 8, 270–277. [Google Scholar] [CrossRef]
  35. Ozturk, D.; Batuk, F. Implementation of GIS-based multicriteria decision analysis with VB in ArcGIS. Int. J. Inf. Technol. Decis. Mak. 2011, 10, 1023–1042. [Google Scholar] [CrossRef]
  36. Pandey, S.; Nautiyal, R.; Kumar, P.; Chandra, G.; Panwar, V.P. A grey relational model for soil erosion vulnerability assessment in subwatershed of lesser Himalayan region. Catena 2022, 210, 105928. [Google Scholar] [CrossRef]
  37. Hui, C.; Ning, L.; Cheng, C. Risk assessment of Tsunamis along the Chinese coast due to earthquakes. Int. J. Disaster Risk Sci. 2022, 13, 275–290. [Google Scholar] [CrossRef]
  38. Kim, J.E.; Yu, J.; Ryu, J.-H.; Lee, J.-H.; Kim, T.-W. Assessment of regional drought vulnerability and risk using principal component analysis and a Gaussian mixture model. Nat. Hazards 2021, 109, 707–724. [Google Scholar] [CrossRef]
  39. Iban, M.C.; Sekertekin, A. Machine learning based wildfire susceptibility mapping using remotely sensed fire data and GIS: A case study of Adana and Mersin provinces, Turkey. Ecol. Inform. 2022, 69, 101647. [Google Scholar] [CrossRef]
  40. Yankovich, K.S.; Yankovich, E.P.; Baranovskiy, N.V. Classification of vegetation to estimate forest fire danger using landsat 8 images: Case study. Math. Probl. Eng. 2019, 2019, 6296417. [Google Scholar] [CrossRef]
  41. Donovan, V.M.; Wonkka, C.L.; Wedin, D.A.; Twidwell, D. Land-use type as a driver of large wildfire occurrence in the US Great Plains. Remote Sens. 2020, 12, 1869. [Google Scholar] [CrossRef]
  42. Moreira, F.; Vaz, P.; Catry, F.; Silva, J.S. Regional variations in wildfire susceptibility of land-cover types in Portugal: Implications for landscape management to minimize fire hazard. Int. J. Wildland Fire 2009, 18, 563–574. [Google Scholar] [CrossRef]
  43. Zhai, J.; Ning, Z.; Dahal, R.; Yang, S. Wildfire Susceptibility of Land Use and Topographic Features in the Western United States: Implications for the Landscape Management. Forests 2023, 14, 807. [Google Scholar] [CrossRef]
  44. Mermoz, M.; Kitzberger, T.; Veblen, T.T. Landscape influences on occurrence and spread of wildfires in Patagonian forests and shrublands. Ecology 2005, 86, 2705–2715. [Google Scholar] [CrossRef] [Green Version]
  45. Carmo, M.; Moreira, F.; Casimiro, P.; Vaz, P. Land use and topography influences on wildfire occurrence in northern Portugal. Landsc. Urban Plan. 2011, 100, 169–176. [Google Scholar] [CrossRef] [Green Version]
  46. Butsic, V.; Kelly, M.; Moritz, M.A. Land use and wildfire: A review of local interactions and teleconnections. Land 2015, 4, 140–156. [Google Scholar] [CrossRef] [Green Version]
  47. Eskandari, S.; Pourghasemi, H.R.; Tiefenbacher, J.P. Relations of land cover, topography, and climate to fire occurrence in natural regions of Iran: Applying new data mining techniques for modeling and mapping fire danger. For. Ecol. Manag. 2020, 473, 118338. [Google Scholar] [CrossRef]
  48. Trucchia, A.; Meschi, G.; Fiorucci, P.; Gollini, A.; Negro, D. Defining wildfire susceptibility maps in Italy for understanding seasonal wildfire regimes at the national level. Fire 2022, 5, 30. [Google Scholar] [CrossRef]
  49. Csiszar, I.; Schroeder, W.; Giglio, L.; Ellicott, E.; Vadrevu, K.P.; Justice, C.O.; Wind, B. Active fires from the Suomi NPP Visible Infrared Imaging Radiometer Suite: Product status and first evaluation results. J. Geophys. Res. Atmos. 2014, 119, 803–816. [Google Scholar] [CrossRef]
  50. Schroeder, W.; Oliva, P.; Giglio, L.; Csiszar, I.A. The New VIIRS 375 m active fire detection data product: Algorithm description and initial assessment. Remote Sens. Environ. 2014, 143, 85–96. [Google Scholar] [CrossRef]
  51. Sharma, L.K.; Gupta, R.; Fatima, N. Assessing the predictive efficacy of six machine learning algorithms for the susceptibility of Indian forests to fire. Int. J. Wildland Fire 2022, 31, 735–758. [Google Scholar] [CrossRef]
  52. Nur, A.S.; Kim, Y.J.; Lee, J.H.; Lee, C.-W. Spatial Prediction of Wildfire Susceptibility Using Hybrid Machine Learning Models Based on Support Vector Regression in Sydney, Australia. Remote Sens. 2023, 15, 760. [Google Scholar] [CrossRef]
  53. Fernández-Manso, A.; Quintano, C. A synergetic approach to burned area mapping using maximum entropy modeling trained with hyperspectral data and VIIRS hotspots. Remote Sens. 2020, 12, 858. [Google Scholar] [CrossRef] [Green Version]
  54. Gürsoy, M.İ.; Orhan, O.; Tekin, S. Creation of wildfire susceptibility maps in the Mediterranean Region (Turkey) using convolutional neural networks and multilayer perceptron techniques. For. Ecol. Manag. 2023, 538, 121006. [Google Scholar] [CrossRef]
  55. Xu, H. A remote sensing index for assessment of regional ecological changes. China Environ. Sci. 2013, 33, 889–897. [Google Scholar]
  56. Zheng, Z.; Wu, Z.; Chen, Y.; Yang, Z.; Marinello, F. Exploration of eco-environment and urbanization changes in coastal zones: A case study in China over the past 20 years. Ecol. Indic. 2020, 119, 106847. [Google Scholar] [CrossRef]
  57. Liu, T.; Ren, C.; Zhang, S.; Yin, A.; Yue, W. Coupling Coordination Analysis of Urban Development and Ecological Environment in Urban Area of Guilin Based on Multi-Source Data. Int. J. Environ. Res. Public Health 2022, 19, 12583. [Google Scholar] [CrossRef] [PubMed]
  58. Xu, H.; Wang, Y.; Guan, H.; Shi, T.; Hu, X. Detecting ecological changes with a remote sensing based ecological index (RSEI) produced time series and change vector analysis. Remote Sens. 2019, 11, 2345. [Google Scholar] [CrossRef] [Green Version]
  59. Rhee, J.; Im, J.; Carbone, G.J. Monitoring agricultural drought for arid and humid regions using multi-sensor remote sensing data. Remote Sens. Environ. 2010, 114, 2875–2887. [Google Scholar] [CrossRef]
  60. Yue, H.; Liu, Y.; Li, Y.; Lu, Y. Eco-environmental quality assessment in China’s 35 major cities based on remote sensing ecological index. IEEE Access 2019, 7, 51295–51311. [Google Scholar] [CrossRef]
  61. Chen, X.; Chen, W. GIS-based landslide susceptibility assessment using optimized hybrid machine learning methods. Catena 2021, 196, 104833. [Google Scholar] [CrossRef]
  62. Jaafari, A.; Zenner, E.K.; Pham, B.T. Wildfire spatial pattern analysis in the Zagros Mountains, Iran: A comparative study of decision tree based classifiers. Ecol. Inform. 2018, 43, 200–211. [Google Scholar] [CrossRef]
  63. Arabameri, A.; Asadi Nalivan, O.; Saha, S.; Roy, J.; Pradhan, B.; Tiefenbacher, J.P.; Thi Ngo, P.T. Novel ensemble approaches of machine learning techniques in modeling the gully erosion susceptibility. Remote Sens. 2020, 12, 1890. [Google Scholar] [CrossRef]
  64. Ke, G.; Meng, Q.; Finley, T.; Wang, T.; Chen, W.; Ma, W.; Ye, Q.; Liu, T.-Y. Lightgbm: A highly efficient gradient boosting decision tree. Adv. Neural Inf. Process. Syst. 2017, 30, 3149–3157. [Google Scholar]
  65. Aziz, R.M.; Baluch, M.F.; Patel, S.; Ganie, A.H. LGBM: A machine learning approach for Ethereum fraud detection. Int. J. Inf. Technol. 2022, 14, 3321–3331. [Google Scholar] [CrossRef]
  66. Merghadi, A.; Yunus, A.P.; Dou, J.; Whiteley, J.; ThaiPham, B.; Bui, D.T.; Avtar, R.; Abderrahmane, B. Machine learning methods for landslide susceptibility studies: A comparative overview of algorithm performance. Earth-Sci. Rev. 2020, 207, 103225. [Google Scholar] [CrossRef]
  67. Ling, C.X.; Huang, J.; Zhang, H. AUC: A better measure than accuracy in comparing learning algorithms. In Proceedings of the Advances in Artificial Intelligence: 16th Conference of the Canadian Society for Computational Studies of Intelligence, AI 2003, Halifax, NS, Canada, 11–13 June 2003; pp. 329–341. [Google Scholar]
  68. Bradley, A.P. The use of the area under the ROC curve in the evaluation of machine learning algorithms. Pattern Recognit. 1997, 30, 1145–1159. [Google Scholar] [CrossRef] [Green Version]
  69. Abujayyab, S.K.; Kassem, M.M.; Khan, A.A.; Wazirali, R.; Coşkun, M.; Taşoğlu, E.; Öztürk, A.; Toprak, F. Wildfire Susceptibility Mapping Using Five Boosting Machine Learning Algorithms: The Case Study of the Mediterranean Region of Turkey. Adv. Civ. Eng. 2022, 2022, 3959150. [Google Scholar] [CrossRef]
  70. Landis, J.R.; Koch, G.G. The measurement of observer agreement for categorical data. Biometrics 1977, 33, 159–174. [Google Scholar] [CrossRef] [Green Version]
  71. Zhang, G.; Wang, M.; Liu, K. Deep neural networks for global wildfire susceptibility modelling. Ecol. Indic. 2021, 127, 107735. [Google Scholar] [CrossRef]
  72. Hu, Y.; Li, W.; Wang, Q.; Liu, S.; Wang, Z. Evaluation of water inrush risk from coal seam floors with an AHP–EWM algorithm and GIS. Environ. Earth Sci. 2019, 78, 290. [Google Scholar] [CrossRef]
  73. Zhao, J.; Jin, J.; Zhu, J.; Xu, J.; Hang, Q.; Chen, Y.; Han, D. Water resources risk assessment model based on the subjective and objective combination weighting methods. Water Resour. Manag. 2016, 30, 3027–3042. [Google Scholar] [CrossRef]
  74. Peng, J.; Zhang, J. Urban flooding risk assessment based on GIS-game theory combination weight: A case study of Zhengzhou City. Int. J. Disaster Risk Reduct. 2022, 77, 103080. [Google Scholar] [CrossRef]
  75. Xu, S.; Zhang, M.; Ma, Y.; Liu, J.; Wang, Y.; Ma, X.; Chen, J. Multiclassification method of landslide risk assessment in consideration of disaster levels: A case study of Xianyang City, Shaanxi Province. ISPRS Int. J. Geo-Inf. 2021, 10, 646. [Google Scholar] [CrossRef]
  76. Saaty, T.L. A scaling method for priorities in hierarchical structures. J. Math. Psychol. 1977, 15, 234–281. [Google Scholar] [CrossRef]
  77. Jin, C.; Shu, Y.; Han, Z.; Chen, Q.; He, J.; Wang, S. Lightning Disaster Risk Zoning in Jiangsu Province of China Based on the Analytic Hierarchy Process and Entropy Weight Method. Front. Environ. Sci. 2022, 10, 830. [Google Scholar] [CrossRef]
  78. Jiang, W.; Wang, Y.; Yang, J.; Zhang, Z. Surrounding rock quality evaluation and application development for highway tunnel based on engineering applicability. Bull. Eng. Geol. Environ. 2023, 82, 115. [Google Scholar] [CrossRef]
  79. Fei, Z. Research on Entropy Weight-Analytic Hierarchy Process and Grey-Analytic Hierarchy Process. Master’s Thesis, Tianjin University, Tianjin, China, 2009; pp. 5–10. [Google Scholar]
  80. Mind’je, R.; Li, L.; Amanambu, A.C.; Nahayo, L.; Nsengiyumva, J.B.; Gasirabo, A.; Mindje, M. Flood susceptibility modeling and hazard perception in Rwanda. Int. J. Disaster Risk Reduct. 2019, 38, 101211. [Google Scholar] [CrossRef]
  81. Arrogante-Funes, P.; Bruzón, A.G.; Arrogante-Funes, F.; Ramos-Bernal, R.N.; Vázquez-Jiménez, R. Integration of vulnerability and hazard factors for landslide risk assessment. Int. J. Environ. Res. Public Health 2021, 18, 11987. [Google Scholar] [CrossRef]
  82. Li, Y.; Chen, L.; Yin, K.; Zhang, Y.; Gui, L. Quantitative risk analysis of the hazard chain triggered by a landslide and the generated tsunami in the Three Gorges Reservoir area. Landslides 2021, 18, 667–680. [Google Scholar] [CrossRef]
  83. Hall, J.W.; Sayers, P.B.; Dawson, R.J. National-scale assessment of current and future flood risk in England and Wales. Nat. Hazards 2005, 36, 147–164. [Google Scholar] [CrossRef]
  84. Barker, J.W.; Price, O.F.; Jenkins, M.E. Patterns of flammability after a sequence of mixed-severity wildfire in dry eucalypt forests of southern Australia. Ecosphere 2021, 12, e03715. [Google Scholar] [CrossRef]
  85. Ghorbanzadeh, O.; Valizadeh Kamran, K.; Blaschke, T.; Aryal, J.; Naboureh, A.; Einali, J.; Bian, J. Spatial prediction of wildfire susceptibility using field survey gps data and machine learning approaches. Fire 2019, 2, 43. [Google Scholar] [CrossRef] [Green Version]
  86. Pausas, J.G.; Keeley, J.E. Wildfires and global change. Front. Ecol. Environ. 2021, 19, 387–395. [Google Scholar] [CrossRef]
  87. Aldersley, A.; Murray, S.J.; Cornell, S.E. Global and regional analysis of climate and human drivers of wildfire. Sci. Total Environ. 2011, 409, 3472–3481. [Google Scholar] [CrossRef] [PubMed]
  88. Romps, D.M.; Seeley, J.T.; Vollaro, D.; Molinari, J. Projected increase in lightning strikes in the United States due to global warming. Science 2014, 346, 851–854. [Google Scholar] [CrossRef] [PubMed]
  89. Hall, B.L. Precipitation associated with lightning-ignited wildfires in Arizona and New Mexico. Int. J. Wildland Fire 2007, 16, 242–254. [Google Scholar] [CrossRef]
  90. Nampak, H.; Love, P.; Fox-Hughes, P.; Watson, C.; Aryal, J.; Harris, R.M. Characterizing spatial and temporal variability of lightning activity associated with wildfire over Tasmania, Australia. Fire 2021, 4, 10. [Google Scholar] [CrossRef]
Figure 1. The location of the study area and the distribution of wildfire points: (a) MODIS optical image and (b) MODIS land-use types in 2020.
Forests 14 01393 g001
Figure 2. Maps of topographical conditioning factors: (a) elevation, (b) slope, (c) aspect, (d) curvature, (e) TWI, and (f) SPI.
Forests 14 01393 g002
Figure 3. Maps of surface environmental conditioning factors: (a) distance to rivers, (b) soil type, and (c) NDVI.
Forests 14 01393 g003
Figure 4. Maps of anthropological conditioning factors: (a) distance to roads and (b) distance to residential areas.
Forests 14 01393 g004
Figure 5. Maps of meteorological conditioning factors: (a) rainfall, (b) temperature, (c) wind speed, (d) potential evaporation, and (e) solar radiation.
Forests 14 01393 g005
Figure 6. Factor maps for constructing RSEI and the resulting RSEI map: (a) NDVI, (b) WET, (c) NDBSI, (d) LST, and (e) RSEI.
Forests 14 01393 g006
Figure 7. Maps of vulnerability factors: (a) female population, (b) young and old population, (c) population unable to attend high school, (d) road density, (e) GDP density, and (f) eco-environmental condition.
Forests 14 01393 g007
Figure 8. Flowchart of the wildfire susceptibility assessment.
Forests 14 01393 g008
Figure 9. Flowchart of the disaster vulnerability assessment.
Forests 14 01393 g009
Figure 10. ROC curves of wildfire susceptibility models for different land-use types.
Forests 14 01393 g010
Figure 11. Wildfire susceptibility maps for different land-use types: (a) all types, (b) forest land, (c) grassland, and (d) cultivated land.
Forests 14 01393 g011
Figure 12. Statistical results of wildfire susceptibility zoning for different land-use types: (a) all types, (b) forest land, (c) grassland, and (d) cultivated land.
Forests 14 01393 g012
Figure 13. Factors importance of wildfire susceptibility models for different land-use types: (a) forest land, (b) grassland, and (c) cultivated land.
Forests 14 01393 g013
Figure 14. Wildfire vulnerability map: (a) vulnerability value results and (b) vulnerability zoning results.
Forests 14 01393 g014
Figure 15. Wildfire risk maps for different land-use types: (a) all types, (b) forest land, (c) grassland, and (d) cultivated land.
Forests 14 01393 g015
Figure 16. Wildfire risk maps for corresponding land-use types: (a) all types, (b) forest land, (c) grassland, and (d) cultivated land.
Forests 14 01393 g016
Figure 17. Land-use-type maps in (a) 2012 and (b) 2020; wildfire susceptibility maps of (c) grassland and (d) cultivated land.
Forests 14 01393 g017
Figure 18. Land-use-type maps in (a) 2012 and (b) 2020; wildfire susceptibility maps of (c) grassland and (d) forest land.
Forests 14 01393 g018
Table 1. Information on susceptibility conditioning factors. TWI: topographic wetness index; SPI: stream power index; NDVI: normalized difference vegetation index.
CategoryFactorSource of DataFormat and Scale/Resolution
TopographicalElevationSRTM DEM30 m (.tiff)
Slope
Aspect
Curvature
TWI
SPI
Surface
environmental
NDVILandsat 8 OLI Image (2012–2022)30 m (.tiff)
Soil typeHarmonized World Soil Database (HWSD)5′ (.tiff)
Distance to riversNational Catalogue Service For Geographic Information (in Chinese)1:1,000,000 (.shp)
AnthropologicalDistance to roadsNational Catalogue Service For Geographic Information (in Chinese)1:250,000 (.shp)
Distance to residential areas
MeteorologicalRainfallERA5-Land Reanalysis Dataset
(2012–2022)
11,132 m (.tiff)
Temperature
Wind speed
Potential evaporation
Solar radiation
Table 2. Information on vulnerability factors. GDP density: gross domestic product density.
CategoryFactorSource of Data
Vulnerable populationFemale population (2020)Seventh National Population
Census Bulletin (in Chinese)
Young and old population (2020)
Population unable to attend high school (2020)
Material economyRoad density (2019)National Catalogue Service For Geographic Information (in Chinese)
GDP density (2020)Seventh National Population Census Bulletin (in Chinese)
Ecological environmentEco-environmental condition (2020)MODIS Terra image
Table 3. Parameter adjustment results.
Hyperparameter NameDefinitionAll TypesForest LandGrasslandCultivated Land
max_depthThe maximum depth of a tree.12899
num_leavesThe number of leaf nodes in the tree.903060100
colsample_bytreeThe proportion of features randomly selected when building each tree.0.80.80.80.6
n_estimatorsThe number of trees to be built, i.e., the number of iterations.400150260250
learning_rateThe weight applied to each weak classifier at each boosting round.0.070.10.070.1
min_child_samplesThe minimum number of samples required in each leaf node.2161014
Table 4. Factor scale method in the judgment matrix.
StandardsMeanings
1Two factors are of equal importance.
3One factor is slightly more important than the other.
5One factor is obviously more important than the other.
7One factor is more important than the other.
9One factor is extremely more important than the other.
2, 4, 6, 8The median values of the above two adjacent judgments.
ReciprocalThe reciprocal values of the above two adjacent judgments.
Table 5. Multicollinearity analysis results of susceptibility conditioning factors. TOL: tolerance; VIF: variance inflation factor.
FactorAll TypesForest LandGrasslandCultivated Land
TOLVIFTOLVIFTOLVIFTOLVIF
Elevation0.1596.2730.1925.2110.1775.6470.1516.625
Slope0.3313.0220.3313.0190.3442.9060.3183.142
Aspect0.9831.0170.9751.0260.9841.0160.9801.020
Curvature0.8061.2410.7321.3660.7881.2700.8211.218
TWI0.4002.4980.3362.9780.4112.4350.4062.463
SPI0.4582.1860.4462.2420.4692.1300.4382.284
Soil type0.7531.3280.6451.5500.7481.3360.7761.289
Distance to rivers0.8841.1310.8551.1700.8661.1540.8871.128
Distance to roads0.9011.1100.8381.1930.8901.1240.9131.096
Distance to residential areas0.5571.7940.6141.6270.5981.6710.5101.959
NDVI0.6351.5750.4272.3420.5661.7650.7081.413
Rainfall0.1666.0160.2124.7260.1875.3520.1476.787
Temperature0.2054.8710.2903.4530.2054.8660.2034.921
Wind speed0.5701.7550.5561.8000.6241.6020.5451.835
Potential evaporation0.2753.6340.3682.7140.3083.2490.2194.561
Solar radiation0.1825.4850.2344.2720.2034.9350.1715.865
Table 6. Predictive performance.
TypePrecisionSensitivitySpecificityF1-ScoreAccuracyKappa’C
All types0.9160.8760.9210.8960.8990.797
Forest land0.9240.9400.9240.9320.9320.864
Grassland0.9220.9130.9220.9170.9170.834
Cultivated land0.9420.9190.9430.9300.9310.862
Table 7. Weight of each vulnerability factor.
Vulnerability Factor w A H P w E W M W
Female population0.058860.095960.07513
Young and old
population
0.100580.072760.08837
Population unable to
attend high school
0.079000.058460.06999
Road density0.144980.199030.16868
GDP density0.308290.395880.34671
Eco-environmental condition0.308290.177910.25111
Table 8. Area and proportion of each risk area.
TypeRisk LevelArea (km2)Percentage of Area (%)
All typesVery low183,784.832.594
Low131,449.823.312
Moderate89,896.515.943
High79,78214.149
Very high78,955.2514.002
Forest landVery low314,87255.842
Low96,572.7517.127
Moderate66,070.2511.717
High47,173.258.366
Very high39,1806.948
GrasslandVery low240,241.342.606
Low102,877.318.245
Moderate68,229.512.100
High79,353.7514.073
Very high73,166.512.976
Cultivated landVery low241,522.342.833
Low109,51919.423
Moderate80,22814.228
High64,67111.469
Very high67,92812.047
Table 9. Statistical results of each wildfire risk area for the corresponding land-use type.
TypeRisk LevelArea (km2)Percentage of Area (%)
All typesVery low172,109.332.018
Low124,519.323.164
Moderate86,14116.025
High77,51414.420
Very high77,262.7514.373
Forest landVery low20,178.7522.428
Low19,690.7521.886
Moderate16,429.7518.261
High17,683.519.655
Very high15,988.2517.770
GrasslandVery low68,099.2528.841
Low41,13717.422
Moderate34,826.7514.749
High46,47919.684
Very high45,58119.304
Cultivated landVery low34,368.7516.675
Low45,26521.962
Moderate39,200.7519.020
High40,148.519.480
Very high47,122.7522.863
Disclaimer/Publisher’s Note: The statements, opinions and data contained in all publications are solely those of the individual author(s) and contributor(s) and not of MDPI and/or the editor(s). MDPI and/or the editor(s) disclaim responsibility for any injury to people or property resulting from any ideas, methods, instructions or products referred to in the content.

