Article

Assessment of Summer Branch Drop: A Case Study in Four Portuguese Cities

1
ISISE, ARISE, Department of Civil Engineering, University of Coimbra, 3030-788 Coimbra, Portugal
2
SERQ—Innovation and Competence Forest Centre, 6100-711 Sertã, Portugal
3
CITAB (UTAD)—Centre for the Research and Technology of Agro-Environmental and Biological Sciences, University of Trás-os-Montes and Alto Douro, 5000-801 Vila Real, Portugal
4
FEAGRI, Unicamp—School of Agricultural Engineering, University of Campinas, Campinas 13083-875, Brazil
*
Author to whom correspondence should be addressed.
Forests 2023, 14(7), 1398; https://doi.org/10.3390/f14071398
Submission received: 24 April 2023 / Revised: 20 June 2023 / Accepted: 7 July 2023 / Published: 9 July 2023
(This article belongs to the Section Urban Forestry)

Abstract

:
This paper addresses the problem of summer branch drop (SBD) in urban forests, namely through detecting the causes of this unpredictable event, aiming at preventing and increasing the control of this phenomenon, while using the most recent methodologies to detect wood deterioration, namely visual tree assessment (VTA), drilling resistance, and acoustic tomography, in an isolated and associated way. The study considers events in the cities of Arcos de Valdevez in Viana do Castelo district (Site 1), Ponte de Lima in Viana do Castelo district (Site 2), Montemor-o-Novo in Évora district (Site 3), and Paços de Ferreira in Porto district (Site 4), targeting trees of public interest. Given the phytosanitary condition recognized using nondestructive equipment, a set of measures for the preservation of the tree elements and their history are suggested. SBD is mostly related to internal degradation. A VTA diagnosis, applied in isolation, could lead to an incorrect prognosis of the internal degradation. So, it is important to confirm of the presence of biotic agents through equipment (acoustic tomography and drilling resistance). Even with instrumental diagnostics, for reducing the subjectivity of the approach to estimating the SBD, a global analysis is necessary, including dendrometric parameters, predisposing or inciting factors, lower tree defences against internal degradation due to environmental conditions, and biotic agents.

1. Introduction

Great benefits can be obtained from the presence of trees in an urban environment, namely the improvement of air quality, the thermal regulation of cities, the preservation of local biodiversity, and the contribution to the infiltration of water into the soil [1,2]. However, the maintenance of green spaces in general should not overlook the existence of potential events causing damage both in people and public and private property, particularly in urban centres.
Tree growth is determined by climate (exposure to the elements and water availability), location, species, age, and time of the year. In addition to genetic variability, there is a wide range of actions that must be differentiated, even in specimens of the same species and age, from the improvement of infrastructures to fertilization, phytosanitary treatments, pruning, surgeries, and fertility corrections [3,4].
The overall condition of the tree allows for an analysis of the interventions to be considered to improve the phytosanitary health of each specimen, as well as its viability and safety. The phytosanitary evaluation comprises the overall condition of the tree, both in quantity and quality, and the explanation of all parameters analysed from root/column, stem, and crown, among others. For that, it is necessary to determine physical and mechanical properties, besides stability and the normal and shear stresses [2,3,4,5,6], and to develop procedures for testing the presence of decay [3,7,8,9,10,11,12,13]. Overall, it is about determining tree health condition without the use of invasive tests that will harm it [13,14,15,16,17,18,19,20].
One of the visual risk assessment methods most commonly used is visual tree assessment (VTA), which provides basic information about tree growth performance and stability [21], considering failure potential, likelihood of impact, and consequences of failure [22,23,24,25,26]. It allows the identification of symptoms of fragility and signs of cubic brown rot at the crown collar and stem, and some weakness of the crown, given its overall transparency.
To better consider the phytosanitary and stability conditions of the tree, it is necessary to consider the predisposing, inciting and contributing factors that underline the spiral of decline model proposed by Manion [27].
Predisposing factors are intrinsic to the site or the tree and can influence the condition of the tree in the medium or long term, for example, urban environment, soil compaction, and lack of light. Inciting factors are those that refer to abiotic or man-made episodes, for example, severe pruning, root cutting and air pollution. Contributing factors are those that contribute to accelerating the decline of the phytosanitary condition of the tree, such as deterioration by biological agents. These factors contribute to accelerating decline and, in most cases, result from multiple causes, for example, Armillaria mellea and Ganoderma lucidum [27,28,29].
Tree inspection is conducted through employing either a combination or independent utilization of nondestructive methods, which include visual assessment, drilling techniques, acoustic methods, tomography, and ground-penetrating radar [30].
Relying solely on visual assessment is inadequate since it does not always enable us to accurately determine the health conditions of trees. To supplement these findings, additional analyses are necessary. Instrumental analysis plays a crucial role in minimizing variability and enhancing the current understanding of tree risk assessments. In this regard, various technological tools are available to aid tree inspection [31], providing parameters for calculating the risk of tree fall [32,33,34].
These nondestructive techniques are used to determine wood’s physical and mechanical properties [35] and presence of decay [36], which is the focus of this paper.
Acoustic techniques (stress wave and ultrasound) and drilling resistance stand out due to low cost and portability. With the technology bases of acoustic techniques already consolidated, studies aiming at tree inspections target improvement and evolution including equipment, probes, algorithms, and system optimization, contributing to a better understanding of elastic wave propagation and application of anisotropy correction factors [37,38,39,40,41].
Acoustic tomography detects the presence of anomalies or deterioration using characteristic parameters of the wave (propagation time, amplitude, or spectrum frequency) [37]. Wave propagation is affected by materials with different acoustic impedance and therefore different velocities [37,42].
In solids with cavities, the velocity of wave propagation decreases. The deviations occur because mechanical waves seek out a material medium to propagate [43]. The principle of operation considers the velocity of wave propagation in a solid body. The velocity will be greater the higher the material homogeneity, that is, stress waves are slower in deteriorated wood than in solid wood. Wood mechanical and acoustic properties are influenced by changes in the wood structure [37], such as the tree age, sanity condition, and height of the stem [44,45], or defects caused by irregularities of different natural growth patterns (grain deviation, knots, pockets, resin, etc.), generating differences in material and consequent variation in wave propagation velocity and the amplitude of the emitted signal.
The output of the sonic or ultrasonic tomography will be images, which represent the velocity ranges obtained inside the material [36,46]. Earlier difficulties were found regarding ultrasound tomography, which led to the use of stress waves in the first proposals for generating tomography from wave propagation measurements. In fact, the control of the frequency used enables one to adjust the frequency to the material and therefore obtain better results [47,48,49]. For example, in the case of large trees, the propagation of the wave throughout the wood suffers a decrease, and so using low-power ultrasound equipment in these cases will not work properly.
The images resulting from analysis via acoustic technologies (stress wave or ultrasound) are created combining colours with velocity bands. It is possible to detect variations in tissue characteristics (biodeterioration due to fungal attacks) with consequent variations in stiffness and strength, and also with variations in the wave path caused by the presence of cracks or cavities. When it comes to wood, the fact that it is an orthotropic material (three perpendicular directions in which the properties are different) results in a special difficulty for the interpretation of tomography results; hence, it is not adequate to use a reference velocity [48,49], as is normally used in homogeneous and isotropic materials. So, for wood, the more effective method is to use, as a reference, the maximum velocity obtained in the inspected material itself.
There has been considerable research on improving techniques that can detect and locate internal defects on woods using images obtained from tomography, and that can measure the accuracy of the acoustic tomograph [39,48,50,51,52]. The results obtained with acoustic tomography must be interpreted taking into account the following inputs: the ones used during the measurement (type of mesh and number of measurement points), the construction of images (software, interpolation algorithms), and the reference velocity to identify areas inside the stem (sound and deteriorated wood as well as cavities) [53]. In the end, it is essential to be able to recognise patterns, both the interference generated by the simplified interpolation method used by the software and the recognition of areas effectively affected by different types of deterioration.
For better certainty of observations, the tomographic images should be complemented with measurements of drilling resistance, as it allows for a higher resolution along the reading line and confirms the biodeterioration processes or cavities observed in sonic tomography [54,55]. Wood drilling resistance has been used since 1988 [56], targeting the identification of deteriorated areas in wooden structures, logs, or trees [9,10,54,57,58,59]. Measurements are made along the penetration of a drill, with constant rotation and translation movement. Furthermore, the digital wood inspection drill, when applied together with VTA and tomography, contributes to a more accurate assessment of biodeterioration processes [10]. Notice that the isolated use of this technique is only reliable in advanced stages of decay [60]. For this technology, the drill needs to be very thin (approximately 5 mm in diameter) in order to capture variations in the material’s drilling resistance without causing damage to the material and simultaneously avoiding resonance effect [61]. During the drilling process, the feed force and the feed rate can be measured continuously as a function of the position of the drill bit in its path. As the drill moves through the wood in a linear path, the penetration resistance along its path is measured and recorded. The pattern of change in relative resistance is recorded in an amplitude graphic through digital representation.
Summer branch drop (SBD) may be the result of an internal weakening of the branch and stress factors triggering the break. The initial weakening may result from winter storm damage or snow accumulation producing internal cracks and stresses.
SBD is commonly associated with calm weather conditions following a heavy rain shower which terminates a period of increasing soil dryness. The trigger may be water stress; this is known to cause cracks in conifer stems and may be responsible for producing an analogous condition in broadleaved trees. During the early summer, the weight of fresh foliage and new shoots, combined with the weight of developing fruits, may be increased so much by surface water following a rain shower that a turning moment develops, resulting in branch fracture. Alternatively, incipient decay may also reduce the strength of the wood and could account for the short fracture sometimes recorded. In other words, SBD refers to the occurrence of mature branches failing during the summer season. This phenomenon is unpredictable, making it a challenge for scientists to identify its underlying causes. This occurrence can be surprising and concerning, as branches may fall unexpectedly, posing a risk to people and property beneath the trees.
Considering the technologies available for the inspection of urban trees, this paper focuses on the assessment of SBD in urban forests, namely on detecting the causes and analysing the SBD of wood within the separation that has happened, using case studies of events that occurred in four Portuguese cities.

2. Materials and Methods
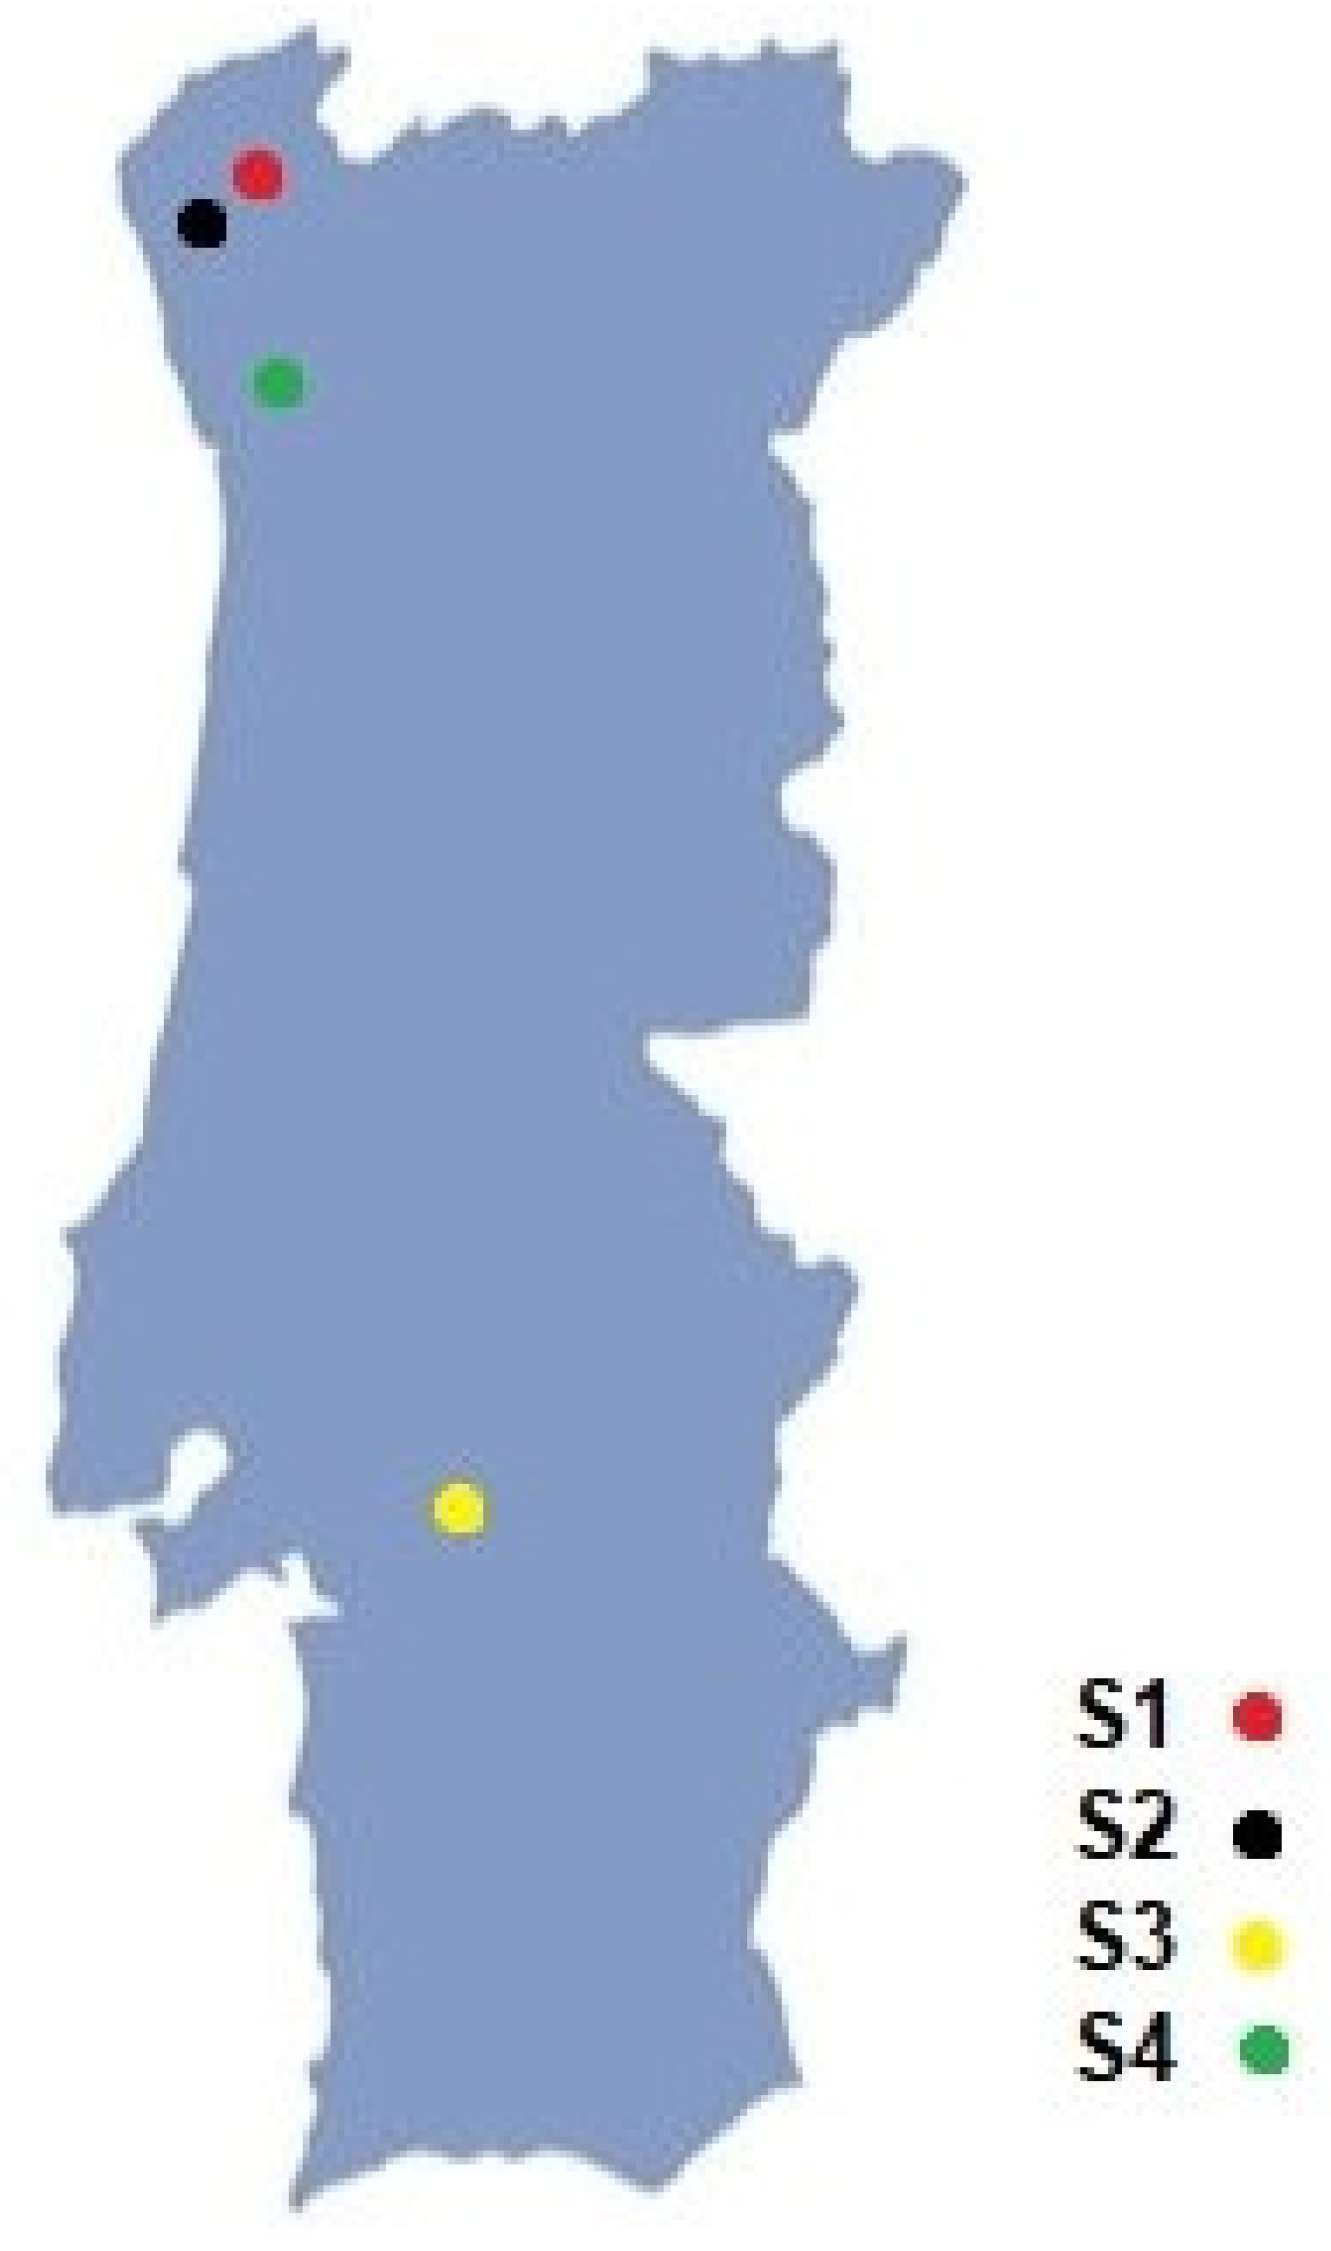
2.1. Study Site

This paper refers to a case study of four Portuguese cities (Figure 1), corresponding to four sites. Site 1 (S1) is in Parque da Ínsua, in the city of Arcos de Valdevez, in Viana do Castelo district. Site 2 (S2) is in Palacete Villa Morais and Platanus Avenue, in the city of Ponte de Lima, in Viana do Castelo district. Site 3 (S3) is in Mercado Municipal of the city of Montemor-o-Novo, in Évora district. Site 4 (S4) is in the Praça Dr. Luís Garden, in the city of Paços de Ferreira, in Porto district.
The diagnosis was performed considering dendrometric and phytosanitary parameters. Dendrometric equipment and the VTA (visual tree assessment) method were used, as described in Section 2.2 and Section 2.3. To estimate the failure condition where the area and severity of the injury was higher, diagnostic aids were used, with the methodology presented in Section 2.4. This analysis aims to incorporate data regarding the quantification of deterioration. In Section 2.5, the laboratory analysis methodology used in S4 are presented. The analyses aim to approach the association of biology and engineering knowledge.
For all sites, we addressed the dendrometric measurements and VTA analyses. In S1, only VTA was addressed to verify if only VTA analysis is enough or if it is necessary to use instrumental diagnostics to improve the identification of the dimension and severity of internal lesions and decrease the uncertainly of the probability of fracture from SBD. In S2, S3, and S4, instrumental analysis was addressed. In S1 and S2, the risk matrix was addressed. In S3 and S4, the risk matrix was not generated because the analysis was performed after SBD.

2.2. Dendrometry

The dendrometric parameters measured were the diameter of breast height (DBH), perimeter of breast height (PBH), height of the tree (H), height of the base of the crown (HBC), and average crown diameter (ACD). For H, HBC, and ACD measurements, an electronic hypsometer (Vertex IV, Haglöf, Sweden) was used with 1-decimetre precision.
For measuring the average crown diameter (ACD), the vertical projection of the end of the branches was estimated visually, measuring to the other end. Height of the base of the crown (HBC) refers to the average height of the first living branches and twigs, which are often at a height lower than the insertion of the first branches.
To obtain the exact geographical coordinates (latitude and longitude), a new generation Global Navigation Satellite Systems (GNSS) receiver was used (Spectra Geospatial SP60, Trimble Inc., USA), with simultaneous signal reception from satellites in the US constellation (NAVSTAR GPS), Russia (Glonass), Europe (Galieleu), China (BeiDou) (SBAS-EGNOS), and the SERVIR network, programmed to the global geographic datum in WGS84 (World Geodetical System, 1984). Please state the name of the manufacturer, city, and country from where the equipment was sourced.
In field work, the tree was identified on the stem with a temporary tag, recording the sector and specimen number. This numbering allows a more precise identification of the trees in the field during the different evaluation work or the implementation of the proposed interventions. All these data were inserted in the IDTREE application, Ref. [62] a valuable resource in field work of urban forestry studies. This application creates a database concerning tree health assessment, related to diagnoses and interventions, making it accessible in real time to all involved in the management of green spaces, and consequently substantially reducing the time spent in field work. In other words, the application creates a history for each tree and allows greater agility in the management of the interventions to be carried out; that is, it contributes to the best systematization of data, facilitating their editing process during field work and their further analysis. It also implies the improvement of the management of arboreal heritage in urban environments. The IDTREE application is created from the Appsheet platform. It allows information on tree assessments to be entered and updated in an alphanumeric database, in this case, a Google Drive spreadsheet [63].

2.3. Visual Analysis
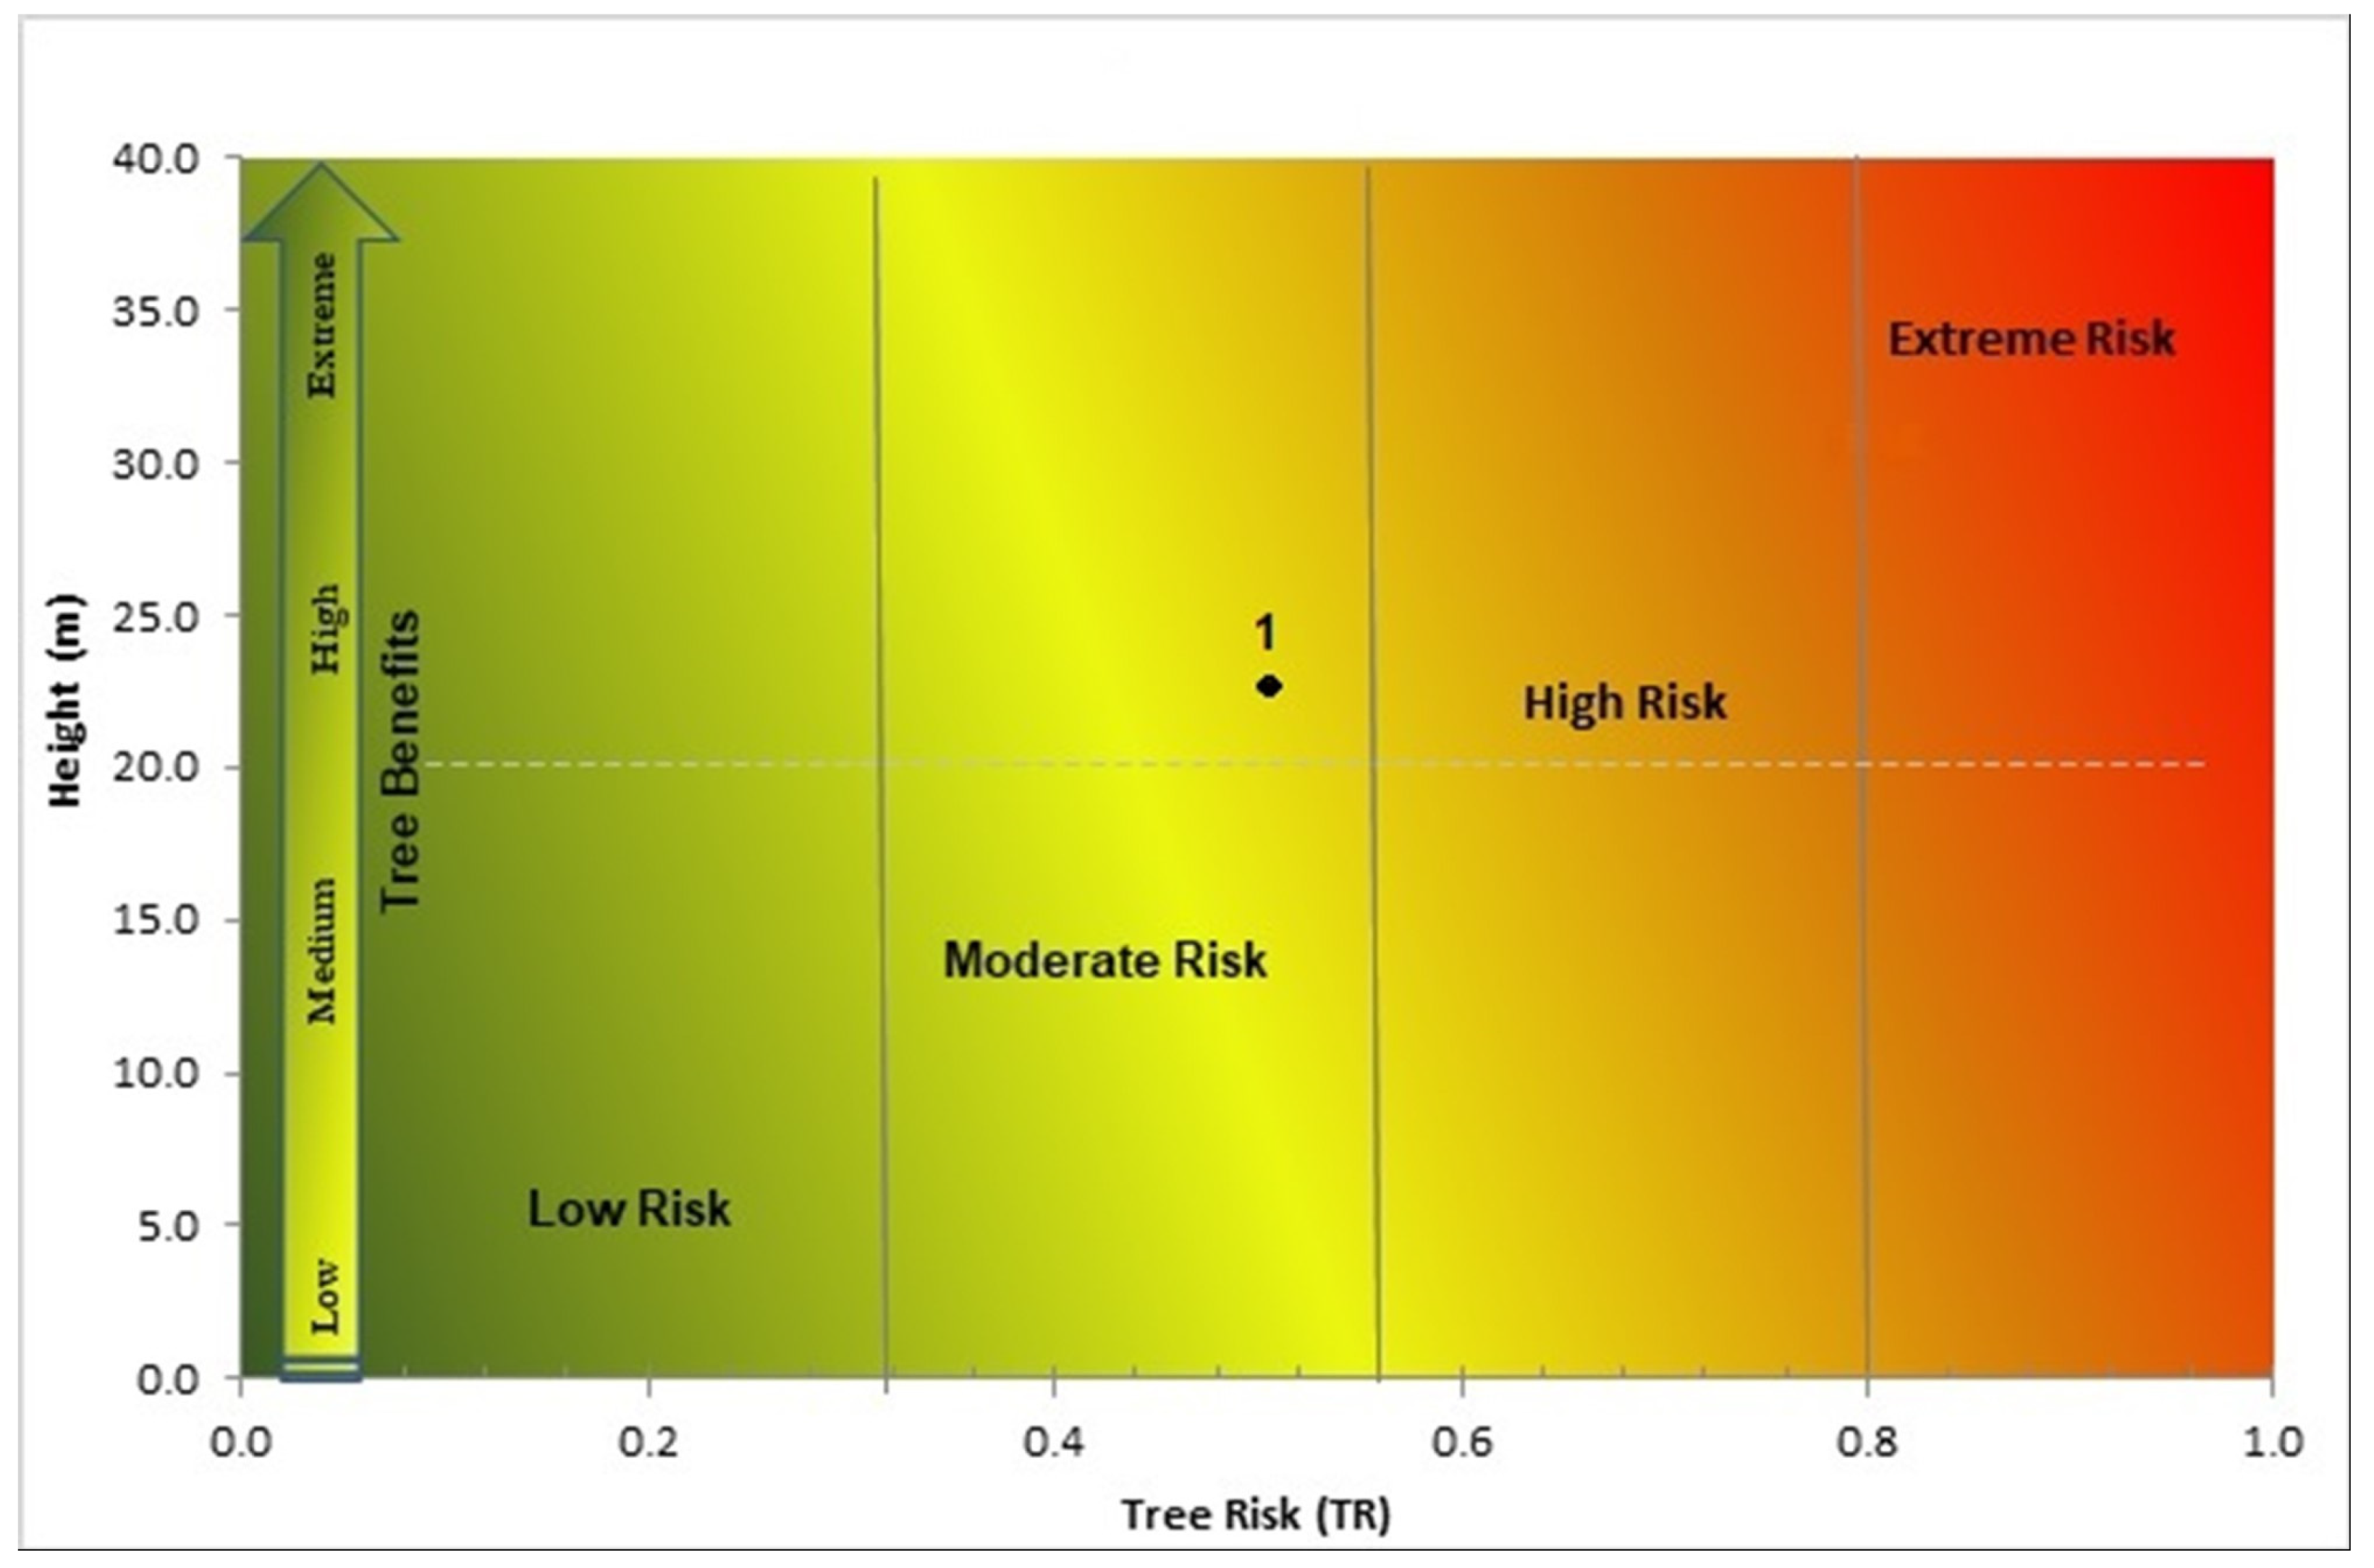
Visual tree assessment analysis (VTA) provides basic information about tree growth performance and stability, considering the failure potential, likelihood of impact, and consequences of failure [62]. This method is based on the axiom of constant tension, i.e., the fact that trees grow while maintaining uniform tension throughout their structure [64]. When this model is altered by a situation of decay, biotic or abiotic aggression, the tree tends to re-establish balance with a deposition of reparative material [36].
To better assess the phytosanitary and stability conditions of the tree, a number of predisposing, inciting and contributing factors were considered, as displayed in Table 1 [27].
Table 2 displays the indicative signs or symptoms related to visual analysis that were considered.

2.4. Risk Matrix

The risk scale combines colours relating to the tree risk with the tree’s contributions to the urban benefits. Tree risk relates to the probability of damage or health problems occurring in the event of falling branches or tipping of the tree.
The green colour represents low risk, light yellow represents moderate risk, dark yellow represents high risk, and ultimately, red represents an extreme level of risk.
For the tree risk, the following variables were considered:
(a)
Tree height (0–40 m; 25% weighting);
(b)
Probable target relative to the occupation of the space (1–5; 20% weighting);
(c)
Visual analysis (0–20; 25% weighting);
(d)
Probability of fracture (0–1; 30% weighting).
For the tree’s contribution to the urban ecosystem, the tree height was considered.

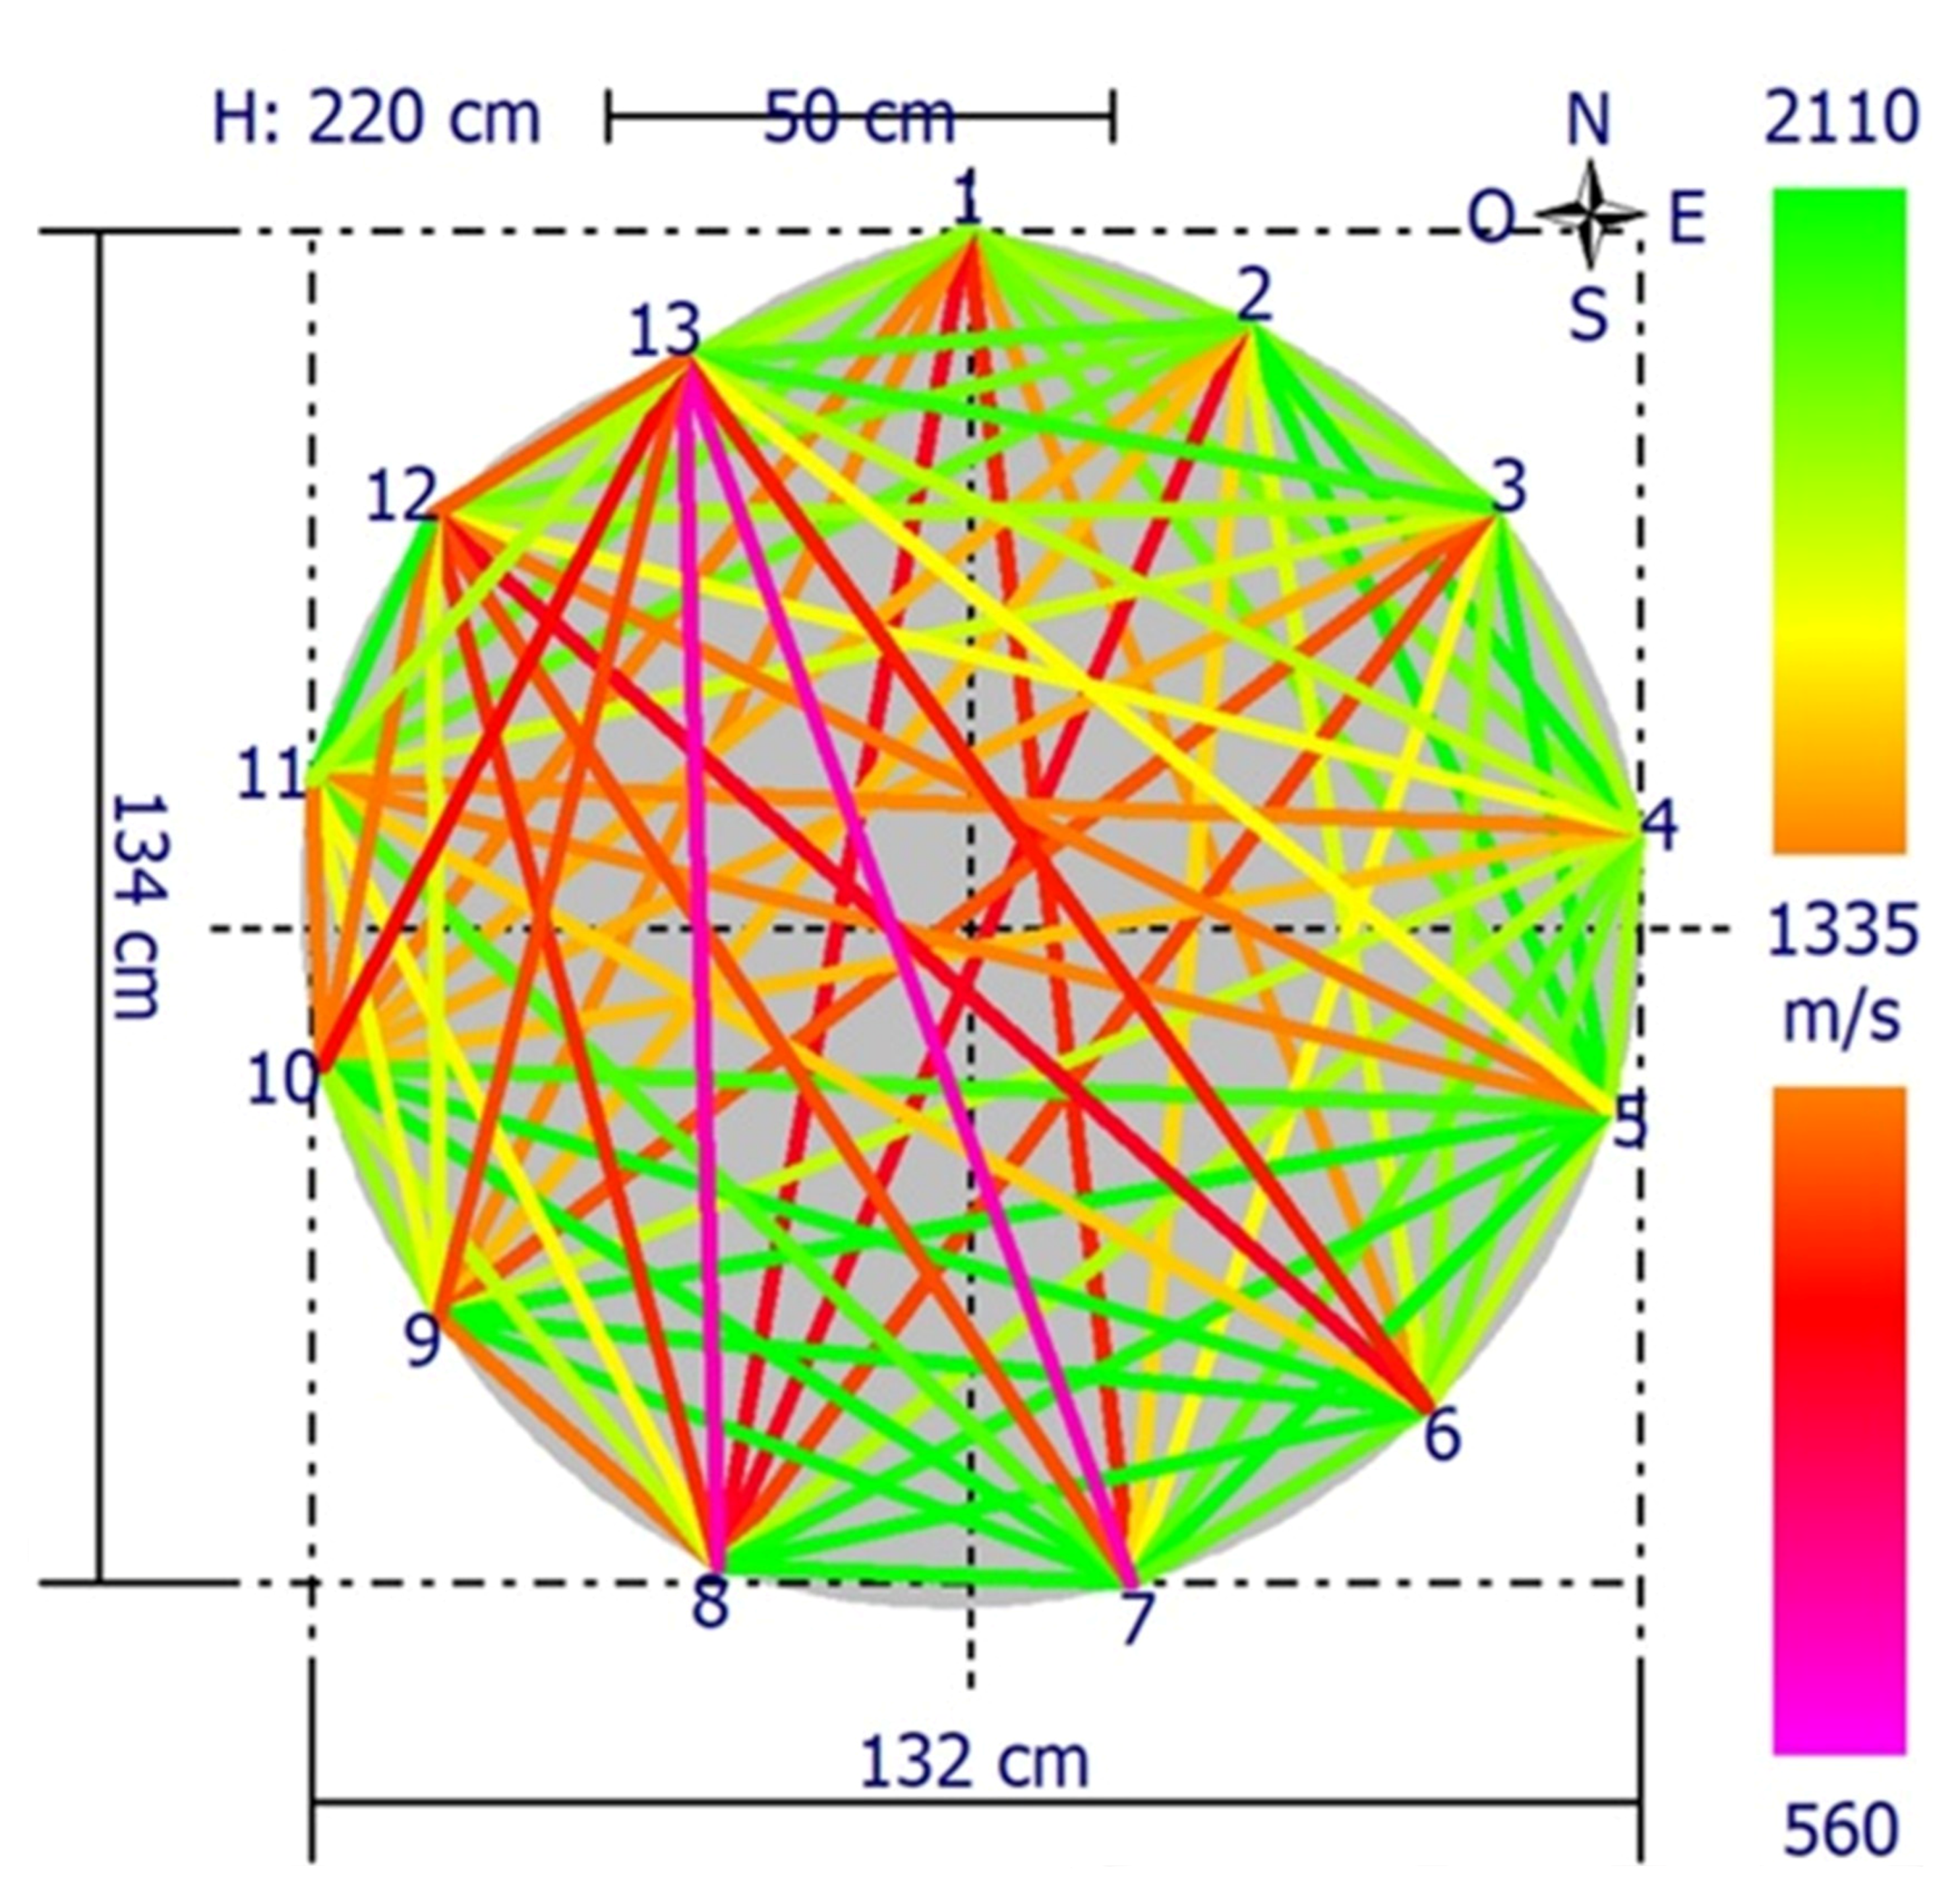
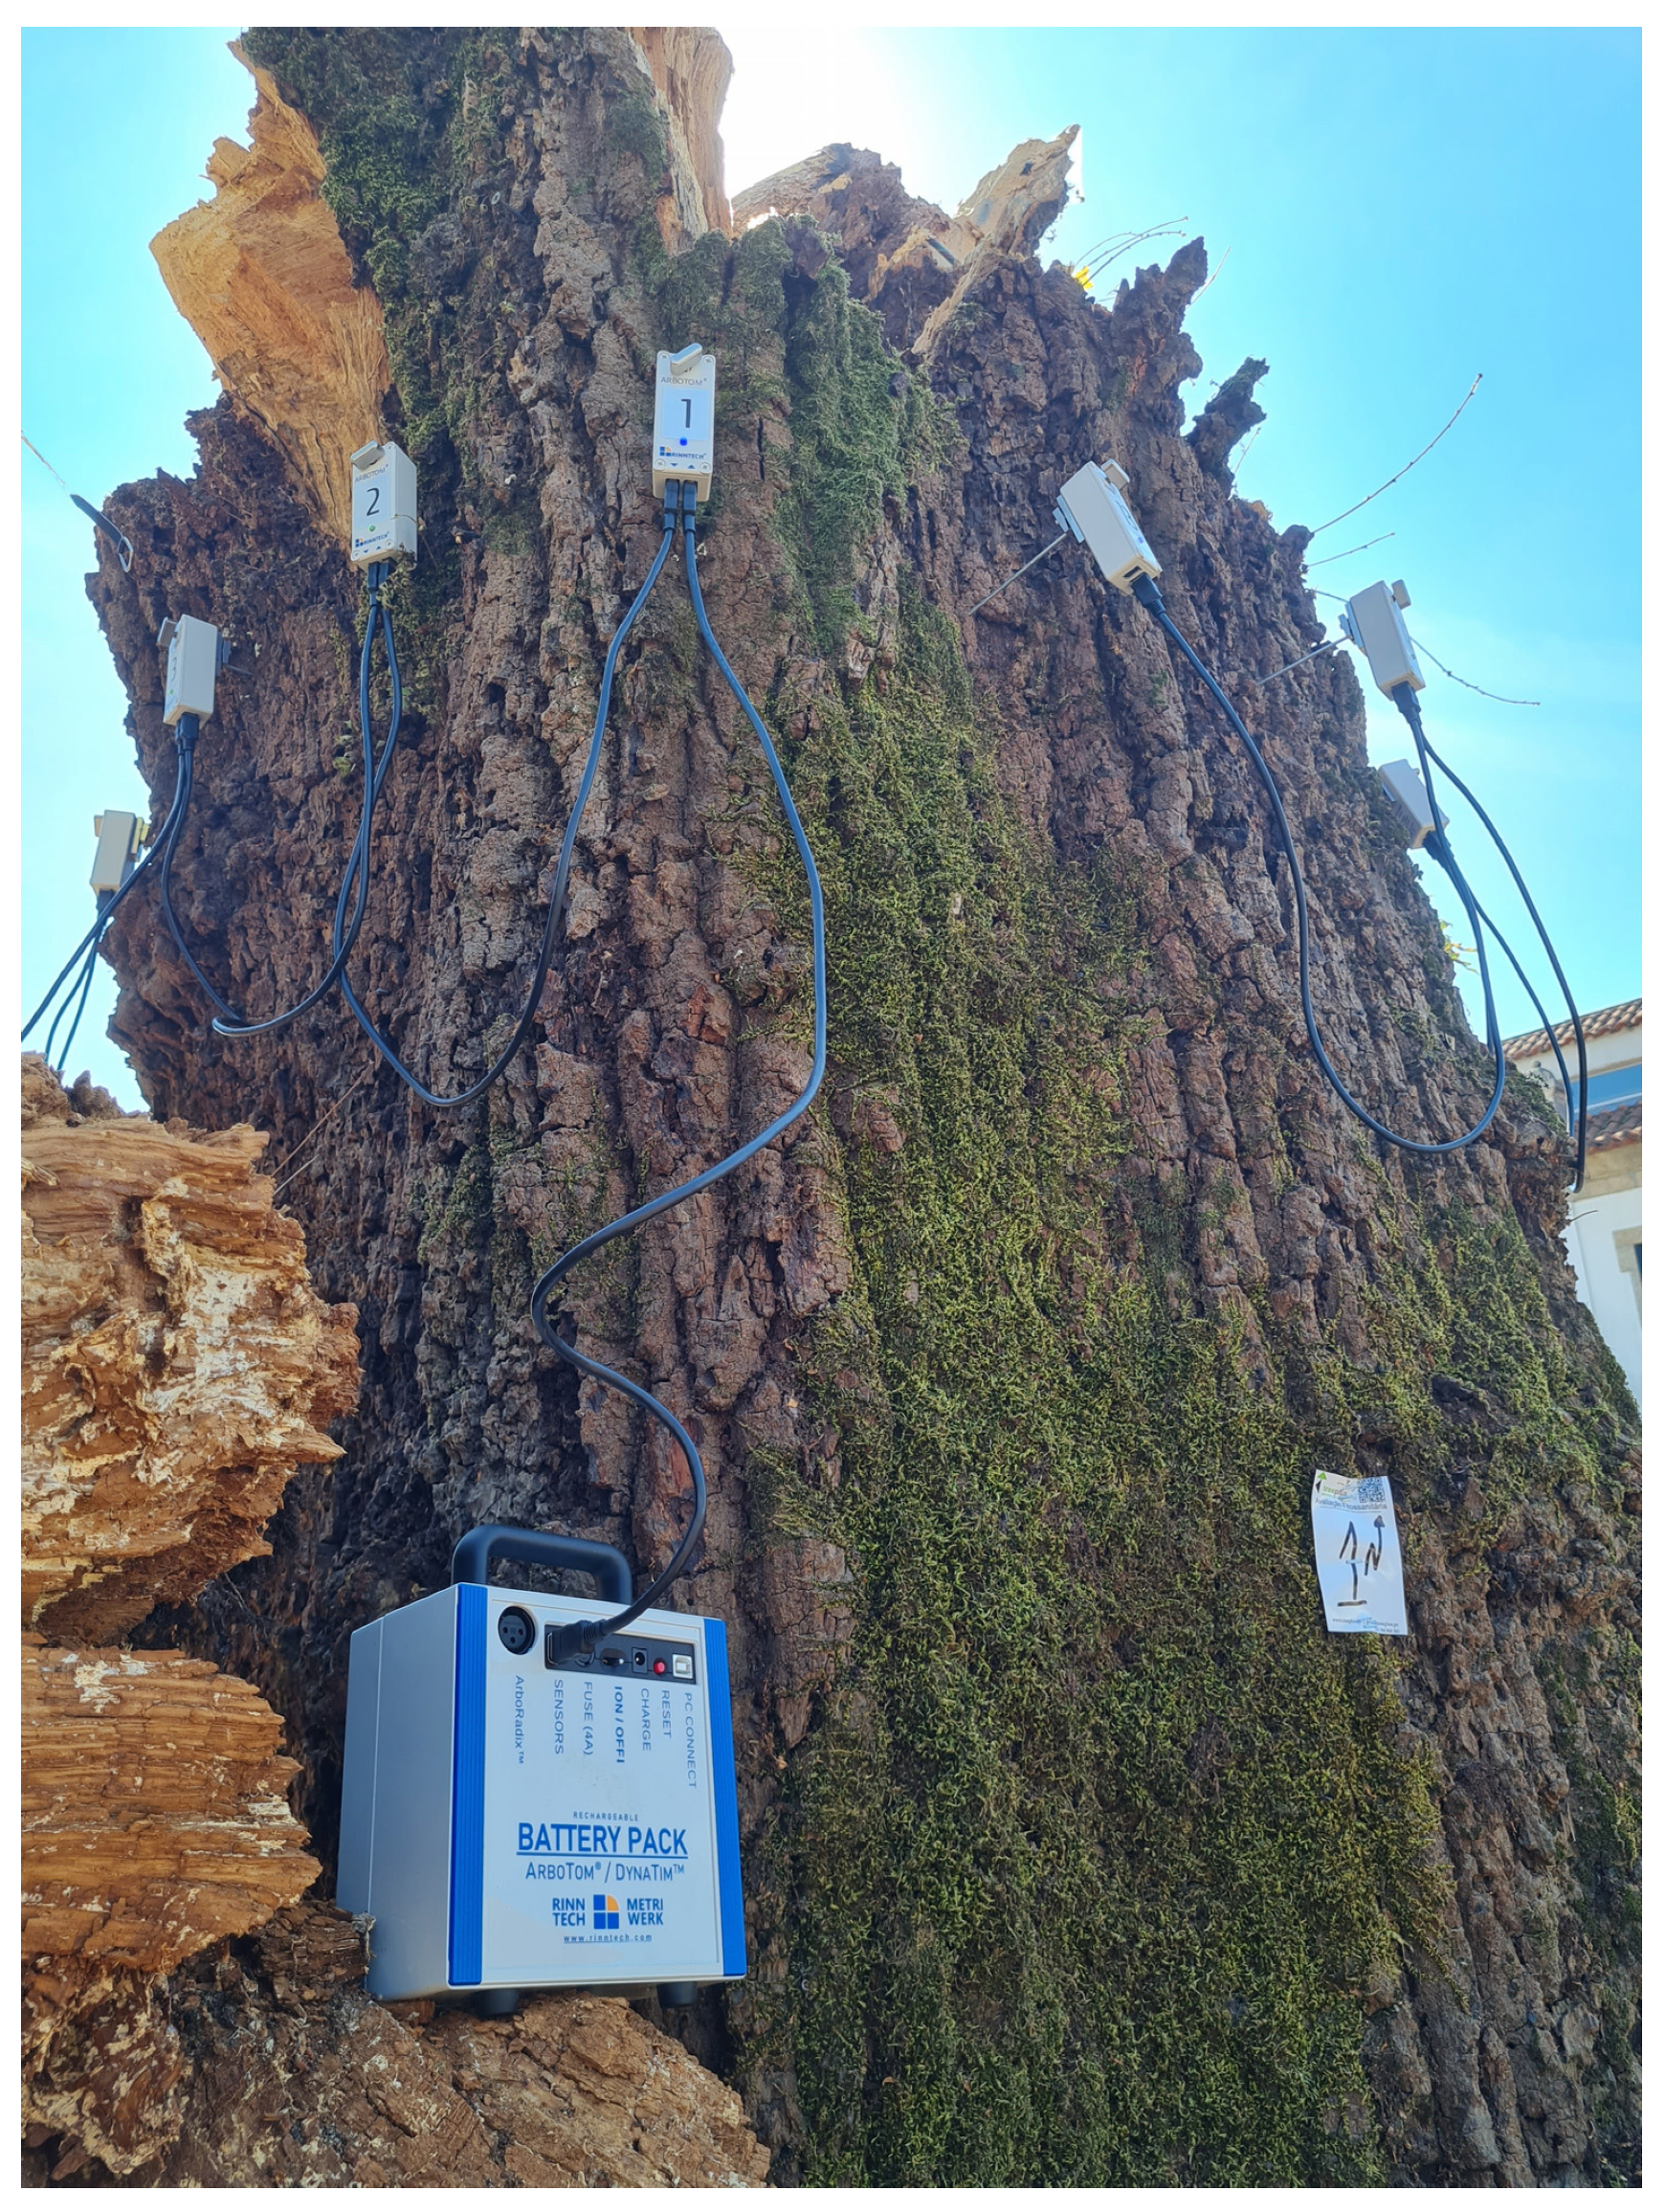
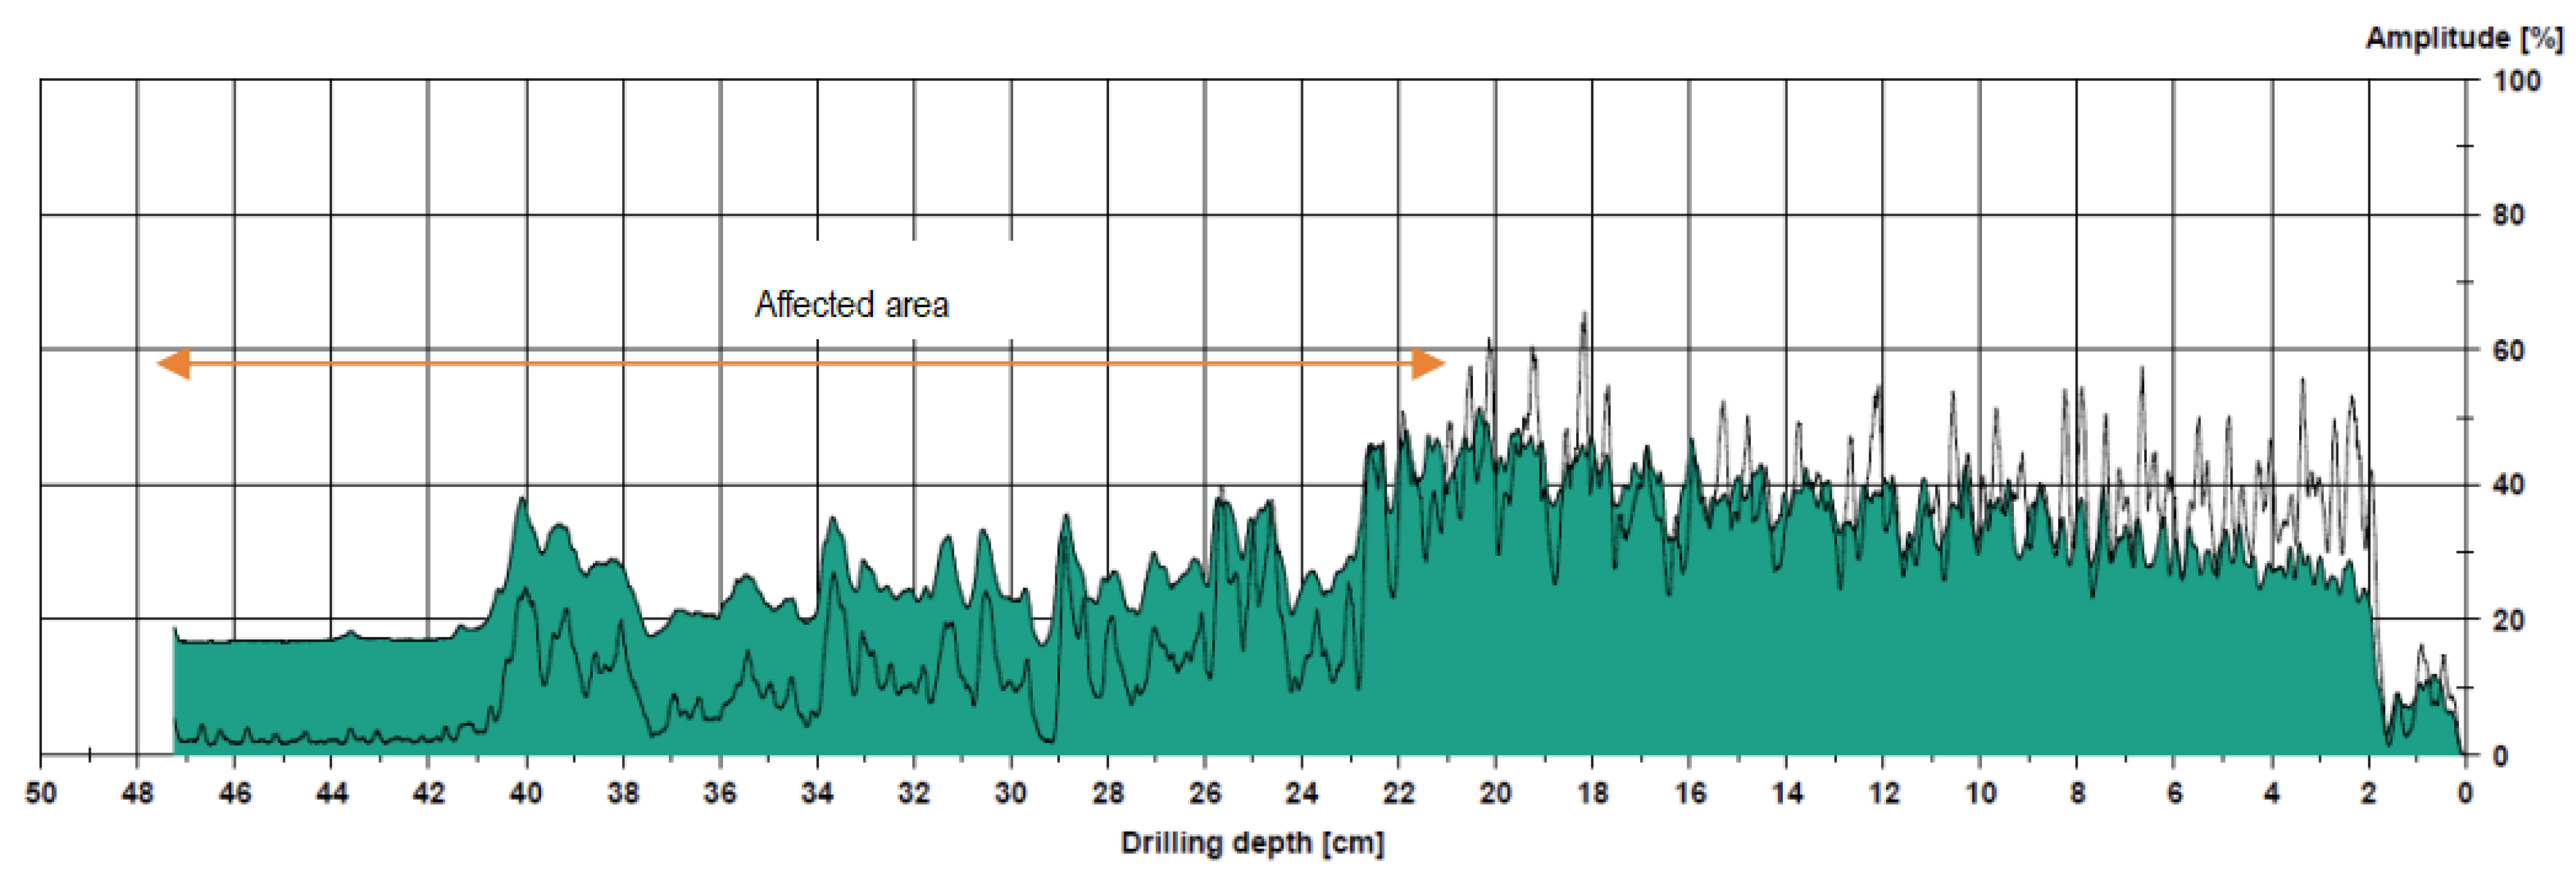
2.5. Instrumental Analysis

In the instrumental analysis, the Arbotom (Rinntech Arbotom Tomograph) and Resistograph (Rinntech MHL 50) were used. These instruments represent the techniques of acoustic tomography and drilling resistance.
For tomography, the arrangement of the 13 sensors was used in a radial direction to ensure a good diffraction mesh (Figure 2).
The assessment was performed on the stem at a height of 2.20 m with the reception and emission of the sound waves around the stem (Figure 3).
Mechanical behaviour is obtained through the Arbotom equipment and indicates the evaluation and visual presentation of strength for any cross-sectional geometry. It is possible to verify the failure moment for all wind directions. All the deteriorated areas and the different tensile and compressive strengths of the wood were considered.
For drilling resistance, several measurements were taken with the resistograph, both on the stem and on the branches, in the failure area. This test allows us to obtain a graphic of drilling resistance amplitude versus drilling depth, used to visualize and measure drops in amplitude, which is representative of decreases in drilling resistance in the section traversed by the needle.

2.6. Laboratory Analysis

Laboratory analysis was carried out to identify the fungi involved in wood degradation. The plant material received in the laboratory was cut into 3 mm pieces and laboratory analysis was performed with the following analytical methods:
Surface disinfection in 70% alcohol;
Immersion of the plant material in sterile distilled water;
Inoculation of the plant material in PDA (potato dextrose agar) medium;
Incubation of Petri dishes at 30 °C for 36 h;
Periodic observation and transfer of colonies morphologically resembling typical Ganoderma lucidum colonies from PDA to SNA (Spezieller-Nährstoffarmer agar) medium;
Incubation at 30 °C;
Microscopic observation and evaluation of morphological characteristics;
Periodic observations of fungal colonies with identification based on reproduction structures.
The primary objective of the laboratory analysis is to uncover a potential biotic agent that may have gone unnoticed during visual assessment. Once successfully identified, it becomes imperative to ascertain whether this biotic agent possesses the capability to degrade lignin. Such a metabolic ability significantly impacts the structural integrity of wood; for this reason, morphologically similar colonies were transferred from PDA to SNA medium. This approach combines biology knowledge (biotic agents) and engineering knowledge (structural stability).

3. Data Analysis and Results

3.1. Dendrometry

The trees that were subject to analysis had a height varying around 11 to 31 m and DBH around 60 to 150 cm (Table 3), and so it was very important to carry out tree risk assessment.

3.2. Assessment of SBD in Site 1—Arcos de Valdevez

The first diagnosis was made in May 2022. The evaluation was conducted utilizing a lifting platform to provide a comprehensive assessment of the branches. This approach was chosen to better examine the condition of the branches, especially considering factors such as codominance, an unbalanced crown, and the overall height of the specimen. The use of a lifting platform facilitated a more thorough and accurate evaluation of the tree’s branches.
During the diagnosis, large branches were observed but without decay symptoms. Furthermore, no lesions were observed on branch insertion. In August 2022, a big branch collapsed and a few symptoms of decay on insertion were observed. The collapse was also induced by the weight and length of the branch (Figure 4).
Another case study in S1 was a Populus nigra. This specimen had several serious problems in all organs. The crown had dieback symptoms, with dry branches (Figure 5). The predisposing factor for this tree was the age.
Cavities were observed in the stem and the presence of the biotic agent Ganoderma sp. was detected on a large scale (Figure 6).
The degeneration of woody tissues in this specimen is extensive, not only of tissues responsible for structural strength (xylem), but also of tissues that allow the flow of water and nutrients (phloem) between all organs of the tree, leading to a bad overall quantitative condition, and it is recommended to replace it with another tree. To detect a potential SBD, it is important to look for signs of stress, such as dieback, cracks, splits, or decay.
Figure 7 shows the risk matrix. The evaluated tree is inserted in the range of high risk to people and property. This result was due to its height, its poor phytosanitary situation with problems in all its organs, and the presence of biotic agents. All symptoms indicate an SBD specimen, and a pathology at high temperatures represents a reason for SBD.

3.3. Assessment of SBD in Site 2—Ponte de Lima

The first diagnosis was made in May 2022. During the diagnosis, a large branch infected with white degradation was observed at the insertion. The dimensions of the lesion were evaluated with drilling resistance and the reduction of the branch was advised. In August 2022, the branch collapsed due to rapid wood degradation. The velocity of degradation by Ganoderma lucidum may be related to the very hot and dry period of that month and represents a reason for SBD. (Figure 8).
Another case study in S2 was a Fagus sylvatica. The specimen had dry and codominant branches. In the stem, cavities were observed (Figure 9). Regarding predisposing factors, age was the main attribute for the evaluated specimen.
In addition to the noted phytosanitary concerns (Table 4), the reasonable overall qualitative condition of the area was influenced by the presence of the biotic agent Ganoderma sp. (Figure 10). The selected numerical condition for analysis is 10, which falls within a range of values from 0 to 20 (Table 5). This specific condition was chosen due to the presence of cavities and biotic agents in the stem (Table 4 and Table 5).
Measurements of drilling resistance in the stem (h: 1.30 m) at the degeneration area, which was detected visually, shows a drop in drilling resistance amplitude (Figure 11).
However, the branches have natural joints increasing the stability of the tree. It is recommended to drain the water out and remove the cable attached to the other tree. Additionally, it is also recommended to install a metallic structure inside the stem that contributes to the anchorage of this specimen.
The risk matrix (Figure 12) shows where this specimen falls within the range of moderate risk to people and property.

3.4. Assessment of SBD in Site 3—Montemor-o-Novo

In August 2022, a branch in a Ulmus carpinifolia collapsed due to brown decay, and the event also represents a reason for SBD. This degradation originated after the branch was cut four years ago, but it was difficult to predict from the ground. The speed of degradation may be related to the very hot and dry period of that month (Figure 13).
Another case study in S3 was a Tilia cordata. The specimen had a cavity and degeneration of xylem tissue (Figure 14).
The white and brown cubic rot originated from the cutting of a branch. The cavity boundaries are well compartmentalized by barrier 4 [65,66]. Even so, the loss of structural strength approached 50% (Figure 15).
The proposed intervention for this specimen would be a safety pruning due to the fragility of the wood in the root collar area. It is recommended to remove any degraded tissue present in the root collar area, as well as in the stem and branch cavities. To effectively remove dead tissues, it is essential to remove the accumulated water within the cavities. This stagnant water promotes the growth of ants and fungi, which accelerate the degradation of the wood.

3.5. Assessment of SBD in Site 4—Paços de Ferreira

Regarding phytosanitary aspects, an analysis of images taken prior to the branch fall did not reveal any indications of crown fragility. The branches and leaves appeared dense, without any signs of dieback or the presence of dry branches.
In the case of this study, recent ground cover can be considered an important inducing factor.
With a simple test, pouring out a bucket of water, one can see almost complete runoff and thus very little infiltration. The difficulty of gas exchange is manifested by the presence of fine roots developing in the last layer of soil, because that is where some air diffusion will occur. (Figure 16).
Among the predisposing factors, one can consider relatively old soil compaction or sealing, injuries (biotic or abiotic), lack of light (shading), excessive pruning, exigent gutters, prevailing winds, and advanced age. For this specimen, advanced age can be considered the main factor influencing the loss of resilience.
The branch failure occurred after a very dry and hot summer. In view of this, it is possible to observe some relevant points, such as the fact that the sudden failure of the branches is not related to the incidence of critical winds, since they often occur in the afternoon, on hot days and with low wind velocity. In Figure 17, on the day of the failure, wind velocities were low, and the summer of 2022 was extraordinarily dry.
It was also possible to verify that failure generally occurs between 0.9 m and 3.6 m away from the stem. In addition, as the first branch collapses, it is likely that other branches will fail in a short period of time, if they are interconnected, for reasons of structural stability [36].
A laboratory analysis was performed after taking tissue samples near the failure zone. The analysis comprises macroscopic and microscopic observation.
The samples presented colonies and structures like the species Ganoderma lucidum in macroscopic observation, which presents yellow exudation, a characteristic of this species (as well as in the species Ganoderma resinaceum) (Figure 18).
In cultures in SNA medium (poor in nutrients), no structures/characteristics were observed that could validate the results obtained in the PDA culture medium. The results obtained from microscopic observation in the PDA culture are in Figure 19.
After laboratory analyses, structures corresponding to the genus Ganoderma were identified. Colonies of this genus are white, dense, and with texture similar to cotton. The basidiomycete Ganoderma lucidum causes white rot; that is, it degrades mainly lignin. This type of degradation is internal and substantially affects the structural component of the wood. It is a silent degradation for which there may be few symptoms in the crown.
In the case under study, no signs were observed on the outside of the wood. These are manifested by the presence of mushrooms (carpophores) that have the role of disseminating spores of a sexual nature. Moreover, in several fungi that cause white rot, as in the case under study, the mushroom has the important role of contributing to gas exchange with the mycelium inside the tree. This contributes to the improvement of the degradation capacity of the wood.
Brown cubic rot was also observed in the branches of the tree under study, especially in the heartwood area. This means that the biodegradation process was already some years old (Figure 20).
Acoustic tomography shows that the inner area of the wood, at the point of failure, is quite affected (Figure 21). The branches of the oak under study were inserted in the same point at a height of 2.20–2.60 m and were also interconnected. The low velocities (red zones) in tomography image (Figure 21) allow us to infer that the loss of strength of the affected tissue led to the failure of the first branch, and due to the consequent imbalance, failures of the following branches occurred.
The structural stability of the tree is not only affected by the quality of the wood, but also by its geometric shape. Compared to a circular cross-section shape, an elliptical cross-section can withstand different loads depending on the direction of the force. This effect is described as a “failure moment” and varies depending on the shape of the structure and the direction of the load.
A significant failure moment indicates that a tree possesses a high capacity to withstand external loads and strong winds. However, internal decay naturally diminishes the cross-sectional area of the tree stem, consequently reducing the failure moment. The authors of [67] conducted a study examining the impact of reducing the area moment of inertia through cross-sectional reduction. Through employing the stress equation, ref.[67] observed that the moment of inertia, rather than the rupture moment, is the variable dependent on the section. This means that reducing the section, for example, due to the presence of a cavity, leads to an increase in stress even when the force remains constant. This paper delves into this issue in a more theoretical manner.
In the graph of mechanical behaviour (Figure 22), the green line corresponds to the failure moment without considering deterioration, and the red line already considers the deterioration and other existing defects, so it is possible to verify that internal deterioration is the main factor responsible of the loss of mechanical strength.
The graphic of drilling resistance (amplitude) produced by the resistograph indicates that the stem exhibits a solid structure and does not display any symptoms associated with fragility. No points of wood weakness or fragility are detected (Figure 23).
On the other hand, in the readings taken on the branches, at the point of failure, a substantial loss of wood drilling resistance (amplitude) is observed (Figure 24 and Figure 25). As observed in the laboratory, the branch was attacked by brown cubic rot. The graphs (Figure 24 and Figure 25) also confirm the results of tomography (Figure 21).
It is important to emphasize that while watering is essential for maintaining the health of most ornamental trees in hot summer climates, it can also promote the growth of biotic agents in the root system. These biotic agents have the potential to negatively impact the structural stability of the tree.
The initial failure can be attributed to a combination of factors, such as: hormonal components, biophysical components, and biotic components. In terms of hormonal aspects, it has been observed that water stress, particularly during hot afternoons, leads to a reduction in water flow and an increase in temperature within the stem and branches [68,69]. High temperatures create favourable conditions for wood fungi, increasing the potential for degradation. Additionally, high temperatures combined with high humidity can result in increased water pressure within the branches, leading to structural weaknesses and eventual branch failure. Simultaneously, there is an increase in the concentration of ethylene in the tissues. High levels of ethylene can weaken the cementation of cell walls. This weakening is related to reduced transpiration, increased root pressure, and internal depression in the xylem vessels. Internal depression usually leads to an increase in the weight of the tree at the end of the day, due to water replenishment. This increase in weight further enhances the likelihood of failure [68,69,70,71,72,73].
Regarding the biophysical aspects, it is significant to highlight that even with maximum stomatal closure, there is still some water loss, responsible for generating marked negative pressure in the vessels. With the opening of the stomas at the end of the day, it will accelerate the upward flow of water and also the increase in weight of the branches [70].
In addition, an important factor responsible for the structural fragility of the tree element is the presence of the biotic agent Ganoderma lucidum (Curtis) P. Karst.
As seen in this discussion, branches that drop are frequently long and drawn out, at least 10 cm in diameter, and they usually extend to or beyond the edge of the crown of the tree. Frequently, but not invariably, the break occurs some distance from a fork. The wood at the point of fracture may appear sound, but for part of the branch diameter, the break is often short, that is, at right angles to the axis of the branch cutting across the wood fibres. A short fracture is often associated with decay, but where the wood appears sound, an internal defect or earlier weakening, not visible on the exterior of the tree, may exist.
Wood deterioration was a determining factor for SBD. However, the identification of Ganoderma lucidum would be unfeasible only using the visual method, commonly known as VTA (visual tree assessment). As a consequence of the absence of signs (Ganoderma lucidum on the surface of the branches), the instrumental analysis could not be carried out during the diagnosis and as demonstrated in this discussion, instrumental analysis (tomography and drilling resistance) would allow the identification of the dimension and severity of internal lesions.
Managing SBD necessitates a blend of preventive measures and consistent tree maintenance. Monitoring specimens is crucial for recommending the most effective strategies for their preservation, dissemination, and propagation, be it through clonal or seminal methods. Through closely monitoring trees, appropriate measures can be implemented to ensure their well-being and enable successful propagation, whether through cloning or seed propagation. The strategies to mitigate the risks associated with this phenomenon include regular tree inspections, proper tree intervention techniques, structural support to better distribute weight and provide additional stability to weak branches, proper care practices (adequate watering, mulching, and fertilization), and reducing excessive foliage loads to alleviate stress on the branches.

4. Conclusions

This paper refers to several studies cases related to SBD observed in Portugal. The common subject is related to the difficulty of predicting the event, which can be made through estimating the probability of fracture.
The combination of observations made in the reported case studies allows us to conclude that:
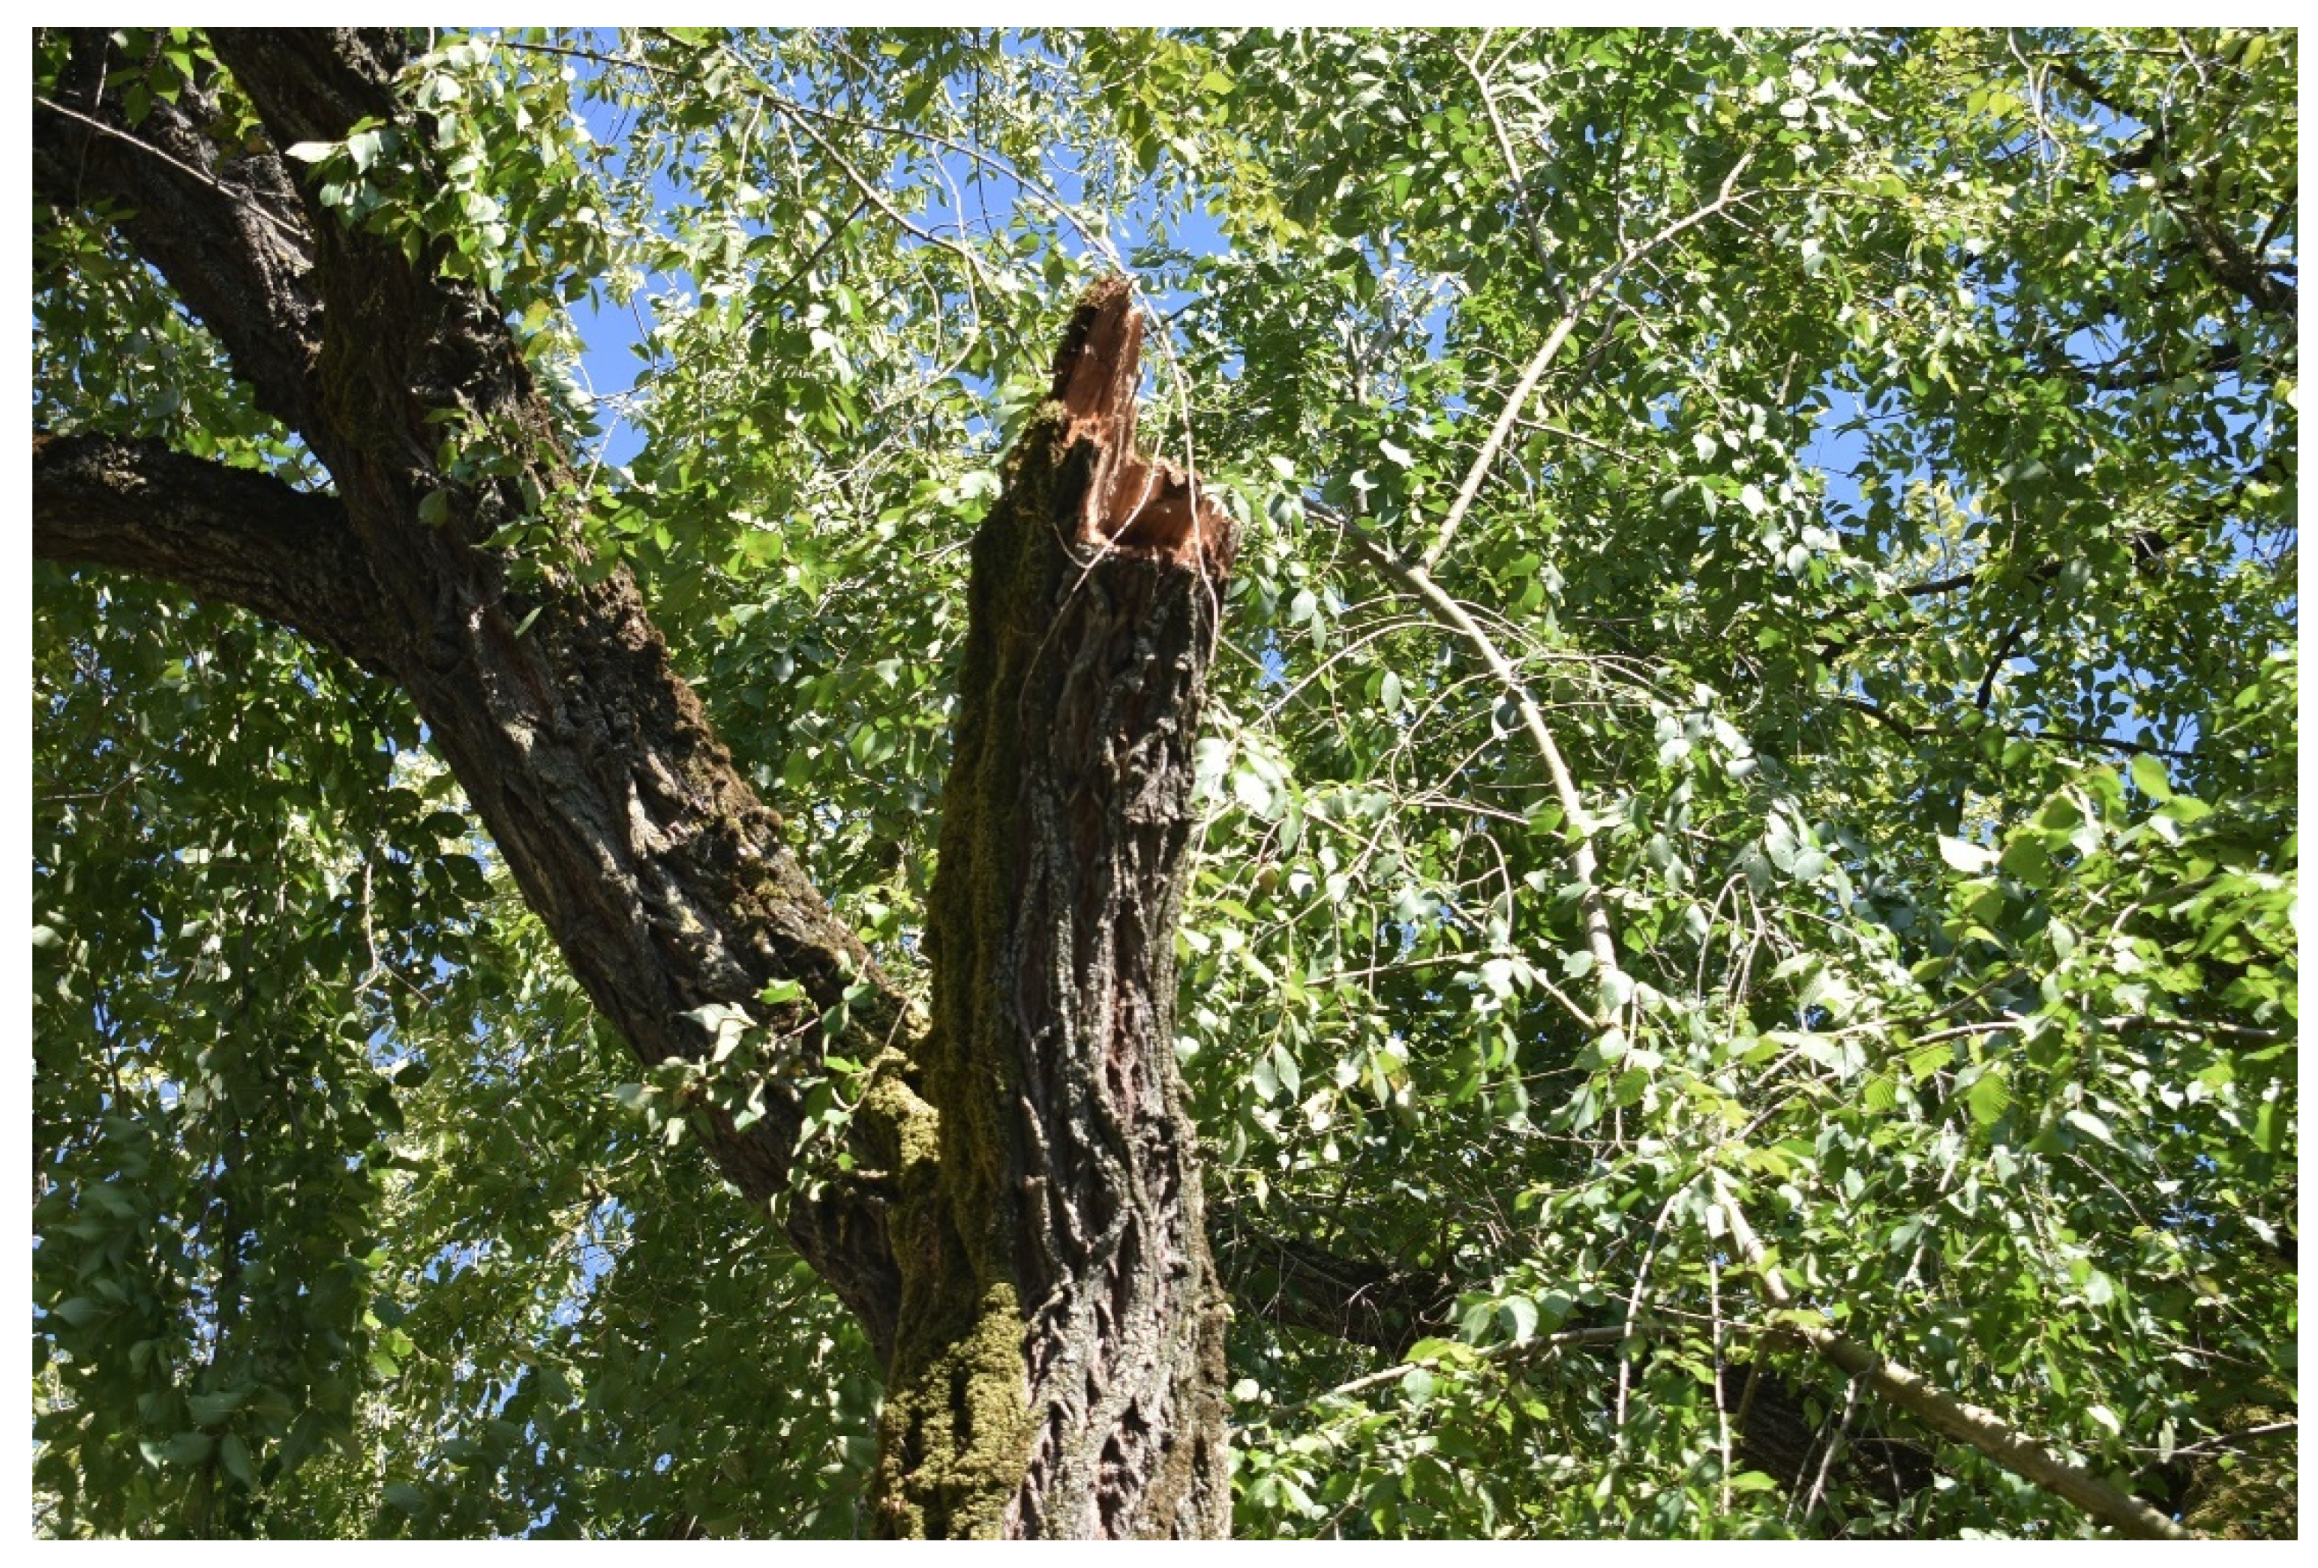
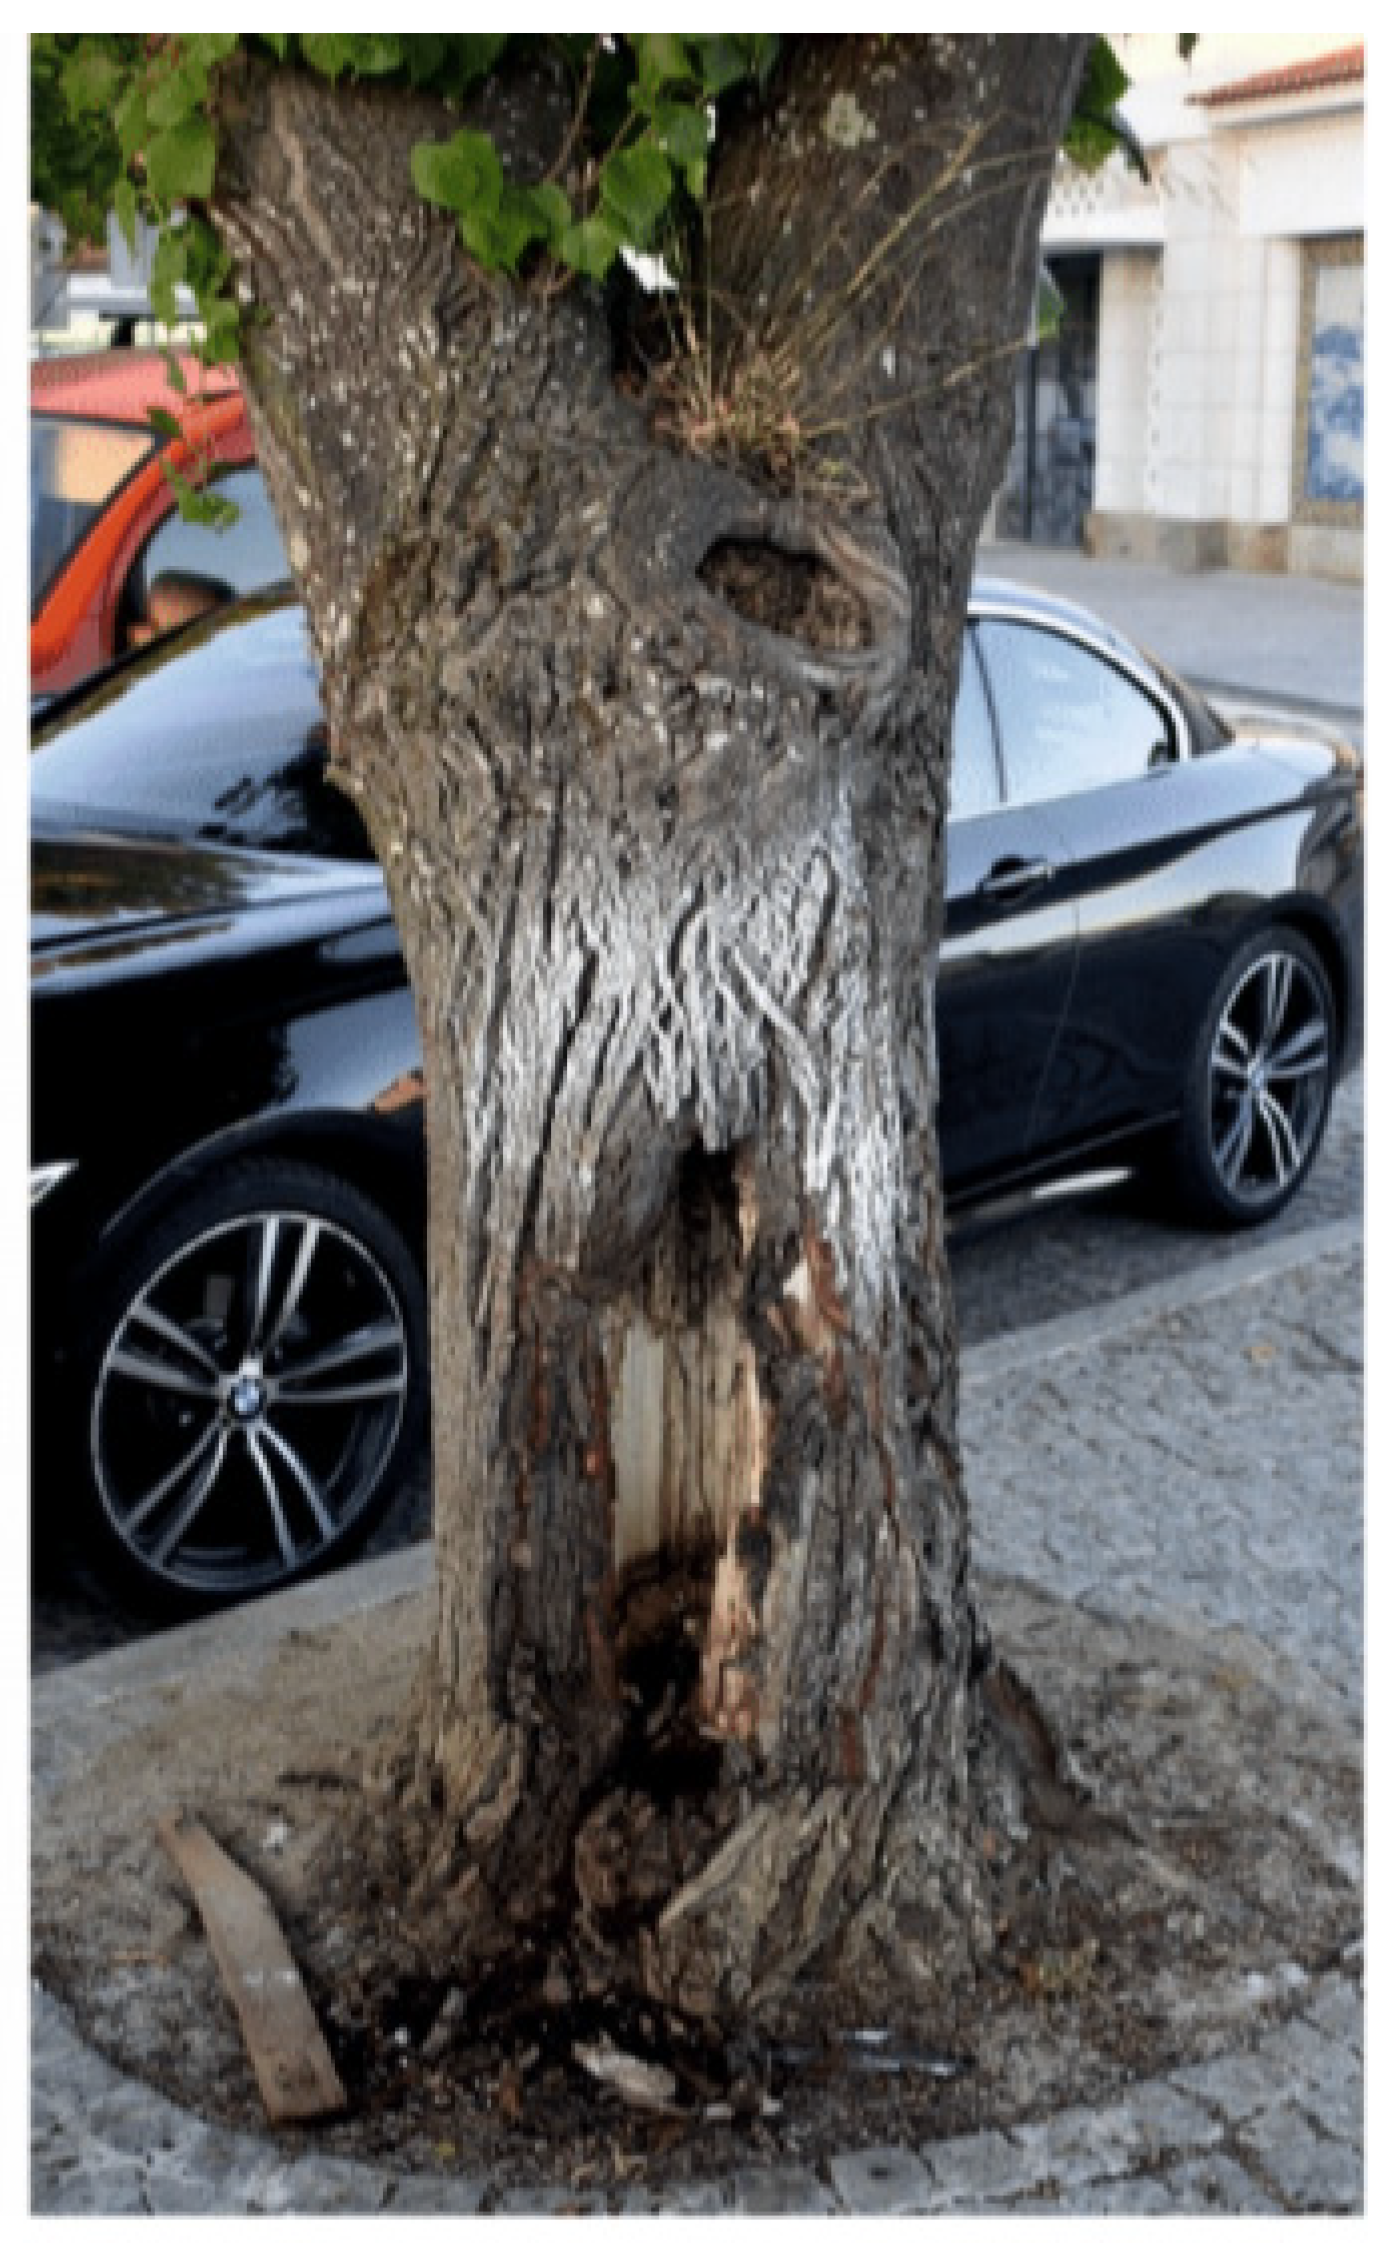
SBD is mostly related to internal degradation, making it difficult to predict the fall when only considering environmental conditions, but lowered tree defences against internal degradation due to environmental conditions are an element that must be considered.
VTA diagnosis, applied in isolation, could lead to an incorrect prognosis of internal degradation. So, it is important to confirm of the presence of biotic agents using equipment (acoustic tomography and drilling resistance).
Instrumental diagnostic tests that considering the date of evaluation are very helpful, but for a more complete answer regarding degradation, reducing the subjectivity of the approach to estimating the probability of fracture, a global analysis is necessary, including dendrometric parameters, predisposing and inciting factors, lower tree defences against internal degradation due to environmental conditions, and biotic agents.
The deconstruction of the natural architecture of the branches seems to be an element that affects the natural processes of decline. So, it is recommended that large branches remain in place.

Author Contributions

Conceptualization, L.M.M. and S.K.; investigation, C.S.F.L.; writing—original draft preparation, C.S.F.L.; writing—review and editing, R.G., L.M.M. and S.K.; visualization, R.G., L.M.M., A.D. and S.K.; supervision, S.K. and L.M.M. All authors have read and agreed to the published version of the manuscript.

Funding

This work was partly financed by FCT/MCTES through national funds (PIDDAC) under the R&D Unit Institute for Sustainability and Innovation in Structural Engineering (ISISE), under reference UIDB/04029/2020, and under the Associate Laboratory Advanced Production and Intelligent Systems ARISE under reference LA/P/0112/2020. This work was also funded by projet INOVC+ - Ecossistema de Inovação Inteligente, CENTRO-01-0246-FEDER-000044. The first author acknowledge additional funding granted by FCT through a doctoral grant (2022.11580.BD).

Data Availability Statement

Data are contained within the article.

Conflicts of Interest

The authors declare no conflict of interest.

References

  1. Tallis, M.; Taylor, G.; Sinnett, D.; Freer-Smith, P. Estimating the removal of atmospheric particulate pollution by the urban tree canopy of London, under current and future environments. Landsc. Urban Plan 2011, 103, 129–138. [Google Scholar] [CrossRef]
  2. Escobedo, F.J.; Nowak, D.J. Spatial heterogeneity and air pollution removal by an urban forest. Landsc. Urban Plan 2009, 90, 102–110. [Google Scholar] [CrossRef]
  3. Gilbert, E.A.; Smiley, T. Picus Sonic tomography for the quantification of decay in white oak (Quercus alba) and hickory (Carya sp.). J. Arboric. 2004, 30, 277–281. [Google Scholar]
  4. Wilcox, W.W. Review of literature on the effects of early stages of decay on wood strength. Wood Fiber Sci. 1978, 4, 252–257. [Google Scholar]
  5. Mattheck, C. Field Guide for Visual Tree Assessment; Forschungzentrum Karlsruhe GmbH: Karlsruhe, Germany, 2007; p. 170. [Google Scholar]
  6. Linhares, C.; Gonçalves, R.; Yojo, T. Simplified Methodology for the Inference of Drag Coefficient Applied in Species of Tropical Zone. In Proceedings of the 21st International Nondestructive Testing and Evaluation of Wood: Forest Products Society; Forest Research Institute Baden-Württemberg: Freiburg, Germany, 2019; p. 657. [Google Scholar]
  7. Rinn, F.; Schweingruber, F.H.; Schar, E. Resistograph and x-ray density charts of wood comparative evaluation of drill resistance profiles and x-ray density charts of different wood species. Holzforschung 1996, 50, 303–311. [Google Scholar] [CrossRef]
  8. Costello, L.R.; Quarles, S.L. Detection of wood decay in blue gum and elm: An evaluation of the RESISTOGRAPH® and the portable drill. J. Arboric. 1999, 25, 311–318. [Google Scholar] [CrossRef]
  9. Johnstone, D.; Ades, P.K.; Moore, G.M.; Smith, I.W. Predicting wood decay in eucalypts using an expert system and the IMLRESISTOGRAPH® drill. Arboric. Urb. For. 2007, 33, 76–82. [Google Scholar]
  10. Wang, X.; Allison, R.B. Decay detection in red oak trees using a combination of visual inspection, acoustic testing, and resistance micro drilling. J. Arboric. Urban For. 2008, 34, 1–4. [Google Scholar] [CrossRef]
  11. Johnstone, D.; Moore, G.; Tausz, T.; Nicolas, M. The measurement of wood decay in landscape trees. Arboric. Urb. For. 2010, 36, 121–127. [Google Scholar] [CrossRef]
  12. Johnstone, D.; Moore, G.; Tausz, T.; Nicolas, M. Quantifying wood decay in Sydney bluegum (Eucalyptus saligna) trees. Arboric. Urb. For. 2010, 36, 243–253. [Google Scholar] [CrossRef]
  13. Arciniegas, A.; Prieto, F.; Brancheriau, L.; Lasaygues, P. Literature review of acoustic and ultrasonic tomography in standing trees. Trees 2014, 28, 1559–1567. [Google Scholar] [CrossRef]
  14. Balázs, M.; Divos, F. Glue Laminated Timber Structure Evaluation by Acoustic Tomography. General Technical Report FPL-GTR-239. In Proceedings of the 19th International Nondestructive Testing and Evaluation of Wood Symposium, Rio de Janeiro, RJ, Brazil, 22–25 September 2015; pp. 462–466. [Google Scholar]
  15. Trinca, A.J.; Guerra, M.R.; Gonçalves, R. Velocity Variation in Wood as a Function of Defects. General Technical Report FPL-GTR-239. In Proceedings of the 19th International Nondestructive Testing and Evaluation of Wood Symposium, Rio de Janeiro, RJ, Brazil, 22–25 September 2015; pp. 593–599. [Google Scholar]
  16. Linhares, C.; Trinca, A.; Gonçalves, R. Ultrasonic Tomography in Knots Detection. In Proceedings of the 18th International Nondestructive Testing and Evaluation of Wood Symposium, Madison, WI, USA, 24–27 September 2013; Forest Products Society: Madison, WI, USA, 2013; p. 664. [Google Scholar]
  17. Sanabria, S.J.; Furrer, R.; Neuenschwander, J.; Niemz, P.; Sennhauser, U. Air-coupled ultrasound inspection of glued laminated timber. Holzforschung 2011, 65, 377–387. [Google Scholar] [CrossRef]
  18. Batista, F.A.F.; Gonçalves, R.; Cerri, D.G.P.; Secco, C.B. Reprodução da condição interna de peças de madeira através de imagens representativas da propagação de ondas. Madeira Arquitetura E Eng. 2009, 10, 23–32. (In Portuguese) [Google Scholar]
  19. Brashaw, B.K.; Bucur, V.; Divos, F.; Gonçalves, R.; Lu, J.; Meder, R.; Pellerin, R.F.; Potter, S.; Ross, R.J.; Wang, X.; et al. Nondestructive testing and evaluation of wood: A worldwide research update. For. Prod. J. 2009, 59, 7–14. [Google Scholar]
  20. Socco, L.V.; Sambuelli, L.; Martinis, R.; Comino, E.; NicolottI, G. Feasibility of ultrasonic tomography for nondestructive testing of decay on living trees. Res. Nondestruct. Eval. 2004, 15, 31–54. [Google Scholar] [CrossRef]
  21. Lin, C.J.; Huang, Y.H.; Huang, G.S.; Wu, M.L.; Yang, T.H. Detection of termite damage in Hoop pine (Araucaria cunninghamii) trees using nondestructive evaluation techniques. J. Trop. For. Sci. 2016, 28, 79–87. [Google Scholar]
  22. Matheny, N.; Clark, J. A Photographic Guide to the Evaluation of Hazard Trees in Urban Areas; International Society of Arboriculture: Champaign, IL, USA, 1994; p. 85. [Google Scholar]
  23. Mattheck, C.; Breloer, H. Field guide for visual tree assessment (VTA). Arbor. J. 1994, 18, 1–23. [Google Scholar] [CrossRef]
  24. Pokorny, J.D. Urban Tree Risk Management, a Community Guide to Program Design and Implementation; USDA Forest Service North-eastern Area State and Private Forest: Milwaukee, WI, USA, 2003. [Google Scholar]
  25. Ellison, M.J. Quantified tree risk assessment used in the management of amenity trees. J. Arbor. 2005, 31, 57–65. [Google Scholar] [CrossRef]
  26. Smiley, E.T.; Matheny, N.; Lilly, S. Best Management Practices: Tree Risk Assessment; International Society of Arboriculture: Champaign, IL, USA, 2011; p. 86. [Google Scholar]
  27. Manion, P.D. Tree Disease Concepts. In Mycologia; Prentice-Hall, Inc.: Hoboken, NJ, USA, 1991; Volume 83. [Google Scholar] [CrossRef]
  28. Martins, L. Melhoria da condição de sobreiro no Parque Boticas—Natureza e Biodiversidade. In Proceedings of the 7 o Congresso Florestal Nacional—“Florestas—Conhecimento e Inovação”, Vila Real, Portugal, 5–8 June 2013. [Google Scholar]
  29. Martins, L.M. New Challenges in Urban Forest. In Proceedings of the Conference in ERASMUS Program, Porto, Portugal, 23–30 May 2015; Università degli Studi di Firenze: Florence, Italy, 2015. [Google Scholar]
  30. Li, H.; Zhang, X.; Li, Z.; Wen, J.; Tan, X. A review of research on tree risk assessment methods. Forests 2022, 13, 1556. [Google Scholar] [CrossRef]
  31. Koeser, A.K.; Smiley, E.T. Impact of assessor on tree risk assessment ratings and prescribed mitigation measures. Urban For. Urban Gree 2017, 24, 109–115. [Google Scholar] [CrossRef]
  32. Dandy, N. The Social and Cultural Values, and Governance, of Street Trees. Climate Change & Street Trees Project: Social Research Report; Forestry Commission: Surrey, UK, 2010; Volume olume 39. [Google Scholar]
  33. Williamson, T.; Dubb, S.; Alperovitz, G. Climate Change, Community Stability, and the Next 150 Million Americans; The Democracy Collaborative: College Park, MD, USA, 2010. [Google Scholar]
  34. Rinn, F. Shell-wall thickness and breaking safety of mature trees. West. Arborist 2013, 39, 40–44. [Google Scholar]
  35. Gonçalves, R.; Trinca, A.J.; Cerri, D.G.P. Comparison of Elastic Constants of Wood Determined by Ultrasonic Wave Propagation and Static Compression Testing. Wood Fiber Sci. 2011, 43, 64–75. [Google Scholar]
  36. Linhares, C.F.; Gonçalves, R.; Martins, L.M.; Knapic, S. Structural stability of urban trees using visual and instrumental techniques: A review. Forests 2021, 12, 1752. [Google Scholar] [CrossRef]
  37. Bucur, V. Ultrasonic techniques for nondestructive testing of standing trees. Ultrasonics 2005, 43, 237–239. [Google Scholar] [CrossRef]
  38. Divos, F.; Szalai, L. Tree Evaluation by Acoustic Tomography. In Proceedings of the 13th International Symposium on Nondestructive Testing of Wood, Berkeley, CA, USA, 19–21 August 2002; Forest Products Society: Madison, WI, USA; pp. 251–256. [Google Scholar]
  39. Du, X.; Li, S.; Li, G.; Feng, H.; Chen, S. Stress wave tomography of wood internal defects using ellipse-based spatial interpolation and velocity compensation. BioResources 2015, 10, 3948–3962. [Google Scholar] [CrossRef]
  40. Maurer, H.; Schubert, S.I.; Bachle, F.; Clauss, S.; Gsell, D.; Dual, J.; Niemz, P. A simple anisotropy correction procedure for acoustic wood tomography. Holzforschung 2006, 60, 567–573. [Google Scholar] [CrossRef] [Green Version]
  41. Stefan, H.; Gottfried, S. Detection of Butt Rot. In Proceedings of the International Symposium on Nondestructive Testing of Wood, Sopron, Hungary, 13–15 September 2000. [Google Scholar]
  42. Bucur, V. Acoustics of Wood (Second Edition). J. Acoust. Soc. Am. 2006, 119, 3506. [Google Scholar] [CrossRef]
  43. Wang, X.; Divos, F.; Pilon, C.; Brashaw, B.K.; Ross, R.J.; Pellerin, R.F. Assessment of Decay in Standing Timber Using Stress Wave Timing Nondestructive Evaluation Tools: A Guide for Use and Interpretation; Technical Report FPL-GTR-147; US Department of Agriculture, Forest Service, Forest Products Laboratory: Madison, WI, USA, 2004; Volume 12, p. 47. [Google Scholar]
  44. Zhu, J.; Tadooka, N.; Takata, K.; Koizumi, A. Growth and wood quality of sugi (Cryptomeria japonica) planted in Akita prefecture (II). Juvenile/mature wood determination of aged trees. J. Wood Sci. 2005, 51, 95–101. [Google Scholar] [CrossRef]
  45. Kijidani, Y.; Kitahara, R. Variation of wood properties with height position in the stems of Obi-sugi [Cryptomeria japonica] cultivars. J. Jpn. Wood Res. Soc. 2009, 55, 198–206. [Google Scholar] [CrossRef] [Green Version]
  46. Bucur, V. High resolution imaging of wood. In Proceedings of the 13th International Nondestructive Testing and Evaluation of Wood Symposium, Berkeley, CA, USA, 19–21 August 2002. [Google Scholar]
  47. Trinca, A.J.; Gonçalves, R. Effect of the transversal section dimensions and transducer frequency on ultrasound wave propagation velocity in wood. Revista Árvore 2009, 33, 177–184. [Google Scholar] [CrossRef] [Green Version]
  48. Palma, S.S.A.; Gonçalves, R.; Trinca, A.J.; Costa, C.P.; Guerra, M.N.R.; Martins, G.A. Interference from knots, wave propagation direction and effect of juvenile and reaction wood on velocities in ultrasound tomography. BioResources 2018, 13, 2834–2845. [Google Scholar] [CrossRef]
  49. Brancheriau, L.; Ghodrati, A.; Gallet, P.; Thaunay, P.; Lasaygues, P. Application of ultrasonic tomography to characterize the mechanical state of standing trees (Picea abies). J. Phys. Conf. Ser. 2012, 353, 012007. [Google Scholar] [CrossRef]
  50. Feng, H.; Li, G.; Fu, S.; Wang, X. Tomographic image reconstruction using an interpolation method for tree decay detection. BioResources 2014, 9, 3248–3263. [Google Scholar] [CrossRef]
  51. Lin, C.J.; Kao, Y.C.; Lin, T.T.; Tsai, M.J.; Wang, S.Y.; Lin, L.D.; Chan, M.H. Application of an ultrasonic tomographic technique for detecting defects in standing trees. Int. Biodeter. Biodegr. 2008, 62, 434–441. [Google Scholar] [CrossRef]
  52. Strobel, J.R.A.; de Carvalho, M.A.G.; Gonçalves, R.; Pedroso, C.B.; dos Reis, M.N.; Martins, P.S. Quantitative image analysis of acoustic tomography in woods. Eur. J. Wood Wood Prod. 2018, 76, 1379–1389. [Google Scholar] [CrossRef]
  53. Palma, S.S.A.; Gonçalves, R. Tomographic images of tree trunks generated using ultrasound and post-processed images: Influence of the number of measurements points. BioResources 2022, 14, 6638–6655. [Google Scholar] [CrossRef]
  54. Kubus, M. The Evaluation of Using Resistograph when Specifying the Health Condition of a Monumental Tree. Not. Bot. Horti. Agrobo. 2009, 37, 157–164. [Google Scholar]
  55. Bodensee, B.T.; Pietruschinski, M. Example Arbotom Report; ICT international: Freiburg, Germany, 2012. [Google Scholar]
  56. Rinn, F. A new method for direct measuring of wood density of broadleaf trees and conifers. Dendrochronologia 1989, 7, 159–168. [Google Scholar]
  57. Brashaw, B.K.; Vatalaro, R.; Ross, R.J.; Wang, X.; Schmieding, S.; Okstad, W. Historic Log Cabin structural condition assessment and rehabilitation—A case study. In Proceedings of the 17th International Nondestructive Testing and Evaluation of Wood Symposium, Sopron, Hungary, 14–16 September 2011; pp. 505–512. [Google Scholar]
  58. Rinn, F. Basics of Micro-Resistance-Drilling for Timber Inspection. Holztechnologie 2012, 53, 24–29. [Google Scholar]
  59. Wang, X.; Wiedenbeck, J.; Liang, S. Acoustic tomography for decay detection in black cherry trees. Wood Fiber Sci. 2009, 41, 127–137. [Google Scholar]
  60. Dos Reis, M.N.; Gonçalves, R.; Lopes Garcia, G.H.; Manes, L. Profiles of a Non-Calibrated Resistance Drill Compared with Deteriorated Stem Cross Sections. Arbor. Urb. For. 2019, 45, 1–9. [Google Scholar] [CrossRef]
  61. Tannert, T.; Anthony, R.W.; Kasal, B.; Kloiber, M.; Piazza, M.; Riggio, M.; Rinn, F.; Widman, N.R.; Yamaguchi, N. In situ assessment of structural timber using semi-destructive techniques. Mater. Struct. 2014, 47, 767–785. [Google Scholar] [CrossRef]
  62. Martins, L.; Amaral, J.G. Floresta urbana: O paradoxo da naturalização em contexto artificial. Ingenium 2021, 173, 84–87. [Google Scholar]
  63. Martins, L.; Macedo, F.; Saraiva, S. Avaliação Da Condição Das Árvores Dos Parques Do Porto Com Apoio Da Aplicação Idtree Em Appsheet®. In Proceedings of the 2º Simpósio SCAP de Proteção das Plantas, Santarém, Portugal, 26–27 October 2017. [Google Scholar]
  64. Mattheck, C.; Kubler, H. Wood the Internal Optimization of Trees; Springer Verlag: Berlin, Germany; Scientific Research Publishing: Wuhan, China, 1995. [Google Scholar]
  65. Shigo, A. Modern Arboriculture. 1991. Available online: https://www.amazon.com/Modern-Arboriculture-AlexShigo-1991-12-31/dp/B019TLQFX (accessed on 15 March 2023).
  66. Fraedrich, B.R. Compartmentalization of Decay in Trees; Technical Report TR-18; Bartlett Tree Research Laboratories: Charlotte, NC, USA, 1999. [Google Scholar]
  67. Reis, M.N.D.; Gonçalves, R.; Brazolin, S.; de Assis Palma, S.S. Strength Loss Inference Due to Decay or Cavities in Tree Trunks Using Tomographic Imaging Data Applied to Equations Proposed in the Literature. Forests 2022, 13, 596. [Google Scholar] [CrossRef]
  68. Väänänen, P.J.; Osem, Y.; Cohen, S.; Grünzweig, J.M. Differential drought resistance strategies of co-existing woodland species enduring the long rainless Eastern Mediterranean summer. Tree Physiol. 2020, 40, 305–320. [Google Scholar] [CrossRef] [PubMed]
  69. Condo, T.K.; Reinhardt, K. Large variation in branch and branch-tip hydraulic functional traits in Douglas-fir (Pseudotsuga menziesii) approaching lower treeline. Tree Physiol. 2019, 39, 1461–1472. [Google Scholar] [CrossRef] [PubMed]
  70. Wagner, Y.; Pozner, E.; Bar-On, P.; Ramon, U.; Raveh, E.; Neuhaus, E.; Cohen, S.; Grünzweig, J.; Klein, T. Rapid stomatal response in lemon saves trees and their fruit yields under summer desiccation but fails under recurring droughts. Agric. For. Meteorol. 2021, 307, 108487. [Google Scholar] [CrossRef]
  71. Aydın, T.Y. Temperature Influenced Anisotropic Elastic Parameters of Red Pine. Russ. J. Nondestruct. Test. 2022, 58, 548–562. [Google Scholar] [CrossRef]
  72. Chuste, P.A.; Massonnet, C.; Gérant, D.; Zeller, B.; Levillain, J.; Hossann, C.; Angeli, N.; Wortemann, R.; Bréda, N.; Maillard, P. Short-term nitrogen dynamics are impacted by defoliation and drought in Fagus sylvatica L. branches. Tree Physiol. 2019, 39, 792–804. [Google Scholar] [CrossRef]
  73. Velisevich, S.N.; Bender, O.G.; Goroshkevich, S.N. The influence of scion donor tree age on the growth and morphogenesis of Siberian stone pine grafts. New For. 2021, 52, 473–491. [Google Scholar] [CrossRef]
Figure 1. Map with the locations of the four sites studied in Portugal.
Forests 14 01398 g001
Figure 2. Example of diffraction mesh and arrangement of the 13 sensors (1–13) used in sonic tomography in Quercus robur.
Forests 14 01398 g002
Figure 3. Example of the distribution of the Arbotom sensors on the stem of an oak tree.
Forests 14 01398 g003
Figure 4. Tilia tomentosa during diagnosis (May 2022) and after the SBD (August 2022).
Forests 14 01398 g004
Figure 5. Dieback crown and dry branches.
Forests 14 01398 g005
Figure 6. Ganoderma sp.
Forests 14 01398 g006
Figure 7. Risk matrix for Populus nigra.
Forests 14 01398 g007
Figure 8. Platanus × hispanica during the diagnosis (May 2022) and after the SBD (October 2022).
Forests 14 01398 g008
Figure 9. Cavities in the stem.
Forests 14 01398 g009
Figure 10. Ganoderma sp.
Forests 14 01398 g010
Figure 11. Drop in drilling resistance amplitude showing possible Xylem degeneration in the stem (h: 1.30 m).
Forests 14 01398 g011
Figure 12. Risk matrix for Fagus sylvatica.
Forests 14 01398 g012
Figure 13. Ulmus carpinifolia after the SBD (August 2022).
Forests 14 01398 g013
Figure 14. Cavity and degeneration of xylem tissue (Tilia cordata).
Forests 14 01398 g014
Figure 15. Loss of structural strength (h: 0.40 m—stem).
Forests 14 01398 g015
Figure 16. Ground cover and permeability test (August 2022).
Forests 14 01398 g016
Figure 17. Wind velocity and wind direction in Porto District.
Forests 14 01398 g017
Figure 18. Macroscopic observation of a culture of Ganoderma lucidum, after 7 days in PDA culture medium, with presence of yellow exudation.
Forests 14 01398 g018
Figure 19. Microscopic observation of Ganoderma lucidum culture in culture medium PDA. (A) Mycelium, after 7 days in culture; (B) chlamydospores, after 7 days in culture; (C) presence of spore-like structures, after 8 days in culture; (D) spores and filaments after 10 days in culture; (E) presence of basidiospore-like structure after 10 days in culture; (F) formation of mycelium pellets after 14 days in culture.
Forests 14 01398 g019
Figure 20. White and brown rot on damaged branch. No signs present on the periphery.
Forests 14 01398 g020
Figure 21. Healthy and affected areas of the wood as obtained with Arbotom and arrangement of the 13 sensors (1–13).
Forests 14 01398 g021
Figure 22. Mechanical chart of the inspected cross-section.
Forests 14 01398 g022
Figure 23. Amplitude of drilling resistance in the stem—direction 1.
Forests 14 01398 g023
Figure 24. Amplitude of drilling resistance on the branch—direction 2.
Forests 14 01398 g024
Figure 25. Amplitude of drilling resistance on the branch—direction 3.
Forests 14 01398 g025
Table 1. Factors that underlie the spiral of decline model proposed by [24]. Adapted from [32].
Predisposing FactorsInciting FactorsContributing Factor
Urban environmentDroughtBiotic agents
Soil compactionFloods
Genetic potentialSevere pruning
AgeExcavation
Lack of lightAir pollution
Sea proximityOverwatering
Root cutting
Table 2. Indicative signs or symptoms related to visual analysis [32].
RootCavity; Injury; Surface
StemCavity; Injury; Codominance; Inclined; Adventitious; Spheroplast; Included bark; Protuberance
BranchCavity; Wound; Codominance; Dense; Dry: Large; Slender
TwigAdventitious; Dry; Low; Dense
LeafDry; Necrosis; Chlorosis; Small; Large; Perforated; Epinasty
CrownDead; Dieback; Transparent; Inclined; High; Low; Unbalanced; Dense
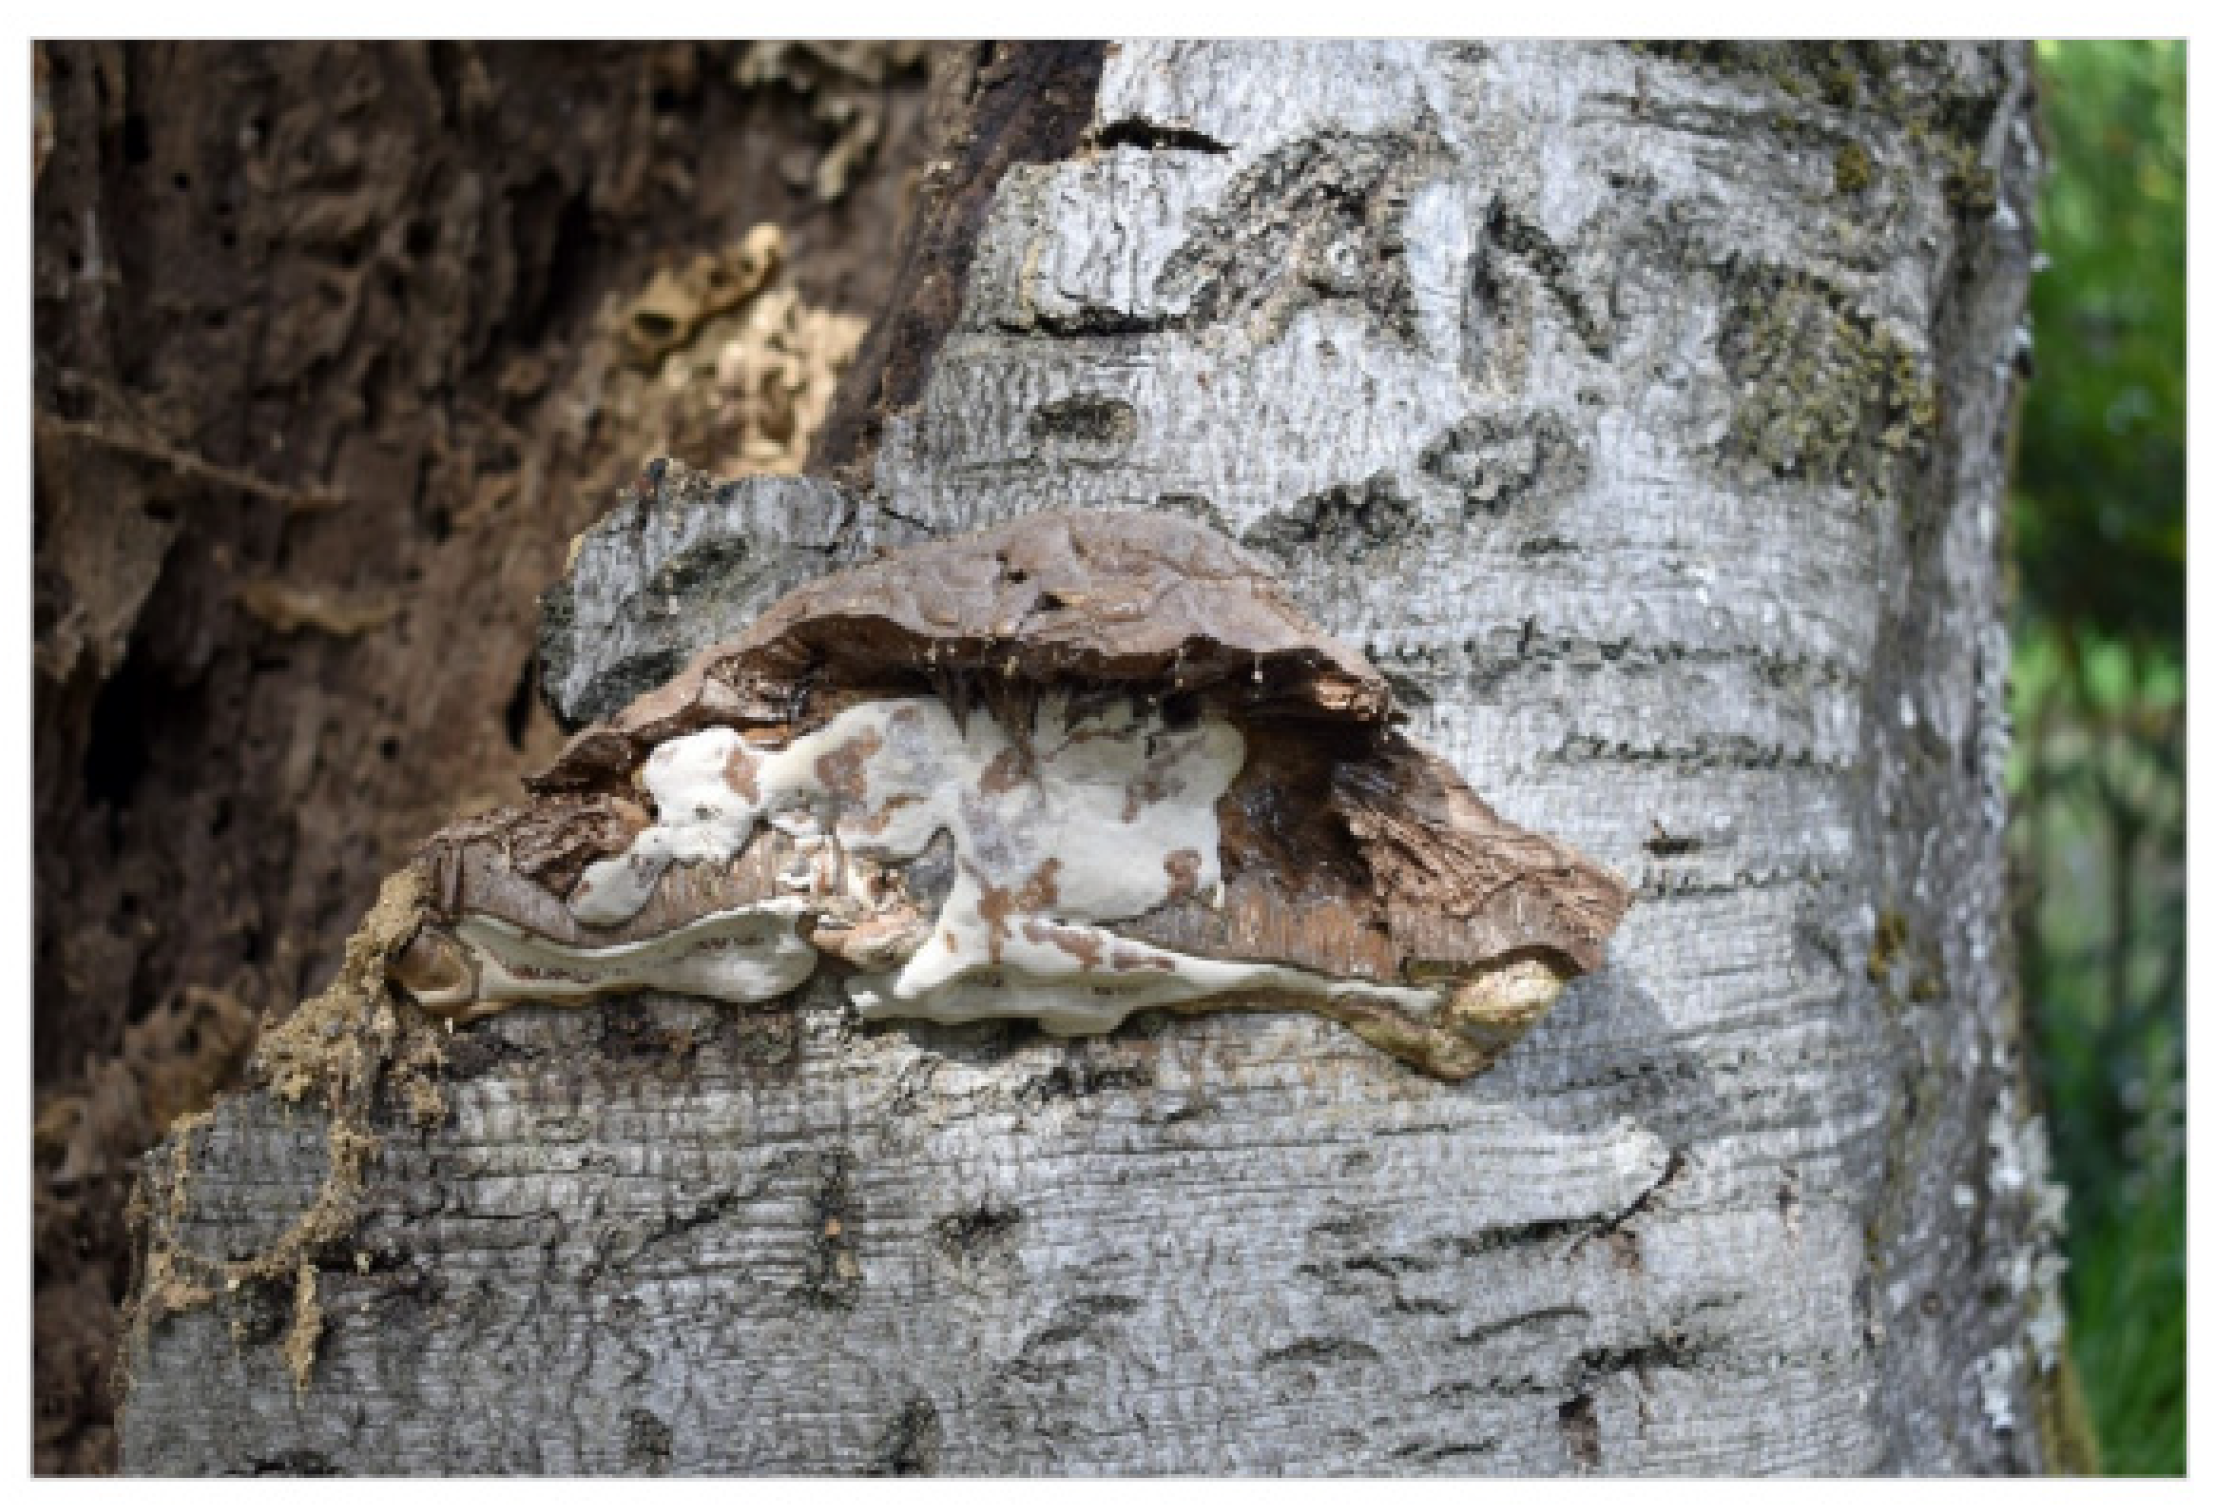
Biotic AgentsWhite rot; Brown rot; Soft rot; Fumagine; Aphids; Anthracnose; Xanthogaleruca luteola; Termite; Other phytopathogeneses
LesionHeight; Width; Depth; Height above the ground; Distance to the back wall; Thickness of the front wall; Tree diameter at lesion entrance
Table 3. Dendrometric parameters—perimeter of breast height (PBH); diameter of breast height (DBH); average crown diameter (ACD); height of the base of the crown (HBC); height of the tree (H); age (A).
SITESPECIEPBH (cm)DBH (cm)ACD (m)HBC (m)H (m)A (years)
S1Tilia tomentosa 73.212.03.227.041—50
S1Populus nigra 91.422.23.930.731—40
S2Platanus x hispanica357.8113.919.67.228.5130
S2Fagus sylvatica 149.315.05.822.1
S3Ulmus carpinifolia188.560.014.42.517.460—70
S3Tilia cordata 58.58.12.411.230—40
S4Quercus robur391.1124.522.31.818.0>150
Table 4. Visual tree assessment—Fagus sylvatica.
SpecieStemBranchTwig
Fagus sylvaticaCavitiesCodominantDry
Table 5. Global qualitative condition—Fagus sylvatica.
Predisposing FactorBiotic AgentNumerical ConditionGlobal Qualitative
AgeGanoderma sp.10Reasonable
Disclaimer/Publisher’s Note: The statements, opinions and data contained in all publications are solely those of the individual author(s) and contributor(s) and not of MDPI and/or the editor(s). MDPI and/or the editor(s) disclaim responsibility for any injury to people or property resulting from any ideas, methods, instructions or products referred to in the content.

