Article

Mapping the Late Miocene Pyrenean Forests of the La Cerdanya Basin, Spain

by
Yul Altolaguirre
1,
José Mª Postigo-Mijarra
2,
Manuel Casas-Gallego
3,4,
Rafael Moreno-Domínguez
5 and
Eduardo Barrón
6,*
1
ROCEEH Research Centre ‘The Role of Culture in Early Expansions of Humans’ of the Heidelberg Academy of Sciences, Senckenberg Research Institute, Senckenberganlage 25, 60325 Frankfurt am Main, Germany
2
Department of Biodiversity, Ecology and Evolution, Faculty of Biological Sciences, Complutense University of Madrid, José Antonio Novais St., 12, 28040 Madrid, Spain
3
Institute of Ecology, Diversity and Evolution, Goethe University Frankfurt am Main, 60323 Frankfurt, Germany
4
Department of Geodynamics, Stratigraphy and Palaeontology, Faculty of Geological Sciences, Complutense University of Madrid, José Antonio Novais St., 12, 28040 Madrid, Spain
5
Palaeontology Area, Geosciences Department, Zaragoza University, Pedro Cerbuna, 12, 50009 Zaragoza, Spain
6
Museo Geominero, Instituto Geológico y Minero de España—CN IGME-CSIC, Ríos Rosas 23, 28003 Madrid, Spain
*
Author to whom correspondence should be addressed.
Forests 2023, 14(7), 1471; https://doi.org/10.3390/f14071471
Submission received: 22 June 2023 / Revised: 10 July 2023 / Accepted: 14 July 2023 / Published: 18 July 2023
(This article belongs to the Special Issue Forest Paleoecology)

Abstract

:
The Late Miocene palaeofloras of the La Cerdanya Basin represent a unique look into the Pyrenean Miocene forested areas of the Iberian Peninsula at a time when the European warm and humid climate was experiencing progressive cooling and aridification. Macrofossils (leaves, seeds, fruits and cones) and miospores from several outcrops revealed the composition and abundances of the different plant species present in the area during the Tortonian and early Messinian geological stages (ca. 11.1–5.7 Ma). These fossils were found in the sediment deposits of an ancient lake system situated in the southwestern part of the basin. Previous studies indicated the presence of highly diversified mixed mesophytic forests with broadleaved evergreen and deciduous trees and conifers. However, the spatial structure and distribution of these forest types remains unknown. In the present work, the biomization method was used to infer the different late Miocene vegetation types from the basin. The extent of these vegetation types was calculated using a methodology for mapping vegetation units from fossil and biome data. While previous attempts at mapping Miocene vegetation units had a broad geographical scale, the present work aimed to map the extent of the vegetation units at a small scale, recreating local and specific vegetation changes in an abrupt basin. Results showed similarly high scores between for four biome types, which represent the different types of vegetation that coexisted in the basin during the Tortonian and the early Messinian: warm-temperate evergreen broadleaf and mixed woodlands (WTEM biome), temperate deciduous forests (TEDE) and cool conifer forests (COMX and COEG). Their extent was depicted in two vegetation maps, which account for differences in palaeoaltitude and palaeoclimate. These forests occupied different vegetation belts, which shifted upwards and downwards with climatic variations and the progressive uplift of the Pyrenees during the late Miocene. Azonal riparian forests and wetland vegetation occupied the more humid areas in the centre of the basin. Nonetheless, dry conditions during the early Messinian and decrease in the lake area degraded the wetland environments, which were partially replaced by broadleaved evergreen mixed woodlands.

1. Introduction

During the Late Miocene, forested areas in the Iberian Peninsula had a limited extent [1], in contrast to European zones at higher latitudes where forests were common [2,3,4]. The use of mammal microfossils as palaeoprecipitation proxies reflect mean annual precipitations (MAP) of around 600 mm from 12 to 9 Ma, and below 600 mm from 8 to 3 Ma [5], favouring the establishment of open, savannah-type landscapes in large areas of the Iberian Peninsula. Therefore, Late Miocene Iberian forests only thrived in locations that met the necessary humidity and temperature conditions, such as river margins, lakes and wetlands [6,7], Atlantic regions with marine influence [8] and mountainous regions [9,10]. The intramontane La Cerdanya Basin is one of the places that met the required conditions to host forests during the Late Miocene. It is located in the Axial Zone of the Pyrenees, the mountain range connecting the Iberian Peninsula to the European mainland. The Pyrenees formed during the Alpine Orogeny due to the collision between the Iberian and the European plates [11]. The La Cerdanya Basin formed from dextral slips produced by the Le Tet strike-slip fault formed during in the eastern Pyrenees during the Middle–Late Miocene [12,13]. In this basin, two informal depositional units have traditionally been distinguished: the lower and upper Neogene units [13,14].
The lower Neogene unit comprises Tortonian sediments (ca. 11.1–8.7 Ma, European Mammal Neogene stages: MN9–MN10) and can be divided into two sub-basins: Puigcerdà and Bellver [15] (Figure 1). In the Puigcerdà sub-basin, fluvial plains developed and graded in the south of this sub-basin into a broad palustrine–deltaic area where lignite occurs. In contrast, the Bellver sub-basin developed a deep meromictic lake, which is currently represented as deposits of laminated diatomites and mudstones rich in organic matter [16]. The upper Neogene unit is early Messinian in age (ca. 6.8–5.7 Ma, MN 13) [15,17]. During this time, alluvial fans developed in the southern part of the Bellver sub-basin, near the palaeolake, which was shallow and influenced by prograding deltaic inlets [18].
The Tortonian macroflora from La Cerdanya was discovered and described for the first time at the end of the nineteenth century [19,20,21]. It was collected in the diatomites from the Bellver sub-basin and is composed mainly of leaf impressions and compressions of deciduous trees such as Fagus, Quercus, Alnus, Acer, Carpinus, Betula, Tilia and Zelkova. The first study of this flora allowed to describe 39 species, although further studies revised the original description and proposed taxonomical changes [18,22,23]. In the 1950s, palynological studies were carried out on sediments of the Puigcerdà sub-basin, on a single level of the Sanavastre mine section without proper stratigraphical control [24]. More studies were carried out [25] and later extended into the deposits of the Bellver sub-basin [9,17,22]. These studies improved the knowledge of the vegetation that developed in the region during the Tortonian and the early Messinian. The vegetation in the basin was characterised by deciduous montane mixed forests with some conifers and broadleaved evergreen elements, which were distributed considering their azonal or zonal character, their autecology and their capacity to thrive in altitude. Recently, palaeobotany-based palaeoclimatic studies have been carried out using the Coexistence Approach and Climate Leaf Analysis Multivariate Program (CLAMP) methods, which provided a quantitative understanding of the palaeoclimatic characteristics of the basin during the Late Miocene [9,26].
Although some initial approximations were performed to characterize the vegetation of La Cerdanya, no work has been carried out to date to map its vegetation on a large scale. Thus, the aim of this work was to engage in a new approach for creating palaeovegetation maps in a reproducible and quantitative way and to provide objective means to compare vegetation maps from the Tortonian and the early Messinian of the La Cerdanya Basin. Previously, the method was used to reconstruct the evolution of Quaternary vegetation [27]. The mapping of ancient vegetation units is a technique mostly applied to Quaternary data; Neogene vegetation mapping is scarce and mostly applied to broad geographical areas [28,29]. The method employed in the present paper represents a unique attempt at mapping the vegetation at small scale, describing the localized configuration of the different vegetation units in a small geographic area. By mapping the approximate extent of the different forest types in the La Cerdanya Basin, new insights will be obtained regarding the late Miocene vegetation and its changes in the Tortonian and early Messinian periods.

2. The Late Miocene Flora from La Cerdanya Basin

The Tortonian flora from the La Cerdanya Basin thrived in the eastern Pyrenees, under a humid subtropical palaeoclimate with no dry season and summer temperatures of above 22 °C, according to Coexistence Approach (CA) studies [9]. CLAMP analysis indicates average annual temperature of 11.4 °C and mean annual precipitation of 1082 mm [26].
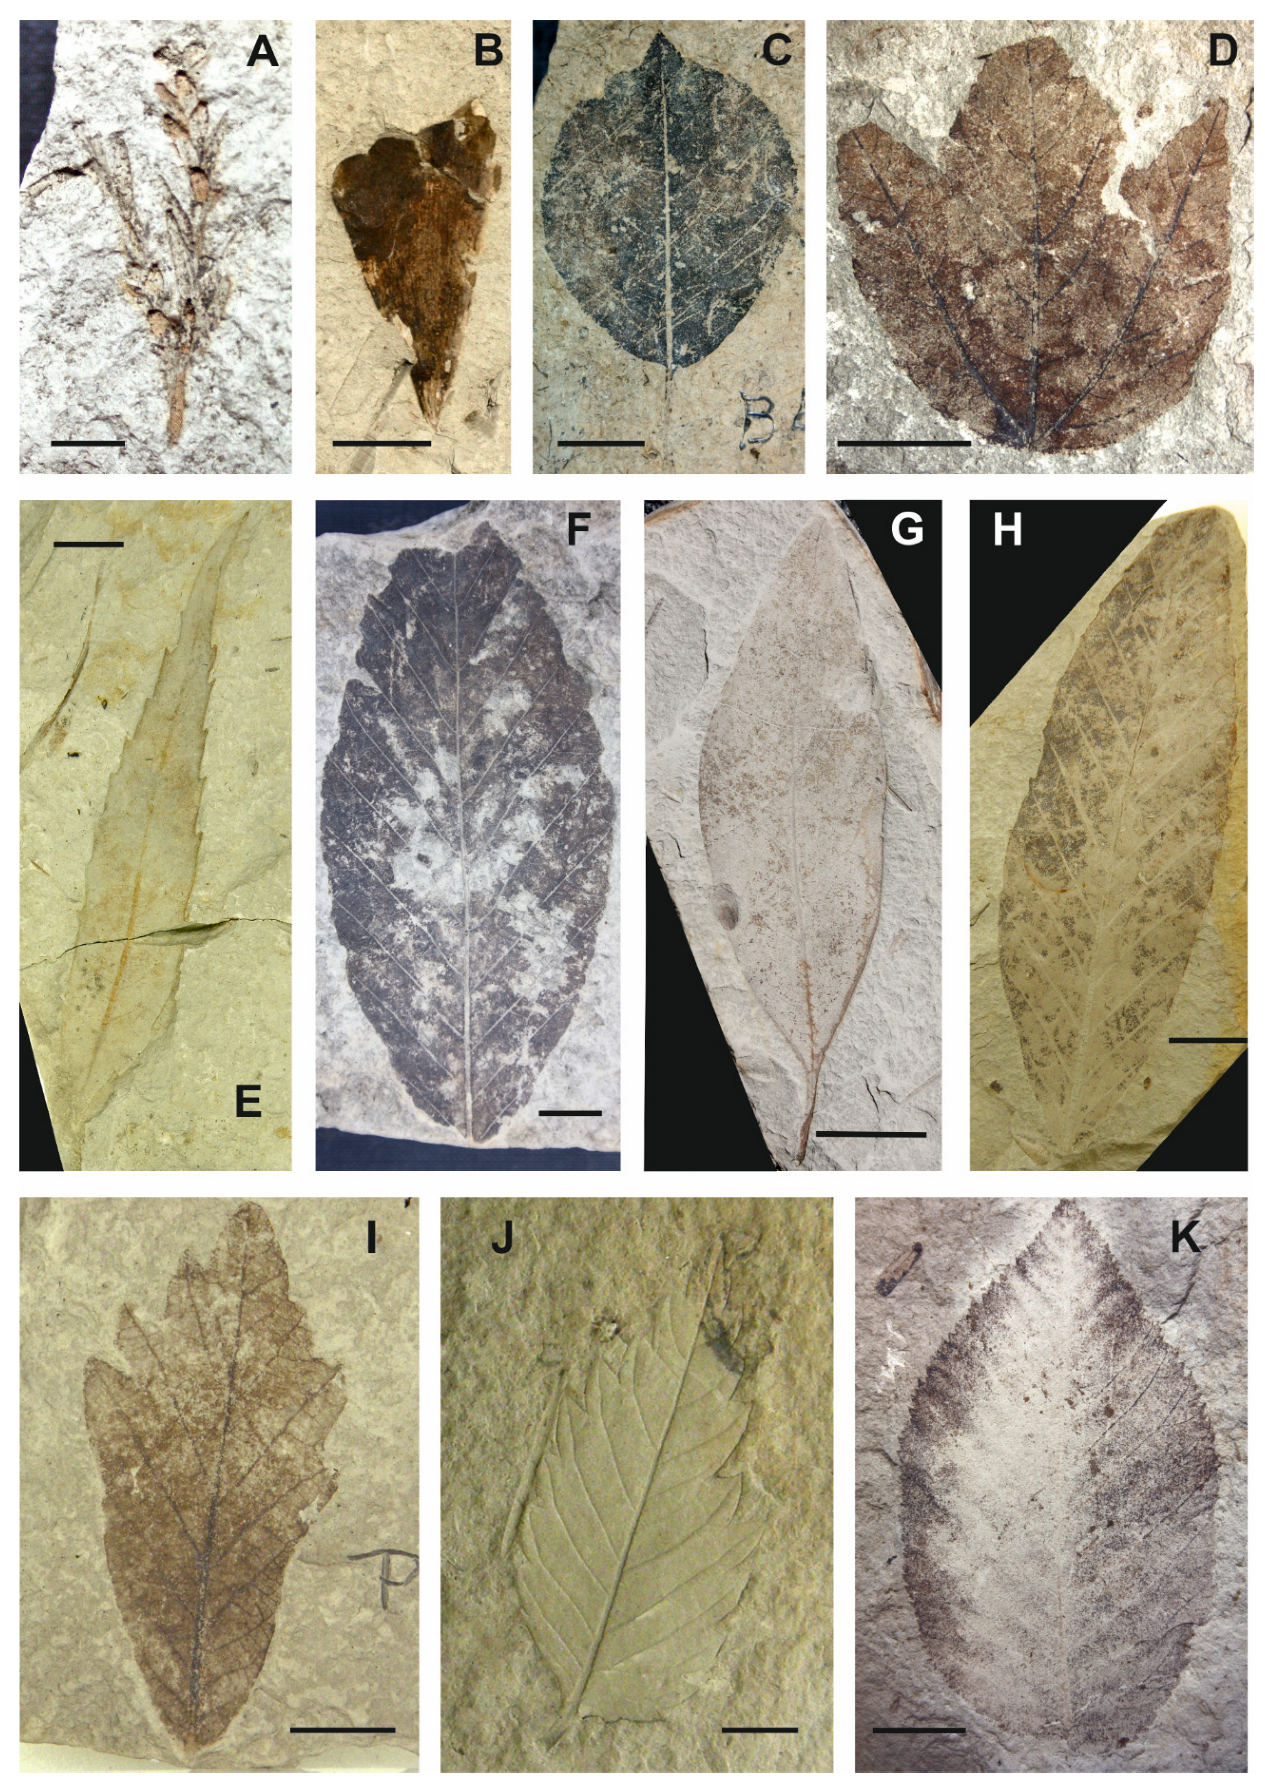
Macro and microfloristic fossils were retrieved from different outcrops in the basin. The macroflora contains 31 plant families and 71 species identified mainly from leaf remains, although there are also cones, scales, seeds, fruits, inflorescences, bracts and stems. The most abundant species are arboreal angiosperms identified from leaf remains: Acer pyrenaicum (Figure 2D), Alnus occidentalis (Figure 2C), Carpinus grandis (Figure 2K), Fagus gussonii (Figure 2F), F. haidingeri (Figure 2H), Laurophyllum sp. (Figure 2G), cf. Myrica sp., Quercus drymeja (Figure 2E), Q. hispanica (Figure 2I) and Zelkova zelkovifolia (Figure 2J) [22,23]. The high abundance of these species was most likely due to a taphonomical bias related to the transport of plant remains by wind and water streams [30,31,32,33]. Conifer remains are less represented than angiosperm leaves due to additional taphonomic biases related to the low water energy in the palaeolake. Despite their relatively lower abundance, conifers are represented by nine taxa, notably Abies saportana, Cryptomeria anglica (Figure 2A), Pinus palaeostrobus, Torreya bilinica and cf. Tsuga sp. The presence of Ginkgo adiantoides is documented sporadically (Figure 2B).
Regarding palynological studies, these indicate the presence of 106 palynomorph types belonging to 68 plant families [9]. Taphonomical factors, which include the so-called Neves effect, affected the composition of the fossil pollen assemblages [34]. This effect reflects the influence of the depositional environment combined with the miospore production of each taxon and their type of dispersion. Thus, on the one hand, the miospore record in the Puigcerdá sub-basin (deltaic environment) highlights riparian and hydrophytic communities characterised by Alnus, and conifer forests with Pinus, Abies and Cathaya. On the other hand, the deep lacustrine environment of the Bellver sub-basin mainly reflects both deciduous mesophytic and coniferous forest, while at times obscuring the vegetation growing in the shores closer to the depositional [35]. In addition, pollen studies revealed the presence of high numbers of palaeotropical taxa such as Acacia, Engelhardia, Olea, Arecaceae, Buxus and Sapotaceae [9].
Both macrofloristic and palynological studies allowed for the identification of four forest vegetation types [9]:
  • Azonal communities composed by alders, willows and poplars with an understory of ferns (mainly Osmunda) that grew in the deltaic environment of the Puigcerdà sub-basin and around the lake and on the shore of watercourses in the Bellver sub-basin;
  • Zonal open or semi-open woodlands in sunny low-lying areas characterised by semi-sclerophyllous and sclerophyllous elements such as evergreen oaks, Araliaceae, Arecaceae, Buxaceae, Fabaceae, Sapotaceae, Ulmaceae, and some palaeotropical species such as Cedrela heliconia and Dombeyopsis lobata;
  • Zonal mixed forests with broadleaved deciduous elements (mainly Fagus gussonii and Quercus hispanica together with Carpinus, Corylus, Ostrya, Acer, Tilia, Ulmus, Zelkova, Hamamelidaceae, Juglandaceae and other species of oaks and beeches), some conifers (Pinus, Cryptomeria, Torreya, cf. Tsuga, Cupressaceae) and evergreen nothophyllous broadleaved taxa (evergreen Quercus, Daphnogene polymorpha, Laurophyllum div. sp., Myrica) that surrounded the lake;
  • Zonal woods in the mountain slopes with deciduous broadleaved taxa (Fagus, Quercus, Betula, Carpinus, among others) and conifers such as Pinus, Abies, Cathaya, Picea, Cupressaceae), which predominated at higher elevations and under appropriate topographic or edaphic conditions.
The early Messinian, which is recorded in layers of the upper Neogene unit (Can Vilella outcrop) was characterised by azonal forests, mainly formed by alders that grew in swampy places and around small lakes and water courses. Zonal conifer forests with Pinus and Cathaya had relevance at this time over the mixed forests with broadleaved deciduous elements.
The Greek Messinian macrofloras from West Macedonia and Thessaly [36], which belong to the Likudi-Vegora complex (Mediterranean-Tethys Bioprovince) [37], are similar to the La Cerdanya macroflora. Additionally, the La Cerdanya palynological assemblages have similarities with the French late Tortonian–early Messinian record from the Andance outcrop [25], which is included in the Konin–Joursac complex of the Atlantic-Boreal Bioprovince [37].

3. Material and Methods

3.1. Palaeobotanical Material

The plant fossils and miospores studied in the present work were collected at 16 surface outcrops and two opencast lignite mines during the 90s and the PhD period of one of the authors of this work [22] and later updated [9,26]. The entire dataset for miospores and macroflora is presented in Supplementary Materials S1. Table 1 compiles the list of studied sites and their characteristics. These mines—the Sansor and the Sanavastre mines—are located in the Puigcerdà sub-basin (lower Neogene unit) and provide an extensive Tortonian palynological record [9] (Figure 1). The rich Tortonian palynological data from the Bellver sub-basin (lower Neogene unit) came from two sectors: eastern and western [34]. The eastern is represented by outcrops of unclear stratigraphical placement, some of them located near the southern boundary of the Puigcerdà sub-basin (e.g., Coll de Saig and Prats). The western sector shows a succession of Tortonian outcrops of laminated diatomites that follow a stratigraphic order from north (older) to south (younger) (the Bellver lake section). These are featured in the Carrer de Bellver de Cerdanya a Pi (B3/BB), Barranc de Salanca (BS), Torrent de Vilella (TV) outcrops. The early Messinian materials of the upper Neogene unit (Can Vilella site) overlie the lacustrine sediments of the cited outcrops [9,17] (Figure 1). In total, 59 pollen assemblages were studied.
The macroflora was mainly collected in six outcrops from the Bellver sub-basin. More than 2000 specimens were examined. These are currently housed in several centres: the Natural History Museum of Barcelona, the Spanish National Museum of Natural History (MNCN-CSIC), the Geological Museum of the Seminary of Barcelona, the Institut Català de Palaeontologia Miquel Crusafont, the Institut d’Estudis Ilerdencs and the Geomining Museum (Spanish Geological Survey-CN IGME-CSIC) [23].
The principal component analysis (PCA) was used to observe the underlying trends in the palynological data and obtain a better grasp on the environmental factors at play. The PCA was carried out using the software PAST 3.17 [38]. The dataset was checked for linearity (strong correlations were found) and standardized. Two PCAs were carried out, one for terrestrial pollen taxa with >1% proportion of the total pollen sum and a second one including aquatic plants and spore groups with >1% of the total palynomorph sum.

3.2. The Biomization Method

The biomization method aims to reconstruct past biomes using the abundance of palaeobotanical taxa. This procedure was proposed to assign palaeobotanical assemblages to current biomes in a systematic and objective way [39,40] which has been used on its own to reconstruct vegetation [27,41,42,43]. Although the application of the biomization method has been mostly focused on the Quaternary, the method was recently applied to reconstruct Miocene biomes [44]. In the present work, the biomization method was applied to both palynological and macrofloristic assemblages from the La Cerdanya Basin, since the combined evaluation of different organ assemblages (e.g., foliage, fruits and seeds, spores and pollen) is known to yield the most complete picture of the ancient vegetation [29].
Extensive biomization analyses based on PFTs (plant functional types) focusing from Central Europe to the Eastern Mediterranean and to the Caspian region highlight the extent of applicability of the method and conclude that pollen samples from relatively small basins provide more reliable biome reconstructions [41,45]. In this way, the analysis from the fossil assemblages of La Cerdanya Basin was expected to provide an accurate identification of the main biomes that occurred in the late Miocene Pyrenees.
The biomization methodology uses PFTs in order to classify plant taxa. The PFT concept defines and classifies plant taxa by their physiological features, phenology and climate preferences. Generally, taxa are classified into PFTs considering four variables: effective bioclimatic range (warm, tropical, temperate, cool, boreal, arctic, eurythermic), phenology (evergreen, deciduous), leaf morphology (broad-leaved, needle-leaved, sclerophyll, malacophyll) and life form (tree, shrub, forb, vine).
Each biome was defined as a set of dominant PFTs. These dominant PFTs were identified by contrasting the bioclimatic range in which any given PFT occurs, against the geographic range occupied by the biome. If these areas overlapped, the PFT was assigned to the biome.
Following this method, various authors associated groups of taxa with certain PFTs (‘taxon—PFT’ matrix) and groups of PFTs with specific biomes (‘biome—PFT’ matrix). Thus, multiple and distinct ‘taxa-PFT-biome‘ associations exist, using different PFTs and biome classifications. Some of these associations were tested and proved useful at reconstructing Quaternary vegetation [41,42,43]. The ‘taxon—PFT—biome’ association employed in the present study is a modified version of an association elaborated from surface pollen samples of China [42], covering a wide range of bioclimatic regions. This association was modified with the addition of Miocene taxa that were not present in the original dataset such as Buxus, Cathaya, Cedrela, Cistus, Clethraceae-Cyrillaceae, Daphnogene, Frangula, Linum, Parrotia, Parthenocissus, Sciadopitys, Sequoia and Smilax. These taxa were included by assigning them to one or more PFTs. Since most of these genera are extant, they were assigned to PFTs on the basis of their modern life-forms. In the case of the extinct Daphnogene, the modern genus Cinnamomum was used as nearest living relative. A similarly modified version of this PFT association proved successful at reconstructing Miocene biomes in the Caucasus region [44]. The employed PFT association is shown in full in Supplementary Materials S2.
All taxa were classified based on PFTs (‘taxon—PFT’ matrix) and biomes were defined as a unique set of PFTs (‘PFT—biome’ matrix). Multiplying both matrices produced a ‘taxon–biome’ matrix. The affinity scores of each pollen and macrofloral assemblage to the biomes was calculated using the Biomise 3 software (Ben Smith, Lund University), which analyses the assemblages employing the formula below (1) [39].
A i k = Σ j   δ i j m a x 0 , p j k θ j
where Aik represents the affinity of pollen sample (k) for biome (i); summation is over all taxa (j); δij is the entry in the ‘taxon-biome‘ matrix for biome (i) and taxon (j); pjk are the pollen percentages, and θj is the cut-off value. A cut-off value of 0.5 was employed to ensure that small or single occurrences would not skew the results. Azonal taxa (e.g., hygrophytes and ferns) were not included in the analysis, as they do not add discriminatory value.

3.3. Vegetation Maps

Regarding the method for creating vegetation maps, the present work followed the approach previously employed to recreate maps of the ancient vegetation units during glacial and interglacial periods for southern Spain [27]. The method follows these steps:
Step 1: Palaeoecological reconstruction. In this step, the different ancient vegetation units are reconstructed and defined based on fossil data.
Step 2: Identification of modern analogue vegetation units and environmental constraining parameters. This step identifies modern vegetation units that are comparable to the targeted ancient vegetation in terms of taxonomic composition. Then, the environmental parameters that constrain the extent of the vegetation units are identified (e.g., temperature, precipitation, soil humidity).
Step 3: Outline mapping units. In this step, the environmental range of the analogue vegetation units (step 2) is delimited; this produces the range in which the analogue vegetation occurs naturally. This range is then extrapolated to the ancient vegetation units (step 1). In this way, the ancient units are outlined within measured environmental parameters.
Step 4: Palaeoenvironmental reconstruction and mapping. This step uses palaeoenvironmental data to map the constraining environmental parameters and their spatial variation over the study area.
Step 5: In the final step, the ancient vegetation units are mapped by entering their known environmental ranges into the reconstructed map.
The steps described above were followed in order to create maps of the different vegetation types during the Late Miocene in the La Cerdanya Basin. Step 1 defines the Miocene vegetation units. These were defined following the three zonal vegetation types described in chapter 2. These being: semi-open woodlands, deciduous forests and mountain forests of deciduous and conifer taxa [9].
For step 2, it was necessary to identify modern vegetation relatively similar to the one inferred from the study of the fossil flora, to act as modern analogue. The Tortonian and early Messinian palaeoclimatic data from the La Cerdanya Basin indicate a mean annual temperature (MAT) of 13.3–14.5 °C and a MART (mean annual range of temperature) of 24.2 °C [9]. These values, together with the taxonomic composition of the fossil assemblages, allowed to compare the fossil flora with the mixed mesophytic forests of the Northern Hemisphere [46] and the deciduous forest of Asia [47]. Specifically, the La Cerdanya ancient forests are comparable to modern eastern Asian deciduous forests that occur between 33° N and 42° N. Certain vegetation type groups from these latitudes in China were assigned as analogues to the ancient vegetation units of the La Cerdanya. These groups were: broadleaf forest, mixed needleleaf and broadleaf forests and needleleaf forest [47].
Modern and ancient Pyrenean vegetation is heavily constrained by differences in altitude, since such abrupt elevation changes inherently carried changes in precipitation and temperature, which governed the presence or absence of the different vegetation types or biomes. Therefore, altitude was identified as the environmental factor constraining the distribution of vegetation in the La Cerdanya Basin during the Miocene.
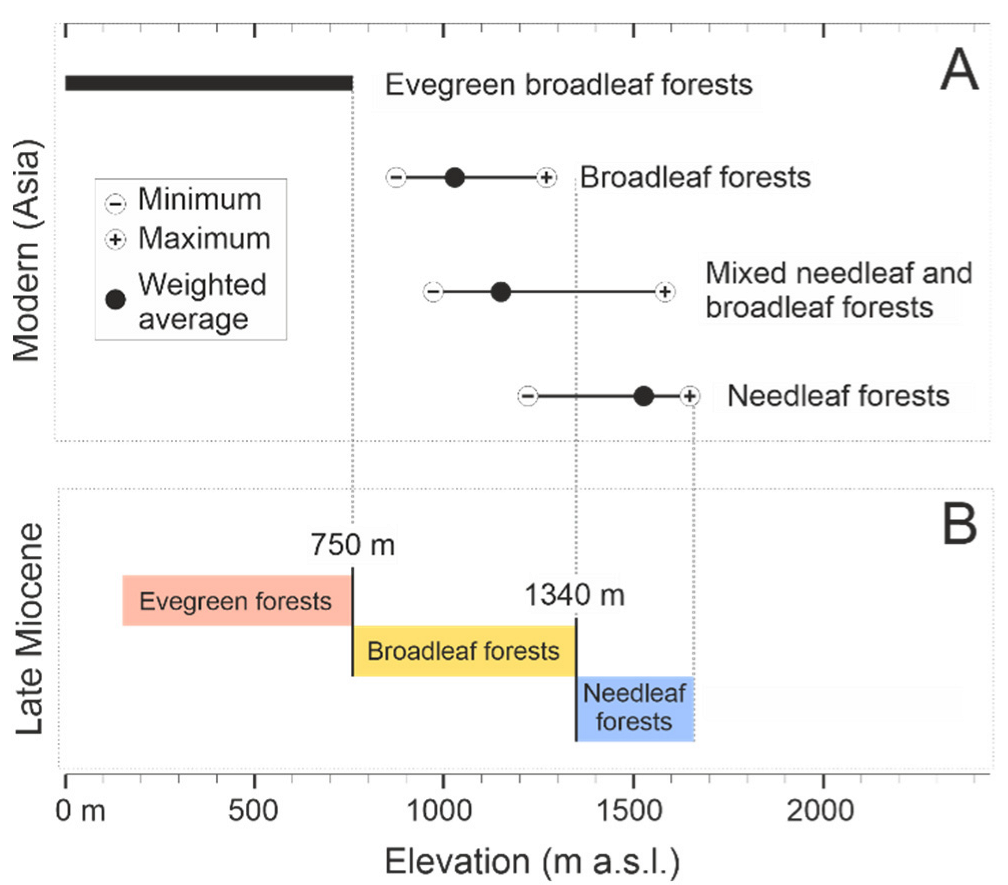
Following step 3, the method required obtaining the altitude ranges in which the modern analogue Asian vegetation units occur. The geographical analysis of digital elevation models (DEM) [48] and the Chinese vegetation maps [47] allowed extracting the elevation ranges for the vegetation types selected as analogues (Figure 3A). This analysis was carried out using the QGis v3.28 software.
Since the employed Chinese vegetation map did not classify the evergreen forests as a different vegetation type group, the elevation range of this vegetation type was taken from the description of modern Japanese floras in the Honshu Island [49]. Modern Japanese floras were previously identified as the more similar modern vegetation to the palaeoflora of the La Cerdanya based on CLAMP data [26]. Thus, the elevation range for the Evergreen Broad-Leaved Forest region from Honshu Island (0–750 m a.s.l.) was incorporated as the range for the evergreen mixed woodlands of the La Cerdanya (Figure 3A). All these ranges were then assigned to the Miocene vegetation units (Figure 3B).
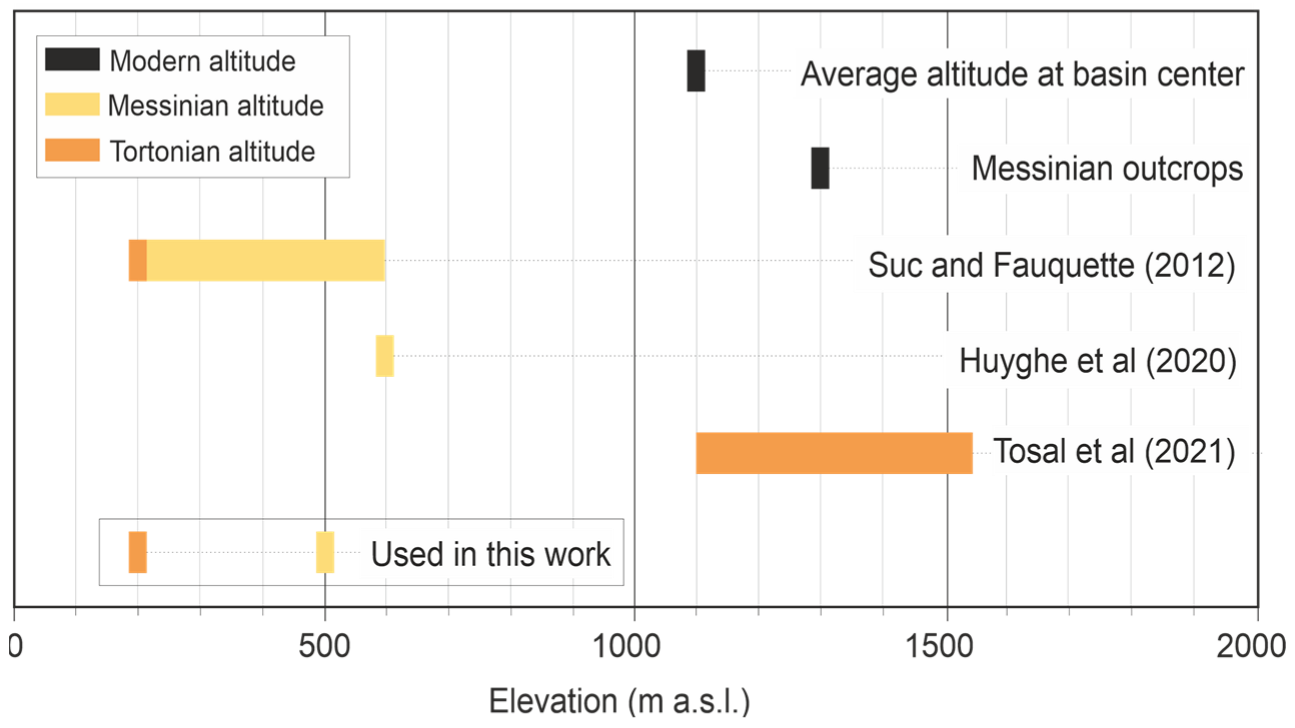
For step 4, the elaboration of vegetation maps required measurements of the palaeoaltitude of the Axial Zone during the Tortonian and Messinian stages. Several studies carried out palaeoaltitude assessments with the objective of defining the elevation of the La Cerdanya Basin and the surrounding areas of the Pyrenees during the Miocene. These studies employed different methodologies, using CLAMP data [26], palaeobotanical assemblages [50] and isotopic analyses [51]. The resulting palaeoaltitude measurements did not reach a clear consensus (Figure 4). Isotope and palaeobotany-based reconstructions provide an elevation of ca. 200 m for the basin during the Tortonian and of ca. 200 to 600 m during the early Messinian [50,51]. These values indicate that most of the Pyrenean uplift occurred during the late Miocene and were in agreement with altitude reconstructions for other areas of the eastern Pyrenees [52]. As opposed to these measurements, the CLAMP-based approach indicated a Tortonian elevation of 1100–1550 m, indicating that most of the uplift took place before the Late Miocene, although these authors indicated that further studies are needed in order to refine the CLAMP-based measurement [26]. Recent geomorphological, tectonic and stratigraphical evidence indicates that the Axial Zone underwent significant uplift during the Late Miocene [53,54]. Therefore, in order to reconstruct the elevation of the basin as accurately as possible, this work considered the relatively lower altitude reconstructions. Thus, approximate elevations of 200 and 500 m were selected for the Tortonian and Messinian stages, respectively (Figure 4). These values were incorporated into two digital elevation models (DEM) (based on elevation data from [55]) recreating the altitude of the basin. Regarding the general topography of the basin, it was proposed that the basin and its surrounding areas were similar to the relief configuration seen today, based on relatively homogeneous uplift rates [17].
Finally, during step 5, the altitude ranges were introduced into the palaeoelevation maps, creating the vegetation maps for the Tortonian and early Messinian.

4. Results

The PCA diagram for the main terrestrial pollen taxa (>1% proportion) (Figure 5A) identified a first principal component (PC1), which was responsible for 42.03% of the total variance of the dataset. PC1 discriminated between samples with higher pollen content of arboreal elements and samples with higher content in Alnus and Taxodium. Similarly, the second component (PC2), responsible for 19.69% of the variance, grouped together Alnus Poaceae, Pterocarya, Ulmaceae and Taxodium, with highest loading scores, and discriminated them from Abies, Quercus and Cupressaceae, with the lowest scores.
Thus, both components discriminated between samples rich in pollen from Alnus, Taxodium, Pterocarya and Poaceae and samples rich in other arboreal pollen groups. The second PCA included the main hygrophytic groups of aquatic plants and fern spores (Figure 5B). This PCA indicated that PC1 (31.72%) separated mostly tree taxa (except Alnus and Pterocarya) from Taxodium, fern spores and hygrophyte groups (Typhaceae and Nymphaceae). The PC2 (17.74%) separated Abies, Cupressaceae and Quercus from Alnus, Pterocarya, Poaceae, ferns and Ulmaceae.
Examining the placement of pollen samples in both PCAs, it can be appreciated that almost all samples from the Sanavastre mines were placed on the negative sector of PC1 and gradually expanding into high values of PC2. Most of these samples were influenced by the abundance of hygrophytes, ferns and Alnus. Regarding the Bellver lake section, most samples fell to the right of the diagram on positive first component values due to high content of arboreal pollen. However, samples from the top of the sequence, from the Can Vilella site of Messinian age, all scored negative PC1 values and fell to the left of the diagram.

Biome Reconstruction

The biomization method allowed to recreate the most likely biome from fifty-nine pollen assemblages and six macrofloristic assemblages, covering an age between Tortonian to early Messinian and different geographical areas and depositional environments within the La Cerdanya Basin. The employed biome classification [42] defined a total of nineteen biomes, out of which only four biomes achieved the highest affinity score at any point during the analysis of all fossil assemblages. These were the biomes: warm-temperate evergreen broadleaf and mixed forest (WTEM), temperate deciduous broadleaf forest (TEDE), cool mixed forest (COMX) and cool evergreen needleleaf forest (COEG). The complete biome scores for all studied assemblages are given in Supplementary Materials S3. A list of taxa and their associated biomes is given in Supplementary Materials S4.
The WTEM biome is described as a biome in which warm-temperate evergreen trees dominate, but with presence of temperate and warm-temperate deciduous trees [42]. It is represented in the La Cerdanya fossil assemblages by multiple arboreal taxa, but it is diagnostically differentiated from other biomes by the presence of taxa such as Lauraceae, Myricaceae, taxodioids, Engelhardia, Platycarya, Castanopsis or Cedrela. The TEDE biome represents the temperate and mostly deciduous forests growing in the basin, represented by deciduous temperate arboreal taxa such as Betula, Ostrya, Corylus, Juglans, Tilia, Castanea, Zelkova and Ulmus. Other warm-temperate taxa contribute both to TEDE and WTEM, such as Quercus, Fagus, Alnus, Acer, Fraxinus or cupressoids. The COMX and COEG biomes are represented mainly by conifer trees such as Picea and Abies but also by deciduous trees from temperate and cool climates such as Betula. Biome scores for COMX and COEG were persistently tied in value when scoring the highest values of any given pollen assemblage and, thus, being tied as the most likely biomes. This was due to a lack of diagnostic taxa in the datasets (such as Carpinus or Cornus); therefore, the analysis was unable to distinguish between these two biomes in most cases.
Pinus was one of the most abundant arboreal pollen taxon in the samples; however, this pollen type should be handled with care, since its abundance can point to a taphonomic overrepresentation due to the high pollen-production of pine trees and the excellent buoyancy and long anemophilous transport of the pollen grains [56]. In order to account for this effect, the biomization analyses were repeated excluding Pinus pollen. This led to a higher relative proportion of other pollen groups, pushing some of them above the 0.5 cut-off limit. Nonetheless, overall affinity scores suffered minimal changes. Therefore, it was concluded that the abundance of Pinus pollen was not obscuring other environmental trends and the group was included in the presented results.
Biome affinity scores for the Bellver lake section (Table 2) showed a clear difference between samples from the Tortonian (B3, BB, BS and TV) and Messinian stages (CV). The Tortonian samples indicated relatively similar affinity scores, with the biome of highest affinity alternating between TEDE (avrg. score 19.3) and the conifer biomes COMX (avrg. 19.4) and COEG (avrg. 19.2). WTEM (avrg. 18.2) scores lower average values and did not achieve the highest score in any of the Tortonian samples. However, the analysis of the Messinian samples from the CV site indicated a fall in scores for all biomes except WTEM (avrg. 18.5 in CV samples), which achieved the highest scores.
Regarding the lignite mines from the Puigcerdà sub-basin, the biomization analysis resulted in only two main biomes in the Sanavastre section (Table 3), TEDE (avrg. 17.8) and WTEM (avrg. 17.9). Generally, these two biomes showed similar scores, always higher than the conifer biomes (avrgs. 15.3 to 15.1). In the lower half of the samples, the dominant biome was TEDE, while in the younger samples from the upper half. the prevalent biome was WTEM.
The second lignite mine, the Sansor section (Table 4), showed a similar alternation between TEDE (avrg. 16.2) and WTEM (avrg. 16.3) for the majority of the section, with the exception of samples MSP27 and VSP1 in which the two conifer biomes were tied for the highest affinity scores. The uppermost samples indicated high affinity score for the TEDE biome.
Considering the sites with macro-remains (Table 5), all fossil assemblages indicated WTEM as the biome with the highest affinity scores. On average, WTEM achieved an affinity score of 29.2, followed by TEDE with 23.3, COMX with 19.6 and COEG with 15.9. Unlike the results from the pollen assemblages, the biomization results for the macrofloristic assemblages highlighted a much wider difference in affinity scores.
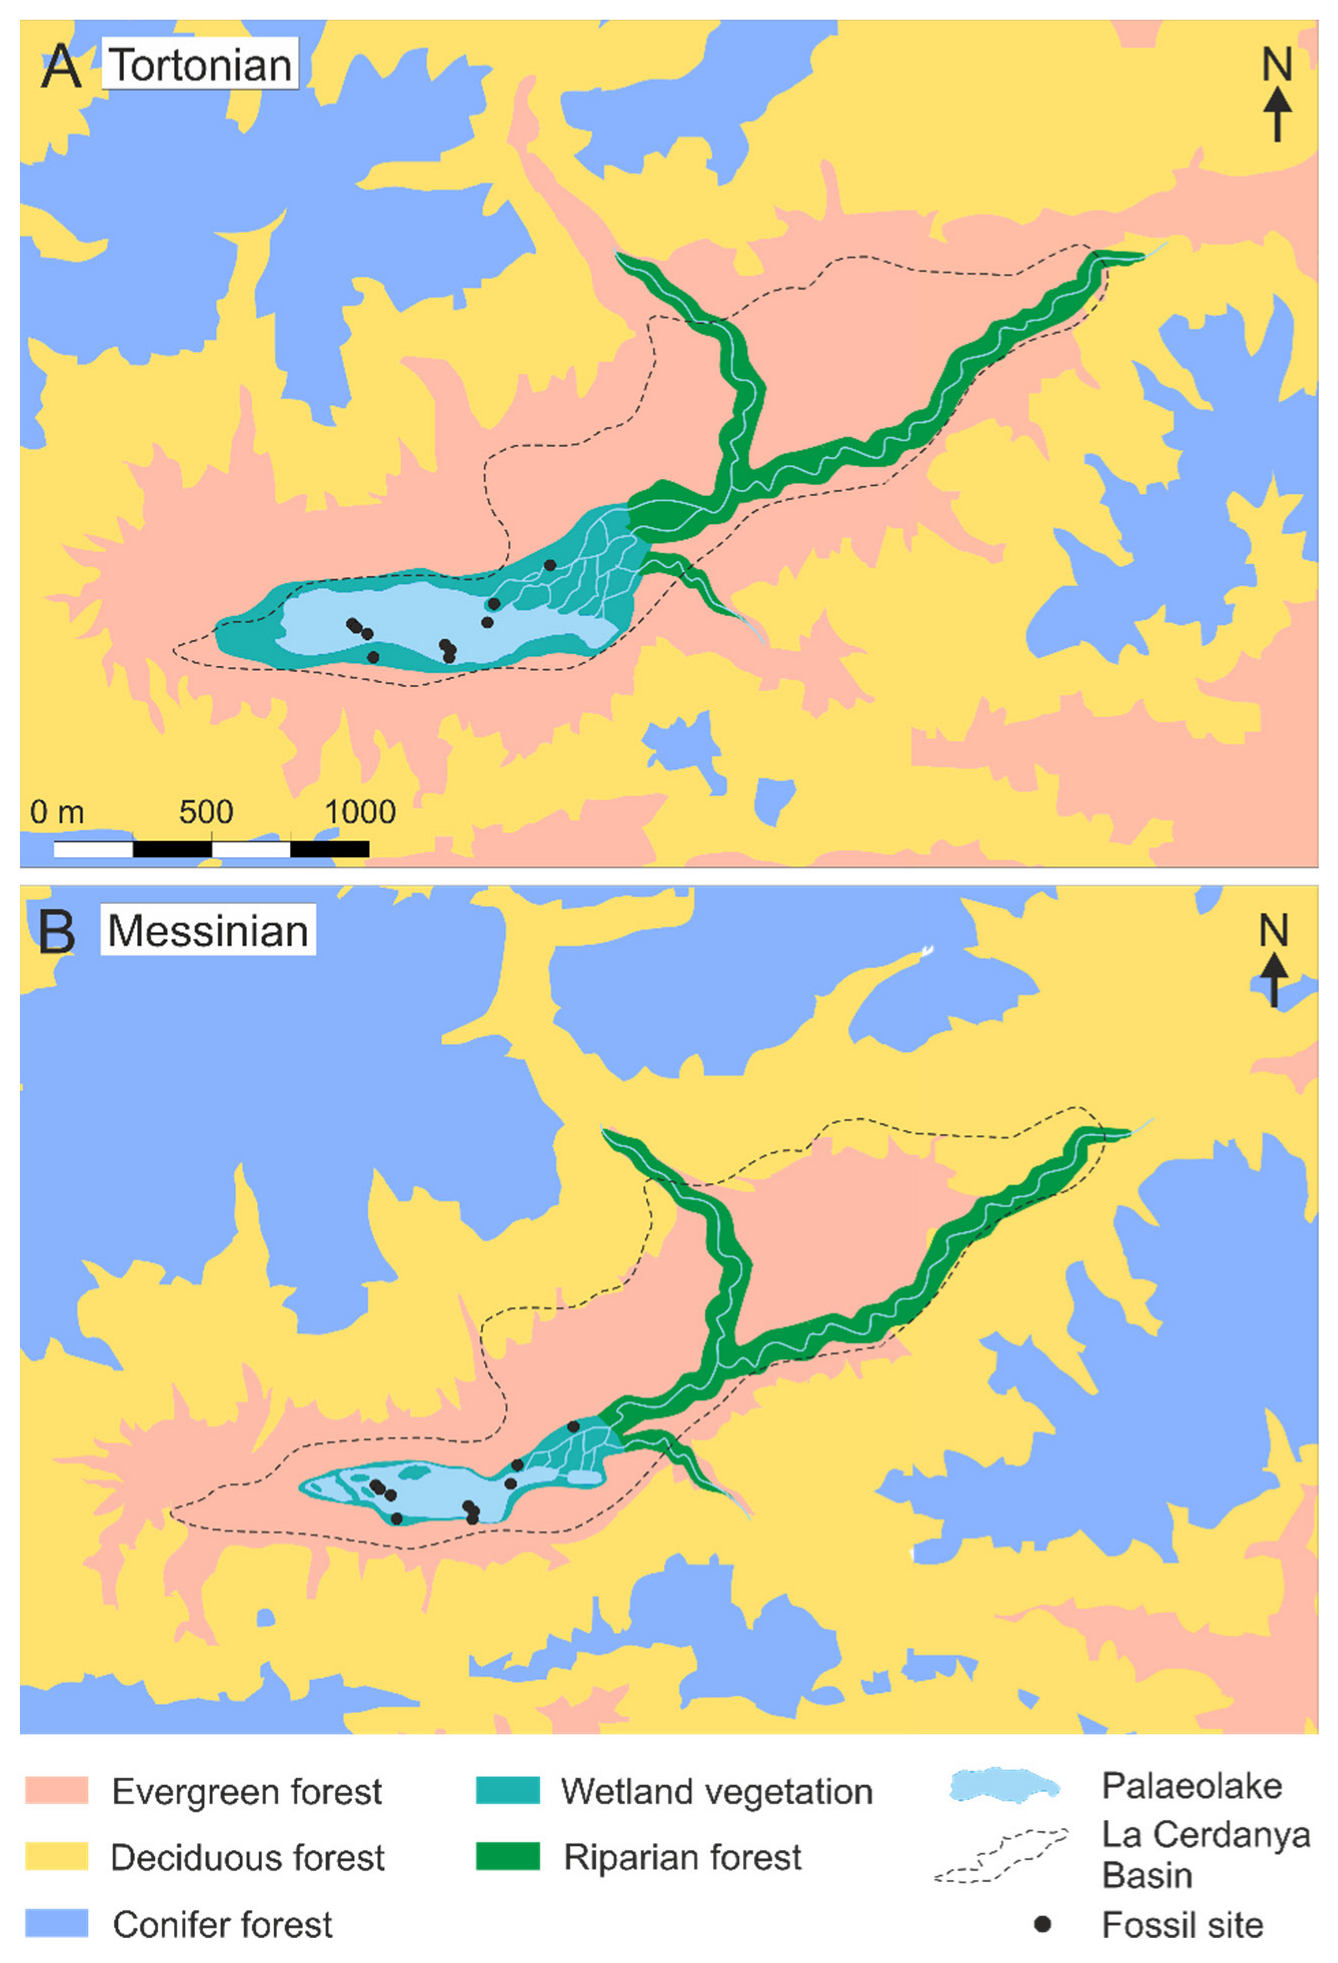
The application of the mapping methodology resulted in two vegetation maps, which featured the extent of the forested biomes in the La Cerdanya Basin for both the Tortonian and the early Messinian (Figure 6). The zonal vegetation types (WTEM, TEDE and COMX/COEG) were reconstructed based on the biomization analysis and the mapping method. The distribution of the azonal vegetation (wetland and riparian) was mapped based on geological maps [14], which indicate the extent of the lake deposits and the areas of greater subsidence. Subsidence was higher along the western block of the La Tet Fault and likely hosted fluvial environments with associated riparian forests. The wetland vegetation occurred predominantly in the surroundings of the lake system and in the deltaic environments formed in the NE margin of the lake [14,16].

5. Discussion

5.1. Environmental and Taphonomical Considerations

The PCA results (Figure 5) indicate a strong variance among the pollen assemblages from the La Cerdanya Basin and provide a valuable insight into the environmental dynamics in control of the abundances and composition of the fossil assemblages. The main environmental variance affecting the pollen samples can be understood as the competing influence of pollen from local or parautochthonous plants (growing in or adjacent to the depositional environment) and the influence of pollen from allochthonous plants growing at different locations of the basin and at different altitudes.
The PC1 discriminates between parautochthonous hygrophilous and riparian flora against allochthonous tree taxa. On the other hand, PC2 indicates the influence of the altitudinal component, as it separates Abies, Quercus and Cupressaceae from Alnus, Taxodium, Pterocarya, ferns, Typhaceae, Ulmaceae and Poaceae. The former were most likely found in mountain slopes, while the latter were common components of the wetland and riparian vegetation.
The taphonomical control in the palynological assemblages is in agreement with previous taphonomic analyses [22,34], which indicate that pollen grains from the sections located in the Puigcerdà sub-basin, and the Can Vilella site in the Bellver sub-basin, represent mostly parautochthonous and allochthonous taxa growing in alluvial plains. Most pollen samples from these sites fall within negative PC1 scores (Figure 5A). On the other hand, pollen from sites formed in the lacustrine environment of the Bellver sub-basin (BB, B3, BS, TV) would represent mostly allochthonous pollen grains deposited in the lake environment.
Pollen samples from both mines are strongly influenced by riparian and marshland vegetation, which would have composed the main vegetation groups of the fluvio-deltaic and wetland environments of the Puigcerdà sub-basin [22,34]. For the composite section of Bellver lake section, the basal samples (BB, B3) are influenced by wetland environments, while the samples of BS and TV show a stronger influence of allochthonous pollen (from conifers) deposited on a lacustrine setting. Finally, samples from the Messinian site of Can Vilella (CV) are placed again on negative PC1 scores, pointing to a wetland environment.

5.2. Biome Characterization

Previous palaeoclimate assessments [9,26] found that Late Miocene climatic parameters are consistent with the existence of a temperate mixed evergreen and broadleaved-deciduous environments in the La Cerdanya Basin. The diverse riparian and hygrophilous components of the vegetation also indicate the presence of riparian forests associated with the humid environments of the lake shore of the Bellver sub-basin and the riparian and deltaic environments of the Puigcerdà sub-basin. Furthermore, the application of the integrated plant record (IPR) analysis [9] showed that La Cerdanya miospore and macrofloristic assemblages correspond to mixed mesophytic forest vegetation.
Although these existing reconstructions provide a general view of the Late Miocene vegetation, the biomization analysis presents new information about the vegetation formations and their extent in the basin. Thus, the biomization method indicates the co-occurrence of the biomes WTEM, TEDE and COMX/COEG, showing similar affinity scores. Rather than placing the La Cerdanya Basin within the range of a single biome sensu stricto, the occurrence of multiple biome types points to the existence of different vegetation types. These vegetation types coincide with those described as present in the La Cerdanya Basin during the taxonomical analysis of the palaeofloras [9]: evergreen mixed woodlands (represented by WTEM), deciduous mixed forests (TEDE) and mixed montane forests (COEG/COMX).
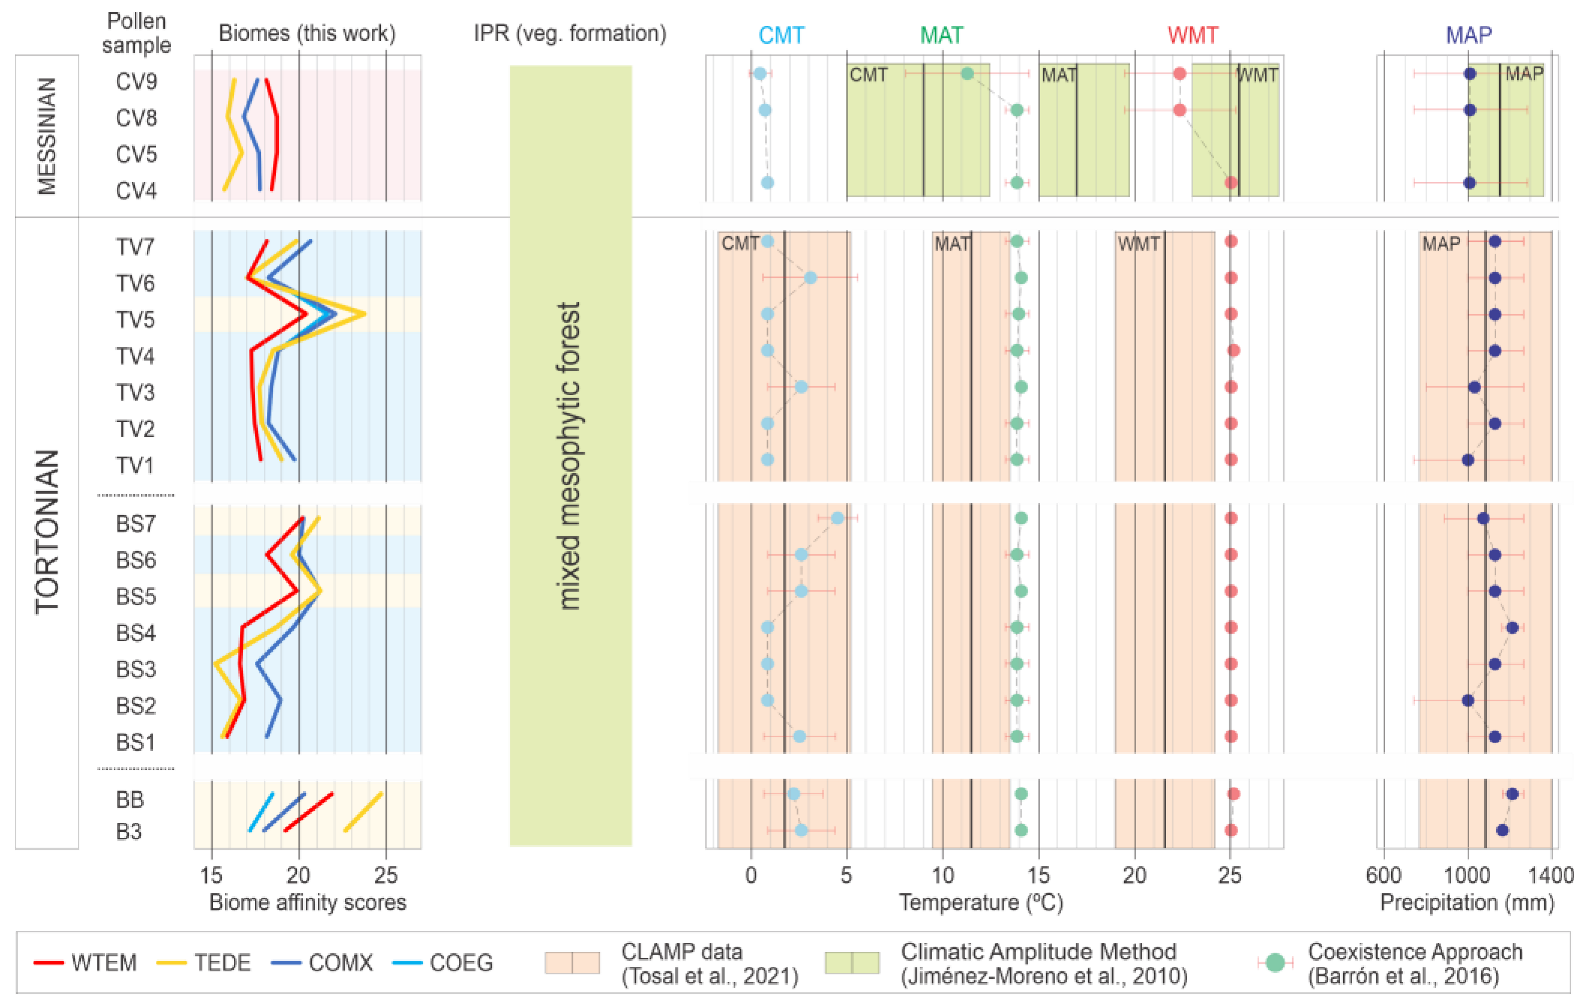
The biomization results for the Sanavastre mine section (Figure 7), in the Puigcerdà sub-basin, revealed the predominance of two vegetation types, WTEM and TEDE. Generally, the lower half of the section indicate that TEDE achieved the highest affinity scores, while in the upper half, WTEM was the dominant vegetation. When compared with existing palaeoclimate data [9], it can be observed that temperatures are generally lower in upper half of the section, although no correlation was identified with the decrease in TEDE. The values for mean annual precipitation (MAP) indicate that the middle of the section experienced lower precipitation, coinciding with the main change from TEDE to WTEM. One possibility for the lowering of the TEDE and COEG/COMX scores is that the deciduous forests were less prominent due to the reduction in MAP. Still, the differences in score between these values was often of only a few decimal values, so the changes between biomes of highest score seen in the section could indicate relatively small environmental shifts rather than abrupt climate changes.
The Sansor mine section showed a similar pattern as described for the Sanavastre mine, the alternation between the WTEM and TEDE vegetation (Figure 8). The main difference was that the conifer forests (COMX and COEG) achieved the highest affinity scores in two levels: MSP27 and VSP1. In the case of MSP27, the prevalence of the conifer forests coincided with low temperatures, as indicated by CA data [9]. Still, a similar case for sample VSP1 did not appear correlated with lower temperatures. The lowering of temperatures drove the downward expansion of the conifer forests in the mountain slopes surrounding the basin, placing them closer to the depositional environments of the Puigcerdà area.
Regarding the Bellver lake section (Figure 9), previous CA palaeoclimate values [9] showed few climate changes between the Tortonian and the Messinian parts of the section. The dominant vegetation types in the Bellver area of the La Cerdanya Basin during the Tortonian were the cool conifer and mixed forests (COMX and COEG) and the deciduous forests (TEDE), organised in different altitudinal vegetation belts. Despite relatively lower WTEM affinity scores, mixed evergreen woodlands were present in the lowlands of the basin, between the deciduous forests and the wetlands vegetation (Figure 6). Still, the low values indicate a relatively smaller pollen contribution into the lacustrine environment.
As described for the results of the Sansor section, the alternation between TEDE and COMX/COEG could point to the vertical displacement of the vegetation belts present in the mountains surrounding the basin due to the alternation between cooler and warmer climate periods. Previous palaeoclimate reconstructions seem to support this interpretation [9], as samples indicative of lower MAP generally indicate COMX/COEG, while higher mean temperature of the coldest month (CMT) values are associated with higher affinity scores for TEDE (Figure 9).
Results indicate a different configuration during the early Messinian, as the vegetation type with the highest affinity score for the samples from the CV site is the warm-temperate broadleaved evergreen mixed woodlands (WTEM). This change, together with the reconstructed vegetation maps (Figure 6), indicates that the mixed broadleaved evergreen woodlands had a greater influence into the lacustrine system of Bellver. As previously identified [9,17,57], the main vegetation change between the Tortonian and Messinian pollen samples of the CV site was the increase in the herbaceous component, which suggests an increase in dryness. The increased influence of WTEM during the Messinian seemed to be provoked by a small decrease in precipitation and cooling, as identified by CA analysis [9] (Figure 9). This would reduce the wetland vegetation, replaced by mixed evergreen woodlands. Despite this, the ordination of the Pyrenean vegetation into different altitudes ensured the occurrence of deciduous forests and conifer forests at different vegetation belts (Figure 6).
Regarding the biomization analysis for the macrofloristic associations, all assemblages point to WTEM as the most likely vegetation type in the basin during the Tortonian (Figure 10). This uniformity was expected, as remains at these sites experienced similar taphonomic processes [9,22,34]. Furthermore, the sites were all found within the lacustrine facies of the Bellver sub-basin and, therefore, recorded primarily autochthonous and parautochthonous taxa growing near the lake shore; thus, all sites contained relatively similar taxonomic proportions and diversity. In the macrofloristic assemblages, WTEM scored much higher affinity scores (avrg. 29.3) than when scoring the highest score in pollen samples (avrg. 17.4), and with a higher value difference against the secondary biome types. Clearly, the WTEM biome was better defined from macrofloristic assemblages than from pollen assemblages. This effect reflects a taphonomic bias between production and transport of pollen grains and macrofloristic remains. One example of this bias was that the WTEM biome was especially well characterised by the laurel family (Lauraceae). This group is well represented in the leaf assemblages but it is known to be underrepresented in pollen samples due to its easily degradable pollen exine [35]. Because of this taphonomic effect, it is likely that the extent of the WTEM biome was underrepresented in the results from the pollen samples.
Generally, the discussed biomes show relatively similar affinity scores from the analysis of pollen assemblages. The biome with the highest and the second-highest score usually differ by less than one point. However, the scores from the analysis of the macrofossils indicate differences of ca. six points between WTEM and TEDE, and more than ten with the conifer biomes. In this way, the macrofloristic analysis confirmed the existence of well-differentiated biomes and distinct broadleaved evergreen mixed woodlands in closer proximity to the lake system. Still, a certain degree of mixing between the different vegetation types is expected to occur in the ecotones and small valleys.
As we mentioned above, the ancient vegetation of the La Cerdanya would be structured in a similar manner as the modern vegetation in eastern Asian forests found between 33° N and 42° N, although a great part of the modern natural vegetation was destroyed or seriously altered over several millennia of human activities [47,58]. The dominant trees of these canopies are broad-leaved deciduous trees dominated by Alnus and Quercus species, along with a diverse array of broadleaved hardwoods including Betula, Fagus, Ulmus, Tilia, Acer, Populus, Celtis, Juglans, Carpinus, Fraxinus and many others. Broad-leaved evergreen trees and shrubs are a minor element in terms of abundance, but still common (Ilex, Myrica, Cyclobalanopsis, Castanopsis, Ligustrum). Conifers are well represented in these forests by Pinus such as P. densiflora and P. tabulaeformis. In addition, Torreya, Cephalotaxus, Taxus, Juniperus, as well as Tsuga, Abies, Picea and Larix, grow on mountain slopes at higher elevation [59,60,61]. Today, these forests are well represented in the Shantung and Korean peninsulas [59,61].

5.3. Distribution of Late Miocene Biomes

As the vegetation maps (Figure 6) indicate, the Miocene floras of the La Cerdanya Basin were organised into biomes compatible with the vegetation belts described above and potentially occurred within similar altitude ranges. Nonetheless, as discussed previously, the pollen sequences hint at a changing climate and vegetation. Therefore, a degree of uncertainty is entered into the biome maps, since such small climate changes would modify the altitude ranges in which each biome existed. Additionally, the border between the units would be ecotone areas where a certain degree of mixing would be expected.
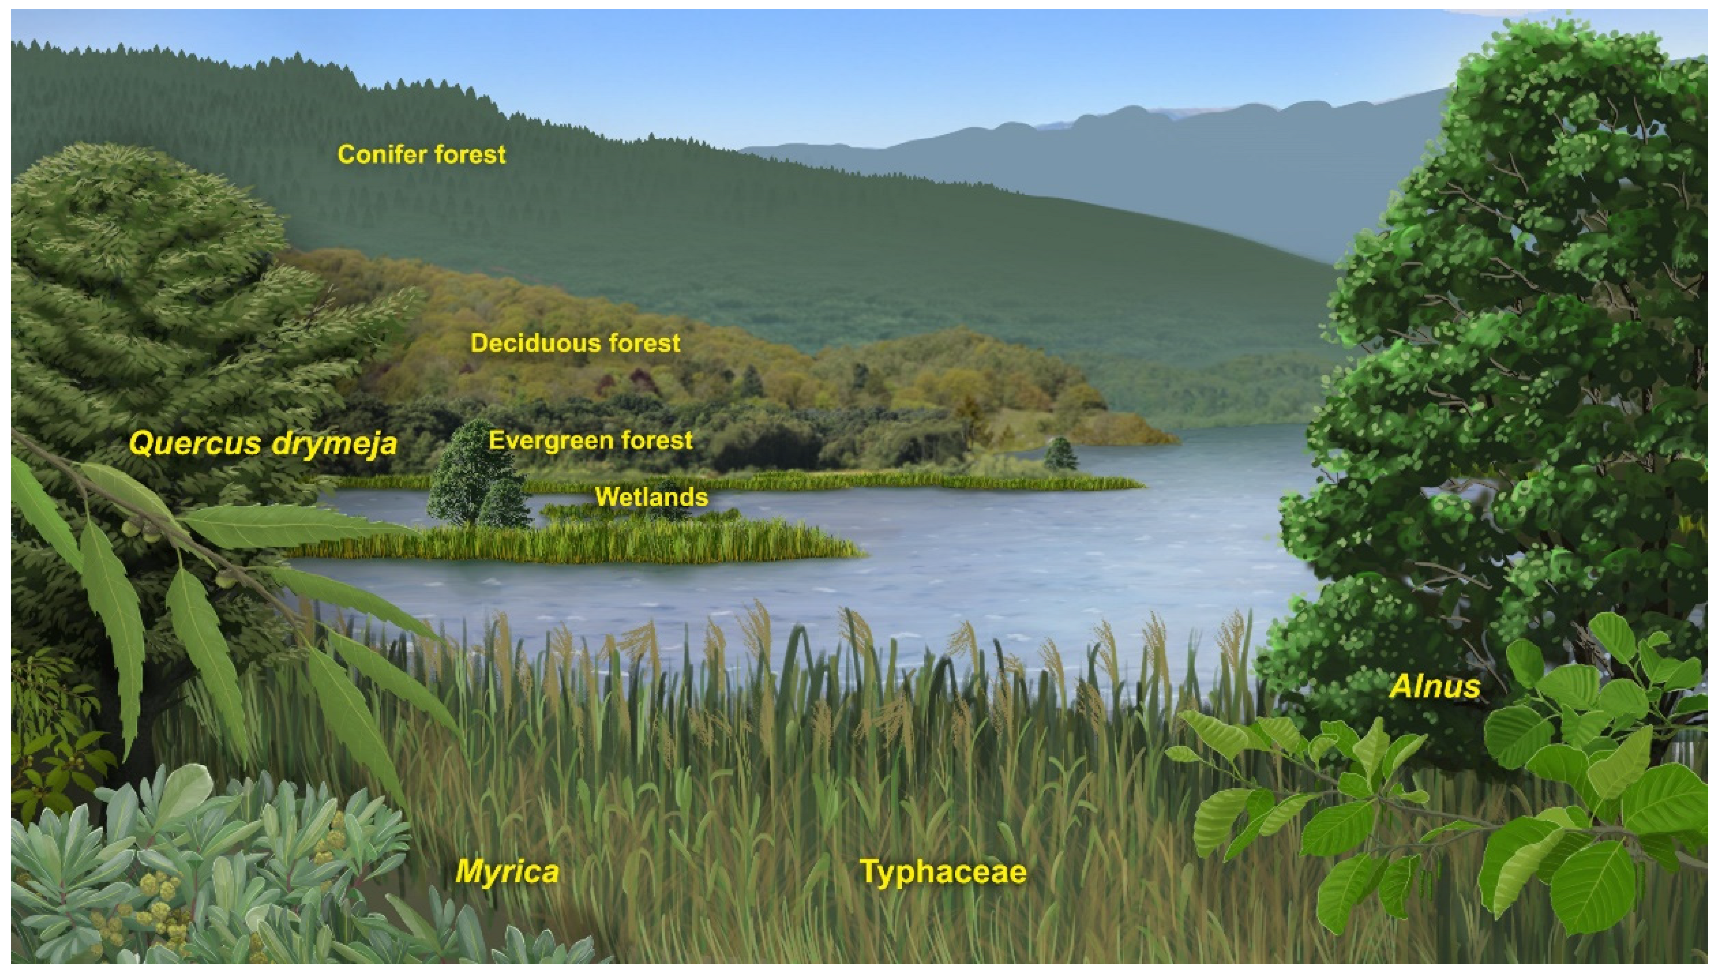
The vegetation belt of lower altitude, below approximately 750 m, would feature the broadleaved evergreen mixed woodlands (WTEM type). The vegetation growing on this belt would feature a sort of nothophyllous forest, with a predominance of evergreen species of Lauraceae and Fagaceae (i.e., Quercus drymeja and Q. mediterranea) but with the inclusion of some deciduous taxa such as Acer, Fraxinus and Alnus in the more humid areas. Cryptomeria anglica probably inhabited this belt, on the areas of lower altitude. The deciduous forests (TEDE type) were found between approximately 750 and 1340 m, at the feet and slopes of the high mountain chains surrounding the basin, and formed mainly by deciduous species from temperate environments such as Fagus, Betula, Corylus, Quercus, Acer or Tilia. The conifer forest (COMX/COEG type) is found only in the areas of higher altitude (ca. >1340 m). These forests were mostly represented by Pinus, Picea, Abies and Cathaya, and mixed communities of conifers and deciduous species (Figure 11).
The vegetation map for the Tortonian stage (Figure 6A) shows the broadleaved evergreen woodlands as the dominant forest type in the lowlands of the Puigcerdà sub-basin. This is in agreement with the pollen sequences from this area, the Sansor and Sanavastre sections, which indicate evergreen mixed woodlands (WTEM) as one of the predominant vegetation types in the area (Figure 7 and Figure 8). These sections also indicate that deciduous forests (TEDE) had high influence in the area, and two options can explain the prevalence of deciduous forests over evergreen mixed forests. On one hand, slight climate cooling would push the deciduous forests vegetation belt downward, displacing evergreen woodlands. On the other hand, the existence of azonal biomes, such as wetlands and riparian forests close to the studied sections would increase the affinity scores for deciduous forests, due the presence of riparian trees also found in deciduous forests Alnus, Salix and Ulmus. The PCA (Figure 5) supports this second interpretation, as it indicates that hygrophyte and Alnus pollen are strong components in the assemblages from the mines. The fluvial and deltaic environments of the Puigcerdà sub-basin hosted riparian and wetland vegetation, while evergreen mixed woodlands were present in the dryer lowlands.
The southern part of the basin hosted the palaeolake, represented by the lacustrine facies of the Bellver sub-basin. Regarding the Tortonian part of the section, the affinity scores indicate an alternation between TEDE and COMX/COEG. Unlike in the Puigcerdà area, in Bellver the narrowing of the basin and the existence of the palaeolake must have left less lowland area to be occupied by vegetation. The lowlands must have been occupied by wetlands and riparian forests. The mountains, in high proximity to the lake, presented deciduous forests in their slopes, while conifer forests dominated the higher vegetation belt. The alternation between the primary influence of these forests into the lake most likely responds to climate changes which would shift the elevation of the mountain vegetation belts closer or farther to the lake catchment area.
The deposits of the Can Vilella site (Bellver sub-basin) record an early part of the Messinian stage. In this part, the affinity scores for all vegetation types decrease, except WTEM, which is singled out as the main vegetation type (Figure 9). The expansion of the broadleaved evergreen mixed woodlands can be contradictory when taking into account that the higher altitude of the Messinian stage pushed down the deciduous and conifer vegetations belts, closer to the lake (Figure 6). Nonetheless, the reduction in MAP during the early Messinian [9] and the increase in herbaceous pollen in the lake environment point to a reduction in precipitation [17]. This, combined with the more constrained extent of the lake due to the progradation of river deltas and alluvial fans [14,16], would reduce the wetland and riparian environments growing in the surroundings of the lake. With the removal of part of the extension of riparian deciduous forests, being replaced with the naturally occurring evergreen woodlands, the pollen intake into the lake surface would increase in favour of the WTEM vegetation type [22]. It must be noted that the change in depositional environment between the Tortonian (lacustrine) and the Messinian (alluvial) materials of Bellver could be partially responsible from the change in the dominating vegetation type seen in the biomization results. The lacustrine deposits record a broader pollen signal while the alluvial ones record pollen from plants growing in closer proximity.
Unlike previous attempts to map Neogene vegetation [28,29], these vegetation maps describe the extent of the different Miocene vegetation types over a relatively small area. These types of maps are a valuable reconstruction, depicting the structure of the vegetation into different altitude belts. Since these vegetation maps rely heavily on palaeolatitudinal reconstructions, more accurate palaeoaltitudinal data would improve the vegetation maps. Additionally, these maps represent a simplified representation of the vegetation and do not take into account that smaller climate changes could shift the extent of the represented vegetation units. The existence of such relatively small changes were shown in the existing climate data [9] and seem to have an impact in the dominant biome.

5.4. Palaeoclimate Trends and Comparison with Other Areas

Significant aridification and cooling processes were identified throughout the Tortonian to the Messinian in the Iberian Peninsula and northern Africa [1,62]. In the present study, a similar increase in aridity during the Tortonian and the early Messinian may explain the increase in influence of the broadleaved evergreen mixed woodlands over the deciduous forests, despite the increase in elevation of the Pyrenean chain. However, no clear signs of a continuous cooling trend can be observed from the biomization analysis. In Central Europe, palaeobotanical analyses identify generalised cooling and a decrease in humidity during the Late Miocene [63], while PFT-based analysis highlights the reduction in the broadleaved evergreen component in favour of the deciduous elements [45].
In the Late Miocene of the Caucasus, a cooling trend is appreciated. This geographical area is of special interest regarding the present study, since the application of the biomization method also reveals environmental trends [44]. Throughout the Tortonian and the Messinian, the WTEM biome is generally dominant in the Caucasus. In second place, the TEDE biome decreases in affinity scores and eventually scores lower affinity than the COMX and COEG biomes that show an increasing trend. Despite the prominence of WTEM in both the La Cerdanya Basin and the Caucasus, this comparison must be taken with care, since the intramontane fluvial/lacustrine setting of La Cerdanya is being compared with pollen records from the Caucasus situated in coastal areas adjacent to the Paratethys Sea.
Although no biomization studies have been carried out in other eastern Neogene Mediterranean locations belonging to the Likudi–Vegora complex, if considering macrofloristic data, it is also possible to differentiate the occurrence of evergreen broadleaved communities with Lauraceae, Fabaceae, sclerophyllous and subsclerophyllous Quercus; deciduous broadleaved ones with Fagus, Ostrya and Pterocarya; and conifer formations with Pinus, Tetraclinis, Cupressus and Cedrus [36,64]. A similar configuration was observed in the analysis of the macrofloras from the Coiron Massif (France) [65], which belongs to the Konin–Joursac complex.
Despite the different age, the Oligocene fossil assemblage of La Val can provide insight regarding the taphonomical processes affecting the La Cerdanya macroflora. The site of La Val also revealed a high proportion of autochthonous and para-autochthonous impressions of Alnus and Pinus, similar to the abundance of these taxa in the La Cerdanya macroflora. As in the La Val site, Alnus in the La Cerdanya basin formed azonal deciduous riparian forests in stream and river margins [66,67]. These azonal forests could also have been present in the wetland and lacustrine environments of the La Cerdanya. In the La Val site, Pinus is represented by allochthonous leaves, seeds and cones transported from nearby mountain areas [66]. This could have been the case as well for some of the Pinus remains present in the La Cerdanya.

6. Conclusions

The application of the PFT-based biomization to the palaeofloras of the La Cerdanya Basin (Late Miocene, NE Spain) allows identifying the main vegetation units. The geographical extent of these units is represented in maps, obtained by the application of a mapping method and accounting for the Late Miocene palaeoelevation of the eastern Pyrenees.
Statistical analyses indicated that the palaeobotanical assemblages of the La Cerdanya underwent significant taphonomic processes. Thus, only the joint study of both micro and macrofloristic assemblages offers an accurate view into the Late Miocene vegetation.
The results of the biomization analysis indicate the existence of three main forest types represented by four biomes: broad-leaf broadleaved evergreen mixed woodlands (WTEM), deciduous forests (TEDE), mixed forests of deciduous trees and conifers (COMX and COEG). These forests had a continuous presence in the basin during the Tortonian to early Messinian. These vegetation types are consistent with previous reconstructions of the late Miocene vegetation of the basin [9].
Overall, while the three described vegetation types alternate as the biome type with highest affinity score, the actual values did not differ much from each other. This indicates that, rather than the installation of a single dominating forest type in the area, multiple forest types occurred in relative geographical proximity, sorted by the geographical configuration of the intramontane basin. Still, the macrofloristic data, with an important component of nothophyllous leaf types of mainly Lauraceae and evergreen oaks, point to a high representation of the evergreen woodlands in the area of the Bellver sub-basin.
The vegetation maps indicate that, during the Tortonian, the areas of lower altitude of the centre of La Cerdanya Basin developed mainly two different vegetation types: evergreen mixed woodlands (WTEM) and deciduous forests (TEDE). These biomes coexisted, although the occurrence of climate changes may have influenced the extent of these two vegetation types. During the early Messinian, uplift caused the conifer and deciduous forest to move closer to the centre of the basin. Still, the reduction in the lake area and the wetland vegetation, together with the instalment of a dryer climate, led to a higher influence of the evergreen woodlands in the areas of lower altitude.
This work presents a new insight into Neogene vegetation maps. While previous efforts mapped vegetation at large geographical scales and broad strokes, the vegetation maps for the La Cerdanya Basin represent vegetation units in detail and over the geographical features of the abrupt intramontane basin.

Supplementary Materials

The following supporting information can be downloaded at: https://www.mdpi.com/article/10.3390/f14071471/s1, Supplementary Materials S1: The complete palaeobotanical dataset employed. Supplementary Materials S2: List of the PFTs inferred from pollen data in the Tortonian and early Messinian sediments of the La Cerdanya Basin. Supplementary Materials S3: Percentages per sample of the different PFTs inferred from pollen and macrofloristic data in the Tortonian and early Messinian outcrops of the La Cerdanya Basin. Supplementary Materials S4 lists all studied taxa and their biome affinities.

Author Contributions

Conceptualization by Y.A., J.M.P.-M., E.B., M.C.-G. and R.M.-D.; application of the methodology by Y.A.; writing—original draft preparation by Y.A., J.M.P.-M. and E.B.; writing—review and editing by Y.A., J.M.P.-M., E.B., M.C.-G. and R.M.-D. All authors have read and agreed to the published version of the manuscript.

Funding

This research received no external funding.

Data Availability Statement

Data is contained within the article or Supplementary Material.

Acknowledgments

This work is a contribution to NECLIME (http://www.neclime.de, accessed on 10 July 2023). We would like to thank the work of the editor and three anonymous reviewers; their comments and suggestions greatly improved this work.

Conflicts of Interest

The authors declare no conflict of interest.

References

  1. Barrón, E.; Rivas-Carballo, R.; Postigo-Mijarra, J.M.; Alcalde-Olivares, C.; Vieira, M.; Castro, L.; Pais, J.; Valle-Hernández, M. The Cenozoic Vegetation of the Iberian Peninsula: A Synthesis. Rev. Palaeobot. Palynol. 2010, 162, 382–402. [Google Scholar] [CrossRef]
  2. François, L.; Ghislain, M.; Otto, D.; Micheels, A. Late Miocene Vegetation Reconstruction with the CARAIB Model. Palaeogeogr. Palaeoclimatol. Palaeoecol. 2006, 238, 302–320. [Google Scholar] [CrossRef] [Green Version]
  3. Utescher, T.; Erdei, B.; François, L.; Mosbrugger, V. Tree Diversity in the Miocene Forests of Western Eurasia. Palaeogeogr. Palaeoclimatol. Palaeoecol. 2007, 253, 226–250. [Google Scholar] [CrossRef]
  4. Ivanov, D.; Utescher, T.; Mosbrugger, V.; Syabryaj, S.; Djordjević-Milutinović, D.; Molchanoff, S. Miocene Vegetation and Climate Dynamics in Eastern and Central Paratethys (Southeastern Europe). Palaeogeogr. Palaeoclimatol. Palaeoecol. 2011, 304, 262–275. [Google Scholar] [CrossRef]
  5. van Dam, J.A. Geographic and Temporal Patterns in the Late Neogene (12–3 Ma) Aridification of Europe: The Use of Small Mammals as Paleoprecipitation Proxies. Palaeogeogr. Palaeoclimatol. Palaeoecol. 2006, 238, 190–218. [Google Scholar] [CrossRef]
  6. Casas-Gallego, M.; Lassaletta, L.; Barrón, E.; Bruch, A.A.; Montoya, P. Vegetation and Climate in the Eastern Iberian Peninsula during the Pre-Evaporitic Messinian (Late Miocene). Palynological Data from the Upper Turolian of Venta Del Moro (Spain). Rev. Palaeobot. Palynol. 2015, 215, 85–99. [Google Scholar] [CrossRef]
  7. Rivas-Carballo, M.R.; Alonso-Gavilán, G.; Valle, M.F.; Civis, J. Miocene Palynology of the Central Sector of the Duero Basin (Spain) in Relation to Palaeogeography and Palaeoenvironment. Rev. Palaeobot. Palynol. 1994, 82, 251–264. [Google Scholar] [CrossRef]
  8. Pais, J. Évolution de La Végétation et Du Climat Pendant Le Miocène Au Portugal. Ciên Terra UNL 1986, 8, 179–191. [Google Scholar]
  9. Barrón, E.; Postigo-Mijarra, J.M.; Casas-Gallego, M. Late Miocene Vegetation and Climate of the La Cerdanya Basin (Eastern Pyrenees, Spain). Rev. Palaeobot. Palynol. 2016, 235, 99–119. [Google Scholar] [CrossRef]
  10. Valle-Hernández, M.F.; Gavilán, G.A.; Carballo, M.R.R. Analyse palynologique préliminaire du Miocène dans le NE de la dépression du Duero (aire de Belorado, Burgos, España). Geobios 1995, 28, 407–412. [Google Scholar] [CrossRef]
  11. Barnolas, A.; Robles, S.; García-Ramos, J.C.; Hernández, J.M. La Cordillera Pirenaica. In Geología de España; Vera, J.A., Ed.; SGE-IGME: Madrid, Spain, 2004; pp. 233–343. [Google Scholar]
  12. Cabrera, L.; Roca, E.; Santanach, P. Basin Formation at the End of a Strike-Slip Fault: The Cerdanya Basin (Eastern Pyrenees). J. Geol. Soc. 1988, 145, 261–268. [Google Scholar] [CrossRef]
  13. Roca, E. Estructura, estratigrafía y evolución tectonosedimentaria de las Cuencas Neógenas de La Cerdanya y Seu d’Urgell (Pirineos Orientales). In Geología de España; Vera, J.A., Ed.; SGE-IGME: Madrid, Spain, 2002; pp. 573–576. [Google Scholar]
  14. Roca, E. The Neogene Cerdanya and Seu d’Urgell Intramontane Basins (Eastern Pyrenees). In Tertiary Basins of Spain. The Stratigraphic Record of Crustal Kinematics; Friend, P.F., Dabrio, C.J., Eds.; Cambridge University Press: Cambridge, UK, 1996; pp. 114–119. ISBN 978-0-521-46171-9. [Google Scholar]
  15. Agustí, J.; Roca, E. Síntesis biostratigráfica de La Fosa de La Cerdanya (Pirineos Orientales). Estud. Geológicos 1987, 43, 521–529. [Google Scholar] [CrossRef]
  16. Anadón, P.; Cabrera, L.; Julià, R.; Roca, E.; Rosell, L. Lacustrine Oil-Shale Basins in Tertiary Grabens from NE Spain (Western European Rift System). Palaeogeogr. Palaeoclimatol. Palaeoecol. 1989, 70, 7–28. [Google Scholar] [CrossRef]
  17. Agustí, J.; Oms, O.; Furió, M.; Pérez-Vila, M.-J.; Roca, E. The Messinian Terrestrial Record in the Pyrenees: The Case of Can Vilella (Cerdanya Basin). Palaeogeogr. Palaeoclimatol. Palaeoecol. 2006, 238, 179–189. [Google Scholar] [CrossRef]
  18. Martin-Closas, C.; Wojcicki, J.J.; Fonolla, L. Fossil Charophytes and Hydrophytic Angiosperms as Indicators of Lacustrine Trophic Change. A Case Study in the Miocene of Catalonia (Spain). Cryptogam. Algol. 2006, 4, 357–379. [Google Scholar]
  19. Rérolle, M.L. Études Sur Les Végétaux Fossiles de Cerdagne. Rev. Sci. Nat. Montp. 1884, 4, 167–191. [Google Scholar]
  20. Rérolle, M.L. Études Sur Les Végétaux Fossiles de Cerdagne (Suite). Rev. Sci. Nat. Montp. 1884, 4, 252–298. [Google Scholar]
  21. Rérolle, M.L. Études Sur Les Végétaux Fossiles de Cerdagne (Suite et Fin). Rev. Sci. Nat. Montp. 1885, 4, 368–386. [Google Scholar]
  22. Barrón, E. Estudio Tafonómico y Análisis Paleoecológico de La Macro y Microflora Miocena de La Cuenca de La Cerdaña; Universidad Complutense Madrid: Madrid, Spain, 1996. [Google Scholar]
  23. Barrón, E.; Postigo-Mijarra, J.M.; Diéguez, C. The Late Miocene Macroflora of the La Cerdanya Basin (Eastern Pyrenees, Spain): Towards a Synthesis. Palaeontogr. Abt. B 2014, 291, 85–129. [Google Scholar] [CrossRef]
  24. Jelgersma, S. Investigaciones Palinológicas de Lignitos Terciarios Procedentes de Cerdaña y del Valle de Arán (Pirineos Españoles). Cursillos Conf. Inst. Lucas Mallada 1957, 4, 159–162. [Google Scholar]
  25. Bessedik, M. Réconstitution Des Environnements Miocènes Des Regions Nord-Ouest Mediterranéennes a Partir de La Palynologie; University of Science and Techniques of Languedoc: Montpellier, France, 1985. [Google Scholar]
  26. Tosal, A.; Verduzco, O.; Martín-Closas, C. CLAMP-Based Palaeoclimatic Analysis of the Late Miocene (Tortonian) Flora from La Cerdanya Basin of Catalonia, Spain, and an Estimation of the Palaeoaltitude of the Eastern Pyrenees. Palaeogeogr. Palaeoclimatol. Palaeoecol. 2021, 564, 110186. [Google Scholar] [CrossRef]
  27. Altolaguirre, Y.; Schulz, M.; Gibert, L.; Bruch, A.A. Mapping Early Pleistocene Environments and the Availability of Plant Food as a Potential Driver of Early Homo Presence in the Guadix-Baza Basin (Spain). J. Hum. Evol. 2021, 155, 102986. [Google Scholar] [CrossRef]
  28. Kovar-Eder, J.; Kvaček, Z.; Martinetto, E.; Roiron, P. Late Miocene to Early Pliocene Vegetation of Southern Europe (7–4 Ma) as Reflected in the Megafossil Plant Record. Palaeogeogr. Palaeoclimatol. Palaeoecol. 2006, 238, 321–339. [Google Scholar] [CrossRef]
  29. Kovar-Eder, J.; Kvaček, Z. The Integrated Plant Record (IPR) to Reconstruct Neogene Vegetation: The IPR-Vegetation Analysis. Acta Palaeobot. 2007, 47, 391–418. [Google Scholar]
  30. Spicer, R.A.; Wolfe, J.A. Plant Taphonomy of Late Holocene Deposits in Trinity (Clair Engle) Lake, Northern California. Paleobiology 1987, 13, 227–245. [Google Scholar] [CrossRef]
  31. Burnham, R.J. Relationships between Standing Vegetation and Leaf Litter in a Paratropical Forest: Implications for Paleobotany. Rev. Palaeobot. Palynol. 1989, 58, 5–32. [Google Scholar] [CrossRef]
  32. Burnham, R.J.; Wing, S.L.; Parker, G.G. The Reflection of Deciduous Forest Communities in Leaf Litter: Implications for Autochthonous Litter Assemblages from the Fossil Record. Paleobiology 1992, 18, 30–49. [Google Scholar] [CrossRef]
  33. Ferguson, D.K. Plant Taphonomic Studies with Special Reference to Messel. Kaupia 1993, 2, 117–126. [Google Scholar]
  34. Barrón, E.; Comas-Rengifo, M.J. Differential Accumulation of Miospores in Upper Miocene Sediments of the La Cerdaña Basin (Eastern Pyrenees, Spain). Comptes Rendus Palevol 2007, 6, 157–168. [Google Scholar] [CrossRef]
  35. Traverse, A. Paleopalynology, 2nd ed.; Springer: Dordrecht, The Netherlands, 2007. [Google Scholar]
  36. Velitzelos, D.; Bouchal, J.M.; Denk, T. Review of the Cenozoic Floras and Vegetation of Greece. Rev. Palaeobot. Palynol. 2014, 204, 56–117. [Google Scholar] [CrossRef]
  37. Mai, D.H. Tertiäre Vegetationsgeschichte Europas: Methoden Und Ergebnisse; Gustav Fischer: Jena, Germany, 1995. [Google Scholar]
  38. Hammer, Ø.; Harper, D.A.T.; Ryan, P.D. Past: Paleontological Statistics Software Package for Education and Data Analysis. Palaeontol. Electron. 2001, 4, 9. [Google Scholar]
  39. Prentice, C.; Guiot, J.; Huntley, B.; Jolly, D.; Cheddadi, R. Reconstructing Biomes from Palaeoecological Data: A General Method and Its Application to European Pollen Data at 0 and 6 Ka. Clim. Dyn. 1996, 12, 185–194. [Google Scholar] [CrossRef]
  40. Jolly, D.; Prentice, I.C.; Bonnefille, R.; Ballouche, A.; Bengo, M.; Brenac, P.; Buchet, G.; Burney, D.; Cazet, J.; Cheddadi, R.; et al. Biome Reconstruction from Pollen and Plant Macrofossil Data for Africa and the Arabian Peninsula at 0 and 6000 Years. J. Biogeogr. 1998, 25, 1007–1027. [Google Scholar] [CrossRef] [Green Version]
  41. Marinova, E.; Harrison, S.P.; Bragg, F.; Connor, S.; Laet, V.; Leroy, S.A.G.; Mudie, P.; Atanassova, J.; Bozilova, E.; Caner, H.; et al. Pollen-derived Biomes in the Eastern Mediterranean–Black Sea–Caspian-Corridor. J. Biogeogr. 2018, 45, 484–499. [Google Scholar] [CrossRef]
  42. Ni, J.; Yu, G.; Harrison, S.P.; Prentice, I.C. Palaeovegetation in China during the Late Quaternary: Biome Reconstructions Based on a Global Scheme of Plant Functional Types. Palaeogeogr. Palaeoclimatol. Palaeoecol. 2010, 289, 44–61. [Google Scholar] [CrossRef] [Green Version]
  43. Sun, A.; Luo, Y.; Wu, H.; Chen, X.; Li, Q.; Yu, Y.; Sun, X.; Guo, Z. An Updated Biomization Scheme and Vegetation Reconstruction Based on a Synthesis of Modern and Mid-Holocene Pollen Data in China. Glob. Planet. Chang. 2020, 192, 103178. [Google Scholar] [CrossRef]
  44. Mahler, S.; Shatilova, I.; Bruch, A.A. Neogene Long-Term Trends in Climate of the Colchic Vegetation Refuge in Western Georgia—Uplift versus Global Cooling. Rev. Palaeobot. Palynol. 2022, 296, 104546. [Google Scholar] [CrossRef]
  45. Utescher, T.; Erdei, B.; Hably, L.; Mosbrugger, V. Late Miocene Vegetation of the Pannonian Basin. Palaeogeogr. Palaeoclimatol. Palaeoecol. 2017, 467, 131–148. [Google Scholar] [CrossRef]
  46. Wolfe, J.A. A Paleobotanical Interpretation of Tertiary Climates in the Northern Hemisphere: Data from Fossil Plants Make It Possible to Reconstruct Tertiary Climatic Changes, Which May Be Correlated with Changes in the Inclination of the Earth’s Rotational Axis. Am. Sci. 1978, 66, 694–703. [Google Scholar]
  47. Su, Y.; Guo, Q.; Hu, T.; Guan, H.; Jin, S.; An, S.; Chen, X.; Guo, K.; Hao, Z.; Hu, Y.; et al. An Updated Vegetation Map of China (1:1,000,000). Sci. Bull. 2020, 65, 1125–1136. [Google Scholar] [CrossRef]
  48. Gesch, D.B.; Verdin, K.L.; Greenlee, S.K. New Land Surface Digital Elevation Model Covers the Earth. Eos Trans. Am. Geophys. Union 1999, 80, 69. [Google Scholar] [CrossRef]
  49. Miyawaki, A. A Vegetation~Ecological View of the Japanese Archipelago. Bull. Inst. Environ. Sci. Technol. 1984, 11, 85–101. [Google Scholar]
  50. Suc, J.-P.; Fauquette, S. The Use of Pollen Floras as a Tool to Estimate Palaeoaltitude of Mountains: The Eastern Pyrenees in the Late Neogene, a Case Study. Palaeogeogr. Palaeoclimatol. Palaeoecol. 2012, 321–322, 41–54. [Google Scholar] [CrossRef] [Green Version]
  51. Huyghe, D.; Mouthereau, F.; Ségalen, L.; Furió, M. Long-Term Dynamic Topographic Support during Post-Orogenic Crustal Thinning Revealed by Stable Isotope (Δ18O) Paleo-Altimetry in Eastern Pyrenees. Sci. Rep. 2020, 10, 2267. [Google Scholar] [CrossRef] [Green Version]
  52. Ortuño, M.; Martí, A.; Martín-Closas, C.; Jiménez-Moreno, G.; Martinetto, E.; Santanach, P. Palaeoenvironments of the Late Miocene Prüedo Basin: Implications for the Uplift of the Central Pyrenees. J. Geol. Soc. 2013, 170, 79–92. [Google Scholar] [CrossRef] [Green Version]
  53. Calvet, M.; Gunnell, Y.; Laumonier, B. Denudation History and Palaeogeography of the Pyrenees and Their Peripheral Basins: An 84-Million-Year Geomorphological Perspective. Earth Sci. Rev. 2021, 215, 103436. [Google Scholar] [CrossRef]
  54. Calvet, M.; Gunnell, Y. Planar Landforms as Markers of Denudation Chronology: An Inversion of East Pyrenean Tectonics Based on Landscape and Sedimentary Basin Analysis. Geol. Soc. Lond. Spec. Publ. 2008, 296, 147–166. [Google Scholar] [CrossRef]
  55. IGN-MITMA Modelo Digital Del Terreno—MDT25-ETRS89-HU31 2008. Available online: https://centrodedescargas.cnig.es (accessed on 28 January 2023).
  56. Dunwiddie, P.W. Macrofossil and Pollen Representation of Coniferous Trees in Modern Sediments from Washington. Ecology 1987, 68, 1–11. [Google Scholar] [CrossRef]
  57. Jiménez-Moreno, G.; Fauquette, S.; Suc, J.-P. Miocene to Pliocene Vegetation Reconstruction and Climate Estimates in the Iberian Peninsula from Pollen Data. Rev. Palaeobot. Palynol. 2010, 162, 403–415. [Google Scholar] [CrossRef]
  58. Wang, C.W. The Forests of China, with a Survey of Grassland and Desert Vegetation. Rev. Ecol. Terre Vie 1963, 17, 1–260. [Google Scholar]
  59. Wolfe, J.A. Temperature Parameters of Humid to Mesic Forests of Eastern Asia and Relation to Forests of Other Regions of the Northern Hemisphere and Australasia: Analysis of Temperature Data from More than 400 Stations in Eastern Asia. U.S. Geol. Surv. Prof. Pap. 1979, 1106, 1–37. [Google Scholar]
  60. Liu, K. Quaternary History of the Temperate Forests of China. Quat. Sci. Rev. 1988, 7, 1–20. [Google Scholar] [CrossRef]
  61. Kong, W.-S. Vegetational History of the Korean Peninsula: Vegetational History of Korea. Glob. Ecol. Biogeogr. 2000, 9, 391–402. [Google Scholar] [CrossRef]
  62. Targhi, S.; Barhoun, N.; Bachiri Taoufiq, N.; Achab, M.; Ait Salem, A.; Yousfi, M.Z. Vegetation Climate and Marine Environmental Reconstruction in the Western Mediterranean (Southern Rifian Corridor, Morocco) over the Tortonian-Messinian Transition. Heliyon 2021, 7, e08569. [Google Scholar] [CrossRef]
  63. Bruch, A.A.; Utescher, T.; Mosbrugger, V. Precipitation Patterns in the Miocene of Central Europe and the Development of Continentality. Palaeogeogr. Palaeoclimatol. Palaeoecol. 2011, 304, 202–211. [Google Scholar] [CrossRef]
  64. Zidianakis, G.; Iliopoulos, G.; Zelilidis, A.; Kovar-Eder, J. Three (Middle to) Late Miocene Plant Macroremain Assemblages (Pitsidia, Kassanoi and Metochia) from the Messara–Gavdos Region, Southern Crete. Acta Palaeobot. 2020, 60, 333–437. [Google Scholar] [CrossRef]
  65. Grangeon, P. Contribution à l’étude de La Paléontologie Végétale Du Massif Du Coiron; Université Clermont: Clermont-Ferrand, France, 1958. [Google Scholar]
  66. Moreno-Domínguez, R.; Diez, J.B.; Jacques, F.M.B.; Ferrer, J. First Macroflora Data from La Val (Late Oligocene/Early Miocene), Estadilla (Huesca, Spain). Hist. Biol. 2015, 27, 469–489. [Google Scholar] [CrossRef]
  67. Moreno-Domínguez, R.; Cascales-Miñana, B.; Ferrer, J.; Diez, J.B. Acrostichum, a Pioneering Fern of Floodplain Areas from the Late Oligocene Sariñena Formation of the Iberian Peninsula. PLoS ONE 2016, 11, e0162334. [Google Scholar] [CrossRef] [PubMed] [Green Version]
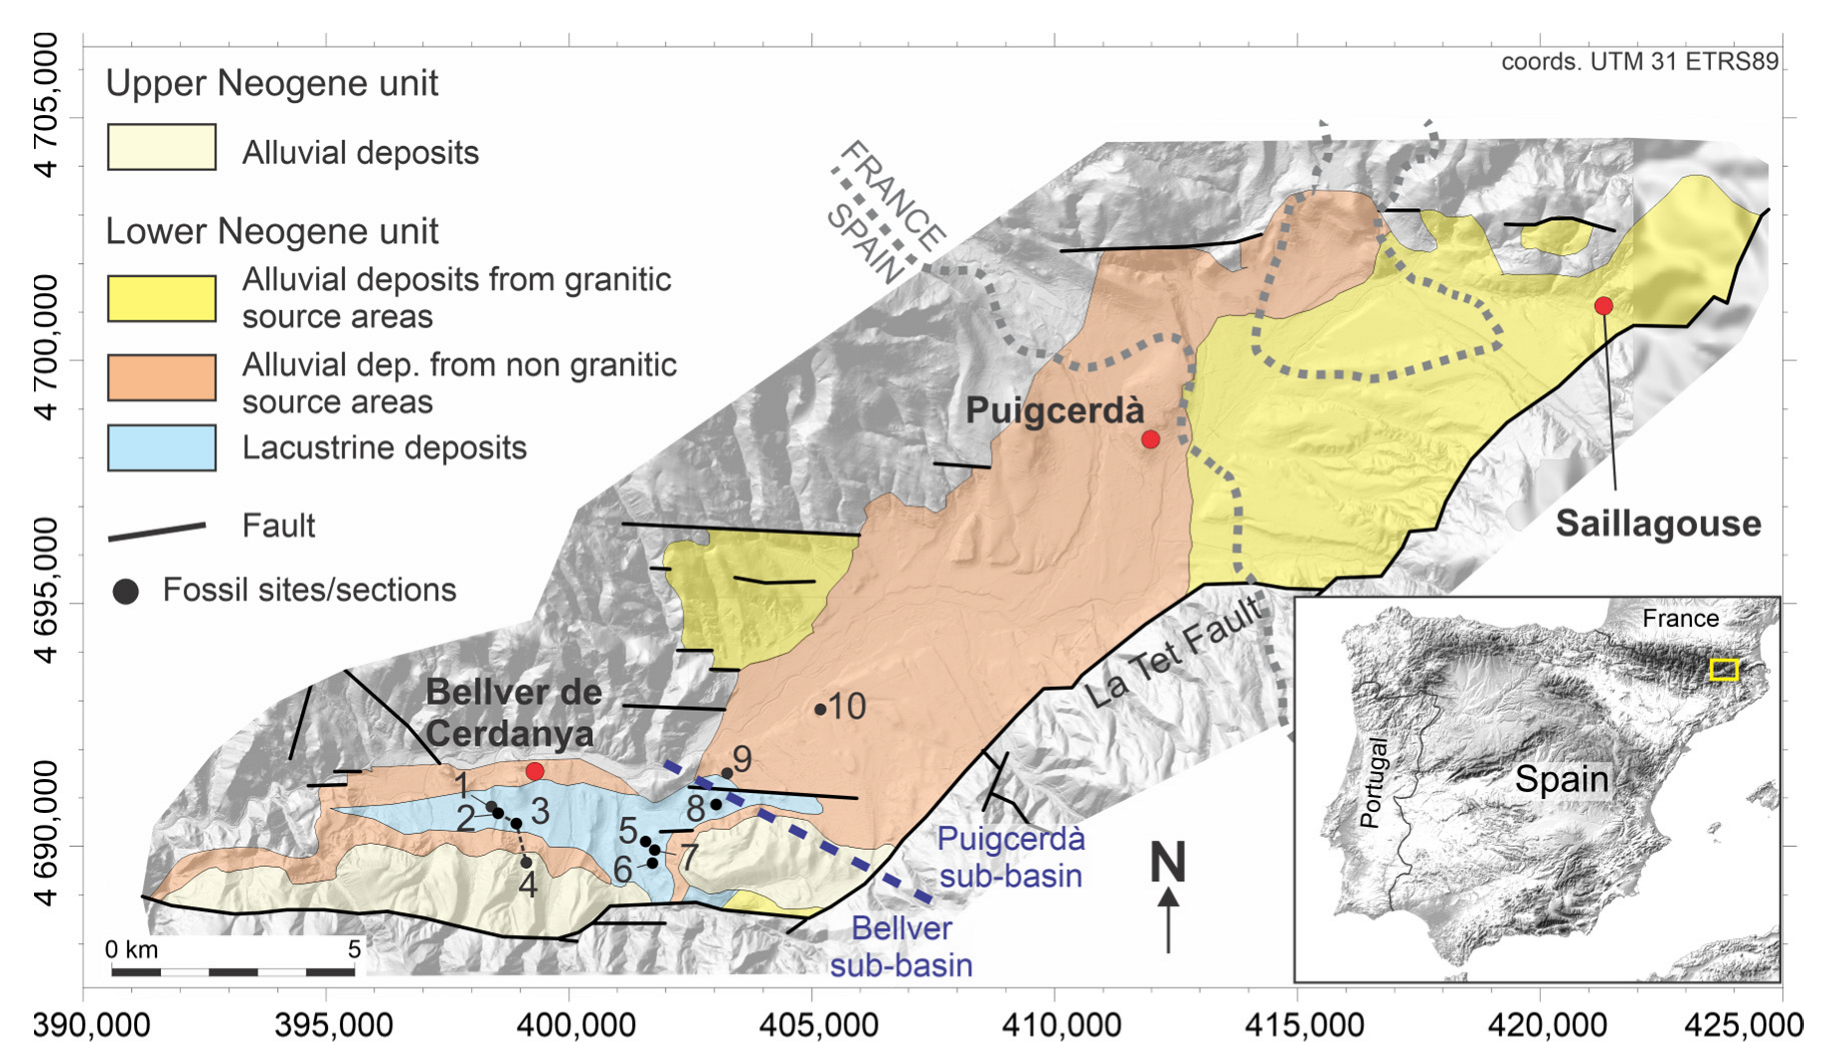
Figure 1. Simplified geological map of the La Cerdanya Basin modified from [14]. Black dots indicate pollen sites and sections. The sites of Carrer de Bellver de Cerdanya a Pi (1), Barranc de Salanca (2), Torrent de Vilella (3) and Can Vilella (4) form part of a broader stratigraphical section [14] denominated as the “Bellver lake” section. Detailed names and description of fossil sites appears in Table 1.
Forests 14 01471 g001
Figure 2. Selected representative plant macrofossils from the Tortonian Bellver sub-basin (La Cerdanya, Lleida province, Spain). (A) Cryptomeria anglica Boulter, MGBV9856; (B) Ginkgo adiantoides (Unger) Heer, MGB V10154; (C) Alnus occidentalis Rérolle emend. Barrón, Postigo-Mijarra and Diéguez, MGB V10491; (D) Acer pyrenaicum Rérolle emend. Barrón, Postigo-Mijarra and Diéguez, MGB V11710; (E) Quercus drymeja Unger, MGM-1064M; (F) Fagus gussonii Massalongo, MGB V9515; (G) Laurophyllum sp., MGB V9490; (H) Fagus haidingeri Kovats sensu Knobloch, MGM-1060M; (I) Quercus hispanica Rérolle emend. Barrón, Postigo-Mijarra and Diéguez, MGM-1063M; (J) Zelkova zelkovifolia (Unger) Bůžek et Kotlaba, MGM-1069M; (K) Carpinus grandis Unger emend. Heer, MGB V9510. Scale bar = 1 cm.
Forests 14 01471 g002
Figure 3. (A) Altitude ranges in which the modern vegetation units occur in eastern Asia between latitudes 33° N and 42° N [47,49]. Minimum and maximum values represent average values. These are identified as modern analogue to the Late Miocene vegetation types of the La Cerdanya Basin. (B) The elevation ranges for the Late Miocene vegetation are extrapolated from the ranges of the modern analogues.
Forests 14 01471 g003
Figure 4. Aggrupation of all available palaeoaltitude measurements for the La Cerdanya Basin during the Tortonian (red) and Messinian (yellow) stages. Broad intervals are used when measurements are given as a range of plausible elevations, narrow intervals mark concise measurements. References in [26,50,51].
Forests 14 01471 g004
Figure 5. Diagrams reflecting two principal component analyses (PCA), (A) PCA of all pollen samples considering only terrestrial pollen taxa with average proportions >1%, (B) same PCA, but including hygrophytes (aquatic plants and spores) with average proportions >1% of the total palynomorph sum. Blue triangles indicate samples from the Sansor section, red circles indicate samples from the Sanavastre section, squares of different colour indicate the individual sites which compose the Bellver lake section.
Forests 14 01471 g005
Figure 6. Maps showing the extent of the different biomes in the La Cerdanya Basin during the Tortonian (A) and Messinian (B) stages. Map (B) represents an elevation 300 m higher than map (A).
Forests 14 01471 g006
Figure 7. Composite diagram of the Sanavastre mine showing, from left to right, affinity scores for the four main biomes, IPR environmental reconstruction (green) and CA results for the same pollen samples [9]. Background colour corresponds with highest scoring biome.
Forests 14 01471 g007
Figure 8. Composite diagram of the Sansor mine showing, from left to right, affinity scores for the four main biomes, IPR environmental reconstruction (green) and CA results for the same pollen samples [9]. Background colour corresponds with highest scoring biome.
Forests 14 01471 g008
Figure 9. Composite diagram of the Bellver lake showing, from left to right, affinity scores for the four main biomes, IPR environmental reconstruction and CA results for the same pollen samples from [9], CLAMP temperature values from macrobotanical sites of Tortonian age from [26] and Climate Amplitude Method temperature values from [57]. Background biome colour corresponds with highest scoring biome.
Forests 14 01471 g009
Figure 10. Composite diagram of the macroremain sites from Bellver sub-basin showing, from left to right, affinity scores for the four main biomes, IPR environmental reconstruction (green) and CA results for the same pollen samples [9]. Note that only the sites of Torrent de Vilella and Barranc de Salanca have a clearly defined stratigraphical order. Background colour corresponds with highest scoring biome.
Forests 14 01471 g010
Figure 11. Artwork illustrating the different forest types of the La Cerdanya Basin and their composition. Foreground: To the left, evergreen vegetation composed of Quercus drymeja, Myrica and other evergreen trees. In the middle and right, banks of reeds and sedges (Typhaceae) with riparian trees (Alnus). Background: The vegetation types are organized around the lake in vegetation belts. Wetland vegetation is closest to the lake, then the evergreen forest. Above, the deciduous forests and conifer forests in the mountains. Artwork by Yul Altolaguirre.
Forests 14 01471 g011
Table 1. List of studied sites. Numbers correspond with those shown in Figure 1. In brackets common abbreviations used in sample names. Stratigraphic units are “lower Neogene unit” (LNU) and “upper Neogene unit” (UNU). Elements are miospores (Mios) and macroflora (Macr). The Tortonian (MN9–MN10) age was inferred from mammal macrofossils by [15], the early Messinian (MN 13) one from mammal microfossils by [15,17].
#Site NameSub-BasinStratigraphic UnitComposite SectionElementsAge
1Carrer de Bellver de Cerdanya a Pi (B3/BB)BellverLNUBellver central lakeMiosTortonian
2Barranc de Salanca (BS)BellverLNUBellver central lakeMios/MacrTortonian
3Torrent de Vilella (TV)BellverLNUBellver central lakeMios/MacrTortonian
4Can Vilella (CV)BellverUNUBellver central lakeMiosEarly Messinian
5BedersBellverLNU-Mios/MacrTortonian
6PedráBellverLNU-MacrTortonian
7BalltargaBellverLNU-Mios/MacrTortonian
8Coll de Saig (CS)BellverLNU-Mios/MacrTortonian
9Sansor minePuigcerdàLNU-MiosTortonian
10Sanavastre minePuigcerdàLNU-MiosTortonian
Table 2. Affinity scores for the pollen assemblages of the Bellver lake section for the biomes WTEM (warm-temperate evergreen broadleaf and mixed), TEDE (temperate deciduous broadleaf forest), COMX (cool mixed forest) and COEG (cool evergreen needleleaf forest). Maximum scores highlighted in bold.
Pollen SampleWTEMTEDECOMXCOEG
CV918.1316.2817.6217.62
CV818.7315.9016.8316.83
CV518.7116.7317.7117.71
CV418.4115.7117.7517.75
TV718.1519.8220.6420.64
TV617.0517.0218.2418.24
TV520.4023.7422.0821.62
TV417.2618.5018.8118.81
TV317.3117.7318.3918.39
TV217.4517.8618.2318.23
TV117.8118.9919.7419.74
BS720.1921.1020.2320.23
BS618.1719.5920.0020.00
BS519.8521.2221.1721.17
BS416.7418.7019.6619.66
BS316.6215.2117.5817.58
BS216.8616.6318.9418.94
BS115.8715.6218.1718.17
BB21.8524.6920.3018.48
B319.2122.6518.0017.17
Table 3. Affinity scores for the pollen assemblages of the Sanavastre section for the biomes WTEM (warm-temperate evergreen broadleaf and mixed), TEDE (temperate deciduous broadleaf forest), COMX (cool mixed forest) and COEG (cool evergreen needleleaf forest). Maximum scores highlighted in bold.
Pollen SampleWTEMTEDECOMXCOEG
MSA2118.2019.2814.4914.49
MSA1917.8916.5513.7213.72
MSA1815.7114.6413.2313.23
MSA1717.1815.0812.8512.85
MSA1614.8913.8412.9512.95
MSA1518.9017.5214.4914.49
MSA1415.3115.1813.4813.48
MSA1317.8716.1113.5913.59
MSA1218.7718.1014.7114.71
MSA1119.2419.3116.3115.99
MSA1019.3119.5615.3615.06
MSA915.6716.3112.9412.94
MSA715.6116.8815.3115.31
MSA617.1318.1615.6715.67
MSA519.4619.4717.4317.43
MSA416.0015.7915.1915.19
MSA320.1923.2218.7417.47
MSA218.9920.4917.1917.19
MSA123.4622.5022.5021.53
Table 4. Affinity scores for the pollen assemblages of the Sansor section for the biomes WTEM (warm-temperate evergreen broadleaf and mixed), TEDE (temperate deciduous broadleaf forest), COMX (cool mixed forest) and COEG (cool evergreen needleleaf forest). Maximum scores highlighted in bold.
Pollen SampleWTEMTEDECOMXCOEG
VSP416.7819.0316.1116.11
VSP320.9425.0020.0719.10
VSP216.3319.4917.5017.50
VSP112.7613.7715.3915.39
MSP3114.4216.5215.7415.74
MSP2711.5110.2712.7812.78
MSP2116.0913.8314.9414.94
MSP1917.4515.4015.7015.70
MSP1817.1216.6515.9915.64
MSP1617.7219.5317.6117.61
MPS1516.5718.8216.9716.97
MSP1316.7713.2514.8314.83
MSP1216.2513.7214.8914.89
MSP1117.2015.2613.9013.90
MSP1015.6115.7913.9813.98
MSP716.4914.2615.2213.94
MSP317.0516.3813.9313.93
MSP217.8316.5813.5213.52
MSP114.8913.9113.0913.09
Table 5. Affinity scores for the macrofossil assemblages for the biomes WTEM (warm-temperate evergreen broadleaf and mixed), TEDE (temperate deciduous broadleaf forest), COMX (cool mixed forest) and COEG (cool evergreen needleleaf forest). Maximum scores highlighted in bold. Fossil sites not listed in stratigraphical order. Only Torrent de Vilella overlays Barranc de Salanca.
Pollen sampleWTEMTEDECOMXCOEG
Torrent de Vilella29.2025.2221.1618.41
Barranc de Salanca29.9324.8823.1619.43
Beders30.0326.3720.0914.78
Balltarga28.0519.3818.0813.58
Pedrá26.8622.2816.4613.70
Coll de Saig31.5321.8518.8615.65
Disclaimer/Publisher’s Note: The statements, opinions and data contained in all publications are solely those of the individual author(s) and contributor(s) and not of MDPI and/or the editor(s). MDPI and/or the editor(s) disclaim responsibility for any injury to people or property resulting from any ideas, methods, instructions or products referred to in the content.