Abstract
Emotional responses are psychological responses produced by multiple stimuli. This study aimed to clarify the effects of thermal comfort on emotions in green spaces with different characteristics in summer. Four green spaces were selected in an urban park in Chongqing, China, and 919 residents completed questionnaires. The questionnaire consisted of a thermal sensation vote (TSV) and a Positive and Negative Affect Schedule (PANAS). Positive affect (PA) and negative affect (NA) are two dimensions included in the PANAS, both with scores ranging from 10 to 50. In parallel with the questionnaire, meteorological measurements were taken, and the collected data were used for thermal environment simulation to obtain physiological equivalent temperatures (PET). The results showed that the effect of thermal comfort in green spaces on PA far exceeded that of NA. PET increased from 20 °C to 55 °C, the average PA decreased by 7.2 scores, and NA did not change significantly. The negative effect of PET on PA was significant in less-shaded spaces, and the positive effect on NA was significant in well-shaded spaces with a high visible green index. PET mainly influences the emotions of being strong, proud, inspired, active, and attentive in PA and distressed, irritable, and afraid in NA. Emotions became less susceptible to PET and TSV as individuals aged. PET at 31–33 °C favored PA for people of all ages. This study provided practical information about thermal comfort and the design of green spaces with the goal of promoting mental health.
1. Introduction
Rising global average temperatures, deteriorating urban thermal environments, and frequent extreme heat events and heat waves are direct threats to human health [1]. The summer heat wave in Europe caused tens of thousands of deaths in 2003 [2]. Heat-related morbidity and mortality will continue to increase in the future [3]. The potential effects of heat stress on mental health have been relatively poorly studied. It is known that heat stress can trigger mood disorders, anxiety, depression, and other psychological disorders [4]. Emotions, as a major component of mental health [5], include positive and negative attributes that provide real-time feedback on mental health. Positive emotions are associated with reduced mortality and improved physical and psychological functioning [6], and uncomfortable thermal environments can trigger fatigue, which affects emotional experiences [7]. Some scholars have suggested that emotional well-being be considered a part of public health at the national level [8].
Urban green spaces are the main space for residents’ outdoor activities and interactions, which not only have the ecological function of improving the microclimate but also help to promote mental health and provide emotional value. Individuals can benefit psychologically from regular contact with green spaces [9,10]. When compared to urban built environments, walking in nature can significantly improve people’s mental health [11]. One study suggested that lawn space clearly increased positive emotional responses compared to tree spaces and non-vegetation spaces [12]. Nature parks can effectively reduce stress due to their rich biodiversity, though this effect was less pronounced in pocket parks [13]. These studies were mostly focused on the emotional change resulting from the overall effect of the green space environment on multiple senses without directly considering the possible effect of changes in the thermal environment on emotions. Thermal comfort is one of the key points that affect overall comfort and emotions. Different green spaces have different thermal environments and thermal comfort levels [14,15,16,17], which may have positive or negative effects on emotions.
A comfortable thermal environment in an outdoor space alleviates summer heat stress and promotes human health [16,18,19]. Currently, a large number of studies involving thermal comfort in green spaces have been mainly devoted to determining what effects thermal comfort has, including physical, physiological, psychological, social, or behavioral factors [14,16,17,20]. Niikolopoulou and Steemers [21] pointed out that microclimate parameters explain only about 50% of the variance in comfort evaluation, and researchers are increasingly recognizing the importance of psychological components. Psychological adaptation can alter thermal comfort experiences, such as thermal expectations and emotions [22,23,24,25]. Under the same temperature conditions, people with a negative affect (NA) may feel warmer than people with a positive affect (PA) [26]. Zhang et al. [27] showed that PA drives thermal sensation towards neutrality, regardless of whether the current thermal sensation is cold or hot. The authors proposed a method to improve the outdoor thermal comfort sensation by increasing PA.
Nevertheless, the relationship between thermal comfort and emotions is more like a loop [28]. Specifically, emotions influence thermal perception [26], and the thermal environment and thermal perception in turn directly or indirectly cause emotional responses [17]. Although some studies have paid attention to the effects of the thermal environment on emotions, they have mainly focused on psychology and indoor environments and have not been linked to thermal comfort. When the temperature exceeded 32 °C, the negative emotional experience increased significantly, which could directly lead to mental illnesses such as depression in severe cases [29]. In the United States, the PA of people decreased while the NA increased after the ambient temperature rose above 21 °C [30]. These studies only considered temperature variables and did not integrate thermal environmental factors such as relative humidity, wind speed, and radiation. In studies of indoor environments, researchers have used event-related potentials or electroencephalogram methods to quantify changes in emotions due to thermal sensations [28,31]. However, both methods are limited in outdoor applications due to the specific conditions of the measurement instruments. There is insufficient research on the impact of changes in thermal comfort on mood in outdoor green spaces.
In recent years, significant changes in urban climate have occurred with urbanization [32,33]. As a developing country, China has undergone more than sixty years of urbanization. Rapid urbanization and population growth have led to deteriorating urban thermal environments, such as increased urban temperatures and solar radiation [34], which increase thermal discomfort and affect mental health [35]. In addition, population aging has become a global issue that attracts the attention of various countries. China has become one of the most rapidly aging countries in the world and also has the largest number of older adults in the world [36,37]. The mental health of older adults should also receive more attention. Therefore, it is necessary to explore the effect of thermal comfort on emotions in urban green spaces.
Existing studies generally agree that uncomfortable outdoor thermal environments impair positive emotions and increase negative emotions. However, natural landscapes tend to evoke positive emotions in green spaces. How do people’s emotions respond when the two are combined? Are positive or negative emotions affected more? According to Watson’s theory [38], positive (or negative) emotions are made up of multiple emotional states, so how does a specific emotion relate to thermal comfort? Does thermal comfort affect emotional responses differently depending on age and gender? The harsh summer thermal environment could increase residents’ mental health burden in Chongqing, China. Enhancing positive emotions and decreasing negative emotions is a common strategy for improving mental health. The answers to these questions will help clarify the role of green space thermal comfort in emotional responses and inform the design of green spaces that promote positive emotions.
We selected four green spaces in an urban park in Chongqing, China, to measure how thermal comfort influences emotional perceptions. Survey respondents’ emotions and thermal sensation status were assessed by the Positive and Negative Affect Schedule (PANAS) and thermal sensation vote (TSV). We also collected meteorological data in the field to simulate the thermal environment and determine the physiological equivalent temperature (PET). Our main objectives were to: (1) clarify the effect of thermal comfort in green spaces on positive and negative affect; (2) explore the relationship between emotions (positive and negative) and the thermal comfort in different green spaces; and (3) identify differences in emotional responses to changes in thermal comfort among people of different genders and ages.
2. Methods
2.1. Climate and Sites
Chongqing is one of the megalopolises in China, with a population of more than 10 million in the main urban area. It is located in a mountainous region at the edge of the Sichuan Basin. Chongqing has a subtropical, humid monsoon climate with hot summers and cold winters. From 1999–2019, the monthly average air temperature from June to September exceeded 24 °C with July having the highest monthly average (28.3 °C). The highest summer air temperature in 2016 exceeded 42 °C. The monthly average relative humidity is above 71% throughout the year [39].
We chose a highly visited urban park (106°27′ E, 29°33′ N) in the central city for the field experiment, which covers an area of 17 hectares with a greening rate of 76%. This park has been built over a long period, is easily accessible, and is surrounded by many older communities [40]. In China, people generally retire at the age of 60 and can spend much time visiting green spaces and pursuing hobbies. A large number of people in Chongqing enjoy chess and card activities in the park to meet their social interaction needs.
The sky view factor (SVF) affects the thermal environment of space [41]. Green visual stimuli may enhance emotions [42], and the visible green index (VGI) can evaluate the coverage of green vegetation in the field of vision. Most people would sense a lot of green when the VGI is over 50% [43]. SVF was calculated using fisheye photographs and the pixel method [44], and VGI was calculated using panoramic images [45]. The spaces were classified as: 0 < SVF ≤ 0.5, 0.5 < SVF ≤ 1 and 0 < VGI ≤ 50%, 50% < VGI ≤ 100%. Four green spaces were selected and named: (1) open space (space OP, SVF = 0.69, VGI = 37.65%), (2) multifunctional square (space MS, SVF = 0.64, VGI = 63.24%), (3) shaded square (space SS, SVF = 0.28, VGI = 46.06%), and (4) tree-shaded space (space TS, SVF = 0.09, VGI = 70.60%) (Figure 1).
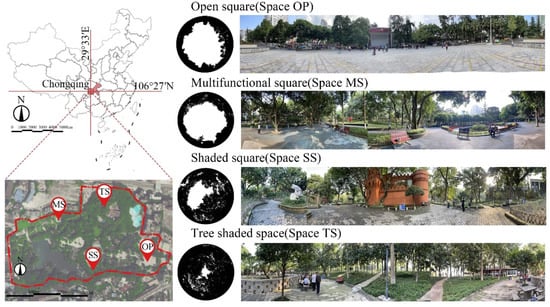
Figure 1.
Geographical location, site location, and site and fisheye photos (map of China obtained from http://bzdt.ch.mnr.gov.cn/, accessed on 28 June 2022; map of the park obtained from https://map.baidu.com/, accessed on 16 June 2022; site and fisheye photos taken by Jiaqi; figure layout by Jiangpeng).
2.2. Experimental Design
The field experiment was conducted on six clear and cloudless days in August (22, 23, 24, 25) and September (7, 8) of 2020, typical of local summer weather. We collected the respondents’ emotional and thermal sensation status through on-site questionnaires in the four spaces from 7:00 to 19:00. The interviewees had all been in the venue for more than 15 min to adapt to the thermal environment, and people passing by were not included in the interview. During the experiment, a set of meteorological data was collected at each measurement point at every hour of the day. The thermal index was obtained by using ENVI-met to create a three-dimensional model of the park that simulated the thermal environment for six days.
2.2.1. Questionnaire
The questionnaire consisted of three parts: (1) general personal information; (2) a thermal sensation vote; and (3) the Positive and Negative Affect Schedule (see Table S1). Personal information included gender, age, and time spent living in the area. The thermal sensation vote used a seven-level scale, where −3 = cold, −2 = cool, −1 = slightly cool, 0 = neutral, +1 = slightly warm, +2 = warm, and +3 = hot [46]. The PANAS is one of the most widely used emotion scales available [27]. The scale is short and easy to use and can reflect people’s subjective feelings of pleasure, excitement, displeasure, pain, etc. It has been successfully applied in many research fields in numerous countries [47,48]. We adopted a double-blind method for an English-Chinese translation and back-translation. The scale is comprised of 20 adjectives: 10 for PA (e.g., active, proud, excited) and 10 for NA (e.g., upset, guilty, afraid) [49]. Respondents were asked to respond to their current emotional experience using a 5-point Likert scale for each emotion (1 = very slightly or not at all; 2 = a little; 3 = moderately; 4 = quite a bit; 5 = extremely).
2.2.2. Meteorological Measurements
Meteorological parameters were acquired using four Kestrel 5500 handheld weather stations (Nielsen-Kellerman, Boulder, PA, USA). Air temperature, relative humidity, wind speed, and wind direction were measured 1.2 m above the ground. The measurement ranges and accuracies were: air temperature: −29 °C–70 °C (±0.5 °C); relative humidity: 10–90% (±2%); wind speed: 0–40 m/s (±3%); wind direction: 0–360° (±5°). Meteorological data was collected once every hour for three consecutive minutes and recorded every 30 s, yielding six sets of data per hour.
2.2.3. Thermal Index and ENVI-Met Simulation
PET was selected as the thermal index to evaluate outdoor thermal comfort. Its applicability has been demonstrated in various climatic regions of the world, including numerous outdoor thermal comfort studies in subtropical regions of China [50,51]. Researchers have developed refined, grid-based models with ENVI-met, a software that uses computational fluid dynamic principles to more accurately simulate complex thermal environments [52]. It has been applied in many studies of thermal environment simulations in urban green spaces [53]. The limitation of its thermal resistance calculation for clothing can be overcome by the fact that people are generally thinly dressed in the summer [54].
We used ENVI-met 5.0.0 to build a park model with 164 × 112 × 20 grids (see Figure S1). The horizontal grid resolution was 4 × 4 m and the vertical grid height was 4 m, where the resolution below 4 m was 0.8 m. Google Maps and field site surveys were used to model the park. Natural surfaces, water, roads, squares, buildings, and vegetation were included in the model, and the materials used are listed in Table S2. The height of street trees was set to 10 m based on the average actual tree height, and the material was T1. The tree heights in other green areas were as close as possible to the actual situation, with average tree heights of 10 m (T1) and 15 m (SK) in most areas and a few trees up to 20 m (SM). The height of each floor of the building was 3 m, and the tallest building in the park was 9 m.
We simulated the thermal environment conditions for six days. Each simulation was performed using simple forcing, setting the hourly air temperature and relative humidity. The data source was the daily hourly air temperature and relative humidity averaged from actual measurements. The measured wind speed in the field was stochastic, using a wind speed of 1.6 m/s monitored by the nearest Shapingba Weather Station (~2.5 km) [55], which was the perennial average wind speed in the region during summer. We organized the wind direction measured on site as an octant wind direction, where the maximum frequency wind direction was east, so the wind direction was set to 90°. The cloud level was set to 0 oktas, which corresponds with the clear weather. The radiation data in the software was retrieved according to the geographical location. Each simulation ran from 01:00–19:00 (UTC = +8), with data exported for analysis from 7:00 to 19:00. The data output interval was 60 min.
The BIO-met module calculated PET values, and we set the physiological parameters of the human body to be male, 175 cm tall, 75 kg, 57 years old, and having a metabolic rate of 164.49 W (average age and metabolic rate of the interviewees). The clothing’s thermal resistance was set to 0.5 in line with the actual summer conditions. We recorded the grid numbers corresponding to the four measurement points in the model and calculated the average values of hourly PET for the four grids in the center of space.
2.2.4. Model Validation
The coefficient of determination (R2) describes the goodness of fit of the variance between predicted and measured values, but it is usually independent of the magnitude of the difference between predicted and measured values and does not indicate the accuracy of the model [56]. The accuracy of the model should be reflected by the closeness of the predicted value to the measured value, i.e., the difference measures [56]. The most widely applied difference measures include root mean square error (RMSE), mean bias error (MBE), mean average error (MAE), and index of agreement (d) [57]. The RMSE is used to estimate the average magnitude of the errors, of which systematic (RMSEs) and unsystematic (RMSEu) are components. The MBE reflects the average of all differences between predicted and observed values [58], and the MAE indicates the average of the absolute values of the residuals [57]. The dimensionless d describes the degree of error-free predicted values of the model [53]. The higher the accuracy of the model, the closer the R2 and d values are to 1, the closer the value of RMSE is to 0, and the smaller the difference between RMSEu and RMSE [53,56,57].
A comparison of observed and predicted values showed that the ENVI-met model in this study was accurate and could adequately respond to the actual thermal environment of the park during the experimental period. Air temperature was simulated more accurately with R2 and d of 0.93 and 0.97, respectively. The RMSE and RMSEu were close, with 0.64 °C and 0.58 °C, respectively. The RMSEs were 0.54 °C, the MBE was −0.04 °C, and the MAE was 0.71 °C. The R2 between the measured and predicted values of relative humidity was 0.85. The results of the difference measures also showed a good match (d = 0.87, RMSE = 3.33%, RMSEu = 3.20%, RMSEs = 6.46%, MBE = 4.74%, MAE = 5.61%).
2.3. Statistical Analysis
All data were sorted, and mean values were calculated by MS-Excel 2019 (Microsoft, Seattle, WA, USA). Statistical analyses were performed using SPSS 26.0 (IBM Corporation, Armonk, NY, USA). The test of homogeneity of variances was performed before the significance of differences test. If the data fit a normal distribution, we used a one-way ANOVA or independent sample t-test. If not, we used the independent-samples Kruskal-Wallis test. MS-Excel 2019 and Origin 2022b (OriginLab Corporation, Northampton, MA, USA) were used for linear fitting and graph production.
3. Results
3.1. Descriptive Analysis
3.1.1. Respondents
A total of 919 respondents completed valid questionnaires. We excluded children from the interviews because their thermal sensations and emotions may differ from those of adults [59]. The proportion of males and females was relatively balanced, with males accounting for 51.58% and females 48.42% (Table 1). We divided the respondents into three age groups: (1) young adults (18–44 years old), (2) middle-aged adults (45–59 years old), and (3) older adults (60 years of age and older). The older adult group had the highest number of people (59.74%), and the middle-aged adult group was the smallest (19.48%). Respondents who submitted valid questionnaires had lived in the area for more than one year and could effectively and accurately assess the thermal environment.

Table 1.
Attributes of respondents.
3.1.2. Thermal Environment and Thermal Comfort
The air temperature variation range in space OP was the largest. The maximum relative humidity was highest in space TS with the best shade and abundant vegetation. The wind speed for all spaces was less than 2 m/s. The PET distribution of the four spaces was consistent with the SVF classification. The thermal environment of the space OP was the worst, with a PET variation range of 33.8 °C. Less shade and large, hard-paved areas were the main reasons for the high daily PET variability (Table 2).
Table 2.
Meteorological parameters and PET ranges (from minimum to maximum values) and percentage of TSV in the four spaces.
Over 78% of the respondents felt slightly cool, neutral, or slightly warm (Table 2). Only 5% of the respondents felt hot. The distribution of TSVs seemed to be correlated with VGI in the four spaces. Spaces OP (SVF > 0.5) and SS (SVF < 0.5) both had VGIs below 50%, where the sum of the proportions of people whose thermal sensations were slightly cool or neutral was about 22% lower than the spaces with high VGI. In the high VGI space, people’s thermal sensations might be soothed by green visual stimulation.
3.1.3. PANAS Scores
Across all spaces, the median and mean of PA exceeded 27, and the median and mean of NA were both below 15 (Figure 2). The PA was generally evoked in the park greenspaces, which could be related to the fact that visitors’ initial emotional state was positive [42]. Non-parametric tests showed significant differences in PA between spaces OP and MS and significant differences in NA between spaces OP and TS. Space OP was an open venue where people frequently participated in collective activities such as dancing and aerobics, which could result in high PA. In the multifunctional activity space MS, some people used fitness equipment to exercise independently. The high air temperature and relative humidity, as well as the overall noisy environment, may have influenced PA arousal, which also corresponded to the high mean value of NA in the MS space. Space TS with low SVF and high VGI had the lowest mean NA.
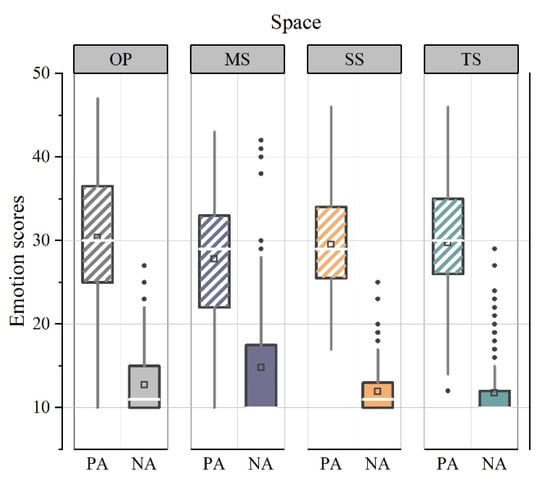
Figure 2.
PA and NA scores in the four spaces (white lines are the medians and squares are the means, ranging from 1% to 99%; figure produced by Jiaqi).
3.2. Relationship between Emotions and PET and TSV
The Pearson correlation analysis was used to examine the relationship between PET and PA/NA scores. PET was significantly negatively correlated with PA (r = −0.690, p < 0.01) but not with NA (r = 0.250, p = 0.316). PA and NA scores were calculated for each 2 °C PET interval, produced scatter plots, and performed a linear fit (Figure 3a). The per capita PA would decrease by 0.2048 for every 1 °C increase in PET. Uncomfortable thermal environments had a significant impact on PA evocation in the park’s green spaces. In contrast, NA was always low, and PET changes had little effect on it.
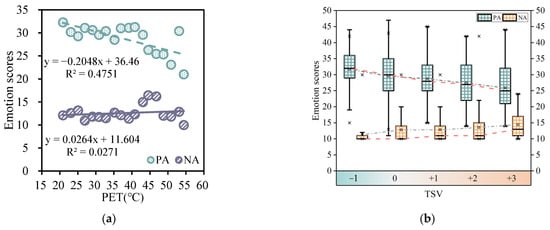
Figure 3.
Correlation between PET and PA/NA scores (a) and variation of PA and NA with TSV (b) (figure produced by Jiaqi).
From the results of the homogeneity of variance test, we performed one-way ANOVA and non-parametric tests for PA and NA of different TSV groups, respectively. The results revealed that the mean PA and median NA differed significantly across TSV groups (see Tables S3–S6); that is, thermal sensation clearly affected PA and NA. PA decreased markedly as thermal sensation increased, while NA increased slightly (Figure 3b). The PA and NA of the slightly cool sensations differed significantly from the other groups. PA and NA did not differ between TSV = 0 and TSV = +1, nor between TSV = +2 and TSV = +3.
3.3. Effect of Thermal Comfort on Emotions in Different Green Spaces
The negative effect of PET on PA was stronger where SVF was greater than 0.5. The thermal stress classification of Chongqing is shown in Figure 4, obtained according to the research of Qin et al. [40]. The fitted regression equation showed that the slopes of spaces SS and TS were almost zero, with an average PA of about 29.5 for both. In the spaces OP and MS, the PA score of 29.5 corresponded to PET of 39.29 °C and 35.88 °C, respectively, which was slight heat stress. During the thermal comfort hours, people participated in physical activities in spaces OP and MS, and the PA was higher. People likely left or reduced the intensity of their activities as the thermal environment worsened and PA decreased.
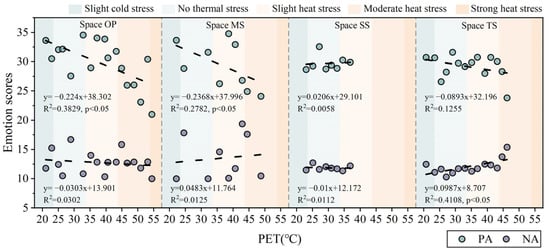
Figure 4.
Relationship between PET and emotion scores in the four spaces (p-values for the linear regression model are after Bonferroni adjustment; figure produced by Jiaqi).
The effect of PET on NA was significantly positively correlated only in space TS (r = 0.163, p < 0.01). The scatter distribution was more discrete for spaces OP and MS (SVF > 0.5), which might be attributed to individual differences in the responses to a drastically changing thermal environment. Although the relationship between NA and PET was not statistically significant, changes in thermal comfort may have colored some people’s emotions. There was no significant difference between PA and NA in each space under the TSV groups.
3.4. Effects of PET on Each Emotion
As mentioned in Section 3.3, PET significantly influenced PA in spaces OP and MS, and influenced NA in space TS. Thus, we analyzed each emotion in the three spaces separately (Table 3). For PA, spaces OP and MS had nine and five emotion items, respectively, that were significantly and negatively correlated with PET. When PET was low, each emotion score was mostly four or five. When PET was raised, most respondents felt little or no evocation of PA. Strong, proud, inspired, active, and attentive emotions were negatively correlated with PET in both spaces.
Table 3.
Correlations between PET and each emotion score in spaces OP, MS, and TS.
For NA, space TS (SVF < 0.5, VGI > 50%) had three emotion items that were significantly and negatively correlated with PET. A small percentage of respondents felt slightly or moderately distressed, irritable, and afraid. The space is low-lying and has a low level of openness, and if people stayed in it for a long time, the excessive amount of greenery could exacerbate their feelings of fear and distress.
3.5. Effect of Thermal Comfort on Emotions in Different Age Groups
No differences in PA and NA scores were observed between genders, but significant differences between age groups were noted (Figure S2). Older adults had the highest PA and the lowest NA. The 18–44 age group had the lowest PA and the highest NA. The PA of young adults (18–44 years) was most susceptible to increasing PET, followed by middle-aged adults, and then older adults. According to the fitted quadratic function, the per capita PA of the 18–44-year-old and 45–59-year-old groups reached maximums at PET of 31.5 °C and 32.4 °C, respectively. The thermal environment was more comfortable when PET was 20–31 °C, and PA might be more influenced by activities and the spatial environment. PA remained relatively high at a PET of 31–33 °C, and then the 18–44-year-old group was first to show a rapid decline in PA. The change in NA with increasing PET was not significant for any of the three age groups, although it was greater in young adults (Figure 5a,b).
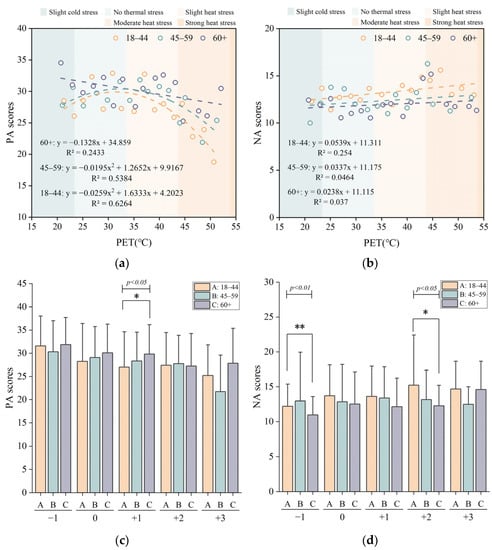
Figure 5.
Emotions in the different age groups: relationship between PET and PA (a), relationship between PET and NA (b), PA in different TSV categories (c), NA in different TSV categories (d) (* significant at the 0.05 level; ** significant at the 0.01 level; figure produced by Jiaqi).
PA decreased slowly in the older adult group as TSV increased, while mean PA decreased significantly and NA increased in the 18–44-year-old group (Figure 5c,d). Two possible explanations for the lack of significant PA changes in the older adult group were their adaptation to the thermal environment and their physiological insensitivity to changes in the thermal environment [60,61]. The differences in PA and NA scores for the three age groups were investigated under different TSV groupings. Only when TSV was slightly warm did a significant difference in PA between young and older adults emerge. When TSV was −1 or +2, significant differences in NA were observed between young adults and older adults.
4. Discussion
4.1. Effect of Thermal Environment and Thermal Comfort on Emotions
Outdoor thermal environments and thermal comfort can indeed cause emotional responses. High temperatures reduced residents’ feelings of pleasure, brought more stress and fatigue, and increased feelings of depression, anger, pain, and hostility [29]. Noelke et al. [30] concluded from telephone interview data across the United States that when the air temperature rose above 21 °C, people’s PA (e.g., happiness, enjoyment) decreased, NA (e.g., anger, sadness) increased, and fatigue increased. When the temperature decreases, both NA and fatigue are relieved [62]. Differences in PA and NA between the seasons also reflect the effect of thermal comfort on emotions. In Xi’an, China, the per capita PA score in autumn was about five scores higher than in summer, and NA was about 2.5 scores lower [27]. In this study, a unit decrease in PA corresponded to a 4.88 °C increase in PET, but PET did not have an effect on NA. Uncomfortable thermal environments are widely acknowledged to lead to lower PA.
Although these studies showed that uncomfortable thermal stimuli can trigger an increase in NA, in our study, such changes were not dramatic. This is in line with Watson’s view that in daily life, people’s NA levels are relatively low most of the time and that only when they encounter a sudden threat do they experience a spike in NA, and then they recover [38,63,64]. In addition, many studies have shown that exposure to green spaces is associated with lower NA. Brief recreational activities in the forest may effectively reduce stress [65]. Walking in the countryside or forest makes participants feel relaxed physically and mentally [66]. The vegetation in Chongqing is dominated by evergreen tree species, with rich vegetation types and levels and little seasonal variation. People can obtain better emotional value when visiting parks and green spaces throughout the year, keeping NA at a low level.
Emotions are also affected by thermal sensations. In the summer in Chongqing, PA was highest and NA was lowest, in conjunction with the respondents’ slightly cool feelings. In contrast, indoor studies revealed that people had more PA when the TSV was neutral or slightly warm [28]. This differed from our results and could be attributed to differences in the respondents’ environmental adaptations due to age (college students vs. a wide range of ages), cultural background (Korea vs. China), or experimental conditions (indoor vs. outdoor). Comparing the results of PET and TSV effects on emotions in our study may demonstrate that the PET model is more useful in predicting emotional responses. Many researchers have obtained locally modified PET thermal stress intervals in different climatic zones [50,67,68], which makes PET more likely to predict emotional responses. TSV is the thermal sensation of people at that moment and is subjective. The TSV of people in different climatic zones is unique, diminishing the possibility of widespread application of TSV.
Emotions are responses of the nervous system when stimulated by the external environment [69]. Physiological research, such as the brown adipose theory and the serotonin theory, could explain why thermal environments can affect mood (Figure 6). Brown adipose tissue is the main source of non-shivering thermogenesis in mammals [70]. An increasing temperature would activate brown adipose tissue, impairing heat tolerance [71]. Simultaneously, the neural activity of the brain corresponding to the brown adipose tissue would be altered, leading to the production of abnormal emotions or behaviors [72,73]. Serotonin, as a mediator of information transmission between nerve cells in the brain, has been shown to have an important effect on emotional regulation [74]. Summer high temperatures can activate the serotonin 5-HT2A receptor [75], which exacerbates brown adipose tissue thermogenic activity after heat stress [76]. Such internal chemical mechanisms could cause emotional responses that lead to depression or even suicidal tendencies in severe cases [73,77,78].
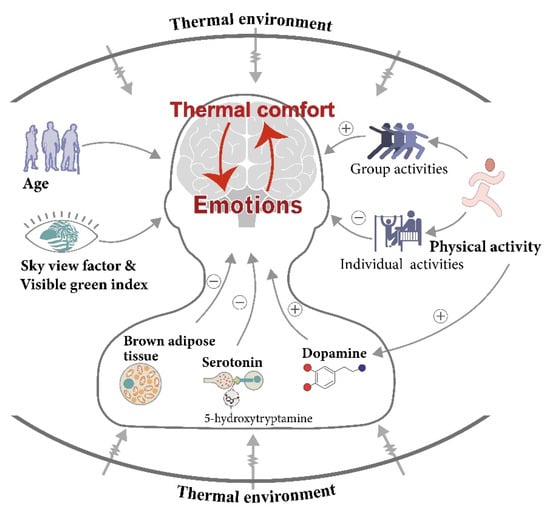
Figure 6.
Factors that affect the relationship between thermal comfort and emotions in green spaces (Note: ⊕ = positive effect, ⊖ = negative effect; figure produced by Jiaqi).
4.2. Other Factors Affecting the Relationship between Thermal Comfort and Emotions in Green Spaces
Emotional responses to the environment are context-dependent and not simply dominated by one sensation or stimulus [79]. People’s emotional responses to thermal comfort can also be influenced by their physical activities, the SVF and VGI of the space, and their ages (Figure 6).
Physical activities promote the release of neurotransmitters such as dopamine and norepinephrine [80,81], which improve emotions and mental health [82]. Numerous studies have confirmed that green physical activity has a greater impact on emotional improvement [83], leading to calmer and more positive emotions [84]. In the present study, many people performed leisure physical activities in spaces OP and MS. The PA scores were higher than those of spaces SS and TS with small SVF when the PET was below 39.29 °C and 35.88 °C, respectively. After the PET continued to rise, people preferred to be sedentary, and thermal comfort affected emotions more. Nevertheless, not all physical activities were beneficial. The mean PA was significantly higher in space OP compared to MS, and NA was higher in MS. People regularly engaged in group physical activities in space OP, while in space MS, they engaged in individual physical activities. More social activities and moderate intensities of physical activity tended to promote emotional well-being [85]. Extending the duration of thermal comfort in open spaces can encourage physical activity and enable people to feel more pleasant. The specific way is to add large canopy trees [86,87]. Trees with broad canopies can provide shade while using less ground area and having less impact on ventilation.
Spatial characteristics also influenced the relationship between thermal perception and emotion. Han [85] found that VGI had a greater effect on emotions than physical activity. Both our study and the study in Xi’an were conducted in the summer with similar changes in the thermal index, but Zhang et al. [27] found that the mean PA was 19.02 in the summer, which was lower than the mean PA (29.53) in our study. This might be explained by the different types of landscape and ages of the subjects. Zhang et al.’s study was conducted on campus with regular landscapes and an average VGI of 23.1% (and 97% of the respondents were college students). Our study was conducted in a park with richer landscapes, with an average VGI of 54.4% (and more middle-aged and older adult respondents). A more natural landscape could increase PA when the thermal environment is similar. An increase in VGI is not necessarily better, in fact, it should match the overall environment. The space MS had a high VGI, which gave the impression of coolness. Higher SVF, however, made people feel brighter and contradicted the cooler visual perception. Inconsistencies in multiple sensory stimuli could restrain PA arousal and raise NA production [79].
Among the different age groups, the young people (18–44-year-old group) may spend more time indoors with air conditioning in the summer; they may be less adaptable to hot green spaces, and higher temperatures could affect their emotions to a greater extent. The older adults’ emotions were least influenced by thermal comfort. They were less stressed at work, and their physical activities in the park were spontaneous, so their PA was higher [42]. They prefer natural ventilation and spending more time in the park over indoor air conditioning. The more time they spend outdoors in natural environments, the more they are exposed to social interactions, and the better their psychological condition [88]. In this study, more than half of the respondents were older adults, which fits with the current demographic situation in China. By the end of 2021, the number of older adults aged 60 and above in China had reached 267 million, accounting for 18.9% of the total population [89]. Older adults are a special group, both psychologically and physically. With the increasing standard of living and the gradual deterioration of their physiological functions, their ability to adapt to the environment is weakened [90,91]. Therefore, providing a healthy and comfortable outdoor environment for older adults is very important for their physical and mental health. Improving the landscape and function of a space can improve thermal sensation [92] and increase PA. Plant colorful ornamental plants. Tables and chairs can be placed under the trees in the spaces to encourage gatherings and conversation.
Emotional responses to thermal environments and thermal comfort are a combination of physiological and psychological factors. People gain information from the physical environment in green spaces, and the sensory system converts physical information into chemical information, which is passed on to the central nervous system to be further processed into human cognition and awareness [93]. Differences in emotional responses to thermal comfort in different age groups may be related to changes in human physiological mechanisms. As people age, their vascular reactivity and cardiovascular flexibility decrease, their thermoregulatory response decreases, their cold/heat defense mechanisms become less sensitive [60,94], changes also occur in thermal perception and thermal sensitivity [95]. Many older adults suffer from chronic diseases such as diabetes, cardiovascular disease, or respiratory diseases [91], which may influence the relationship between their mood and thermal comfort. To protect the health of people of all ages, drinking water facilities should be provided in public spaces. Install first-aid kits and alarm systems for handling emergencies.
4.3. Limitations
Although PANAS is a well-established methodological framework that is relevant to research involving emotions. However, according to the findings, emotions such as shame and guilt rarely come up when people are in green Spaces. Therefore, targeted improvements can be made to PANAS by excluding factors with low factor loads through explanatory factor analysis in future research.
Second, the subjects in our study had all been in the space for more than 15 min and their metabolic rate and thermal perception were already in a relatively stable state [96,97,98]. But people’s thermal comfort was also influenced by short- and long-term thermal history [99] and thermal expectations, all of which may have influenced the emotional response. The likelihood of cardiovascular problems increases with age. People encounter increased pulmonary distress under the influence of air pollution and COVID-19, and health distress may influence emotional responses. Therefore, in the future. we can increase access to respondents’ thermal histories and, with the help of physicians or public health experts, study in depth the physiological processes underlying the relationship between thermal comfort and emotion in different user groups in a reliable manner. To gain a more comprehensive understanding of the effects of thermal comfort on emotional response.
Third, people in different climate zones have adapted to their local climates over time, and a large number of studies have confirmed differences in the neutral temperature of people in different climates [15,100]. Therefore, the range of PET that is most effective for positive mood enhancement in a city with a hot and humid summer such as Chongqing may be different from other climate zones. Extensive research on the effects of thermal comfort on mood in different climate zones should be conducted in the future to complement the outdoor thermal comfort database, allowing the results of thermal comfort on mood to be more applicable to green space design.
Moreover, in the future, we will integrate the research results of various aspects such as thermal environment, physical activity, emotions, and human physiological and psychological responses, propose the optimization and improvement of the existing green space, and verify the optimizing effect through computer simulation to guide the planning and design.
5. Conclusions
Our findings provide evidence that the thermal comfort of green spaces in summer has a greater effect on PA than NA. The increase in PET and TSV caused a significant decrease in PA. NA significantly increased when TSV was hot. Spaces with diverse landscape characteristics perform differently in terms of thermal comfort, which affects people’s moods. In less shaded spaces, PA was more affected by PET, especially regarding emotions that were described as strong, loud, inspired, active, and attentive. In well-shaded spaces, emotions remained at a relatively stable level regardless of PET. Nevertheless, if the space had too much dense greenery, the deterioration of thermal comfort would instead easily stimulate NA with emotions such as fear. Designers should consider extending the thermal comfort time as much as possible and increasing shading and cooling facilities as keys to promoting positive emotions. Sports and social activities, landscape diversity, and multisensory comfort all contribute to the stimulation of PA.
Young people had more dramatic emotional responses. Older adults had less variable emotional responses, even though they tended to be weaker physically and at greater risk for their thermal health. On the one hand, it should be considered for all age groups when planning and designing green spaces; on the other hand, it is important to increase the opportunities for social contact among older adults to enhance positive emotional responses. Given the reality of the increasing aging process in China, it is relevant to focus on older adults in planning and design. In addition, the actual planning can refer to the method of this study by computer simulation of thermal comfort in order to predict emotional responses and adjust the design scheme over time. Today, with the abundance of our material lives, more emphasis should be placed on psychological wealth. Both policymakers and managers of urban planning should carefully consider how to fundamentally improve the mental health of citizens.
Supplementary Materials
The following supporting information can be downloaded at: https://www.mdpi.com/article/10.3390/f14081512/s1, Figure S1: ENVI-met model: vegetation and building (a), soil and surface (b); Figure S2: Significance tests for differences in PA and NA scores across age groups; Table S1: Questionnaire; Table S2: Elements and material description in the model; Table S3: Results of Analysis of Variance (ANOVA) for PA scores for all samples in different TSV categories; Table S4: Results of the Independent-Samples Kruskal-Wallis Test for NA scores for all samples in different TSV categories; Table S5: Post–hoc Tukey’s test for different pairs of TSV categories for the PA scores; Table S6: Pairwise comparisons of TSV categories for the NA scores.
Author Contributions
Conceptualization, J.N. and G.H.; methodology, J.X., J.Y., L.Y. and G.H.; software, J.N. and J.X.; validation, J.N. and J.X.; investigation, J.N., J.X., H.Q. and H.W.; resources, J.Y. and L.Y.; data curation, J.N. and J.X.; writing—original draft preparation, J.N. and J.X.; writing—review and editing, J.N. and G.H.; visualization, J.N. and K.Z.; supervision, G.H.; funding acquisition, G.H. All authors have read and agreed to the published version of the manuscript.
Funding
This study was supported by the National Natural Science Foundation of China (Grant Nos. 51978091 and 51778077) and the Science and Technology Research Program of the Chongqing Education Commission of China (Grant No. KJQN202000515).
Data Availability Statement
Not applicable.
Conflicts of Interest
The authors declare no conflict of interest.
References
- Eisenman, D.P.; Wilhalme, H.; Tseng, C.H.; Chester, M.; English, P.; Pincetl, S.; Fraser, A.; Vangala, S.; Dhaliwal, S.K. Heat Death Associations with the built environment, social vulnerability and their interactions with rising temperature. Health Place 2016, 41, 89–99. [Google Scholar] [CrossRef]
- Christidis, N.; Jones, G.S.; Stott, P.A. Dramatically increasing chance of extremely hot summers since the 2003 European heatwave. Nat. Clim. Chang. 2015, 5, 46–50. [Google Scholar] [CrossRef]
- Hayes, K.; Blashki, G.; Wiseman, J.; Burke, S.; Reifels, L. Climate change and mental health: Risks, impacts and priority actions. Int. J. Ment. Health Syst. 2018, 12, 28. [Google Scholar] [CrossRef] [PubMed]
- Cianconi, P.; Betro, S.; Janiri, L. The Impact of Climate Change on Mental Health: A Systematic Descriptive Review. Front. Psychiatry 2020, 11, 74. [Google Scholar] [CrossRef]
- Diener, E.; Suh, E. Measuring quality of life: Economic, social, and subjective indicators. Soc. Indic. Res. 1997, 40, 189–216. [Google Scholar] [CrossRef]
- Ong, A.D.; Mroczek, D.K.; Riffin, C. The Health Significance of Positive Emotions in Adulthood and Later Life. Soc. Personal. Psychol. Compass 2011, 5, 538–551. [Google Scholar] [CrossRef]
- Kovats, R.S.; Hajat, S. Heat stress and public health: A critical review. Annu. Rev. Public Health 2008, 29, 41–55. [Google Scholar] [CrossRef] [PubMed]
- Feller, S.C.; Castillo, E.G.; Greenberg, J.M.; Abascal, P.; Van Horn, R.; Wells, K.B.; University of California, Los Angeles Community Translational Science Team. Emotional Well-Being and Public Health: Proposal for a Model National Initiative. Public Health Rep. 2018, 133, 136–141. [Google Scholar] [CrossRef]
- Triguero-Mas, M.; Dadvand, P.; Cirach, M.; Martinez, D.; Medina, A.; Mompart, A.; Basagana, X.; Grazuleviciene, R.; Nieuwenhuijsen, M.J. Natural outdoor environments and mental and physical health: Relationships and mechanisms. Environ. Int. 2015, 77, 35–41. [Google Scholar] [CrossRef]
- Tyrväinen, L.; Ojala, A.; Korpela, K.; Lanki, T.; Tsunetsugu, Y.; Kagawa, T. The influence of urban green environments on stress relief measures: A field experiment. J. Environ. Psychol. 2014, 38, 1–9. [Google Scholar] [CrossRef]
- Brown, D.K.; Barton, J.L.; Pretty, J.; Gladwell, V.F. Walks4Work: Assessing the role of the natural environment in a workplace physical activity intervention. Scand. J. Work Environ. Health 2014, 40, 390–399. [Google Scholar] [CrossRef] [PubMed]
- Huang, Q.; Yang, M.; Jane, H.-a.; Li, S.; Bauer, N. Trees, grass, or concrete? The effects of different types of environments on stress reduction. Landsc. Urban Plan. 2020, 193, 103654. [Google Scholar] [CrossRef]
- Schebella, M.; Weber, D.; Schultz, L.; Weinstein, P. The Wellbeing Benefits Associated with Perceived and Measured Biodiversity in Australian Urban Green Spaces. Sustainability 2019, 11, 802. [Google Scholar] [CrossRef]
- Mi, J.; Hong, B.; Zhang, T.; Huang, B.; Niu, J. Outdoor thermal benchmarks and their application to climate–responsive designs of residential open spaces in a cold region of China. Build. Environ. 2020, 169, 106592. [Google Scholar] [CrossRef]
- An, L.; Hong, B.; Cui, X.; Geng, Y.; Ma, X. Outdoor thermal comfort during winter in China’s cold regions: A comparative study. Sci. Total Environ. 2021, 768, 144464. [Google Scholar] [CrossRef] [PubMed]
- Niu, J.; Hong, B.; Geng, Y.; Mi, J.; He, J. Summertime physiological and thermal responses among activity levels in campus outdoor spaces in a humid subtropical city. Sci. Total Environ. 2020, 728, 138757. [Google Scholar] [CrossRef]
- Ma, X.; Song, L.; Hong, B.; Li, Y.; Li, Y. Relationships between EEG and thermal comfort of elderly adults in outdoor open spaces. Build. Environ. 2023, 235, 110212. [Google Scholar] [CrossRef]
- Lai, D.; Zhou, X.; Chen, Q. Measurements and predictions of the skin temperature of human subjects on outdoor environment. Energy Build. 2017, 151, 476–486. [Google Scholar] [CrossRef]
- Aghamohammadi, N.; Fong, C.S.; Mohd Idrus, M.H.; Ramakreshnan, L.; Haque, U. Outdoor thermal comfort and somatic symptoms among students in a tropical city. Sustain. Cities Soc. 2021, 72, 103015. [Google Scholar] [CrossRef]
- Lai, D.; Lian, Z.; Liu, W.; Guo, C.; Liu, W.; Liu, K.; Chen, Q. A comprehensive review of thermal comfort studies in urban open spaces. Sci. Total Environ. 2020, 742, 140092. [Google Scholar] [CrossRef]
- Nikolopoulou, M.; Steemers, K. Thermal comfort and psychological adaptation as a guide for designing urban spaces. Energy Build. 2003, 35, 95–101. [Google Scholar] [CrossRef]
- Banerjee, S.; Middel, A.; Chattopadhyay, S. Outdoor thermal comfort in various microentrepreneurial settings in hot humid tropical Kolkata: Human biometeorological assessment of objective and subjective parameters. Sci. Total Environ. 2020, 721, 137741. [Google Scholar] [CrossRef] [PubMed]
- Klemm, W.; Heusinkveld, B.G.; Lenzholzer, S.; van Hove, B. Street greenery and its physical and psychological impact on thermal comfort. Landsc. Urban Plan. 2015, 138, 87–98. [Google Scholar] [CrossRef]
- Knez, I.; Thorsson, S. Influences of culture and environmental attitude on thermal, emotional and perceptual evaluations of a public square. Int. J. Biometeorol. 2006, 50, 258–268. [Google Scholar] [CrossRef] [PubMed]
- Knez, I.; Thorsson, S. Thermal, emotional and perceptual evaluations of a park: Cross-cultural and environmental attitude comparisons. Build. Environ. 2008, 43, 1483–1490. [Google Scholar] [CrossRef]
- Wang, H.; Liu, L. Experimental investigation about effect of emotion state on people’s thermal comfort. Energy Build. 2020, 211, 109789. [Google Scholar] [CrossRef]
- Zhang, T.; Su, M.; Hong, B.; Wang, C.; Li, K. Interaction of emotional regulation and outdoor thermal perception: A pilot study in a cold region of China. Build. Environ. 2021, 198, 107870. [Google Scholar] [CrossRef]
- Kim, M.; Chong, S.C.; Chun, C.; Choi, Y. Effect of thermal sensation on emotional responses as measured through brain waves. Build. Environ. 2017, 118, 32–39. [Google Scholar] [CrossRef]
- Chen, N.T.; Lin, P.H.; Guo, Y.L. Long-term exposure to high temperature associated with the incidence of major depressive disorder. Sci. Total Environ. 2019, 659, 1016–1020. [Google Scholar] [CrossRef]
- Noelke, C.; McGovern, M.; Corsi, D.J.; Jimenez, M.P.; Stern, A.; Wing, I.S.; Berkman, L. Increasing ambient temperature reduces emotional well-being. Environ. Res. 2016, 151, 124–129. [Google Scholar] [CrossRef]
- Son, Y.J.; Chun, C. Research on electroencephalogram to measure thermal pleasure in thermal alliesthesia in temperature step-change environment. Indoor Air 2018, 28, 916–923. [Google Scholar] [CrossRef] [PubMed]
- Rao, Y.; Dai, J.; Dai, D.; He, Q. Effect of urban growth pattern on land surface temperature in China: A multi-scale landscape analysis of 338 cities. Land Use Policy 2021, 103, 105314. [Google Scholar] [CrossRef]
- Song, J.; Lu, Y.; Zhao, Q.; Zhang, Y.; Yang, X.; Chen, Q.; Guo, Y.; Hu, K. Effect modifications of green space and blue space on heat-mortality association in Hong Kong, 2008–2017. Sci. Total Environ. 2022, 838, 156127. [Google Scholar] [CrossRef]
- Ren, Z.; Fu, Y.; Dong, Y.; Zhang, P.; He, X. Rapid urbanization and climate change significantly contribute to worsening urban human thermal comfort: A national 183-city, 26-year study in China. Urban Clim. 2022, 43, 101154. [Google Scholar] [CrossRef]
- Baquero Larriva, M.T.; Higueras, E. Health risk for older adults in Madrid, by outdoor thermal and acoustic comfort. Urban Clim. 2020, 34, 100724. [Google Scholar] [CrossRef]
- He, D.; Miao, J.; Lu, Y.; Song, Y.; Chen, L.; Liu, Y. Urban greenery mitigates the negative effect of urban density on older adults’ life satisfaction: Evidence from Shanghai, China. Cities 2022, 124, 103607. [Google Scholar] [CrossRef]
- Feng, J.; Tang, S.; Chuai, X. The impact of neighbourhood environments on quality of life of elderly people: Evidence from Nanjing, China. Urban Stud. 2017, 55, 2020–2039. [Google Scholar] [CrossRef]
- Watson, D. Mood and Temperament; Guilford Press: New York, NY, USA, 2000. [Google Scholar]
- Climate–Dataorg. Climate Data for Cities Worldwide. Available online: https://en.climate-data.org/ (accessed on 4 January 2021).
- Qin, H.; Cheng, X.; Han, G.; Wang, Y.; Deng, J.; Yang, Y. How thermal conditions affect the spatial-temporal distribution of visitors in urban parks: A case study in Chongqing, China. Urban For. Urban Green. 2021, 66, 127393. [Google Scholar] [CrossRef]
- Zhang, J.; Gou, Z.; Lu, Y.; Lin, P. The impact of sky view factor on thermal environments in urban parks in a subtropical coastal city of Australia. Urban For. Urban Green. 2019, 44, 126422. [Google Scholar] [CrossRef]
- Chen, K.; Zhang, T.; Liu, F.; Zhang, Y.; Song, Y. How Does Urban Green Space Impact Residents’ Mental Health: A Literature Review of Mediators. Int. J. Environ. Res. Public Health 2021, 18, 11746. [Google Scholar] [CrossRef]
- Aoki, Y. Relationship between perceived greenery and width of visual fields. J. Jpn. Inst. Landsc. Archit. 1987, 51, 1–10. [Google Scholar]
- Xia, Y.; Yabuki, N.; Fukuda, T. Sky view factor estimation from street view images based on semantic segmentation. Urban Clim. 2021, 40, 100999. [Google Scholar] [CrossRef]
- Li, X.; Zhang, C.; Li, W.; Ricard, R.; Meng, Q.; Zhang, W. Assessing street-level urban greenery using Google Street View and a modified green view index. Urban For. Urban Green. 2015, 14, 675–685. [Google Scholar] [CrossRef]
- ASHRAE Standard 55-2017; Thermal Environmental Conditions for Human Occupancy. American Society of Heating. Refrigerating and Air-Conditioning Engineers—ASHRAE: Atlanta, GA, USA, 2017.
- Kuesten, C.; Chopra, P.; Bi, J.; Meiselman, H.L. A global study using PANAS (PA and NA) scales to measure consumer emotions associated with aromas of phytonutrient supplements. Food Qual. Prefer. 2014, 33, 86–97. [Google Scholar] [CrossRef]
- Pelegrín-Borondo, J.; Olarte-Pascual, C.; Oruezabala, G. Wine tourism and purchase intention: A measure of emotions according to the PANAS scale. J. Wine Res. 2020, 31, 101–123. [Google Scholar] [CrossRef]
- Watson, D.; Clark, L.A.; Tellegen, A. Development and validation of brief measures of positive and negative affect: The PANAS scales. J. Personal. Soc. Psychol. 1988, 54, 1063–1070. [Google Scholar] [CrossRef]
- Potchter, O.; Cohen, P.; Lin, T.P.; Matzarakis, A. Outdoor human thermal perception in various climates: A comprehensive review of approaches, methods and quantification. Sci. Total Environ. 2018, 631–632, 390–406. [Google Scholar] [CrossRef]
- Li, J.; Liu, N. The perception, optimization strategies and prospects of outdoor thermal comfort in China: A review. Build. Environ. 2020, 170, 106614. [Google Scholar] [CrossRef]
- Roth, M.; Lim, V.H. Evaluation of canopy-layer air and mean radiant temperature simulations by a microclimate model over a tropical residential neighbourhood. Build. Environ. 2017, 112, 177–189. [Google Scholar] [CrossRef]
- Ouyang, W.; Sinsel, T.; Simon, H.; Morakinyo, T.E.; Liu, H.; Ng, E. Evaluating the thermal-radiative performance of ENVI-met model for green infrastructure typologies: Experience from a subtropical climate. Build. Environ. 2022, 207, 108427. [Google Scholar] [CrossRef]
- Lam, C.K.C.; Lee, H.; Yang, S.-R.; Park, S. A review on the significance and perspective of the numerical simulations of outdoor thermal environment. Sustain. Cities Soc. 2021, 71, 102971. [Google Scholar] [CrossRef]
- China Meteorological Administration (CMA). Available online: http://data.cma.cn/ (accessed on 4 January 2021).
- Willmott, C.J. Some comments on the evaluation of model performance. Bull. Am. Meteorol. Soc. 1982, 63, 1309–1313. [Google Scholar] [CrossRef]
- Tsoka, S.; Tsikaloudaki, A.; Theodosiou, T. Analyzing the ENVI-met microclimate model’s performance and assessing cool materials and urban vegetation applications—A review. Sustain. Cities Soc. 2018, 43, 55–76. [Google Scholar] [CrossRef]
- Alchapar, N.L.; Correa, E.N. The use of reflective materials as a strategy for urban cooling in an arid “OASIS” city. Sustain. Cities Soc. 2016, 27, 1–14. [Google Scholar] [CrossRef]
- Huang, B.; Hong, B.; Tian, Y.; Yuan, T.; Su, M. Outdoor thermal benchmarks and thermal safety for children: A study in China’s cold region. Sci. Total Environ. 2021, 787, 147603. [Google Scholar] [CrossRef]
- Blatteis, C.M. Age-dependent changes in temperature regulation—A mini review. Gerontology 2012, 58, 289–295. [Google Scholar] [CrossRef]
- van Hoof, J.; Schellen, L.; Soebarto, V.; Wong, J.K.W.; Kazak, J.K. Ten questions concerning thermal comfort and ageing. Build. Environ. 2017, 120, 123–133. [Google Scholar] [CrossRef]
- Huang, H.; Li, Y.; Zhao, Y.; Zhai, W. Analysis of the impact of urban summer high temperatures and outdoor activity duration on residents’ emotional health: Taking hostility as an example. Front. Public Health 2022, 10, 955077. [Google Scholar] [CrossRef]
- Harmon-Jones, E.; Harmon-Jones, C.; Abramson, L.; Peterson, C.K. PANAS positive activation is associated with anger. Emotion 2009, 9, 183–196. [Google Scholar] [CrossRef]
- Watson, D.; Clark, L.A. The PANAS-X: Manual for the Positive and Negative Affect Schedule—Expanded Form; University of Iowa: Iowa City, IA, USA, 1994. [Google Scholar]
- Bielinis, E.; Takayama, N.; Boiko, S.; Omelan, A.; Bielinis, L. The effect of winter forest bathing on psychological relaxation of young Polish adults. Urban For. Urban Green. 2018, 29, 276–283. [Google Scholar] [CrossRef]
- Song, C.; Ikei, H.; Kobayashi, M.; Miura, T.; Taue, M.; Kagawa, T.; Li, Q.; Kumeda, S.; Imai, M.; Miyazaki, Y. Effect of forest walking on autonomic nervous system activity in middle-aged hypertensive individuals: A pilot study. Int. J. Environ. Res. Public Health 2015, 12, 2687–2699. [Google Scholar] [CrossRef]
- Tian, Y.; Hong, B.; Zhang, Z.; Wu, S.; Yuan, T. Factors influencing resident and tourist outdoor thermal comfort: A comparative study in China’s cold region. Sci. Total Environ. 2022, 808, 152079. [Google Scholar] [CrossRef] [PubMed]
- Yuan, T.; Hong, B.; Qu, H.; Liu, A.; Zheng, Y. Outdoor thermal comfort in urban and rural open spaces: A comparative study in China’s cold region. Urban Clim. 2023, 49, 101501. [Google Scholar] [CrossRef]
- Plutchik, R. Emotions and Life: Perspectives from Psychology, Biology, and Evolution; American Psychological Association: Washington, DC, USA, 2003. [Google Scholar]
- Lee, P.; Bova, R.; Schofield, L.; Bryant, W.; Dieckmann, W.; Slattery, A.; Govendir, M.A.; Emmett, L.; Greenfield, J.R. Brown Adipose Tissue Exhibits a Glucose-Responsive Thermogenic Biorhythm in Humans. Cell Metab. 2016, 23, 602–609. [Google Scholar] [CrossRef]
- Vaughan, C.H.; Bartness, T.J. Anterograde transneuronal viral tract tracing reveals central sensory circuits from brown fat and sensory denervation alters its thermogenic responses. Am. J. Physiol. Regul. Integr. Comp. Physiol. 2012, 302, R1049–R1058. [Google Scholar] [CrossRef]
- Helama, S.; Holopainen, J.; Partonen, T. Temperature-associated suicide mortality: Contrasting roles of climatic warming and the suicide prevention program in Finland. Environ. Health Prev. Med. 2013, 18, 349–355. [Google Scholar] [CrossRef] [PubMed]
- Holopainen, J.; Helama, S.; Partonen, T. Does diurnal temperature range influence seasonal suicide mortality? Assessment of daily data of the Helsinki metropolitan area from 1973 to 2010. Int. J. Biometeorol. 2014, 58, 1039–1045. [Google Scholar] [CrossRef]
- Haleem, D.J. Behavioral deficits and exaggerated feedback control over raphe-hippocampal serotonin neurotransmission in restrained rats. Pharmacol. Rep. 2011, 63, 888–897. [Google Scholar] [CrossRef]
- Zhang, G.; Tao, R. Enhanced responsivity of 5-HT2A receptors at warm ambient temperatures is responsible for the augmentation of the 1-(2,5-dimethoxy-4-iodophenyl)-2-aminopropane (DOI)-induced hyperthermia. Neurosci. Lett. 2011, 490, 68–71. [Google Scholar] [CrossRef]
- Ootsuka, Y.; Blessing, W.W. Thermogenesis in brown adipose tissue: Increase by 5-HT2A receptor activation and decrease by 5-HT1A receptor activation in conscious rats. Neurosci. Lett. 2006, 395, 170–174. [Google Scholar] [CrossRef]
- Molteni, R.; Cattaneo, A.; Calabrese, F.; Macchi, F.; Olivier, J.D.; Racagni, G.; Ellenbroek, B.A.; Gennarelli, M.; Riva, M.A. Reduced function of the serotonin transporter is associated with decreased expression of BDNF in rodents as well as in humans. Neurobiol. Dis. 2010, 37, 747–755. [Google Scholar] [CrossRef] [PubMed]
- Gao, J.; Cheng, Q.; Duan, J.; Xu, Z.; Bai, L.; Zhang, Y.; Zhang, H.; Wang, S.; Zhang, Z.; Su, H. Ambient temperature, sunlight duration, and suicide: A systematic review and meta-analysis. Sci. Total Environ. 2019, 646, 1021–1029. [Google Scholar] [CrossRef] [PubMed]
- Schreuder, E.; van Erp, J.; Toet, A.; Kallen, V.L. Emotional Responses to Multisensory Environmental Stimuli: A Conceptual Framework and Literature Review. SAGE Open 2016, 6, 1–19. [Google Scholar] [CrossRef]
- Deslandes, A.; Moraes, H.; Ferreira, C.; Veiga, H.; Silveira, H.; Mouta, R.; Pompeu, F.A.; Coutinho, E.S.; Laks, J. Exercise and mental health: Many reasons to move. Neuropsychobiology 2009, 59, 191–198. [Google Scholar] [CrossRef] [PubMed]
- Etnier, J.L.; Salazar, W.; Landers, D.M.; Petruzzello, S.J.; Han, M.; Nowell, P. The influence of physical fitness and exercise upon cognitive functioning: A meta-analysis. J. Sport Exerc. Psychol. 1997, 19, 249–277. [Google Scholar] [CrossRef]
- Stathopoulou, G.; Powers, M.B.; Berry, A.C.; Smits, J.A.J.; Otto, M.W. Exercise Interventions for Mental Health: A Quantitative and Qualitative Review. Clin. Psychol. Sci. Pract. 2006, 13, 179–193. [Google Scholar] [CrossRef]
- Sanders, T.; Feng, X.; Fahey, P.P.; Lonsdale, C.; Astell-Burt, T. The influence of neighbourhood green space on children’s physical activity and screen time: Findings from the longitudinal study of Australian children. Int. J. Behav. Nutr. Phys. Act. 2015, 12, 126. [Google Scholar] [CrossRef]
- Jabbar, M.; Yusoff, M.M.; Shafie, A. Assessing the role of urban green spaces for human well-being: A systematic review. GeoJournal 2022, 87, 4405–4423. [Google Scholar] [CrossRef]
- Han, K.-T. The effect of nature and physical activity on emotions and attention while engaging in green exercise. Urban For. Urban Green. 2017, 24, 5–13. [Google Scholar] [CrossRef]
- Xu, M.; Hong, B.; Jiang, R.; An, L.; Zhang, T. Outdoor thermal comfort of shaded spaces in an urban park in the cold region of China. Build. Environ. 2019, 155, 408–420. [Google Scholar] [CrossRef]
- Zhang, T.; Hong, B.; Su, X.; Li, Y.; Song, L. Effects of tree seasonal characteristics on thermal-visual perception and thermal comfort. Build. Environ. 2022, 212, 108793. [Google Scholar] [CrossRef]
- Kruize, H.; van Kamp, I.; van den Berg, M.; van Kempen, E.; Wendel-Vos, W.; Ruijsbroek, A.; Swart, W.; Maas, J.; Gidlow, C.; Smith, G.; et al. Exploring mechanisms underlying the relationship between the natural outdoor environment and health and well-being—Results from the PHENOTYPE project. Environ. Int. 2020, 134, 105173. [Google Scholar] [CrossRef] [PubMed]
- NHC. National Health Commission of the People’s Republic of China. Available online: http://www.nhc.gov.cn/ (accessed on 30 June 2023).
- Mendes, A.; Bonassi, S.; Aguiar, L.; Pereira, C.; Neves, P.; Silva, S.; Mendes, D.; Guimarães, L.; Moroni, R.; Teixeira, J.P. Indoor air quality and thermal comfort in elderly care centers. Urban Clim. 2015, 14, 486–501. [Google Scholar] [CrossRef]
- Ma, X.; Tian, Y.; Du, M.; Hong, B.; Lin, B. How to design comfortable open spaces for the elderly? Implications of their thermal perceptions in an urban park. Sci. Total Environ. 2021, 768, 144985. [Google Scholar] [CrossRef] [PubMed]
- Niu, J.; Xiong, J.; Qin, H.; Hu, J.; Deng, J.; Han, G.; Yan, J. Influence of thermal comfort of green spaces on physical activity: Empirical study in an urban park in Chongqing, China. Build. Environ. 2022, 219, 109168. [Google Scholar] [CrossRef]
- Knez, I.; Thorsson, S.; Eliasson, I.; Lindberg, F. Psychological mechanisms in outdoor place and weather assessment: Towards a conceptual model. Int. J. Biometeorol. 2009, 53, 101–111. [Google Scholar] [CrossRef]
- Matzarakis, A.; Laschewski, G.; Muthers, S. The heat health warning system in Germany—Application and warnings for 2005 to 2019. Atmosphere 2020, 11, 170. [Google Scholar] [CrossRef]
- Baquero-Larriva, M.T.; Higueras-García, E. Environmental factors influencing the elderly’s use of public spaces in Madrid. Rev. Urbano 2019, 22, 108–126. [Google Scholar] [CrossRef]
- Goto, T.; Toftum, J.; de Dear, R.; Fanger, P.O. Thermal sensation and thermophysiological responses to metabolic step-changes. Int. J. Biometeorol. 2006, 50, 323–332. [Google Scholar] [CrossRef]
- Li, Y.; Hong, B.; Wang, Y.; Bai, H.; Chen, H. Assessing heat stress relief measures to enhance outdoor thermal comfort: A field study in China’s cold region. Sustain. Cities Soc. 2022, 80, 103813. [Google Scholar] [CrossRef]
- Su, M.; Hong, B.; Su, X.; Liu, A.; Chang, J. How the nozzle density and height of mist spraying affect pedestrian outdoor thermal comfort: A field study. Build. Environ. 2022, 215, 108968. [Google Scholar] [CrossRef]
- Lam, C.K.C.; Hang, J.; Zhang, D.; Wang, Q.; Ren, M.; Huang, C. Effects of short-term physiological and psychological adaptation on summer thermal comfort of outdoor exercising people in China. Build. Environ. 2021, 198, 107877. [Google Scholar] [CrossRef]
- da Silveira Hirashima, S.Q.; Katzschner, A.; Ferreira, D.G.; de Assis, E.S.; Katzschner, L. Thermal comfort comparison and evaluation in different climates. Urban Clim. 2018, 23, 219–230. [Google Scholar] [CrossRef]


Disclaimer/Publisher’s Note: The statements, opinions and data contained in all publications are solely those of the individual author(s) and contributor(s) and not of MDPI and/or the editor(s). MDPI and/or the editor(s) disclaim responsibility for any injury to people or property resulting from any ideas, methods, instructions or products referred to in the content. |
© 2023 by the authors. Licensee MDPI, Basel, Switzerland. This article is an open access article distributed under the terms and conditions of the Creative Commons Attribution (CC BY) license (https://creativecommons.org/licenses/by/4.0/).