Article

Niche and Interspecific Association of Dominant Tree Species in Spruce–Fir Mixed Forests in Northeast China

1
College of Forestry, Beijing Forestry University, Beijing 100083, China
2
State Key Laboratory of Efficient Production of Forest Resources, College of Forestry, Beijing Forestry University, Beijing 100083, China
*
Author to whom correspondence should be addressed.
Forests 2023, 14(8), 1513; https://doi.org/10.3390/f14081513
Submission received: 3 July 2023 / Revised: 20 July 2023 / Accepted: 24 July 2023 / Published: 25 July 2023
(This article belongs to the Section Forest Ecology and Management)

Abstract

:
This study focuses on the natural coniferous and broad-leaved mixed forest dominated by Picea asperata and Abies fabri in the Jingouling Forest Farm of Northeast China. Specifically, we place emphasis on examining the effects of different thinning intensities. By comparing the niche characteristics and interspecific associations of dominant tree species under various thinning intensity conditions, our aim is to gain deeper insights into the patterns of resource utilization by species and the interplay of tree species in the forest canopy. Based on plot survey data, analysis methods such as niche breadth, niche overlap index, Pearson correlation coefficient, and Spearman’s rank correlation coefficient were used to analyze the niche and interspecific relationship characteristics of the dominant tree species in the community. The results indicate that among the four selective cutting intensities, the tree species with the highest importance value in all cases is Abies fabri, with an average importance value of 30.29%. Additionally, Picea asperata exhibits the widest niche breadth among the tree species, with a value of 4.59. The selective thinning in this study resulted in a reduction of average species niche overlap in the community compared to the control plots. There were both positive and negative interspecies associations observed, but they were statistically insignificant. Few pairs showed significant correlations, with the positive-to-negative ratio of Pearson coefficients decreasing as the selective cutting intensity increased. The Spearman rank correlation analysis revealed a positive-to-negative ratio exceeding one for species pairs in the community under both light and heavy-cutting conditions, with no significant negative correlations observed. In summary, selective cutting disturbance can effectively increase the importance value of the dominant tree species, Abies fabri, in the community. However, it leads to a reduction in the niche breadth of all tree species present in the forest. Moderate selective cutting is considered a more suitable intensity, as it promotes the maintenance of biodiversity and yields higher forest management benefits in the mixed forest of Picea asperata and Abies fabri in Northeast China.

1. Introduction

Interactions between species in communities are an important part of ecological research, including issues such as competition between species for limited resources and achieving stable coexistence, which is generally revealed through the niches and interspecific association characteristics of species [1]. The niche is the combined use of resources by each species in a community and the functional relationships with other related populations and indicated the status and importance of the species in the community [2]. The study of niches plays an important role in understanding the mechanisms of species coexistence and predicting community succession [3]. Niche breadth reflects the utilization ability of species to resources and environment [4], while niche overlap reveals the degree of common utilization of two species in a community on a certain resource, including sharing and competition [5]. Interspecific connection refers to the correlation between species in spatial distribution, which mainly depends on their coexistence in a specific environment [6]. This connection is an important feature in a community and is crucial for its formation and evolution [7]. It is known that complex and stable forest communities are the result of competition and replacement among different plants and competition and replacement between species can lead to changes in community structure [8]. In the process of gradually transitioning from a low-stability pioneer community to a high-stability top-level community [9], the positive correlation between species gradually strengthens [10], while in the process of species invasion and ecosystem degradation, the positive correlation between species gradually weakens and the negative correlation gradually strengthens [11]. Thus, interspecific linkages can be studied to better understand interactions [12], ecological relationships, and population dynamics between species [13].
At present, different forest ages [14], different gap sizes [15], different site conditions [16], different community types, etc. have been the main focus of research on niches and interspecific associations [17], and there is no research from the perspective of selective cutting intensity. This study aims to explore the spruce–fir mixed forest in Jingouling Forest Farm, Wangqing County, Jilin Province, China. Through analyzing the importance values, niche characteristics, and interspecific associations within the tree layer, our goal is to unveil the resource utilization patterns of species under varying thinning intensities and comprehend the self-regulation mechanisms of tree species [18]. Ultimately, this research aims to offer theoretical support for the sustainable development of the spruce–fir natural conifer–broadleaf mixed forests.

2. Materials and Methods

2.1. Location Overview of Study Area

The study area is located in Jingouling Forest Farm, Wangqing County, Jilin Province (129°56′~131°4′ E, 43°5′~43°40′ N). This area belongs to the Laoyeling Mountains of Paektu Mountain system. The terrain consists of low mountains, hills and basins, with an altitude of 300~1200 m and a slope of 5%~25%. The study area has a temperate continental monsoon climate, with an average annual temperature of 3.9 °C and an average annual rainfall of 580 mm. The main tree species in the study area are Picea asperata and Abies fabri, and other tree species include Pinus koraiensis, Betula costata, Tilia tuan, Populus davidiana, and Larix gmelinii, and several others.

2.2. Data Sources

This article takes 20 fixed plots of spruce and fir natural coniferous and deciduous mixed forests established in Jingouling Forest Farm in 1986 as the research object, with a sample area of 0.20~0.21 ha and basically the same site conditions. The 20 sample plots were divided into four groups, and the groups were subjected to different intensities of selective thinning in 1986; the four groups were control, light (20%), moderate (30%), and heavy (40%) selective logging, respectively. Basic information on each plot is given in Table 1. Every live tree with a diameter at breast height greater than or equal to 5 cm in the sample plot was measured. The tree diameter at breast height (DBH) was measured at 1.3 m above ground level using a tree diameter measuring tape, and tree height was measured using a laser altimeter. Sample plots are re-tested every 2 years since 1986 and this study used the remeasurement data from the 2019 sample plots.

2.3. Data Analysis

2.3.1. Calculation of Important Values

Calculate the relative density (RD), relative frequency (RF), and relative significance (RC) based on the grouping of different selective logging intensities. Using the importance value [19] (IV) as the measure of the dominant species, the calculation formula is as follows:
I V = ( R D + R F + R C ) / 3 .

2.3.2. Calculation of Niche Breadth and Overlap Index

Levins index [20] (BL) is used to calculate the niche breadth of the dominant tree species. The formula is as follows:
B L , i = 1 / j = 1 r P i j 2 .
In the formula, Pij is the proportion of the important value of tree species i in the sample j to the total important value of all samples.
The niche overlap between various tree species is calculated by the formula of Pianka’s niche overlap index [21], which is as follows:
O i k = j = 1 r P i j P k j ( j = 1 r P i j ) 2 ( j = 1 r P k j ) 2 .
In the formula, Oik is the overlap ratio between tree species i and k; Pij and Pkj are the important values of tree species i and k on plot j. The higher the value of Oik, the higher the ecological or biological similarity between the two species.

2.3.3. Overall Connectivity Test

The variance ratio [22] (RV) method is used to calculate the overall connectivity of the community, and the statistical W is used to test the degree of correlation. The calculation formula is as follows:
R V = 1 N j = 1 N ( T j t ) 2 i = 1 S n i N ( 1 n i N ) ,
W = R V N .
In the formula, S represents the total population; N is the number of sample plots; Tj is the number of populations in sample plot j; t is the average number of populations in sample plot; ni is the number of plots where population i appears; RV is a quantitative value of the overall connectivity of the community, and RV > 1 indicates a positive correlation throughout the community; RV = 1 indicates that the whole community is uncorrelated; RV < 1 indicates a negative correlation in the overall community. Using W to test the degree of RV deviation from 1, when W falls into the interval, it indicates that the interspecific correlation is not significant; on the contrary, the biological interaction is significant.

2.3.4. Test for Interspecific Correlation

Pearson’s correlation coefficient [23] and Spearman’s rank correlation coefficient [24] were used to quantify the biological interaction and degree of correlation between each species.
Pearson’s correlation coefficient calculation formula is as follows:
r p ( i , k ) = 1 j = 1 N ( x i j x k j ) 2 N 3 N .
The Spearman’s rank correlation coefficient calculation formula is as follows:
r s ( i , k ) = j = 1 N ( x i j x ¯ i ) ( x k j x ¯ k ) j = 1 N ( x i j x ¯ i ) 2 j = 1 N ( x k j x ¯ k ) 2 .
In the formula, N represents the number of sample plots; xij and xkj are the abundance values of tree species i and k in sample j, x ¯ i , and x ¯ k are the average abundance values of tree species i and k in all samples, respectively. The range of values for rp(i,k) and rs(i,k) is [−1, 1], with positive values indicating positive correlation and negative values indicating negative correlation. A value of 0 indicates no correlation.

2.3.5. Data Analysis

Excel2016 and SPSS26 software were used to analyze and sort out the data, vegan and spa packages of R4.3.0 software were used to analyze the population niche characteristics, and Origin2021 software was used for mapping.

3. Results

3.1. Importance Value and Niche Breadth of Dominant Tree Species

A total of 18 tree species belonging to 14 families and 16 genera were recorded in the 20 sample plots of spruce–fir mixed forest investigated. The importance value IV and Levin’s niche width BL of each tree species in the four groups of sample plots with different selective thinning intensities were calculated and sorted according to their average importance values. The tree species with average importance value greater than two were selected as the dominant tree species in the community. The results are presented in Table 2.
The tree species with the highest important value among the four selective thinning intensities are all Abies fabri, with an average value of 30.29%, making it the most dominant species in the community. The tree species with an average importance value of more than 8% are also Pinus koraiensis, Picea asperata, and Tilia tuan. For the main tree species, fir and spruce, in the sample plot, the important values under the three selective thinning intensities were higher than those in the control group, and the increase was largest under the moderate selective thinning intensity. For other tree species, with the exception of Larix gmelinii and Populus davidiana, the important value after selective thinning is lower than that non-selective thinning. It shows that moderate selective thinning can effectively improve the resource competitiveness of the main tree species in the stand and increase their Importance in the stand.
Picea asperata had the greatest mean niche breadth among all the sample sites, indicating that it has a good use of resources in the community, is evenly distributed, and has a strong ability to compete and survive in the community. The importance values for Abies fabri, Pinus koraiensis, and Larix gmelinii are all large, but the niche breadths are relatively small, indicating that although these three species are more numerous in the community, the sum of available resources is small, suggesting that they have a high degree of specialization in resource use and are at a disadvantage in resource competition. Phellodendron amurense, Ulmus laciniata, and Fraxinus mandschurica have the smallest importance values and ecological niche widths in the community, indicating that these three species are less distributed in the sample site, have weaker use of the environment and resources, and have less interspecific competition.

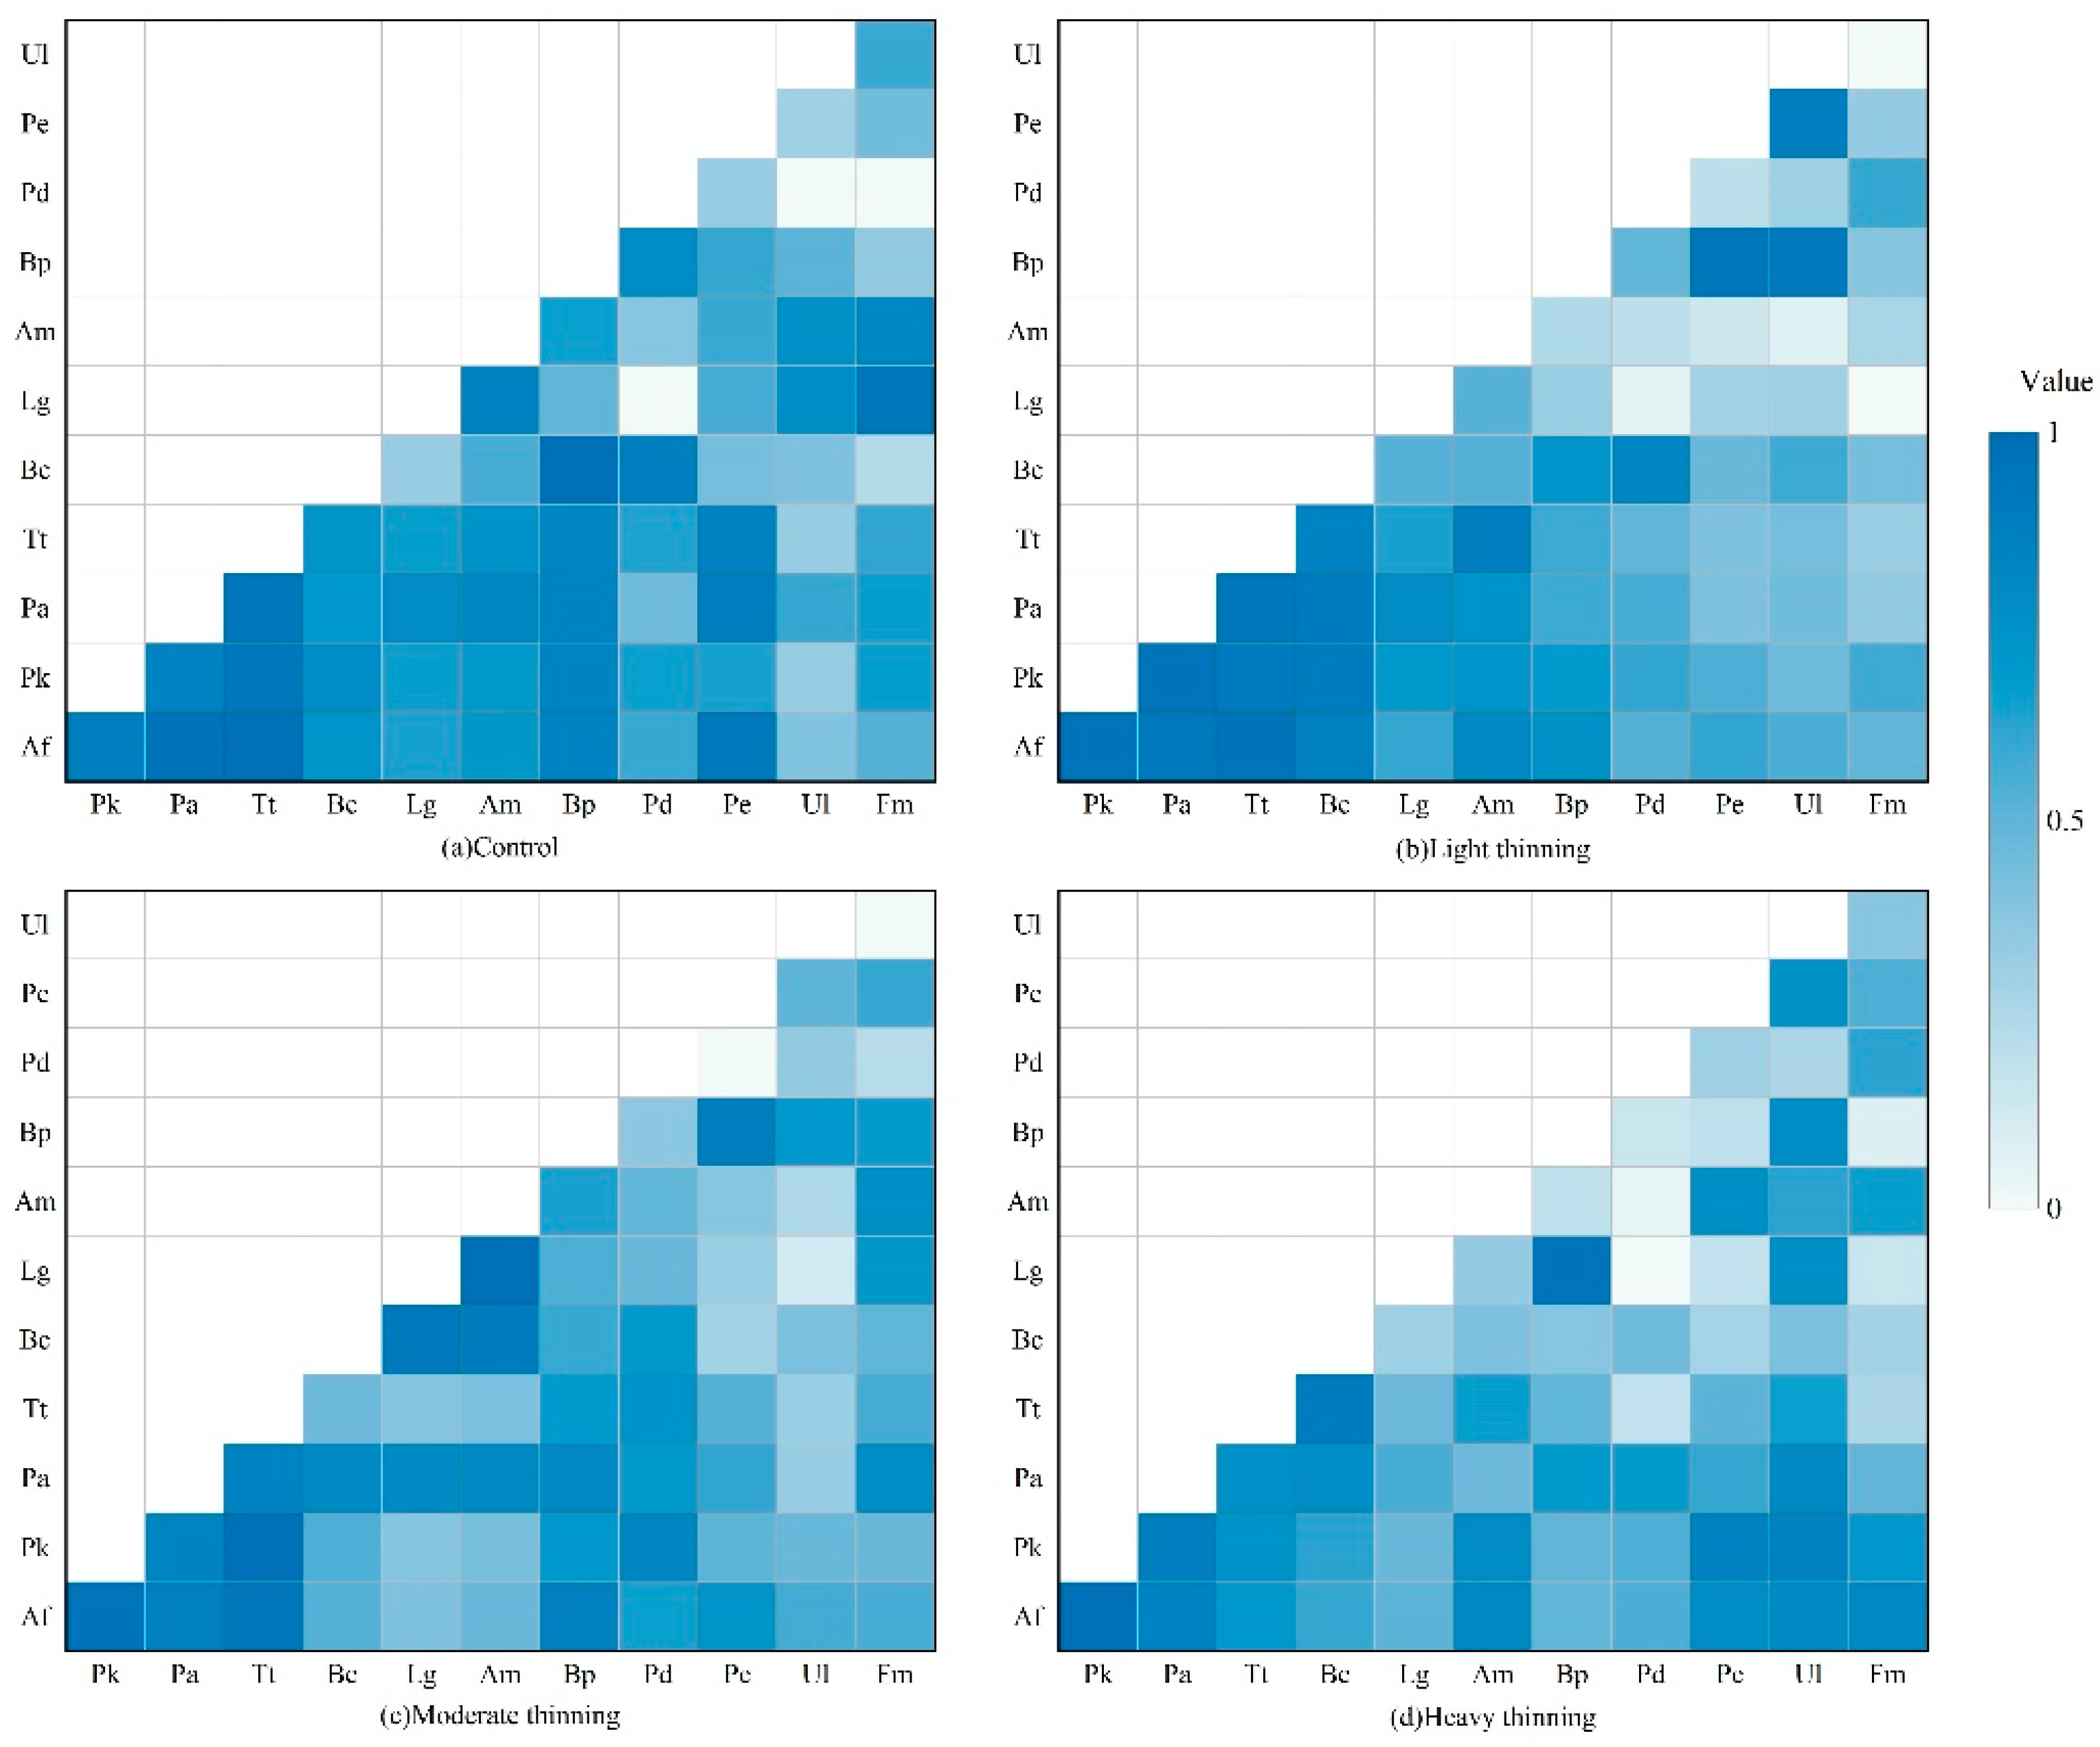
3.2. Niche Overlap of Dominant Tree Species

Niche overlap indicates that two species occupy and use the same resource, and the Pianka niche overlap index of dominant tree species in spruce–fir mixed forest under different selective thinning intensities is shown in Figure 1.
Among 66 pairs of 12 tree species in the control plots, 63 pairs (95.45%) had overlapping ecological niches, with a mean Pianka index of 0.634 for all pairs. There is obvious niche overlap between Abies fabri and Picea asperata and other 11 tree species in the community, and the mean value of the Pianka niche overlap index is 0.744 and 0.773. Both of them are the maximum value of the niche overlap index of 0.979 and the maximum value within the community. This indicates that Abies fabri and Picea asperata have a high degree of utilization of environment and resources in the community, but the interspecific competition is large, which is detrimental to the growth of both.
In the Light thinning sample plot, 64 groups (96.97%) of species pairs have overlapping niches. The average overlapping index of all species pairs is 0.561, and the maximum is 0.961 of fir–linden, which indicates that fir and linden require similar environmental factors in the Light thinning sample plot and interspecific competition is strong. The mean overlap index of fir and spruce in the community was 0.732 and 0.693, respectively, and the overlap indices of both species pairs with red pine were high at 0.957 and 0.956. This indicates that fir, spruce, and red pine, as the main dominant species in the Light thinning sample plots, have a strong comprehensive utilization capacity of environment and resources, which in turn leads to a high ecological niche overlap with other tree species.
In the moderate selective thinning sample plot, there were 64 groups (96.97%) of species pairs with niche overlap, the average niche overlap index was 0.585, and there was no species pair with an overlap index of one. Only the overlap index of Populus davidiana-Phellodendron amurense and Fraxinus mandschurica-Ulmus laciniata is 0, and the breadth of these four species in the niche is similar, indicating that they occupy relatively independent resources in the community and do not interfere with each other. The maximum value of the community Pianka ecotone overlap index is 0.977 for red pine–tinden. The average niche overlap index in the community was 0.688 for fir and 0.745 for spruce, and the maximum overlap index of fir is 0.955 for the fir–red pine species pair.
In the heavily selectively harvested sample plots, the 12 species constitute 66 species pairs, all of which have overlapping niches and no pairs with an overlap index of 1, the average niches overlap index is 0.547. It shows that compared with other selective thinning intensities, heavy thinning has a better coordination and promotion relationship with the biological interaction of dominant species in the community, which is conducive to the stable development of the forest. The species pair with the largest overlap index in the community was fir–red pine at 0.976, with mean values of 0.717, 0.687, and 0.722 for fir, spruce and red pine in the community. The niche breadth of the three is also very close, indicating that interspecific competition of the main tree species in the community is strong under the intensive selective thinning and that the niche differentiation is not obvious, which is not conducive to the growth and community evolution of the main tree species.
The control sample plot had the largest mean niche overlapping index of 0.634, followed by moderate selective thinning at 0.585, light selective thinning at 0.561, and heavy selective thinning at 0.547. It can be seen that with the increase of selective thinning intensity, the average value of the niche overlap index has a decreasing trend, and the sample plots with selective thinning are significantly smaller than those without selective thinning. It shows that appropriate selective thinning can effectively reduce competition between major tree species in the community, promote harmonious interspecific relationships, and facilitate population succession.
Figure 2 shows the overlapping distribution pattern of the niche of dominant tree species under different selection intensities. There were four pairs (6.06%) with niche overlap ≤0.25 and 23 pairs (34.85%) with niche overlap ≥0.75 in the control plot; 8 (12.12%) of the pairs of light thinning sample plots had a niche overlap of ≤0.25 and 17 (25.76%) of the pairs of ≥0.75; the number of pairs of moderate thinning sample plots with niche overlap ≤0.25 was 4 (6.06%) and the number of pairs ≥0.75 was 17 (25.76%); 9 (13.64%) of the pairs of heavily thinning sample plots had a niche overlap of ≤0.25 and 18 (27.27%) of the pairs of ≥0.75. The above data show that in the absence of human interference, the niche overlap among the dominant species is evident and there is a tendency for the community structure to change significantly. With the increase of selective thinning intensity, the degree of interspecific niche overlap decreases significantly, indicating that selective thinning interference has enhanced the competition between tree species in the community for resources to a certain extent, and promoted the ecological cooperation among tree species. And, the niche breadth is closely related to the niche overlap index.

3.3. Overall Interspecies Association

According to the matrix calculation of the existence of 12 dominant tree species, the RV of the control plot is 0.533 < 1, the RV of the light thinning plot is 1.333 > 1, the RV of the moderate thinning plot is 0.5 < 1, and the RV of the heavy thinning plot is 2.048 > 1. This indicates that in the sample plots without or with moderate thinning disturbance, the dominant tree species showed a negative correlation overall, while in the sample plots with light thinning and heavy thinning, the tree species showed an overall positive correlation.
Using the statistic W to detect significant deviations of RV deviation from 1, the W values for the four thinning intensities were 2.667, 6.667, 2.5, and 10.238, respectively. The table shows that χ2(0.95,5) = 1.145 and χ2(0.05,5) = 11.071, with W in the interval [1.145, 11.071] for all four thinning intensities. From this, it can be concluded that the overall correlation of dominant tree species in the spruce–fir mixed forest communities under the four thinning intensities in the study area is not significant.

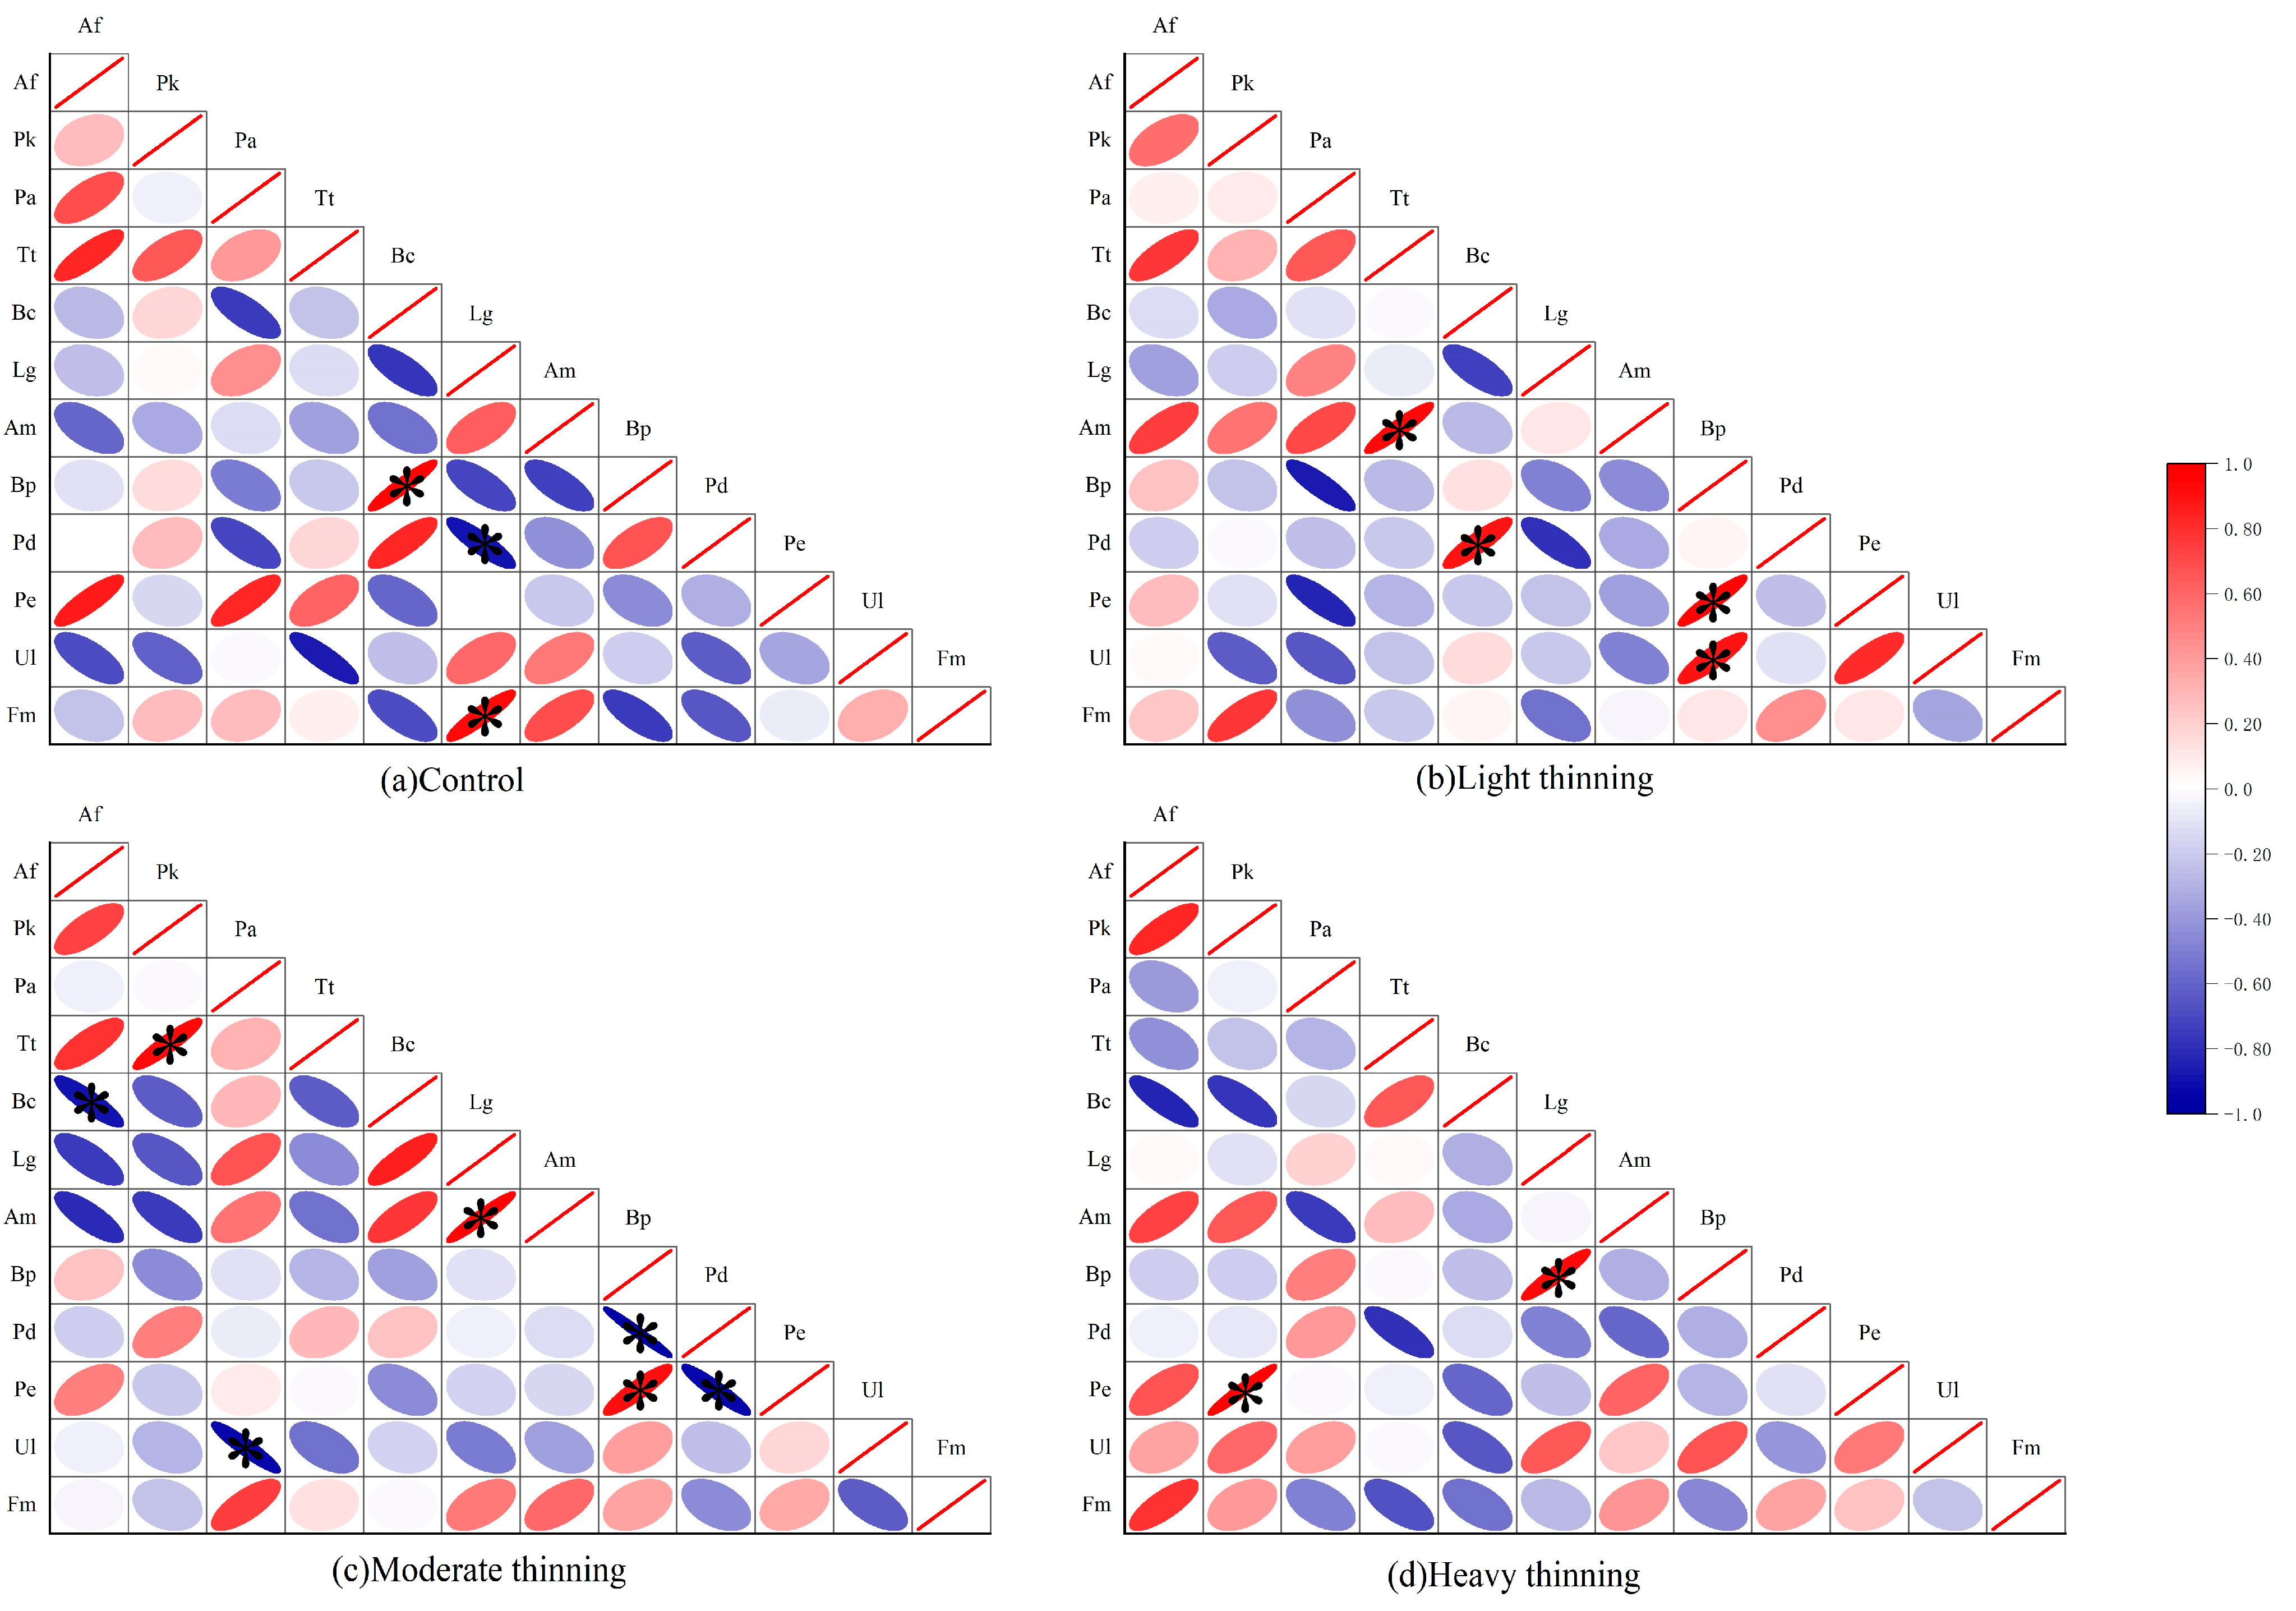
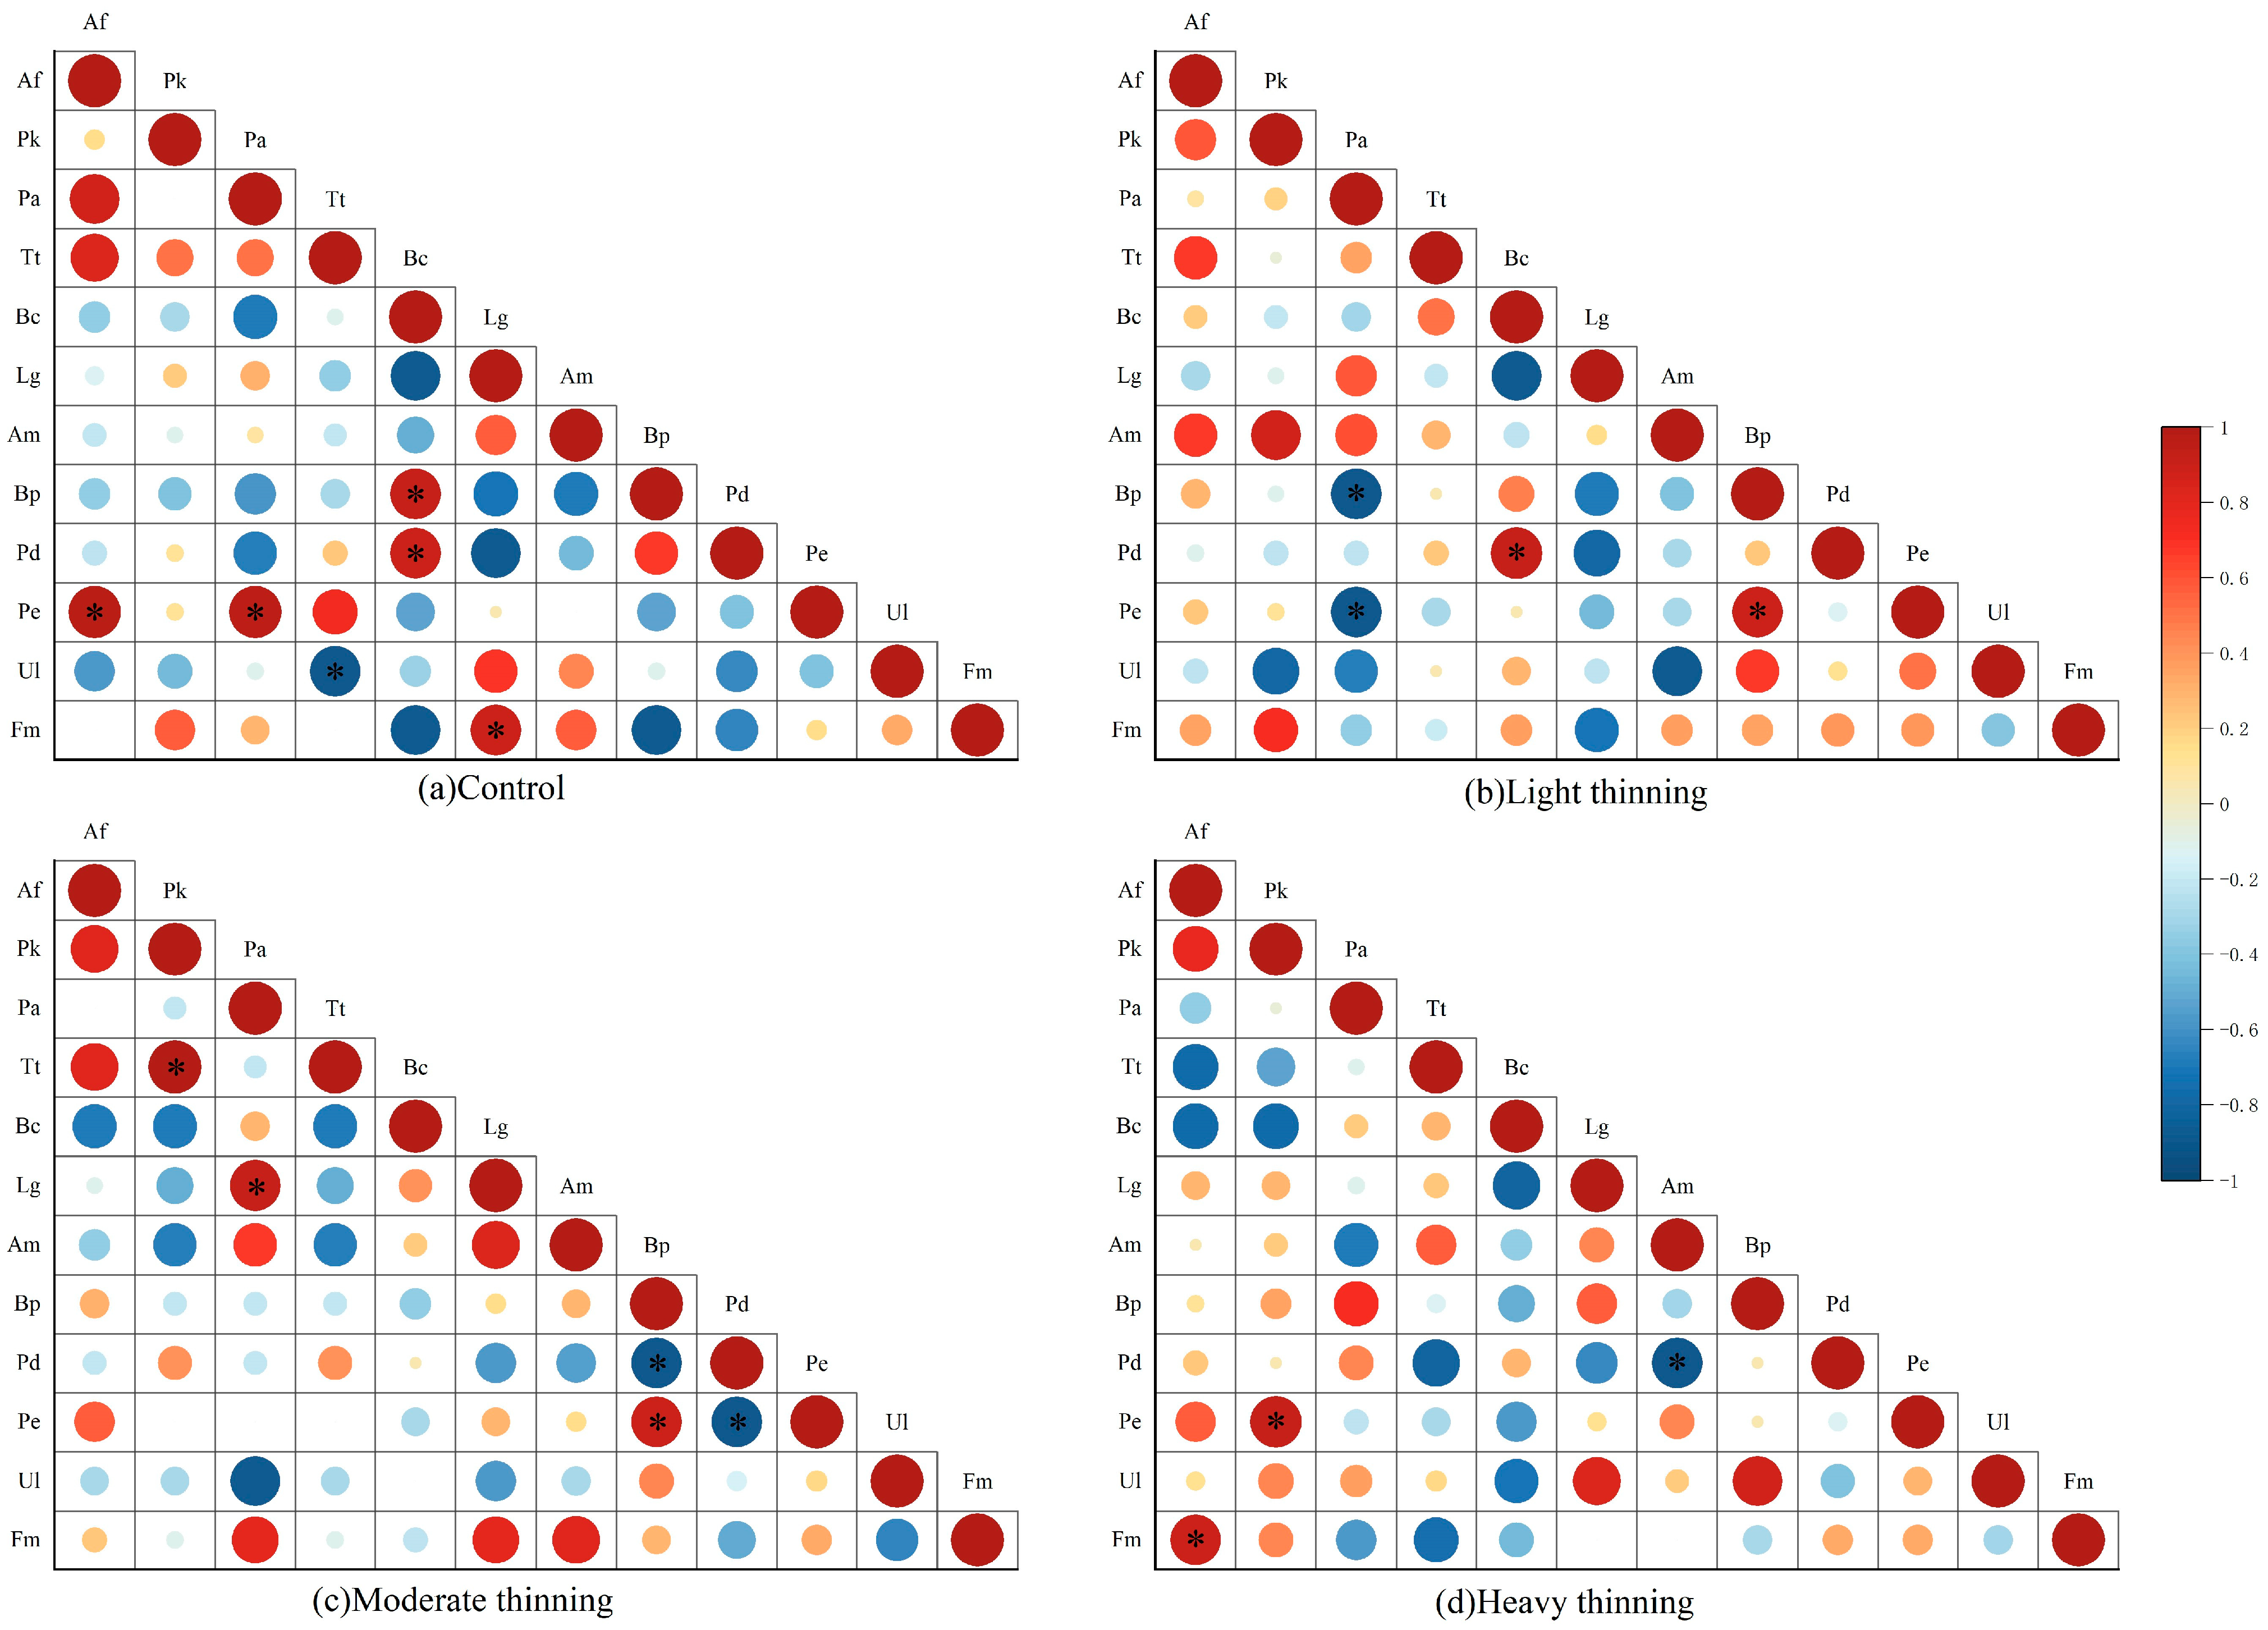
3.4. Interspecific Correlation Analysis

The Pearson correlation coefficient matrix of dominant tree species within the spruce–fir mixed forest community under different thinning intensities is shown in Figure 3. The correlation between various pairs in the four selective thinning intensity plots is generally weak, with only a few pairs achieving significant results. There are 28 groups (42.42% of the total number of species) with positive correlation in the sample plots, and 37 groups (56.06%) with negative correlation, with a positive to negative correlation ratio of 0.76. Among them, Betula costataBetula platyphylla and Larix gmeliniiFraxinus mandshurica species pairs are significantly positive correlation, Larix gmeliniiPopulus davidiana species pairs are significantly negative correlation, Picea asperata and Ulmus laciniata have no correlation, and the average community correlation coefficient is −0.049.
The light thinning plots are the same as the control plots, with a total of 28 groups (42.42%) of species pairs were positively correlated and 37 (56.06%) species pairs were negatively correlated, with a positive to negative correlation ratio of 0.76. The Tilia tuanAcer mono, Betula costataPopulus davidiana, Betula platyphyllaphellodendron amurense, and Betula platyphyllaUlmus laciniata species pairs were significantly positively correlated, with no significantly negatively correlated species pairs and no correlation between Betula costata and Acer mono, with a mean community correlation coefficient of −0.005.
A total of 26 (39.39%) species pairs were positively correlated and 39 (59.09%) species pairs were negatively correlated in the moderate thinning plots, with a positive-to-negative correlation ratio of 0.67. Among them, the species pairs of Pinus koraiensisTilia tuan, Larix gmeliniiAcer mono, and Betula platyphyllaPhellodendron amurense are significantly positively correlated, while the species pairs of Abies fabriBetula costata, Picea asperataUlmus laciniata, Betula platyphyllaPopulus davidiana, and Populus davidianaPhellodendron amurense are significantly negatively correlated. There is no correlation between Tilia tuan and Phellodendron amurense, and the average correlation coefficient of the community is −0.036.
In the heavy thinning plots, a total of 26 groups (39.39%) showed a positive correlation with species pairs, while 40 groups (60.61%) showed a negative correlation, and all species pairs were correlated with a positive-to-negative correlation ratio of 0.65. The Pinus koraiensisPhellodendron amurense and Larix gmeliniiBetula platyphylla species pairs were significantly positively correlated, with no significantly negative correlated species pairs and the average correlation coefficient of the community was 0.001.
Spearman rank correlation analysis is a non-parametric testing method that has no specific requirements for the form of the species’ distribution and has higher sensitivity compared to Pearson correlation coefficient test. Therefore, Spearman rank correlation analysis can compensate for the limitations of Pearson correlation analysis when dealing with non-normal distributions and non-linear relationships.
The Spearman rank correlation coefficient matrix is shown in Figure 4. There were 27 positively correlated species pairs (40.91% of total species pairs) and 35 negatively correlated species pairs (53.03%) in the control plots, with a positive-to-negative correlation ratio of 0.77. Among them, there are five species pairs that were significantly positively correlated, and Tilia tuanUlmus laciniata species pairs that are significantly negatively correlated. There is no correlation between Abies fabriFraxinus mandshurica, Pinus koraiensisPicea asperata, Tilia tuanFraxinus mandshurica, and Acer monoPhellodendron amurense species pairs, with a mean community rank correlation coefficient of −0.044.
In the light thinning plots, a total of 35 groups (53.03%) showed a positive correlation, while 31 groups (46.97%) showed a negative correlation. All pairs were correlated, with a positive-to-negative correlation ratio of 1.13. The Betula costataPopulus davidiana and Betula platyphyllaPhellodendron amurense species pairs were significantly positively correlated, the Picea asperataBetula platyphylla and Picea asperataPhellodendron amurense species pairs were significantly negatively correlated, and the mean community rank correlation coefficient was 0.021.
A total of 27 (40.91%) species pairs were positively correlated and 34 (51.52%) species pairs were negatively correlated in the moderate thinning disturbance plots, with a positive-to-negative correlation ratio of 0.79. Among them, three species pairs showed a significant positive correlation, while two species pairs showed a significant negative correlation. A total of four species pairs had no correlation, and the average community rank correlation coefficient was −0.015.
36 pairs (54.55%) of species were positively correlated and 28 pairs (42.42%) were negatively correlated in the heavy thinning plots, with a positive-to-negative correlation ratio of 1.29. The species pairs with significant positive correlation were Abies fabriFraxinus mandschurica and Pinus koraiensisphellodendron amurense, Acer monoPopulus davidiana species pairs with significant negative correlation, Larix gmeliniiFraxinus mandshurica and Acer monoFraxinus mandshurica species pairs with no correlation, and the average value of community rank correlation coefficient was −0.005.
Although there is a slight difference in the positive-to-negative ratio of the two correlation coefficients, overall, the correlation within the community is not significant. This indicates that in the community, most species lack obvious associations with each other and exhibit a certain degree of independent distribution. The mean Pearson correlation coefficients between the target species of Abies fabri and other species were 0.05, 0.20, −0.04, and 0.14, respectively, and the mean Spearman rank correlation coefficients were 0.09, 0.23, 0.09, and 0.11, respectively, for different selective harvesting intensities. The comparison shows that the fir populations are not strongly correlated with other populations in the community, and the population tends to be independent. Except for moderate thinning intensity, all other intensities increased the positive correlation between Abies fabri and other species, enhancing the mutualistic symbiotic ability of community tree species.

4. Discussion

4.1. Niche Characteristics of Dominant Tree Species

The results of this study show that Abies fabri is the dominant specie, occupying absolute advantage in the community, and the niche breadth is in the leading position in all sample plots. The niche breadth order of dominant species under the four thinning intensities is basically the same. Although the importance value of Picea asperata in the community is smaller than that of Abies fabri, its niche breadth is the largest. This is because although Abies fabri has a smaller diameter at breast height, it is more widely distributed in the sample plots and is distributed and more numerous in all the sample plots, thus producing a larger niche breadth [25]. For Picea asperata and Abies fabri, the dominant species in the community, selective thinning interference can effectively improve their importance in the community, but the niche breadth has decreased [26]. This is because Picea asperata and Abies fabri, as the constructive species, are the main targets of thinning, which reduces their numbers but increases their living space and reduces competition for environmental resources. With the exception of Abies fabri and Picea asperata, all dominant species decreased in importance and niche breadth after thinning, probably because selective logging disturbances made the dominance of the constructive species in the community more pronounced and occupied the resources to a greater extent, thus reducing the total amount of environment and resources that other species can use. Taken together, the above analysis shows that appropriate selective thinning measures can effectively increase the importance value and niche breadth of the main dominant tree species in the community and promote their growth and utilization of resources [27]. The research results show that moderate selective thinning intensity (30%) is the best choice, which is consistent with the finding of Hethcoat M.G. et al. [28] and Rosas, Y.M. et al. [29].
The degree of niche overlap between species is affected by the ability of plants to compete for resources [30]. Generally speaking, species with larger niche breadth tend to have a wider geographic distribution and stronger resource utilization capacity, which leads to a larger niche overlap between them and other species [31]. This study shows that the mean value of the Pianka niche overlap index of Abies fabri and Picea asperata, the main dominant tree species in the community, is lower than that of the sample plots without thinning in the sample plots with thinning interference, and the sample plots with moderate selective thinning intensity have the largest reduction. The average niche overlap index of Pinus koraiensis, Betula costata and Populus davidiana in the light selective thinning plots was higher than that in the control plots, the mean value of Pinus koraiensis and Ulmus laciniata in the heavy thinning plots was higher than that in the control plots, while the average niche overlap index of all species in the moderate thinning plots was lower than that in the control plots. This is because in the control sample plots, the growth of trees is not affected by external interference and the key factors affecting the growth of species are resources such as water, light, and soil nutrients. However, in the sample plots disturbed by selective thinning, the growth and development of plants are threatened and they need to obtain more resources to maintain their own growth, so competition between species for spatial resources increases [32], leading to the phenomenon of ecological niche separation, while ecological niche overlap is significantly reduced. This is consistent with the research results of Ahmad M. et al. [33].

4.2. Interspecific Correlation Characteristics of Dominant Tree Species

During the process of community succession, the relationships between populations will change and interspecific association indicators are used to quantitatively describe the relationships between populations, including community stability and relationships within species, between species, and between species and the environment. As succession proceeds, under the dual effects of environmental screening and interspecific competition, the functional characteristics and ecological habits of surviving species tend to complement and cooperate with each other as the community gradually develops into a top community, resulting in mutually beneficial symbiosis or mutual independence in interspecific relationships, with overall relatedness tending to be positively related or unrelated [34].
The overall correlation analysis of dominant tree species shows that the overall association of the control plots showed a non-significant negative association, while the overall association of the community in light, moderate, and heavy selective thinning plots is not significantly positive, not significantly negative, and not significantly positive, respectively. And, there is a high degree of deviation from one in the variance ratio (RV) between the control and moderate thinning samples. It indicates that the heavy thinning sample plots are at a relatively stable stage of structure, while the control and moderate thinning sample plots have unstable community structures and are vulnerable to damage [35].
The Pearson correlation coefficient shows that the number of negatively correlated species pairs in the community under all selective thinning intensities is greater than the number of positively correlated species pairs, and as the thinning intensity increases, the positive and negative ratios gradually decrease. On the other hand, the Spearman rank correlation coefficient shows that under light and heavy selective thinning conditions, the positive-to-negative ratio of the community is greater than one, and there is no significant negative correlation between species, indicating that the state of the community is relatively stable. The degree of association between a few species (such as Abies fabri, Picea asperata, Pinus koraiensis, Betula costata, Tilia tuan, etc.) in the spruce–fir mixed forest community is high, showing a significant positive correlation, indicating that the two species are similar or complementary in terms of resource utilization and habitat demand [36]. In the follow-up management, we can analyze the ecological habits and Biological interaction, and conduct joint management. The results of the interspecific association index and coefficient analysis showed that the Abies fabri population is only negatively correlated with Betula costata in the moderate selective thinning plots, but not with other dominant species, tending towards independent distribution. It may be due to the fact that Abies fabri are more shade-tolerant, better adapted to the cold climate of the northeast, and located in the absolute upper layer of the stand, which has an advantage in the use of light, heat, and other resources. The Pearson correlation coefficient and Spearman rank correlation coefficient of Abies fabri with Pinus koraiensis, Picea asperata, and Tilia tuan in the community did not reach significant levels, but the frequency of co-occurrence of Abies fabri with these species was high in the sample plots. This suggests that even though there is no significant correlation between species, due to the ecological habits of various species or vertical stratification of forest stands, various groups occupy different niche breadth, and species can coexist. This is similar to the study of Akatov, V.V. et al. [37].
The interspecific association coefficient provides a quantitative description of the degree of association between species. However, it is also necessary to consider the impact of sampling scale, Interspecific competition, chemosensory effects, environmental factors, and other factors on interspecific association [38]. Therefore, we need to further investigate and explain these internal mechanisms to better understand the comprehensive effects of interspecific connections.

5. Conclusions

This study took Jingouling Forest Farm in Northeast China as the research object, classified the sample plots according to the selective thinning intensity and analyzed the niche characteristics and interspecific association of dominant tree species under different selective thinning intensity conditions. The results show that selective thinning can significantly increase the important value of the constructive species Abies fabri and Picea asperata, and the maximum increase is under moderate (30%) selective thinning, but it will reduce their niche breadth and selective thinning will reduce the important value and niche breadth of all dominant species except Abies fabri and Picea asperata. All thinning intensities will reduce the average value of the niche overlap index of dominant tree species in the community, and the degree of reduction will increase with the increase of thinning intensity. The light and heavy thinning plots are in a relatively stable community succession stage, while the control and moderate thinning plots are unstable and prone to change in community structure. In summary, moderate selective thinning is a more appropriate intensity of selective thinning, which is conducive to achieving higher forest management benefits while maintaining biodiversity in the Northeast spruce–fir mixed forest.

Author Contributions

Conceptualization, X.W.; project administration, X.W.; methodology, S.Y.; validation, S.Y. and X.W.; formal analysis, S.Y. and X.W.; investigation, S.Y. and X.W.; data curation, S.Y. and X.W.; writing—original draft preparation, S.Y.; writing—review and editing, S.Y.; visualization, S.Y. supervision, S.Y. All authors have read and agreed to the published version of the manuscript.

Funding

This research was funded by the National Key Research and Development Plan (Grant No. 2017YFC050410101).

Data Availability Statement

The data presented in this study are available on request from the corresponding author.

Acknowledgments

We sincerely thank Bo Jia for his valuable comments on the manuscript.

Conflicts of Interest

The authors declare no conflict of interest.

References

  1. Peterson, A.T. Predicting the Geography of Species’ Invasions via Ecological Niche Modeling. Q. Rev. Biol. 2003, 78, 419–433. [Google Scholar] [CrossRef] [Green Version]
  2. Litchman, E.; Klausmeier, C.A.; Schofield, O.M.; Falkowski, P.G. The Role of Functional Traits and Trade-Offs in Structuring Phytoplankton Communities: Scaling from Cellular to Ecosystem Level. Ecol. Lett. 2007, 10, 1170–1181. [Google Scholar] [CrossRef] [PubMed]
  3. Buche, L.; Spaak, J.W.; Jarillo, J.; De Laender, F. Niche Differences, Not Fitness Differences, Explain Predicted Coexistence across Ecological Groups. J. Ecol. 2022, 110, 2785–2796. [Google Scholar] [CrossRef]
  4. Petraitis, P.S. Likelihood Measures of Niche Breadth and Overlap. Ecology 1979, 60, 703–710. [Google Scholar] [CrossRef]
  5. Ingram, T.; Costa-Pereira, R.; Araújo, M.S. The Dimensionality of Individual Niche Variation. Ecology 2018, 99, 536–549. [Google Scholar] [CrossRef]
  6. Su, S.; Liu, J.; He, Z.; Zheng, S.; Hong, W.; Xu, D. Ecological Species Groups and Interspecific Association of Dominant Tree Species in Daiyun Mountain National Nature Reserve. J. Mt. Sci. 2015, 12, 637–646. [Google Scholar] [CrossRef]
  7. Lancaster, L.T. On the Macroecological Significance of Eco-Evolutionary Dynamics: The Range Shift–Niche Breadth Hypothesis. Phil. Trans. R. Soc. B 2022, 377, 20210013. [Google Scholar] [CrossRef]
  8. Detto, M.; Levine, J.M.; Pacala, S.W. Maintenance of High Diversity in Mechanistic Forest Dynamics Models of Competition for Light. Ecol. Monogr. 2022, 92, e1500. [Google Scholar] [CrossRef]
  9. Falk, D.A.; van Mantgem, P.J.; Keeley, J.E.; Gregg, R.M.; Guiterman, C.H.; Tepley, A.J.; Young, D.J.N.; Marshall, L.A. Mechanisms of Forest Resilience. For. Ecol. Manag. 2022, 512, 120129. [Google Scholar] [CrossRef]
  10. Löffler, J.; Pape, R. Thermal Niche Predictors of Alpine Plant Species. Ecology 2020, 101, e02891. [Google Scholar] [CrossRef] [Green Version]
  11. Cassini, M.H. A Review of the Critics of Invasion Biology. Biol. Rev. 2020, 95, 1467–1478. [Google Scholar] [CrossRef] [PubMed]
  12. Ma, Y.; Li, Q.; Pan, S.; Liu, C.; Han, M.; Brancelj, A. Niche and Interspecific Associations of Pseudoanabaena Limnetica—Exploring the Influencing Factors of Its Succession Stage. Ecol. Indic. 2022, 138, 108806. [Google Scholar] [CrossRef]
  13. Zhang, L.-N.; Zhu, G.-Q.; Yang, K.; Liu, X.-Y.; Gong, H.-D.; Zheng, L. Niche and interspecific association of main woody plants in Myrica nana shrubland in central Yunnan, China. Chin. J. Plant Ecol. 2022, 46, 1400–1410. [Google Scholar] [CrossRef]
  14. Ouyang, S.; Xiang, W.; Wang, X.; Xiao, W.; Chen, L.; Li, S.; Sun, H.; Deng, X.; Forrester, D.I.; Zeng, L.; et al. Effects of Stand Age, Richness and Density on Productivity in Subtropical Forests in China. J. Ecol. 2019, 107, 2266–2277. [Google Scholar] [CrossRef]
  15. Lu, D.; Zhu, J.; Wang, X.; Hao, G.; Wang, G.G. A Systematic Evaluation of Gap Size and within-Gap Position Effects on Seedling Regeneration in a Temperate Secondary Forest, Northeast China. For. Ecol. Manag. 2021, 490, 119140. [Google Scholar] [CrossRef]
  16. Manlick, P.J.; Pauli, J.N. Human Disturbance Increases Trophic Niche Overlap in Terrestrial Carnivore Communities. Proc. Natl. Acad. Sci. USA 2020, 117, 26842–26848. [Google Scholar] [CrossRef]
  17. O’Neil, S.T.; Coates, P.S.; Brussee, B.E.; Ricca, M.A.; Espinosa, S.P.; Gardner, S.C.; Delehanty, D.J. Wildfire and the Ecological Niche: Diminishing Habitat Suitability for an Indicator Species within Semi-arid Ecosystems. Glob. Change Biol. 2020, 26, 6296–6312. [Google Scholar] [CrossRef]
  18. Koutsidi, M.; Moukas, C.; Tzanatos, E. Trait-based Life Strategies, Ecological Niches, and Niche Overlap in the Nekton of the Data-poor Mediterranean Sea. Ecol. Evol. 2020, 10, 7129–7144. [Google Scholar] [CrossRef]
  19. Collins, S.L.; Good, R.E. The Seedling Regeneration Niche: Habitat Structure of Tree Seedlings in an Oak-Pine Forest. Oikos 1987, 48, 89. [Google Scholar] [CrossRef] [Green Version]
  20. Feinsinger, P.; Spears, E.E.; Poole, R.W. A Simple Measure of Niche Breadth. Ecology 1981, 62, 27–32. [Google Scholar] [CrossRef]
  21. Pianka, E.R. Niche Overlap and Diffuse Competition. Proc. Natl. Acad. Sci. USA 1974, 71, 2141–2145. [Google Scholar] [CrossRef] [PubMed]
  22. Charles, A.; Darné, O. Variance-Ratio Tests of Random Walk: An Overview. J. Econ. Surv. 2009, 23, 503–527. [Google Scholar] [CrossRef] [Green Version]
  23. Schober, P.; Boer, C.; Schwarte, L.A. Correlation Coefficients: Appropriate Use and Interpretation. Anesth. Analg. 2018, 126, 1763–1768. [Google Scholar] [CrossRef]
  24. Zar, J.H. Significance Testing of the Spearman Rank Correlation Coefficient. J. Am. Stat. Assoc. 1972, 67, 578–580. [Google Scholar] [CrossRef]
  25. Cameron, A.D. Importance of Early Selective Thinning in the Development of Long-Term Stand Stability and Improved Log Quality: A Review. Forestry 2002, 75, 25–35. [Google Scholar] [CrossRef]
  26. Lu, X.; Cheng, G.; Xiao, F.; Fan, J. Modeling Effects of Temperature and Precipitation on Carbon Characteristics and GHGs Emissions in Abies Fabric Forest of Subalpine. J. Environ. Sci. 2008, 20, 339–346. [Google Scholar] [CrossRef]
  27. Rehfeldt, G.E.; Ying, C.C.; Spittlehouse, D.L.; Hamilton, D.A., Jr. Genetic Responses to Climate in Pinus Contorta: Niche Breadth, Climate Change, and Reforestation. Ecol. Monogr. 1999, 69, 375–407. [Google Scholar] [CrossRef]
  28. Hethcoat, M.G.; Edwards, D.P.; Carreiras, J.M.B.; Bryant, R.G.; França, F.M.; Quegan, S. A Machine Learning Approach to Map Tropical Selective Logging. Remote Sens. Environ. 2019, 221, 569–582. [Google Scholar] [CrossRef]
  29. Rosas, Y.M.; Peri, P.L.; Lencinas, M.V.; Martínez Pastur, G. Potential Biodiversity Map of Understory Plants for Nothofagus Forests in Southern Patagonia: Analyses of Landscape, Ecological Niche and Conservation Values. Sci. Total Environ. 2019, 682, 301–309. [Google Scholar] [CrossRef]
  30. Mason, N.W.H.; De Bello, F.; Doležal, J.; Lepš, J. Niche Overlap Reveals the Effects of Competition, Disturbance and Contrasting Assembly Processes in Experimental Grassland Communities: Grassland Community Assembly Processes. J. Ecol. 2011, 99, 788–796. [Google Scholar] [CrossRef]
  31. Pandey, R.; Rawat, M.; Singh, V.; Yousefpour, R.; Reshi, Z.A. Large Scale Field-Based Evaluation of Niche Breadth, Niche Overlap and Interspecific Association of Western Himalayan Temperate Forest Tree Species. Ecol. Indic. 2023, 146, 109876. [Google Scholar] [CrossRef]
  32. Cazzolla Gatti, R.; Castaldi, S.; Lindsell, J.A.; Coomes, D.A.; Marchetti, M.; Maesano, M.; Di Paola, A.; Paparella, F.; Valentini, R. The Impact of Selective Logging and Clearcutting on Forest Structure, Tree Diversity and above-Ground Biomass of African Tropical Forests. Ecol. Res. 2015, 30, 119–132. [Google Scholar] [CrossRef]
  33. Ahmad, M.; Sharma, P.; Rathee, S.; Singh, H.P.; Batish, D.R.; Lone, G.R.; Kaur, S.; Jaryan, V.; Kohli, R.K. Niche Width Analyses Facilitate Identification of High-Risk Endemic Species at High Altitudes in Western Himalayas. Ecol. Indic. 2021, 126, 107653. [Google Scholar] [CrossRef]
  34. Wu, S.; Wen, L.; Dong, S.; Gao, X.; Xu, Y.; Li, S.; Dong, Q.; Wessell, K. The Plant Interspecific Association in the Revegetated Alpine Grasslands Determines the Productivity Stability of Plant Community Across Restoration Time on Qinghai–Tibetan Plateau. Front. Plant Sci. 2022, 13, 850854. [Google Scholar] [CrossRef]
  35. Yang, H.; Miao, N.; Li, S.; Ma, R.; Liao, Z.; Wang, W.; Sun, H. Relationship between Stand Characteristics and Soil Properties of Two Typical Forest Plantations in the Mountainous Area of Western Sichuan, China. J. Mt. Sci. 2019, 16, 1816–1832. [Google Scholar] [CrossRef]
  36. Mikusin, G. Strengthening the Network of High Conservation Value Forests in Boreal Landscapes. Front. Ecol. Evol. 2021, 8, 486. [Google Scholar]
  37. Akatov, V.V.; Akatova, T.V.; Chefranov, S.G. Degree of Dominance and Species Richness in Plant Communities with High and Low Intensity of Interspecies Competition. Biol. Bull. Rev. 2018, 8, 389–400. [Google Scholar] [CrossRef]
  38. Dalmaso, C.A.; Inoue, M.T.; Marcelino, V.R.; Oliveira Filho, P.C.D.; Nascimento, A.R.T.; Cysneiros, V.C. Interspecific Interactions of Trees with the Regeneration of Ocotea odorifera (vell.) Rohwer in Mixed Ombrophylous Forest. Floresta 2019, 49, 189. [Google Scholar] [CrossRef]
Figure 1. Pianka niche overlap index of dominant tree species under different selective thinning intensities. Note: tree species abbreviations are listed in Table 2.
Forests 14 01513 g001
Figure 2. Distribution patterns of dominant tree species niches overlap at different thinning intensities.
Forests 14 01513 g002
Figure 3. Pearson correlation coefficient matrix of dominant tree species under different selective thinning intensities. Note: abbreviations of tree species are shown in Table 2; red ovals represent positive correlation, blue ovals represent negative correlation; “*” indicates significant correlation (p < 0.05).
Forests 14 01513 g003
Figure 4. Spearman rank correlation coefficient matrix of dominant tree species under different selective thinning intensities. Note: abbreviations of tree species are shown in Table 2; “*” indicates a significant correlation (p < 0.05).
Forests 14 01513 g004
Table 1. Basic information of sample land.
GroupingPlot NumberSelective Cutting Intensity (%)Area (m2)Tree Species CompositionMean DBH (cm)Stand
Density (Plant/ha)
Stand
Volume (m3/ha)
Unselected thinning21030 × 70Picea asperata
Abies fabri
Pinus koraiensis
Other tree species (group)
23.5824288.56
28040 × 5025725298
32040 × 4019.91142261.56
36040 × 5023.9520178.58
39040 × 5023.2956298.08
Light thinning2214.430 × 70Picea asperata
Abies fabri
Pinus koraiensis
Other tree species (group)
24.2652241.4
2517.740 × 5024.2580228.5
3018.140 × 4025.3638275.62
3421.640 × 5026.4530247.08
382040 × 4023.6669224.61
Moderate thinning2430.840 × 50Picea asperata
Abies fabri
Pinus koraiensis
Other tree species (group)
25.5519210.83
2734.340 × 5025.5620269.91
3131.730 × 7020.8728235.19
3528.640 × 5026605262.94
4030.340 × 5022764343.1
Heavy thinning2338.130 × 70Picea asperata
Abies fabri
Pinus koraiensis
Other tree species (group)
24.9581231.24
2640.940 × 5026.7480232.65
2937.730 × 7021.8463144.91
3334.140 × 5027735352.78
3740.640 × 5021.2644169.15
Note: The other tree species (group) are mainly Tilia tuan, Betula costata, Larix gmelinii, Acer mono, Betula platyphylla, Populus davidiana, Phellodendron amurense, Ulmus laciniata, Fraxinus mandschurica, and other tree species.
Table 2. Important value (IV) and niche breadth (BL) of dominant tree species under different selective thinning intensities.
Species NameAbbreviationSelective Thinning IntensityAverage Value
ControlLight ThinningModerate ThinningHeavy Thinning
IVBLIVBLIVBLIVBLIVBL
Abies fabriAf28.034.4129.774.3931.84.3431.554.3230.294.37
Pinus koraiensisPk14.853.9214.594.7712.974.0613.074.3513.874.28
Picea asperataPa13.944.6712.324.7514.824.3513.384.5813.614.59
Tilia tuanTt9.054.358.844.057.223.627.523.558.163.89
Betula costataBc8.063.475.244.436.353.126.753.496.63.63
Larix gmeliniiLg4.12.748.452.736.172.194.631.455.832.28
Acer monoAm5.523.725.492.053.92.616.162.145.272.63
Betula platyphyllaBp5.514.235.012.714.963.95.451.725.233.14
Populus davidianaPd2.741.962.971.964.952.842.961.853.412.15
Phellodendron amurensePe3.622.982.961.632.4122.541.982.882.15
Ulmus laciniataUl2.241.923.011.692.2223.552.962.762.14
Fraxinus mandschuricaFm2.3521.3512.241.882.4422.11.72
Disclaimer/Publisher’s Note: The statements, opinions and data contained in all publications are solely those of the individual author(s) and contributor(s) and not of MDPI and/or the editor(s). MDPI and/or the editor(s) disclaim responsibility for any injury to people or property resulting from any ideas, methods, instructions or products referred to in the content.

