Article

Effects of Soil Microbiological Properties on the Fractional Distribution and Stability of Soil Organic Carbon under Different N Addition Treatments

1
College of Resources and Environment, Anhui Agricultural University, Hefei 230036, China
2
State Key Laboratory of Soil Erosion and Dryland Farming on the Loess Plateau, Institute of Soil and Water Conservation, Northwest A & F University, Yangling 712100, China
3
State Key Laboratory of Urban and Regional Ecology, Research Center for Eco-Environmental Sciences, Chinese Academy of Sciences, Beijing 100085, China
4
Department of Agroecology, University of Bayreuth, 95447 Bayreuth, Germany
*
Author to whom correspondence should be addressed.
Forests 2023, 14(8), 1540; https://doi.org/10.3390/f14081540
Submission received: 3 July 2023 / Revised: 20 July 2023 / Accepted: 21 July 2023 / Published: 28 July 2023
(This article belongs to the Special Issue Aboveground and Belowground Interaction and Forest Carbon Cycling)

Abstract

:
Soil organic carbon (SOC) fractions are influenced by inputs of nitrogen (N) from globally rising N deposition; however, the mechanisms of how soil microbiological properties are influenced by N deposition and its impact on the fractional distribution and stability of SOC remain unclear. In this study, we assessed the effects on SOC fraction distribution and stability from four aspects of soil microbiological properties: soil microbial biomass (SMB), soil microbial activity, structure diversity, and functional diversity of soil microbial community in a Pinus tabuliformis plantation, which received four N addition levels (0 g N m−2 y−1 (N0), 3 g N m−2 y−1 (N3, low N addition), 6 g N m−2 y−1 (N6, mid-N addition), and 9 g N m−2 y−1 (N9, high N addition)) for 2 years. The N inputs did significantly affect some soil microbiological properties, like SMB, soil phospholipid fatty acid (PLFA), and soil microbial functional diversity. Mid- and high N addition decreased the richness (HPLFA) and evenness (EPLFA) index of the soil microbial community, from 3.24 to 2.91 and 0.93 to 0.87, respectively. In addition, the low N addition promoted the carbon management index (CMI) to 141.35, i.e., higher than the CMIs in the mid- and high-level treatments. The SOC stability also showed significant differences among N addition treatments, and SOC could be the most stable at the mid-N addition level. Regarding the effects of the four soil microbiological attributes on the CMI and stability, SMB and soil respiration positively impacted the CMI, but did not significantly affect the stability. In addition, EPLFA had positive effects, but EBIOLOG had negative effects on CMI and lability. Our findings indicate that soil microbiological properties are essential in SOC fractional distributions and stability. Further identification and study of soil microbial species used to change SOC fractions would help to clarify the detailed mechanisms involved.

1. Introduction

Soil ecosystems are the largest carbon sinks on land, and have the potential to enhance carbon sequestration and offset the release of fossil fuels [1], which is essential in soil carbon storage and sequestration [2]. Small fluctuations in the equilibrium of import and export of this huge carbon pool will have a significant source–sink effect on the atmospheric carbon pool [2,3,4]. Therefore, increasing the sequestration potential, quality, and stability of soil organic carbon (SOC) has been widely recognized to alleviate the pressure from global climate change as well as ensure the sustainable development of agriculture [1], which will also help us achieve the carbon peak and neutrality targets. However, SOC is very susceptive to global climate change and regional environmental change, like N deposition, due to a close coupling linkage between the C and N cycles of ecosystem changed by N addition. For example, N addition may increase plant and microbial demands for soil sources, like C, N, P, and S, before N saturation, thus promoting soil element cycles [5,6]. As we know, global anthropogenic nitrogen (N) contents increased tenfold from the 1860s to the 1990s, with contents ranging from 15 Tg N y−1 to 156 Tg N y−1, and is anticipated to achieve 270 Tg N y−1 in 2050 [7]. The deposition of N caused by the burning of fossil fuels and the production and use of chemical fertilizers, as a main contributor to the worldwide enhancement in N inputs, is gradually impacting the turnover of SOC [1,8]. Therefore, the key scientific problem to be solved is to understand how N addition would affect the sequestration potential, quality, and stability of SOC and mechanisms under N addition.
SOC was divided into four separate fractions: very labile organic C (OC), labile OC, less labile OC, and non-labile OC [9], which have different chemical stability and turnover rates [10]. Soil labile OC pools, including very labile OC, labile OC, and less labile OC, as the energy sources for soil food webs, had relatively rapid turnover rates [9]. Therefore, they have been considered to be an early sensitivity index to the impacts of environmental changes on the dynamics of the SOC [11,12]. Although the non-labile OC pool had a lower turnover rate and was relatively stable and slowly altered by microbial activity [13], it is still essential in C sequestration to relieve climate change [14]. Some studies illustrated the impacts of N addition on SOC fractions [10,15]. Chen et al. [10] revealed that both soil labile OC pools as well as non-readily oxidizable OC contents went up with N addition. In contrast, Wang et al. [15] found N addition did not alter the soil labile OC content. However, these results were not consistent. Therefore, the C management index (CMI), as a sensitive indicator of the renewal degree and the change in the quality of the C pool [16] and lability as a stability indicator of SOC [17] under N addition, still need to be further explored.
Soil microbes are closely correlated with changes in SOC fractions, thus influencing the stability of SOC fractions and the CMI. In ecosystems, the factors affecting SOC fraction contents could include the inputs of plant litter, root exudates, and the offsetting of organic C inputs [11,18], which was put forward with the theory “microbial carbon pump, MCP”. In this theory, one method of microbial control of soil carbon could be called “microbial ex vivo modification”, which means the decomposition and transformation of organic C as mediated by soil microbes (soil microbial respiration and enzymatic activities) [18,19]. The other method could be “microbial in vivo turnover”, which consists of the soil microbial assimilation of small molecule plant-derived carbon substrates into soil microbial biomasses [19,20], i.e., a contributor of soil labile OC. Moreover, the changes in the structure and functional diversity of the soil microbial community would also influence the decomposition ability of soil microbes due to the different C metabolism capacities of individual microorganisms. Some studies have revealed the effect of SMB [21] and soil enzymatic activity [22], as well as soil respiration [23], on the distribution and stability of SOC fractions. However, mass previous studies mainly concentrated on separate aspects of soil microbial control on the stability of SOC fractions and the CMI, which is too one-sided for us to fully understand the mechanism. Further, some studies concentrated on the impacts of the increasing N inputs on soil microbial community and SOC in terrestrial ecosystems [24,25]. Fang et al. [21] found N addition can influence the SOC by decreasing the microbial biomass C via “microbial ex vivo modification”. Hok et al. [26] revealed that soil enzymatic activity via “microbial in vivo modification” had a closely positive relationship with soil labile OC. However, the mechanism of how microbes could have an impact on the quality and stability of SOC under N addition has not been fully illustrated based on the MCP theory.
To investigate how N addition influences the CMI and stability of SOC via soil microbial control from a comprehensive viewpoint, we, therefore, conducted an N addition experiment in the Pinus tabuliformis plantation in Yichuan County. Previously, this place was in a state of N deficiency but has recently received gradually increasing N deposition from 16.12 kg ha−1 in 2010 [27] to 28.89 kg ha−1 in 2014 [28] in Shaanxi province. We hypothesized that: (1) the soil microbiological properties would vary along the N-addition gradient; (2) the SOC fractions and CMI and SOC stability would also vary along the N-addition gradient; and (3) N addition would affect the CMI and stability of SOC based on aspects of the MCP theory, such as SMB, soil microbial activity, structure diversity, and functional diversity of the soil microbial community.

2. Materials and Methods

2.1. Site Description

We carried out this N addition experiment at the TIELONGWAN plantation (36°04′ N, 110°15′ E; 860–1200 m a.s.l.), Yichuan county, Shaanxi province, China. This area has a continental climate, with a mean annual precipitation and temperature of 584.4 mm and 9.7 °C, respectively. In addition, the zonal vegetation is temperate deciduous broad-leaved forests. The soil type is a gray forest soil (Gray Luvisol, FAO soil classification) with a landscape containing rolling hills with slopes ranging from 20° to 25°. The artificial P. tabuliformis forest in our experiment was established in 1966, with an area of 600 ha. The main trees are P. tabuliformis and some other shrubs and herbaceous plants are included. The climatic, soil, and vegetation conditions are also described by Zhang et al. [29].

2.2. Experimental Design and Soil Sampling

This experiment was designed as a completely random experiment. Each plot was established with an area of 10 × 10 m2, with a 5 m buffer zone separating the plots. This experiment contained four N addition treatments: 0 g N m−2 y−1 (N0), 3 g N m−2 y−1 (N3, low N addition), 6 g N m−2 y−1 (N6, mid-N addition), and 9 g N m−2 y−1 (N9, high N addition), which were set based on the amount of global N deposition [24]. Each treatment had four replicates. N was added with urea (CO(NH2)2) in April, June, August, and October, four times a year from 2014. Treated plots (N3, N6, and N9) were added with urea solution one day before a rain in case of ammonia volatilization. CK was added using the same volume of water without urea.
Soil cores were collected from the 0–20 cm layer via random sampling from the soil plots included in the five treatments in September 2015 with 2 years of N addition. The collected soil cores from each plot were mixed as a soil sample. After the manual removal of roots and stones, every soil sample was sieved through a 2 mm mesh sieve. After sieving, each sample was separated into three subsamples, the first subsamples were air-dried and then passed through a 0.25 mm mesh sieve. This subsample was used for determining the soil physicochemical properties and soil sucrase, soil cellulase, soil urease, and soil carbon fractions. The second subsamples were stored at 4 °C for later determination of soil microbial biomass, soil respiration, and Biolog analysis. The third ones were stored at −80 °C for soil enzymatic activities and soil phospholipid fatty acid (PLFA).

2.3. Analyses of Soil Chemical Properties

Soil chemical properties were measured using standard procedures. The SOC was measured using the H2SO4-K2Cr2O7 method. The TN was measured using the Kjeldahl method [30]. The soil TP was determined calorimetrically after digestion with H2SO4 and HClO4 [31]. The soil NH4+-N and NO3-N in filtered 2.0 mol L−1 extracts of fresh soil sample were measured with a flow injection autoanalyzer. The soil pH was determined in 1:2.5 (w:v) solutions. The soil aP was measured via molybdenum–antimony colorimetry with Na(HCO3)2 extracts. The soil chemical properties are described in detail in the Supplementary Materials (Table S1).

2.4. Analyses of Soil Microbiological Properties

Soil microbiological properties were divided into four groups: SMB (Figure 1); microbial activity, including extracellular enzyme activities (EEA) and soil respiration (Figure 2); microbial community structure with PLFA; and soil microbial metabolic diversity with the Biolog technique, which were measured with relevant methods and are described in the Supplementary Materials.

2.5. Analyses of Soil C Fractions and CMI

Labile organic C (OC) was measured with the method described by [16]. Soil including 15 mg of C was sieved (0.25 mm), weighed, and placed into 50 mL centrifuge tubes, and then processed with 25 mL 333 mM KMnO4. Soil extraction solutions were shaken for 1 h and centrifuged at 2000 r min−1 for 5 min. Three labile OC fractions were measured using different concentrations of KMnO4. Very labile OC: fraction I (C1) was oxidized using 33 mM KMnO4. Labile OC: fraction II (C2) was determined as the difference between oxidized C with 167 mM KMnO4 and C1. Less labile OC: fraction III (C3) was determined as the difference between oxidized C with 333 mM KMnO4 and SOC fractions measured with 167 mM KMnO4. The non-labile soil oxidizable C fraction (C4) was determined as the content difference between SOC and soil labile OC. Absorbance values of the supernatants and standards were determined at 565 nm to indicate the soil labile OC. In this study, different SOC fractions were used to calculate the CMI and the stability index.
Compared with N0, the CMIs were calculated along the different N gradients using the following equations:
Carbon   pool   index   ( CPI ) = SOC   ( Ni ) / SOC   ( N 0 )
Lability   ( L ) = labile   carbon / non - labile   carbon
Lability   index   ( LI ) = L   ( Ni ) / A   ( N 0 )
Carbon   management   index   ( CMI ) = CPI   ×   AI   ×   100
Sensitivity   index   ( SI ) = ( C   fraction   ( Ni )   -   C   fractions   ( N 0 ) ) / C   fractions
Stability = 1 / lability
Ni represents each N treatment; lability (L) represents soil C stability. The higher the lability, the lower the SOC stability, indicating that the soil labile OC was easily decomposed and transformed by interference [17].

2.6. Statistical Analyses

The Shannon richness and evenness indices of soil microbial community structure and metabolic diversity were calculated using soil PLFA and Biolog parameters, respectively, and the equations are listed in the Supplementary Materials.
Differences in the responses of soil chemical parameters, soil microbiological parameters, SOC fractions, and soil CMIs along the N-addition gradient were analyzed using one-way ANOVA. The mean values were compared using Duncan’s tests at p < 0.05. The ANOVA and principal component analyses (PCAs) were processed with SPSS 20.0. The figures were prepared using OriginPro 9.0.
A structural equation model (SEM) was established to assess the impacts of N addition on the soil microbiological properties and further on the SOC fractions. Firstly, the number of variables for SMB, soil enzymatic activities, and soil respiration were reduced using PCAs [32]. In the PCAs, SMB explained 94.14% of MBC, MBN, and MBP; EEA1 explained 77.01% of the β-1,4-glucosidase (BG), β-1,4-N-acetylglucosaminidase (NAG), alkaline phosphatase (AP), cellulase, arylsulfatase, and β-xylosidase activities; EEA2 explained 52.89% of sucrase, amylase, and urease activities; and SR explained 57.39% of soil basal respiration and soil-induced respiration.

3. Results

3.1. Soil Microbiological Properties under N Addition

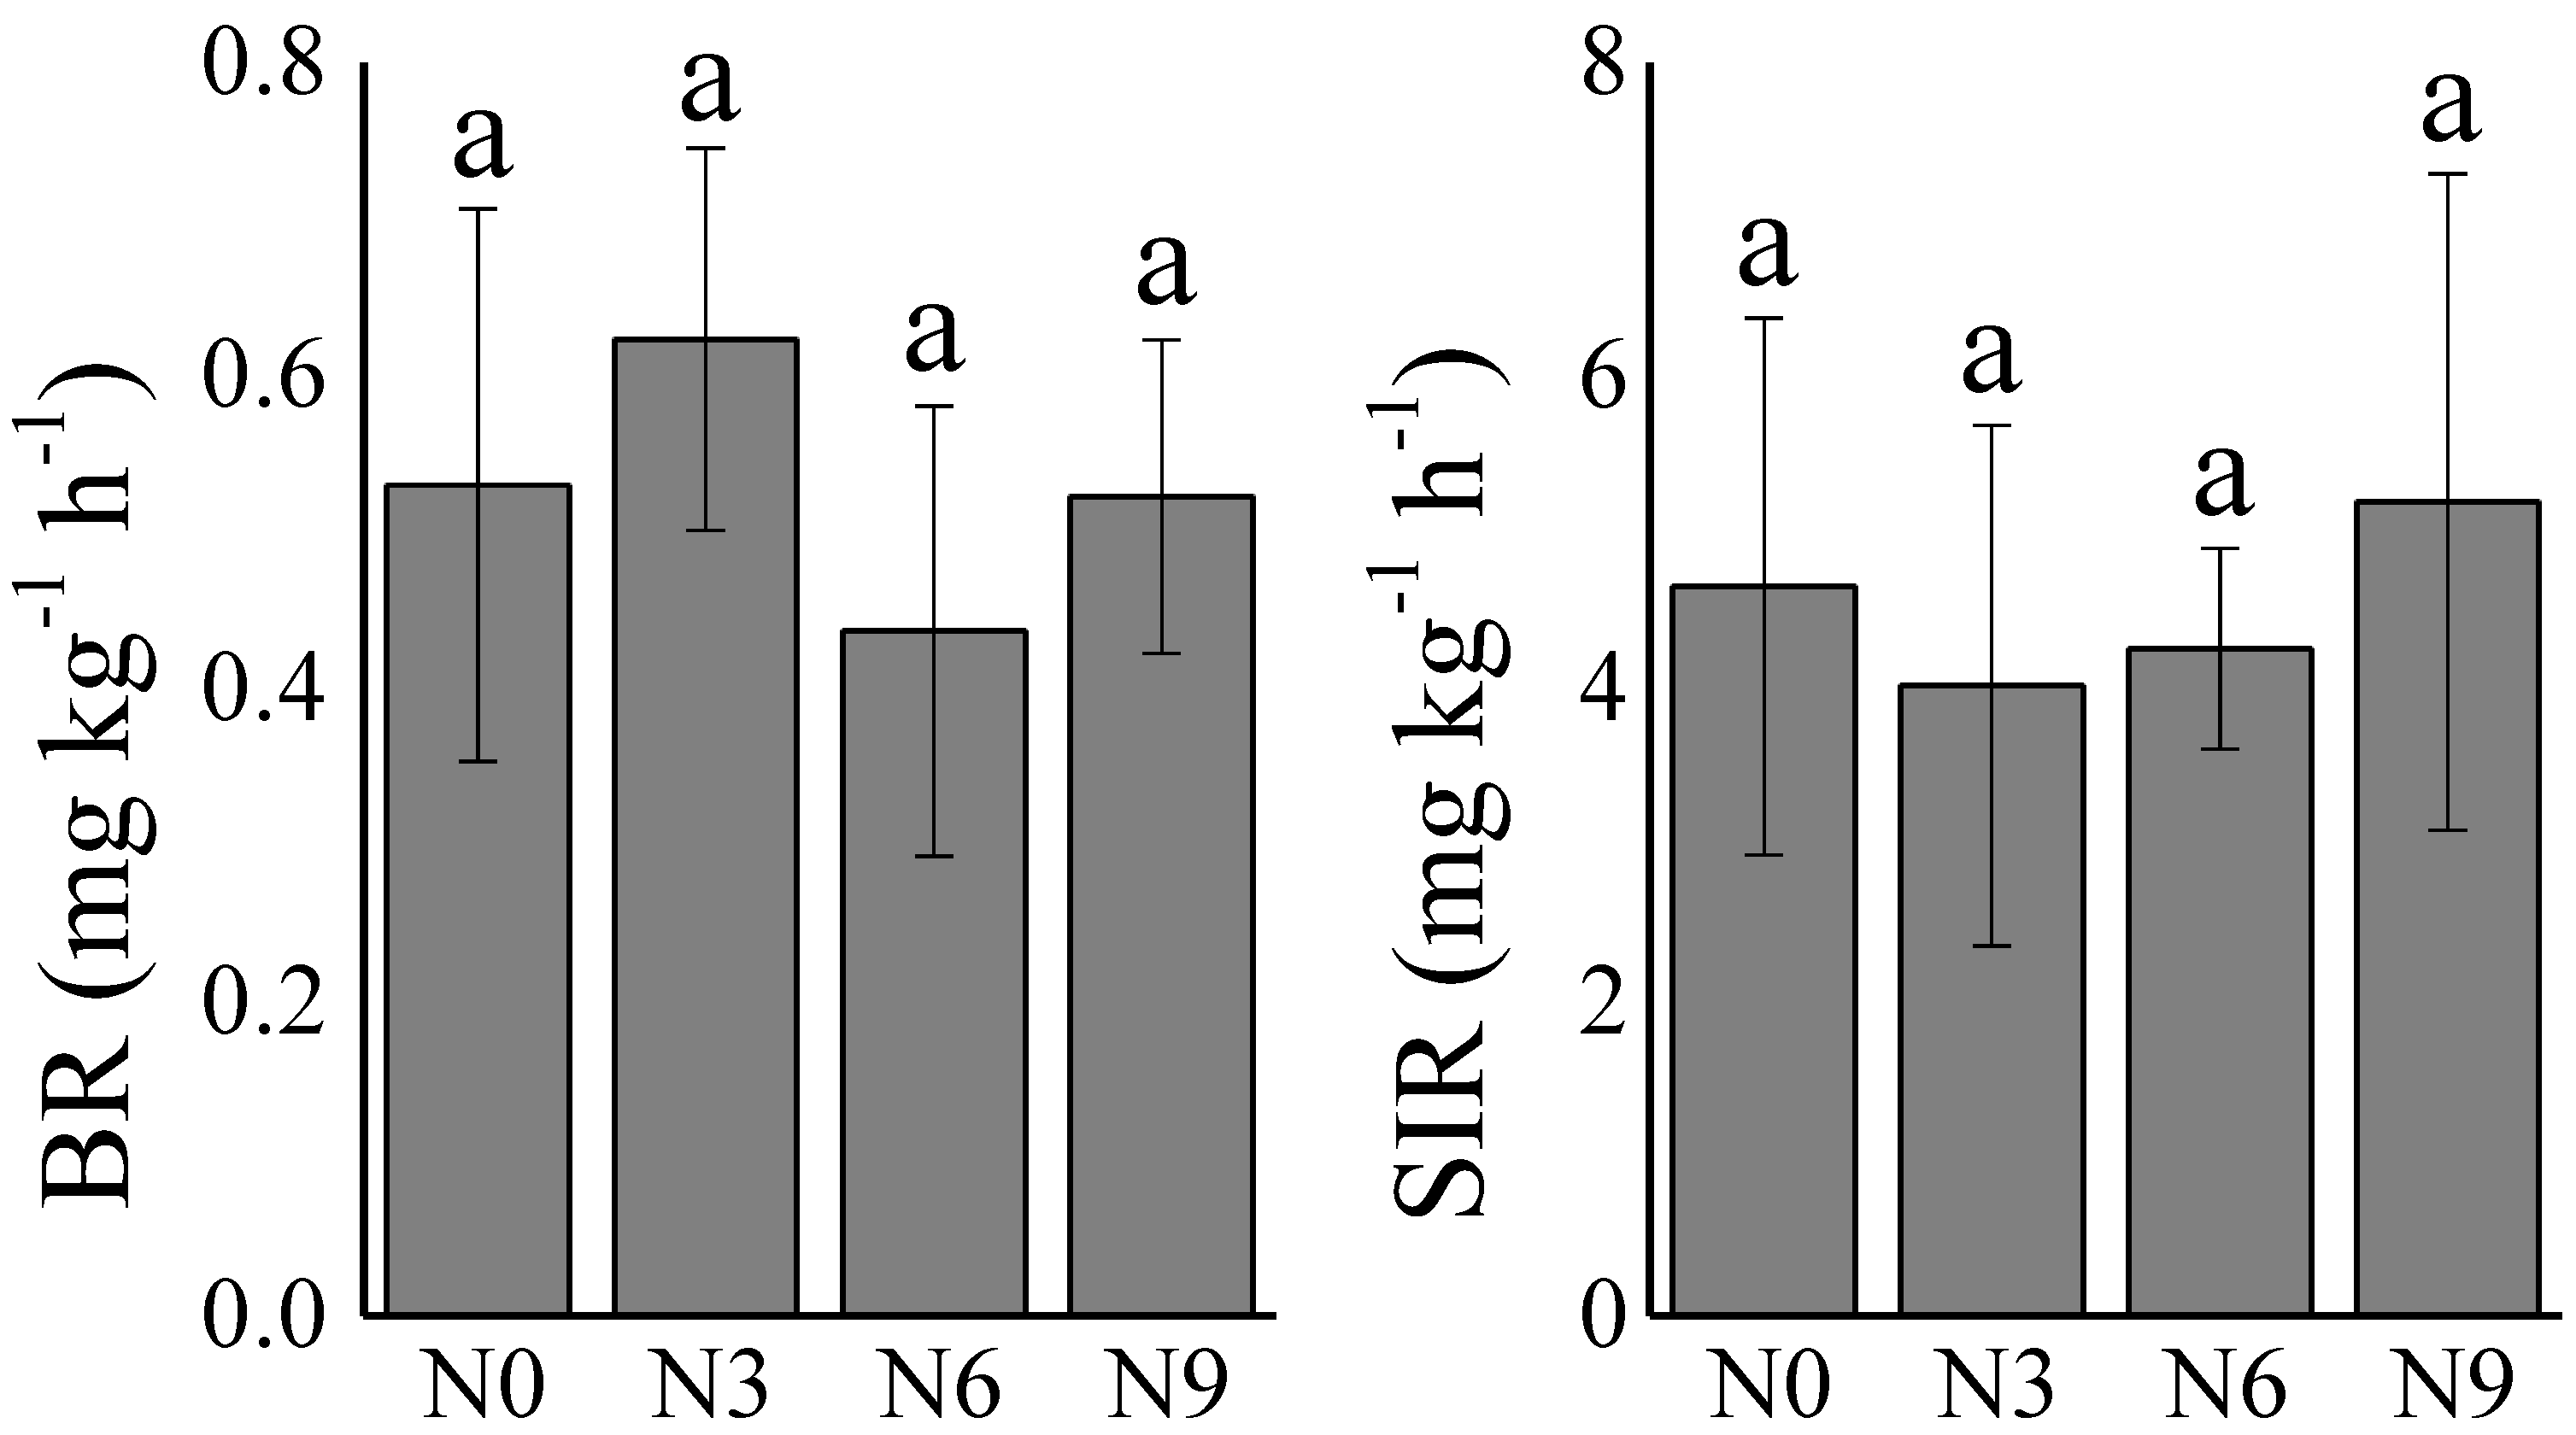
3.1.1. Soil Microbial Activity under N Addition

Low N addition significantly decreased soil arylsulfatase activity (Figure 3E), while soil urease activity was significantly enhanced by low N addition (Figure 3I). Other N addition levels along the gradient had no significant influence on the soil arylsulfatase and urease activities. Soil β-xylosidase activity showed similar tendencies with the soil arylsulfatase activity, with a numerically minimum value measured at the low N (N3) addition treatment (Figure 3F). Mid- (N6) and high (N9) N addition reduced soil sucrase activity significantly compared with the N0 (control) and N3 treatments. Compared with N0, the soil amylase activity was significantly reduced by the N9 addition, but was not significantly impacted by the N3 and N6 treatments.

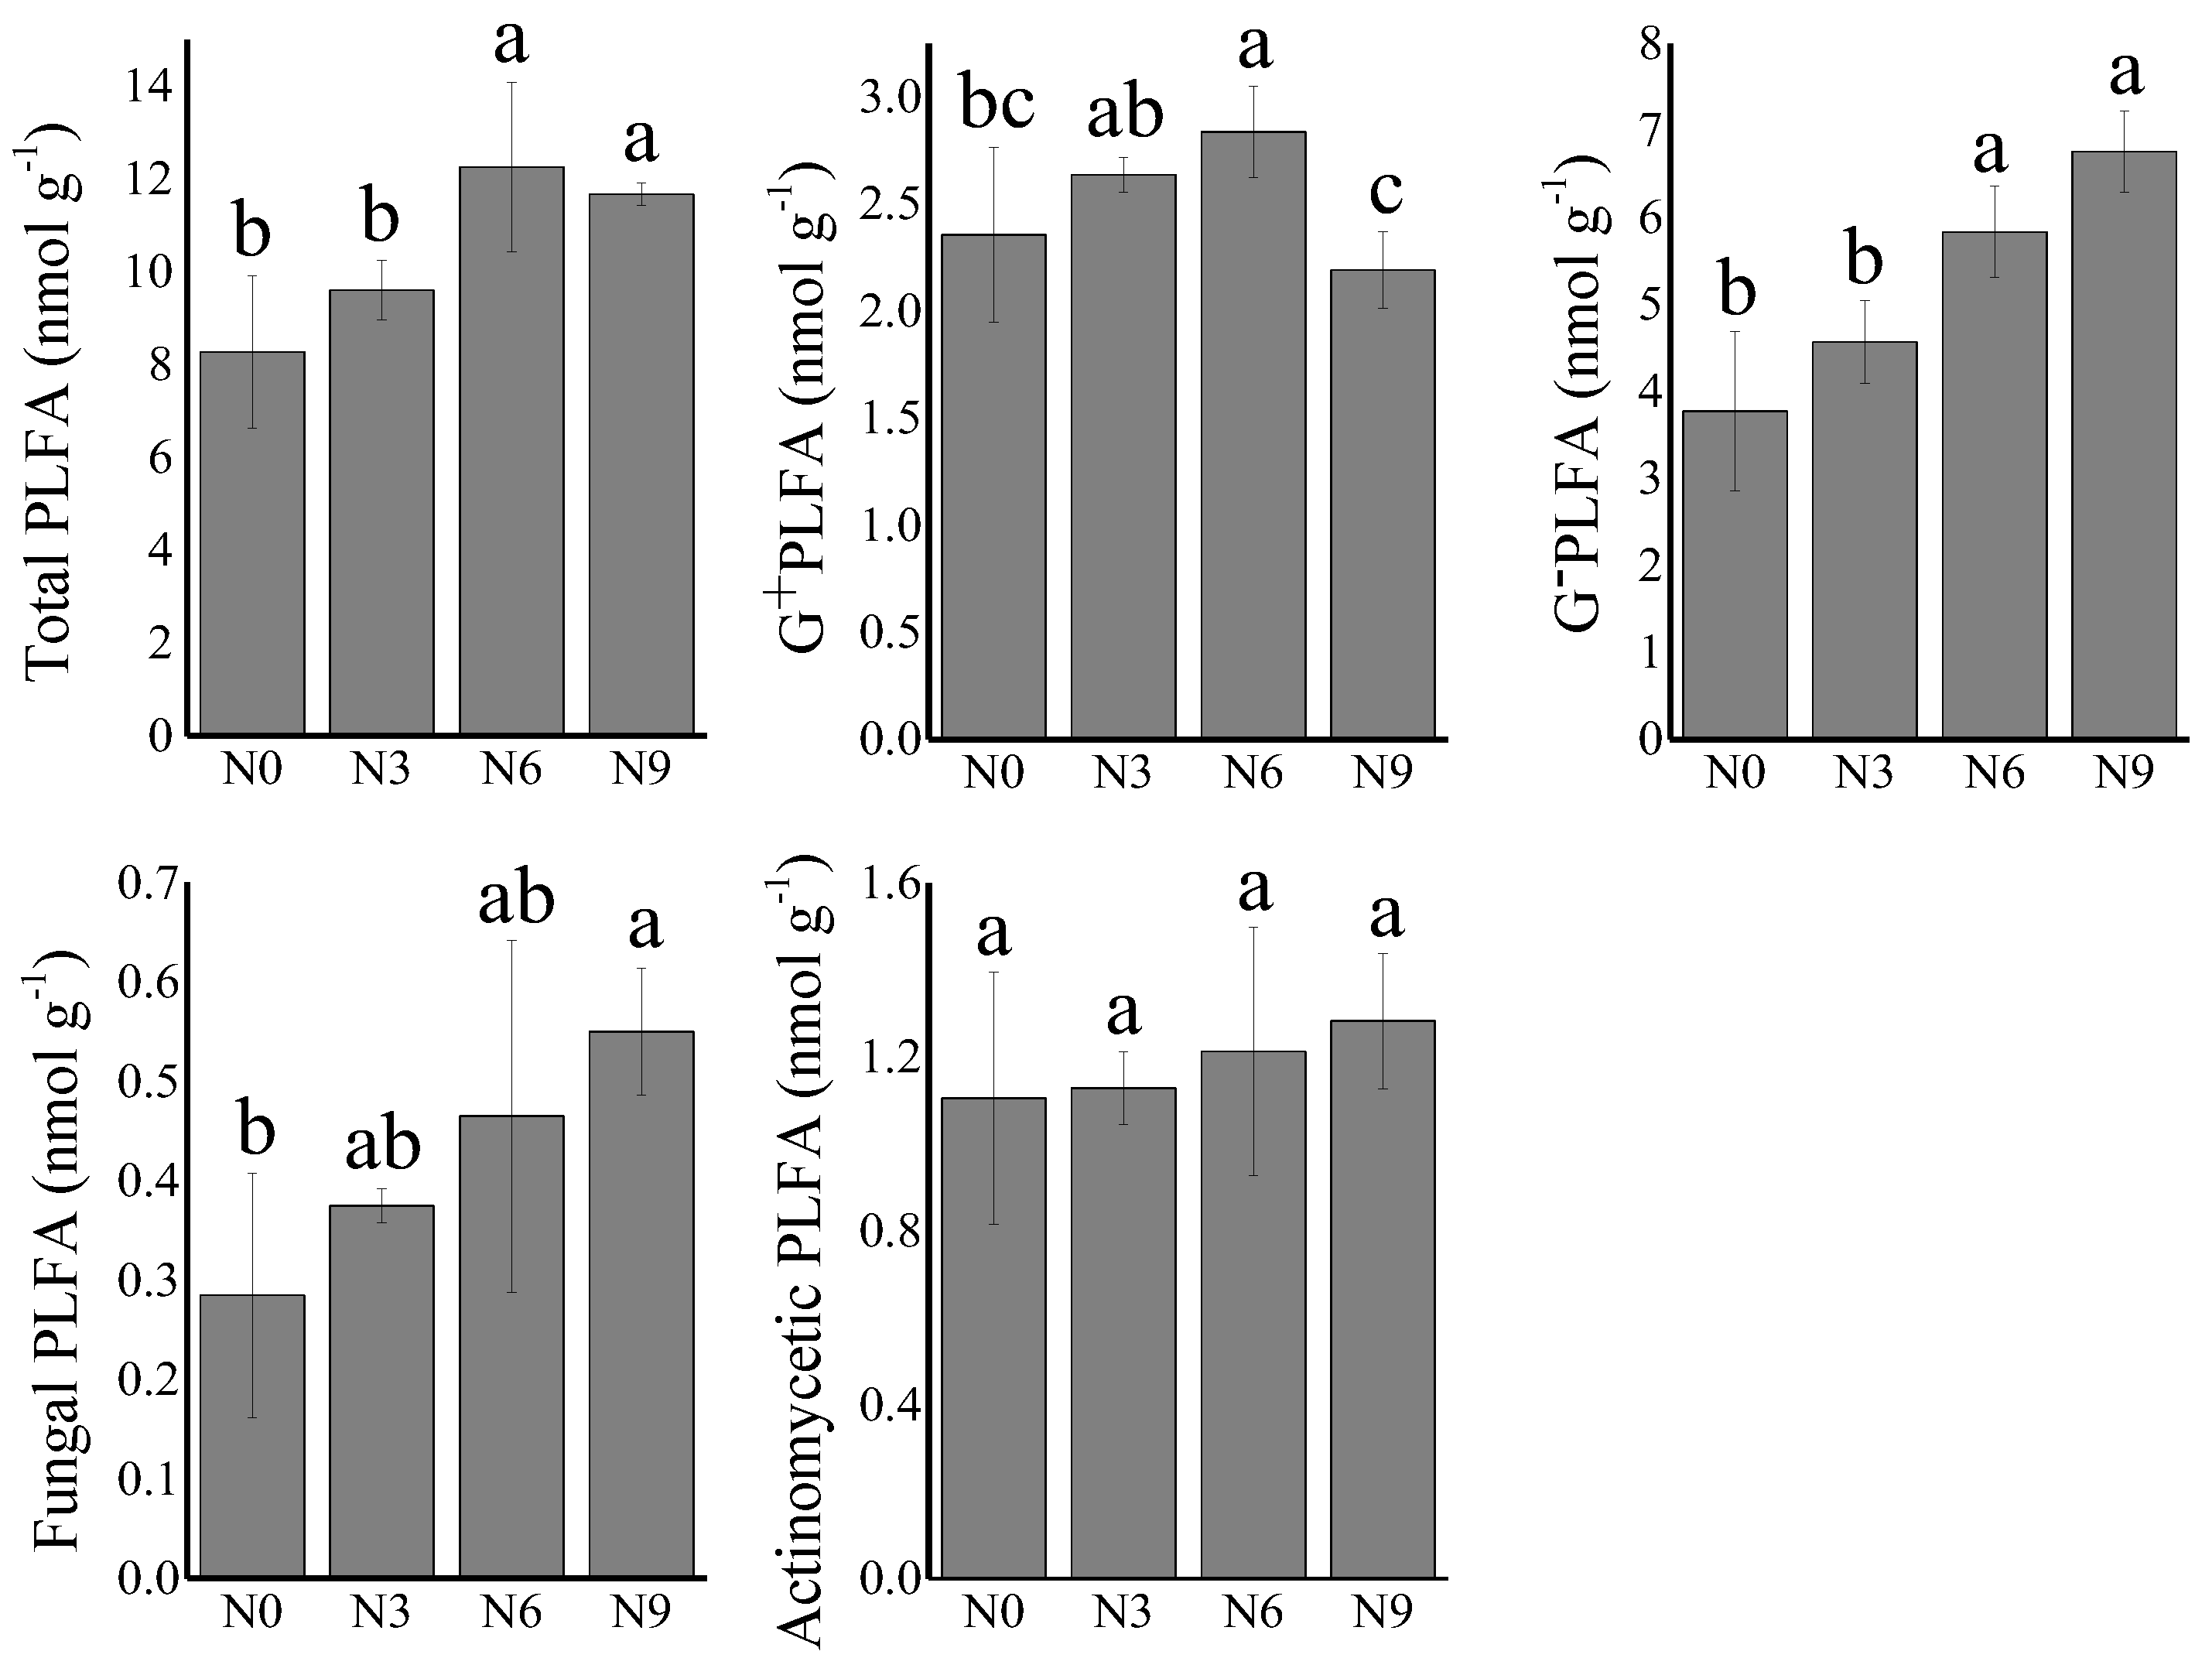
3.1.2. Soil Microbial PLFAs under N Addition

Soil G+ PLFA and GPLFA showed different trends along the N-addition gradient (Figure 4). Soil G+PLFA contents increased at first and then decreased, peaking at the N6 treatment. GPLFA contents enhanced with the N-addition gradient, with the N6 and N9 treatments significantly higher than the N0 and N3. In addition, the richness and evenness indices of the soil microbial community structure had similar trends, with the indices in the N0 and N3 treatments being higher than the N6 and N9 treatments (Table 1).

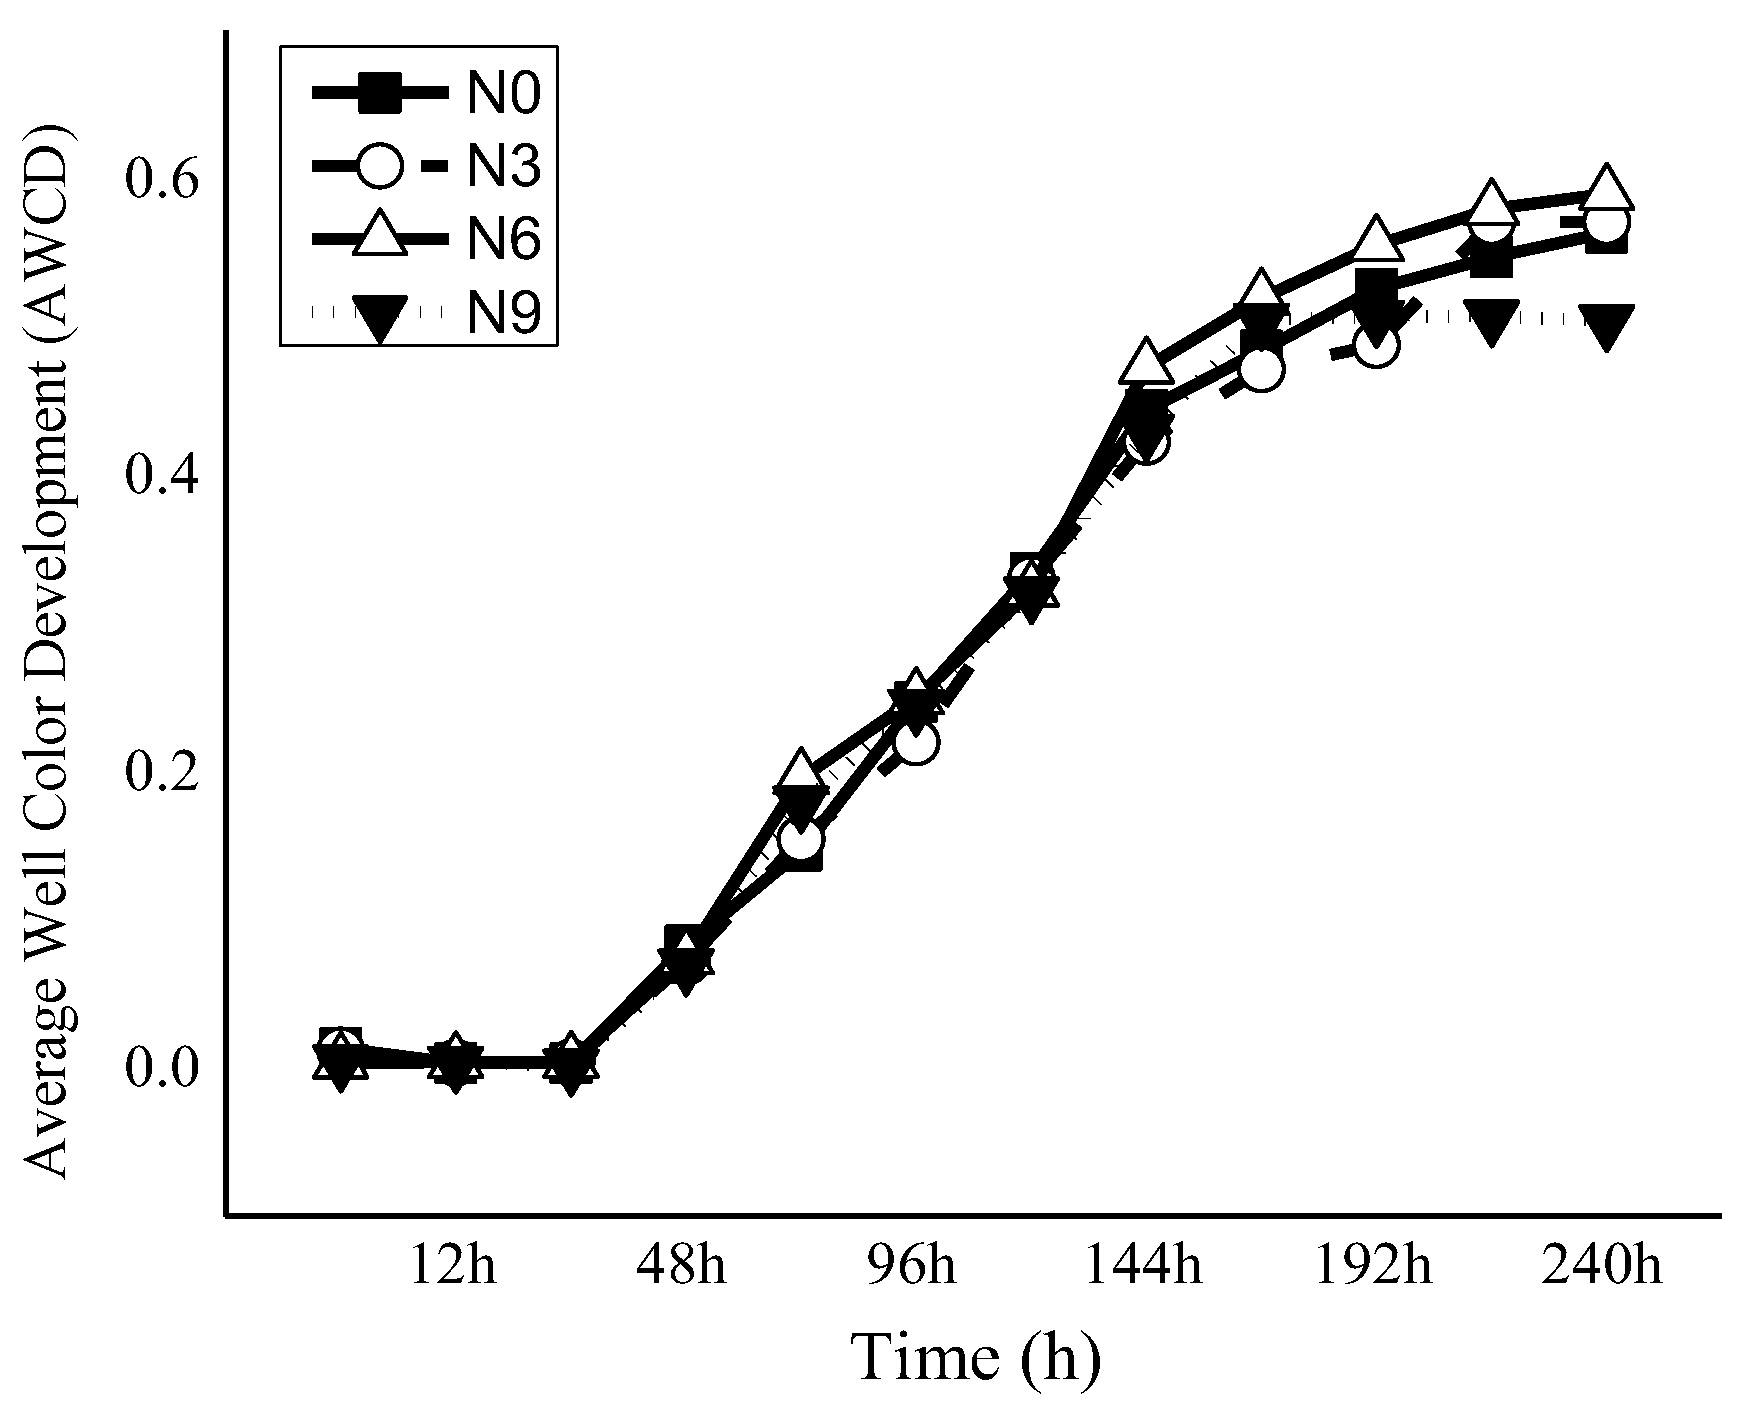
3.1.3. Soil Microbial Metabolic Diversity under N Addition

The AWCD of all C sources for all N treatments almost followed the same trend during the culture period of 240 h (Figure 5), i.e., increased with the increase in culture time and almost reached a stable plateau towards the end of the measurement period. In the first 24 h, the AWCDs were observed to be at a similar level. After 120 h, the AWCDs started to deviate among the treatments. The richness indices of the soil microbial metabolic diversity had no significant differences among each treatment. The evenness index of soil microbial metabolic diversity peaked in the N6 treatment and was significantly higher than the N3 treatment (Table 1).

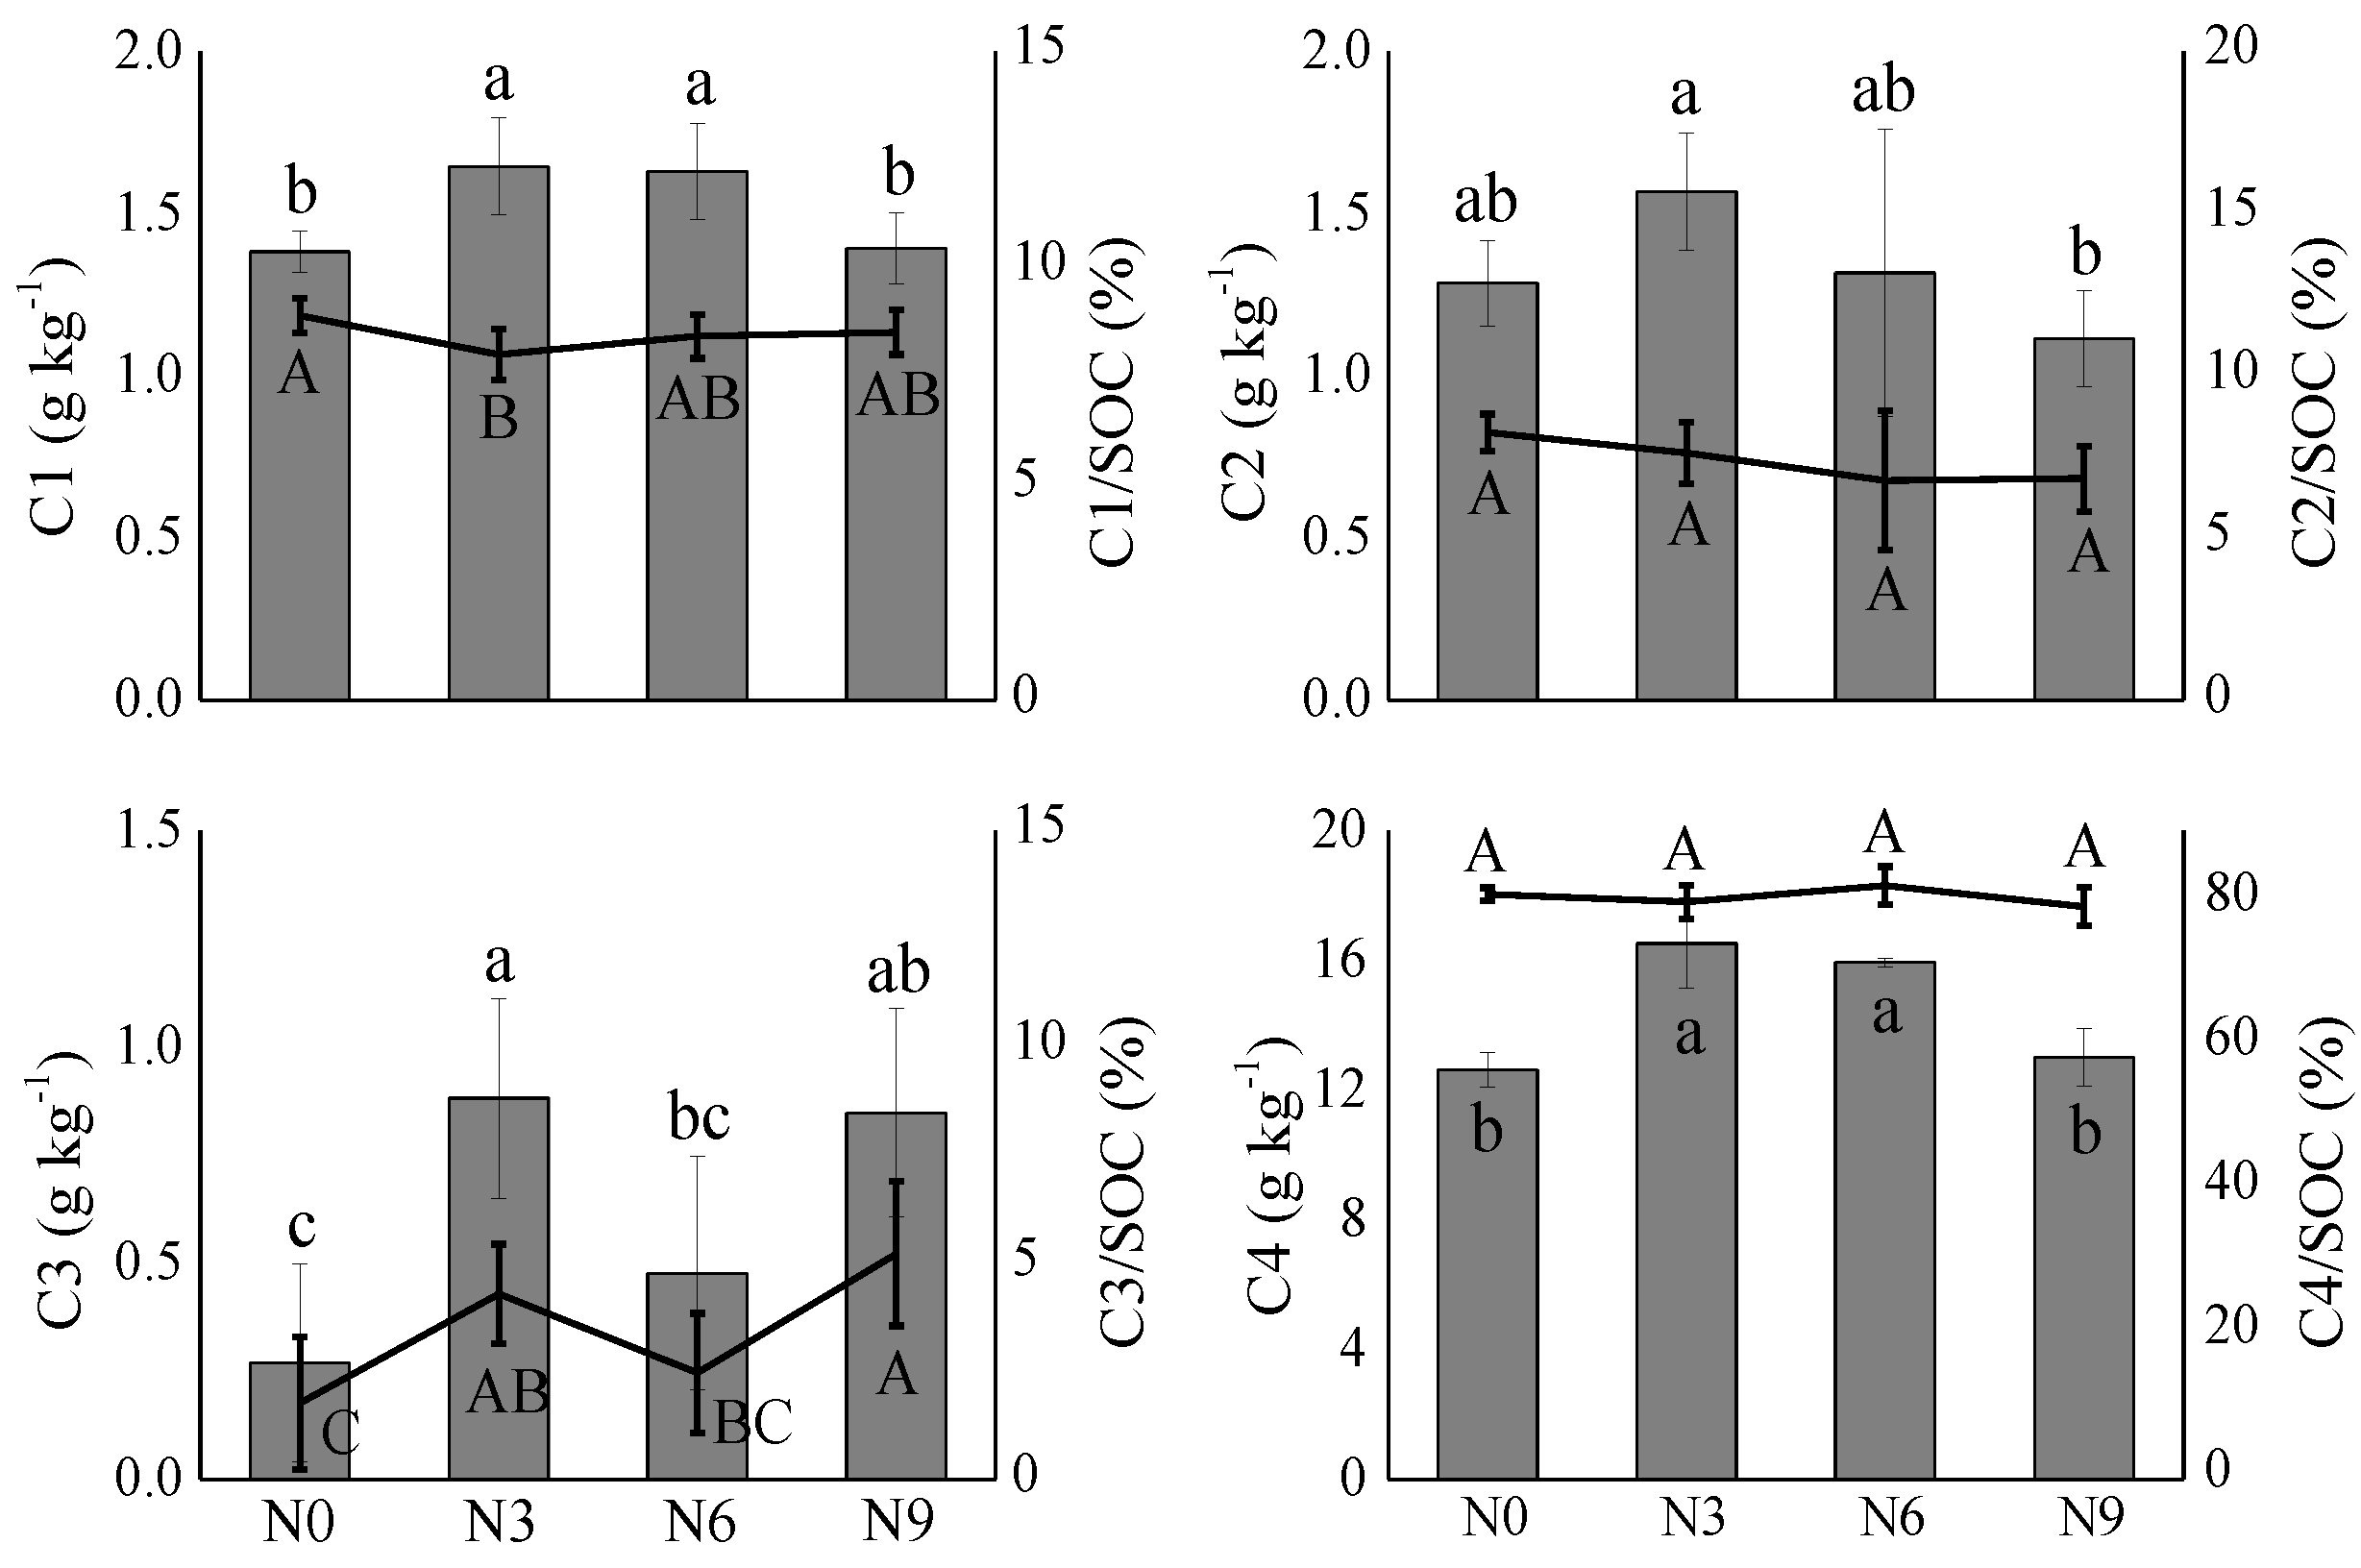
3.2. SOC Fractions under N Addition

Contents and proportions of SOC fractions under different N addition treatments are shown in Figure 6. Low N addition significantly enhanced the CMI, thus increasing soil quality (Table 2). Moreover, lability and the lability index decreased at first and then increased, with minimum values at N6 as well as maximum numerical values at N9. The sensitivity indices of C1, C2, and C3 showed different trends with the N-addition gradient. The N3 and N6 treatments significantly decreased the C1 sensitivity index compared with the N0 and N9 treatments. In addition, the N3 treatment increased the C2 and C3 sensitivity indices, with maximum values observed in the N3 treatment.

3.3. Integrated Effect of Microbiological Properties on SOC Fractions and Stability in Response to N Addition Treatments

The SEM explained 92.3% of the variance in CMI and 87.1% of the variance in the lability of SOC (Figure 7) with the parameters chosen in this study. N addition had both indirect as well as direct impacts on the CMI and lability (Figure 7), showing directly positive effects on both CMI and lability. Soil microbiological properties, SMB, SR, and EPLFA, had positive effects on the CMI; SMB and SR did not show any significant effects on lability; and EPLFA had a positive effect on lability. In addition, the sensitivity indices of the different SOC fractions as influenced by the four groups of biomicrobial properties are shown in Figure S1.

4. Discussion

4.1. Response of Soil Microbiological Properties to N Addition

Enzymatic activities indicate the adaptation of the microbes to changes in the soil resources. According to previous studies, N addition could enhance the demand of soil microbes for soil sources, such as C, N, P, and S, before N saturation, thus the activities of different enzymes involving soil element cycling should be increased because of N addition [5,6]. Some studies also showed different responses of enzymes along an N-addition gradient, as expected [33,34]. In this study, BG, NAG, and AP participated partially in the cycling processes involving C, N, and P; however, they did not show significant differences under each N addition treatment [29]. Apart from BG, cellulase involving C decomposition also did not vary along the N-addition gradient, which is supported by the findings of Gong et al. [5]. This may be because N addition did not change the N-limited status for microbes; therefore, the microbial community did not enter into a C-limited status, which is supported by our previous finding [29]. Moreover, enzymatic activities were also influenced by environmental materials, which could interact with enzymes released from cells [35]. In our manuscript, the urease activity involving the N cycling process reached the highest level at low N addition, which is inconsistent with the findings of Liu et al. [36] and Gong et al. [5] but consistent with those of Song et al. [37]. This is also supported by the highest soil C:N ratio being observed in the treatment with low N addition, where the urease activity was increased to alleviate this N-limited status. Amylase activity, involving S mineralization, was decreased at low N addition treatment, and no significant differences were observed at mid- and high N addition treatments compared with the control, which is supported by the results that N addition decreased arylsulfatase activity [38].
The effect of N inputs on the C emissions largely affected the direction and degree of the soil C balance response [39]. In this study, the N addition did not have a significant impact on the soil basal and induced respiration, which is consistent with Samuelson et al. [40]. However, studies have illustrated that N addition can either inhibit [41] or promote soil respiration [42]. This may be because soil microbial respiration is influenced by substrate quality and quantity, EEA, temperature, moisture, and microbial biomass [43].
In the present study, the mid-N addition increased the AWCD of all C at 72 h (Figure S1). The changes in AWCD among the different C substrates caused by N addition led to no significant changes in HBIOLOG but a maximum numerical value for EBIOLOG at N6. Zhong and Cai [44] found that N application had no direct impact on the soil microbial functional diversity, which partially supports our findings. Fang et al. [45] revealed that N inputs stimulated microbial metabolic activity and the preferential utilization of organic acids. He et al. [46] revealed that N inputs of 5 g N m−2 y−1 also significantly enhanced microbial functional diversity, while high N inputs of 20 g N m−2 y−1 reduced the microbial functional diversity because of belowground plant biomass. In addition, communities with a high plant species richness generated more various litter types and root exudates, thus resulting in a higher microbial functional diversity [47].

4.2. Response of Different SOC Fractions to N Addition

Labile organic carbon, C1, C2, and C3, consist of amino acids, simple carbohydrates, a portion of SMB, and other simple organic compounds [11], which are easily altered by environmental factors. Both labile organic carbon as well as non-labile OC increased at low N addition in this study. However, Wang et al. [15] illustrated that N addition did not alter the labile OC content. Wang et al. [15] reported no alternations in the labile OC ascribed to the decomposition offset of organic C generated from higher inputs of net primary production (NPP). In high N addition, labile and non-labile OC did not show significant differences with CK. However, Chen et al. [10] found an increase in labile OC with the addition of high N above the N saturation level because excessive N addition would inhibit the extracellular ligninolytic enzyme activities, leading to a decrease in the decomposition rate of litter. In addition, the high N addition may also result in excess soil N availability and reduce the N requirements of litter decomposers [23], thus affecting C fractions.
The maximum SOC fractions, including labile and non-labile OC, were observed in the treatment with a low level of N addition in this study, consistent with Chen et al. [10]. This was because appropriate N addition promoted plant litter and root exudates, increasing C input, while microbial respiration did not change significantly, inducing no changes in the offset of OC, thus the SOC content increased. In addition, the low N addition treatment significantly increased the CMI compared with the mid- and high N addition treatments. This indicated that appropriate N input was capable of increasing soil quality and enhancing the function of soil nutrient cycling, which is supported by Liu et al. [48]. Moreover, the stability of SOC did not show significant differences at N0, low, and mid-N addition, which is supported by Ghosh et al. [13] who also found that N addition (12 g N m−2 y−1) would not change SOC stability. However, high N addition increases the stability of SOC, which is supported by previous findings that high-level addition would inhibit the extracellular ligninolytic enzyme activities and lead to a decrease in litter decomposition rate.

4.3. Driving Factors of Soil Microbiological Properties on CMI and SOC Stability

SEM was conducted to analyze the impact of soil microbiological properties under N addition on CMI and the stability of SOC based on modified MCP theory. According to the results, N addition showed direct impacts on the CMI and SOC stability. In addition, “microbial in vivo modification” and “microbial ex vivo modification” played more vital roles in microbial control of CMI than the stability of SOC under N addition. SMB, as a “microbial in vivo modification” method to control SOC, was found to have a positive correlation with CMI and no significant relationship with SOC stability. This was mainly because soil microbes, as the composition of soil labile OC, positively impacted CMI, while the stability of SOC was not only affected by soil labile organic carbon but also soil non-labile organic carbon, inducing no significant relationship between them. Soil enzymes play significant roles in decomposing plant-derived macromolecule carbon substrates in soil into soil labile and non-labile organic carbon [22,23], which depend on the available soil element contents and environmental factors [35]. In this study, enzymatic activities via “microbial ex vivo modification” had a negative influence on the CMI and stability of SOC, showing different functional trends as seen in other studies [10,23]. This was mainly because N addition higher than N saturation would inhibit enzymatic activities or soil acidity would lower enzymatic activities, thus having a negative influence. From a microbial community structure perspective, EPLFA was decreased by N addition and CMI increased under N addition. This is attributed to the increase in functional taxa or fungi that would have capacities to decompose recalcitrant substrates, thus decreasing EPLFA and increasing CMI.

5. Conclusions

Our data indicated that appropriate N addition would increase sequestration potential and the quality of SOC in soil ecosystems in plantations. Specifically, “microbial in vivo modification” and “microbial ex vivo modification” played more vital roles in microbial control of CMI than the stability of SOC under N addition. SMB and SR had a positive relationship with CMI under N addition, while some enzymatic activities had the opposite effect on CMI. Moreover, EPLFA could be decreased by N addition, and it enhanced CMI and the stability of SOC. The present study furthers our understanding of the influence of N addition on the sequestration potential, quality, and stability of SOC based on MPC theory. Further identification and study of soil functional microbial taxa that can play a vital role in decomposing recalcitrant substrates may be helpful in determining the detailed mechanisms involved.

Supplementary Materials

The following supporting information can be downloaded at: https://www.mdpi.com/article/10.3390/f14081540/s1, Table S1: Soil chemical properties in different N addition level. Figure S1. Bacterial AWCD at 72 h and 240 h under different N addition. References [30,31,49,50,51,52,53,54] are cited in supplementary materials.

Author Contributions

Methodology, H.L. and G.W.; Formal analysis, J.Z.; Resources, G.L.; Writing—original draft, J.Z. and H.H.; Writing—review & editing, H.L., H.W., Z.Z., G.W., S.X. and G.L.; Supervision, S.X.; Funding acquisition, G.W. and S.X. All authors have read and agreed to the published version of the manuscript.

Funding

This work was financially supported by National Key Research and Development Program of China (2022YFF1300402), and National Natural Science Foundation of China (42107492).

Data Availability Statement

Data available on request from the corresponding author.

Acknowledgments

We thank the anonymous reviewers and the editors of the journal who provided constructive comments and suggestions on the manuscript.

Conflicts of Interest

The authors declare no conflict of interest.

References

  1. Lal, R. Soil carbon sequestration to mitigate climate change. Geoderma 2004, 123, 1–22. [Google Scholar] [CrossRef]
  2. Liang, C.; Zhu, X. The soil microbial carbon pump as a new concept for terrestrial carbon sequestration. Sci. China Earth Sci. 2021, 64, 545–558. [Google Scholar] [CrossRef]
  3. Sanderman, J.; Hengl, T.; Fiske, G.J. Soil carbon debt of 12,000 years of human land use. Proc. Natl. Acad. Sci. USA 2017, 114, 9575–9580. [Google Scholar] [CrossRef]
  4. Stockmann, U.; Adams, M.A.; Crawford, J.W.; Field, D.J.; Henakaarchchi, N.; Jenkins, M.; Minasny, B.; McBratney, A.B.; Courcelles, V.R.; Singh, K.; et al. The knowns, known unknowns and unknowns of sequestration of soil organic carbon. Agric. Ecosyst. Environ. 2013, 164, 80–99. [Google Scholar] [CrossRef]
  5. Gong, S.W.; Zhang, T.; Guo, R.; Cao, H.B.; Shi, L.X.; Guo, J.X.; Sun, W. Response of soil enzyme activity to warming and nitrogen addition in a meadow steppe. Soil Res. 2015, 53, 242–252. [Google Scholar] [CrossRef]
  6. Stone, M.M.; Weiss, M.S.; Goodale, C.L.; Adams, M.B.; Fernandez, I.J.; German, D.P.; Allison, S.D. Temperature sensitivity of soil enzyme kinetics under N-fertilization in two temperate forests. Glob. Chang. Biol. 2012, 18, 1173–1184. [Google Scholar] [CrossRef]
  7. Galloway, J.N.; Dentener, F.J.; Capone, D.G.; Boyer, E.W.; Howarth, R.W.; Seitzinger, S.P.; Asner, G.P.; Cleveland, C.C.; Green, P.A.; Holland, E.A.; et al. Nitrogen cycles: Past, present, and future. Biogeochemistry 2004, 70, 153–226. [Google Scholar] [CrossRef]
  8. Zhong, Y.Q.W.; Yan, W.M.; Shangguan, Z.P. Soil carbon and nitrogen fractions in the soil profile and their response to long-term nitrogen fertilization in a wheat field. Catena 2015, 135, 38–46. [Google Scholar] [CrossRef]
  9. Chan, K.Y.; Bowman, A.; Oates, A. Oxidizible organic carbon fractions and soil quality changes in an Oxic Paleustalf under different pasture leys. Soil Sci. 2001, 166, 61–67. [Google Scholar] [CrossRef]
  10. Chen, X.M.; Li, Y.L.; Mo, J.M.; Otieno, D.; Tenhunen, J.; Yan, J.H.; Liu, J.X.; Zhang, D.Q. Effects of nitrogen deposition on soil organic carbon fractions in the subtropical forest ecosystems of S China. J. Plant Nutr. Soil Sci. 2012, 175, 947–953. [Google Scholar] [CrossRef]
  11. Li, J.; Wen, Y.C.; Li, X.H.; Li, Y.T.; Yang, X.D.; Lin, Z.; Song, Z.Z.; Cooper, J.M.; Zhao, B.Q. Soil labile organic carbon fractions and soil organic carbon stocks as affected by long-term organic and mineral fertilization regimes in the North China Plain. Soil Tillage Res. 2018, 175, 281–290. [Google Scholar] [CrossRef] [Green Version]
  12. Mtambanengwe, F.; Mapfumo, P. Smallholder farmer management impacts on particulate and labile carbon fractions of granitic sandy soils in Zimbabwe. Nutr. Cycl. Agroecosyst. 2008, 81, 1–15. [Google Scholar] [CrossRef]
  13. Ghosh, A.; Bhattacharyya, R.; Meena, M.C.; Dwivedi, B.S.; Singh, G.; Agnihotri, R.; Sharma, C. Long-term fertilization effects on soil organic carbon sequestration in an Inceptisol. Soil Tillage Res. 2018, 177, 134–144. [Google Scholar] [CrossRef]
  14. Powlson, D.S.; Bhogal, A.; Chambers, B.J.; Coleman, K.; Whitmore, A.P. The potential to increase soil carbon stocks through reduced tillage or organic material additions in england and wales: A case study. Agric. Ecosyst. Environ. 2012, 146, 1. [Google Scholar] [CrossRef]
  15. Wang, R.Z.; Dijkstra, F.A.; Liu, H.Y.; Yin, J.F.; Wang, X.; Feng, X.; Xu, Z.W.; Jiang, Y. Response of soil carbon to nitrogen and water addition differs between labile and recalcitrant fractions: Evidence from multi-year data and different soil depths in a semi-arid steppe. Catena 2019, 172, 857–865. [Google Scholar] [CrossRef]
  16. Blair, G.J.; Lefroy, R.D.B.; Lise, L. Soil Carbon Fractions Based on Their Degree of Oxidation, and the Development of a Carbon Management Index for Agricultural Systems. Aust. J. Agric. Res. 1995, 46, 1459–1466. [Google Scholar] [CrossRef]
  17. Guan, G.Y.; Fan, Y.M.; Wu, H.Q.; Yan, D.Z. The relationship of soil particle fractal characteristics and organic carbon pool stability under different types of utilization. Acta Agrestia Sin. 2016, 24, 258–262. [Google Scholar]
  18. Cooper, J.M.; Burton, D.; Daniell, T.J.; Griffiths, B.S.; Zebarth, B.J. Carbon mineralization kinetics and soil biological characteristics as influenced by manure addition in soil incubated at a range of temperatures. Eur. J. Soil Biol. 2011, 47, 392–399. [Google Scholar] [CrossRef]
  19. Liang, C.; Schimel, J.P.; Jastrow, J.D. The importance of anabolism in microbial control over soil carbon storage. Nat. Microbiol. 2017, 2, 17105. [Google Scholar] [CrossRef]
  20. Mooshammer, M.; Wanek, W.; Hämmerle, I.; Fuchslueger, L.; Hofmhansl, F.; Knoltsch, A.; Schnecker, J.; Takriti, M.; Watzka, M.; Wild, B.; et al. Adjustment of microbial nitrogen use efficiency to carbon:nitrogen imbalance regulates soil nitrogen cycling. Nat. Commun. 2014, 5, 3694. [Google Scholar] [CrossRef] [Green Version]
  21. Fang, H.J.; Yu, G.R.; Cheng, S.L.; Mo, J.M.; Yan, J.H.; Li, S.G. C-13 abundance, water-soluble and microbial biomass carbon as potential indicators of soil organic carbon dynamics in subtropical forests at different successional stages and subject to different nitrogen loads. Plant Soil 2009, 320, 243–254. [Google Scholar] [CrossRef]
  22. Waldrop, M.P.; Zak, D.R.; Sinsabaugh, R.L.; Gallo, M.; Lauber, C. Nitrogen deposition modifies soil carbon storage through changes in microbial enzymatic activity. Ecol. Appl. 2004, 14, 1172–1177. [Google Scholar] [CrossRef]
  23. Mo, J.; Zhang, W.; Zhu, W.; Gundersen, P.; Fang, Y.; Li, D.; Wang, H. Nitrogen addition reduces soil respiration in a mature tropical forest in southern China. Glob. Chang. Biol. 2008, 14, 403–412. [Google Scholar] [CrossRef]
  24. Bobbink, R.; Hicks, K.; Galloway, J.; Spranger, T.; Alkemade, R.; Ashmore, M.; Bustamante, M.; Cinderby, S.; Davidson, E.; Dentener, F.; et al. Global assessment of nitrogen deposition effects on terrestrial plant diversity: A synthesis. Ecol. Appl. 2010, 20, 30–59. [Google Scholar] [CrossRef] [PubMed] [Green Version]
  25. Holland, E.A.; Dentener, F.J.; Braswell, B.H.; Sulzman, J.M. Contemporary and pre-industrial global reactive nitrogen budgets. Biogeochemistry 1999, 46, 7–43. [Google Scholar] [CrossRef]
  26. Hok, L.; Sa, J.C.D.; Reyes, M.; Boulakia, S.; Tivet, F.; Leng, V.; Kong, R.; Briedis, C.; Hartman, D.D.; Ferreira, L.A.; et al. Enzymes and C pools as indicators of C build up in short-term conservation agriculture in a savanna ecosystem in Cambodia. Soil Tillage Res. 2018, 177, 125–133. [Google Scholar] [CrossRef]
  27. Wei, X.; Tong, Y.A.; Qiao, L.; Liu, X.J.; Duan, M.; Li, J. Preliminary estimate of the atmospheric nitrogen deposition in different ecological regions of Shaanxi province. J. Agro Environ. Sci. 2010, 29, 795–800. [Google Scholar]
  28. Liang, T.; Tong, Y.A.; Liu, X.J.; Qiao, L. Dynamics of Atmospheric Nitrogen Wet Deposition Fluxes in Guanzhong Area, Shaanxi. J. Agro Environ. Sci. 2014, 33, 2389–2394. [Google Scholar]
  29. Zhang, J.Y.; Ai, Z.M.; Liang, C.T.; Wang, G.L.; Liu, G.B.; Xue, S. How microbes cope with short-term N addition in a Pinus tabuliformis forest-ecological stoichiometry. Geoderma 2019, 337, 630–640. [Google Scholar] [CrossRef]
  30. Bremner, J.; Mulvaney, C. Nitrogen—Total. Methods of soil analysis Part 2 Chemical and microbiological properties. Soil Sci. Soc. Am. Book Ser. 1982, 5, 595–624. [Google Scholar]
  31. Schade, J.D.; Kyle, M.; Hobbie, S.E.; Fagan, W.F.; Elser, J.J. Stoichiometric tracking of soil nutrients by a desert insect herbivore. Ecol. Lett. 2003, 6, 96–101. [Google Scholar] [CrossRef] [Green Version]
  32. Veen, G.F.; Olff, H.; Duyts, H.; van der Putten, W.H. Vertebrate herbivores influence soil nematodes by modifying plant communities. Ecology 2010, 91, 828–835. [Google Scholar] [CrossRef] [PubMed] [Green Version]
  33. Michel, K.; Matzner, E. Response of enzyme activities to nitrogen addition in forest floors of different C-to-N ratios. Biol. Fertil. Soils 2003, 38, 102–109. [Google Scholar] [CrossRef]
  34. Wang, Q.K.; Wang, S.L.; Liu, Y. Responses to N and P fertilization in a young Eucalyptus dunnii plantation: Microbial properties, enzyme activities and dissolved organic matter. Appl. Soil Ecol. 2008, 40, 484–490. [Google Scholar] [CrossRef]
  35. Sinsabaugh, R.L.; Shah, J. Ecoenzymatic Stoichiometry and Ecological Theory. Annu. Rev. Ecol. Evol. Syst. 2012, 43, 313–343. [Google Scholar] [CrossRef] [Green Version]
  36. Liu, X.C.; Zhang, S.T. Nitrogen addition shapes soil enzyme activity patterns by changing pH rather than the composition of the plant and microbial communities in an alpine meadow soil. Plant Soil 2019, 440, 11–24. [Google Scholar] [CrossRef]
  37. Song, Y.Y.; Song, C.C.; Tao, B.X.; Wang, J.Y.; Zhu, X.Y.; Wang, X.W. Short-term responses of soil enzyme activities and carbon mineralization to added nitrogen and litter in a freshwater marsh of Northeast China. Eur. J. Soil Biol. 2014, 61, 72–79. [Google Scholar] [CrossRef]
  38. Kang, H.; Lee, D. Inhibition of extracellular enzyme activities in a forest soil by additions of inorganic nitrogen. Commun. Soil Sci. Plant Anal. 2005, 36, 2129–2135. [Google Scholar] [CrossRef]
  39. Tu, L.H.; Hu, T.X.; Zhang, J.; Li, X.W.; Hu, H.L.; Liu, L.; Xiao, Y.L. Nitrogen addition stimulates different components of soil respiration in a subtropical bamboo ecosystem. Soil Biol. Biochem. 2013, 58, 255–264. [Google Scholar] [CrossRef]
  40. Samuelson, L.; Mathew, R.; Stokes, T.; Feng, Y.C.; Aubrey, D.; Coleman, M. Soil and microbial respiration in a loblolly pine plantation in response to seven years of irrigation and fertilization. For. Ecol. Manag. 2009, 258, 2431–2438. [Google Scholar] [CrossRef]
  41. Ramirez, K.S.; Craine, J.M.; Fierer, N. Nitrogen fertilization inhibits soil microbial respiration regardless of the form of nitrogen applied. Soil Biol. Biochem. 2010, 42, 2336–2338. [Google Scholar] [CrossRef]
  42. Cleveland, C.C.; Townsend, A.R. Nutrient additions to a tropical rain forest drive substantial soil carbon dioxide losses to the atmosphere. Proc. Natl. Acad. Sci. USA 2006, 103, 10316–10321. [Google Scholar] [CrossRef] [PubMed]
  43. Ryan, M.G.; Law, B.E. Interpreting, measuring, and modeling soil respiration. Biogeochemistry 2005, 73, 3–27. [Google Scholar] [CrossRef]
  44. Zhong, W.H.; Cai, Z.C. Long-term effects of inorganic fertilizers on microbial biomass and community functional diversity in a paddy soil derived from quaternary red clay. Appl. Soil Ecol. 2007, 36, 84–91. [Google Scholar] [CrossRef]
  45. Fang, H.J.; Cheng, S.L.; Yu, G.R.; Xu, M.J.; Wang, Y.S.; Li, L.S.; Dang, X.S.; Wang, L.; Li, Y.N. Experimental nitrogen deposition alters the quantity and quality of soil dissolved organic carbon in an alpine meadow on the Qinghai-Tibetan Plateau. Appl. Soil Ecol. 2014, 81, 1–11. [Google Scholar] [CrossRef]
  46. He, Y.T.; Qi, Y.C.; Dong, Y.S.; Xiao, S.S.; Peng, Q.; Liu, X.C.; Sun, L.J. Effects of Nitrogen Fertilization on Soil Microbial Biomass and Community Functional Diversity in Temperate Grassland in Inner Mongolia, China. Clean Soil Air Water 2013, 41, 1216–1221. [Google Scholar] [CrossRef]
  47. Prober, S.M.; Leff, J.W.; Bates, S.T.; Borer, E.T.; Firn, J.; Harpole, W.S.; Lind, E.M.; Seabloom, E.W.; Adler, P.B.; Bakker, J.D.; et al. Plant diversity predicts beta but not alpha diversity of soil microbes across grasslands worldwide. Ecol. Lett. 2015, 18, 85–95. [Google Scholar] [CrossRef] [Green Version]
  48. Liu, H.M.; Zhang, H.F.; Zhao, J.N.; Wang, H.; Qin, J.; Yang, D.L.; Zhang, N.Q. Effect of nitrogen addition on labile soil organic pool and carbon pool management index of Stipa baicalensis steppe in Inner Mongolia, China. Acta Pratacult. Sin. 2020, 29, 18–26. [Google Scholar]
  49. Frostegard, A.; Tunlid, A.; Baath, E. Phospholipid fatty-acid composition, biomass, and activity of microbial communities from 2 soil types experimentally exposed to different heavy-metals. Appl. Environ. Microbiol. 1993, 59, 3605–3617. [Google Scholar] [CrossRef]
  50. Garland, J.L.; Mills, A.L. Classification and Characterization of Heterotrophic Microbial Communities on the Basis of Patterns of Community-Level Sole-Carbon-Source Utilization. Appl. Environ. Microbiol. 1991, 57, 2351–2359. [Google Scholar] [CrossRef] [PubMed]
  51. Hueso, S.; Hernandez, T.; Garcia, C. 2011. Resistance and resilience of the soil microbial biomass to severe drought in semiarid soils: The importance of organic amendments. Appl. Soil Ecol. 2011, 50, 27–36. [Google Scholar] [CrossRef]
  52. Shannon, C.E. A mathematical theory of communication. Bell Syst. Tech. J. 1948, 27, 379–423. [Google Scholar] [CrossRef] [Green Version]
  53. Zelles, L. Fatty acid patterns of phospholipids and lipopolysaccharides in the characterisation of microbial communities in soil: A review. Biol. Fertil. Soils 1999, 29, 111–129. [Google Scholar] [CrossRef]
  54. Zhang, J.; Ai, Z.; Liang, C.; Wang, G.; Xue, S. Response of soil microbial communities and nitrogen thresholds of Bothriochloa ischaemum to short-term nitrogen addition on the Loess Plateau. Geoderma 2017, 308, 112–119. [Google Scholar] [CrossRef]
Figure 1. Soil microbial biomass (MB) under different N addition treatments: 0 g N m−2 y−1 (N0), 3 g N m−2 y−1 (N3, low-level N addition), 6 g N m−2 y−1 (N6, mid-level N addition), and 9 g N m−2 y−1 (N9, high-level N addition). Different letters represent significant differences between means under different N addition treatments (p < 0.05). Error bars represent standard errors.
Forests 14 01540 g001
Figure 2. Soil microbial basal respiration (BR) and induced respiration rates (SIR) under different N addition treatments: 0 g N m−2 y−1 (N0), 3 g N m−2 y−1 (N3, low-level N addition), 6 g N m−2 y−1 (N6, mid-level N addition), and 9 g N m−2 y−1 (N9, high-level N addition). Different letters represent significant differences between means under different N addition treatments (p < 0.05). Error bars represent standard errors.
Forests 14 01540 g002
Figure 3. Soil enzymatic activities under different N addition treatments: 0 g N m−2 y−1 (N0), 3 g N m−2 y−1 (N3, low-level N addition), 6 g N m−2 y−1 (N6, mid-level N addition), and 9 g N m−2 y−1 (N9, high-level N addition). (AI) represents the serial number of the subfigures showing each enzymatic activities. Different letters in each subfigure represent significant differences between means under different N addition treatments (p < 0.05). Error bars represent standard errors.
Forests 14 01540 g003
Figure 4. Soil phospholipid fatty acid under different N addition treatments: 0 g N m−2 y−1 (N0), 3 g N m−2 y−1 (N3, low-level N addition), 6 g N m−2 y−1 (N6, mid-level N addition), and 9 g N m−2 y−1 (N9, high-level N addition). Different letters represent significant differences between means under different N addition treatments (p < 0.05). Error bars represent standard errors.
Forests 14 01540 g004
Figure 5. Cumulative changes in bacterial AWCD in the 0–20 cm soil layer under different N addition treatments: 0 g N m−2 y−1 (N0), 3 g N m−2 y−1 (N3, low-level N addition), 6 g N m−2 y−1 (N6, mid-level N addition), and 9 g N m−2 y−1 (N9, high-level N addition) throughout the culture period.
Forests 14 01540 g005
Figure 6. Contents and proportions of soil organic carbon (SOC) fractions under different N addition treatments: 0 g N m−2 y−1 (N0), 3 g N m−2 y−1 (N3, low-level N addition), 6 g N m−2 y−1 (N6, mid-level N addition), and 9 g N m−2 y−1 (N9, high-level N addition). Lowercase letters represent significant differences among the means of SOC fraction contents. Uppercase letters represent significant differences among the means of SOC fraction proportions (p < 0.05). Error bars represent standard errors.
Forests 14 01540 g006
Figure 7. Structural equation model of the effects of soil microbiological factors on CMI (a) and lability (L) (b). These figures indicate the relationships between N addition (exogenous variable) and SMB, SR, HPLFA, EPLFA, HBIOLOG, and EBIOLOG. The final model (a) showed a good fit of the data: Chi-square = 36.273, p = 0.068. The final model (b) showed a good fit of the data: Chi-square = 36.269, p = 0.052. The numbers near the arrows represent the standardized path coefficients. The red arrows indicate significant positive relationships and the blue dashed arrows indicate significant negative relationships (p < 0.05). The solid arrows indicate positive relationships and the grey dashed arrows indicate negative relationships. Percentages near endogenous variables indicate the variance explained by the model. SR represents soil basal respiration and soil-induced respiration; HPLFA represents the richness index of soil using the PLFA; EPLFA represents the evenness index of soil using the PLFA; HBIOLOG represents the richness index of the soil Biolog analysis; EBIOLOG represents evenness index of the soil Biolog analysis.
Forests 14 01540 g007
Table 1. Changes in Shannon richness (H) and Shannon evenness (E) of the soil microbial community structure and metabolic diversity in the N addition treatments, as determined by the soil phospholipid fatty acids (PLFA), and soil microbial metabolic diversity using the Biolog technique (BIOLOG).
Treatment aHPLFAEPLFAHBIOLOGEBIOLOG
N03.15 ± 0.12 a b0.93 ± 0.01 a2.78 ± 0.05 a0.82 ± 0.01 ab
N33.24 ± 0.10 a0.92 ± 0.01 a2.71 ± 0.05 a0.80 ± 0.02 b
N62.94 ± 0.05 b0.88 ± 0.04 b2.78 ± 0.11 a0.85 ± 0.03 a
N92.91 ± 0.16 b0.87 ± 0.02 b2.77 ± 0.10 a0.81 ± 0.03 ab
a Rates of 0 g N m−2 y−1 (N0), 3 g N m−2 y−1 (N3, low-level N addition), 6 g N m−2 y−1 (N6, mid-level N addition), and 9 g N m−2 y−1 (N9, high-level N addition). b Data represent means ± standard deviations. Different letters indicate significant differences at p < 0.05.
Table 2. Soil carbon pool index (CPI), carbon management index (CMI), lability index (LI), and sensitivity index (SI) under different levels of N addition.
Treatment aCPILability (%)Lability IndexCMISI b (L)
(%)
SI c (C1)
(%)
SI (C2)
(%)
SI (C3)
(%)
N01 b23.29 ± 1.36 ab d1ab1000 ab0 b0 ab0 c
N31.32 ± 0.09 a24.92 ± 3.55 ab1.07 ± 0.15 ab141.35 ± 19.77 a7.00 ± 15.26 ab19.06 ± 10.87 a21.91 ± 14.18 a227.57 ± 85.80 a
N61.24 ± 0.04 a21.49 ± 2.27 b0.92 ± 0.10 b115.01 ± 15.71 b−7.73 ± 9.77 b17.88 ± 10.77 a2.48 ± 23.43 ab77.21 ± 100.75 bc
N91.05 ± 0.05 b25.97 ± 2.70 a1.12 ± 0.12 a117.00 ± 9.64 b11.53 ± 11.59 a0.68 ± 7.93 b−13.20 ± 11.57 b215.14 ± 89.88 ab
a Rates of 0 g N m−2 y−1 (N0), 3 g N m−2 y−1 (N3, low-level N addition), 6 g N m−2 y−1 (N6, mid-level N addition), and 9 g N m−2 y−1 (N9, high-level N addition). b Sensitivity index of lability. c Fraction I (C1) was oxidized using 33 mM KMnO4. Fraction II (C2) was determined as the difference between oxidized C with 167 mM KMnO4 and C1. Fraction III (C3) was determined as the difference between oxidized C with 333 mM KMnO4 and SOC fractional contents measured with 167 mM KMnO4. Non-labile soil oxidizable C fraction (C4) was determined as the difference between SOC and soil labile OC. d Data represent means ± standard deviations. Different lowercase letters indicate significant differences at p < 0.05.
Disclaimer/Publisher’s Note: The statements, opinions and data contained in all publications are solely those of the individual author(s) and contributor(s) and not of MDPI and/or the editor(s). MDPI and/or the editor(s) disclaim responsibility for any injury to people or property resulting from any ideas, methods, instructions or products referred to in the content.

