Abstract
This study presents a method of tree species classification using individual tree metrics derived from a three-dimensional point cloud from unmanned aerial vehicle laser scanning (ULS). In this novel approach, we evaluated the metrics of 1045 trees using generalized linear model (GLM) and random forest (RF) techniques to automatically assign individual trees into either a coniferous or broadleaf group. We evaluated several statistical descriptors, including a novel approach using the Clark–Evans spatial aggregation index (CE), which indicates the level of clustering in point clouds. A comparison of classifiers that included and excluded the CE indicator values demonstrated their importance for improved classification of the individual tree point clouds. The overall accuracy when including the CE index was 94.8% using a GLM approach and 95.1% using an RF approach. With the RF approach, the inclusion of CE yielded a significant improvement in overall classification accuracy, and for the GLM approach, the CE index was always selected as a significant variable for correct tree class prediction. Compared to other studies, the above-mentioned accuracies prove the benefits of CE for tree species classification, as do the worse results of excluding the CE, where the derived GLM achieved an accuracy of 92.6% and RF an accuracy of 93.8%.
1. Introduction
European forests have recently faced an increasing number and severity of disturbance events, which are closely associated with climate change [1]. Apart from abiotic factors such as wind or fire, insect pests and pathogens, both native and non-native, are on the rise. An example of such an unprecedented disturbance situation is the current bark-beetle outbreak in Central Europe [2]. Important mechanisms for mitigating the effects of individual disturbance events are the prediction of the possible trajectory of their spread and the subsequent direction of controls or management interventions in these areas. Methods for quickly and reliably determining the territory’s condition are needed to involve such a strategy. The rapid development of remote sensing techniques represents a suitable tool for these investigations.
Light Detection And Ranging (LiDAR) is an active sensing technology that can provide a detailed 3D reconstruction of objects and scenes, such as forest trees and stands [3,4], and represents a practical way to measure tree dimensions [5], volumes [6], and other characteristics [7]. LiDAR data’s characteristics and level of detail vary according to the carrier platform: highly detailed and accurate reconstructions are provided with stationary terrestrial laser scanning (TLS) [8], while a higher efficiency of data acquisition is offered by mobile devices installed on terrestrial mobile platforms or carried by a human (mobile laser scanning, MLS) [9] or piloted aircraft (aerial laser scanning, ALS). A special case of the latter method mentioned is data acquisition using unmanned aerial vehicles (UAVs) equipped with a LiDAR sensor—UAV laser scanning (ULS).
In recent years, UAV laser scanning has gained attention because of its safety, flexibility of data acquisition, and high-quality data compared to ALS, which is all caused by UAVs’ ability to fly at lower speeds and at lower altitudes above ground. The first study using a LiDAR-equipped UAV in forestry can be found as early as 2010 [10], where the authors presented a novel system based on a combination of Ibeo Lux and a Sick LMS151 laser scanner system together with IMU and GPS units. The authors acquired 3D point clouds that enabled tree height measurement with an error of 30 cm. Later, Wallace [11] presented a similar system additionally equipped with a high-definition (HD) camera for more precise point-cloud derivation. In the study, it was proven that the inclusion of the video information improved the accuracy of the final point cloud from 0.61 m to 0.34 m (root-mean-square error assessed against ground control).
Many scientific publications have dealt with the extraction of individual tree crowns and assessing dendrometric characteristics from ALS data [12,13,14]. ULS data are characterized by markedly higher densities, reaching thousands of points per square meter, and a higher diversity of scan angles, therefore providing high-quality 3D representations of tree components, such as tree stems or branches. ULS data were successfully used to identify individual tree stems [15,16], reaching detection rates from 51% to 87% for trees with diameters over 15 cm and 50 cm, respectively [17], and up to 91% [18] or almost 100% [19,20], depending on the forest stand type and conditions. Studies evaluating the suitability of ULS data for stem diameter estimation from direct measurements in point clouds report that most of the stems can be measured with a root-mean-square error of 4 cm [21] to 6 cm [19] with data acquired using Riegl VUX-SYS. Contrarily, Hyppä et al. [22], utilizing an identical scanning system for data acquisition based on diameter errors, concluded that the above-canopy UAV laser scanning method was insufficient for data collection at the individual tree level; however, under-canopy UAV laser scanning was able to provide data comparable with terrestrial methods [23]. ULS data were also successfully utilized for calculating stand volume [24].
It has been shown that LiDAR 3D data can be utilized to derive structural characteristics at the tree or stand level. Structural characteristics, or metrics, are an effective tool in many applications. Liu [25], in their study, assessed the effectiveness of plot-level metrics (i.e., distributional, canopy volume, and Weibull-fitted metrics) and individual-tree-summarized metrics (i.e., maximum, minimum, and mean height of trees and the number of trees from the individual tree detection (ITD) results) derived from UAV–LiDAR point clouds. Then, these metrics were used to fit estimation models of six forest structural attributes within a Ginkgo plantation in east China using parametric (i.e., partial least squares (PLS)) and non-parametric (i.e., k-Nearest Neighbors (k-NN) and random forest (RF)) approaches. Another important application for tree metrics in LiDAR data is species classification [26], or with the addition of spectral imagery e.g. Pereira Martins-Neto et al. 2023 [27]. Holmgren and Persson [28] tested the classification of Scots pine versus Norway spruce on an individual tree level using features extracted from airborne laser scanning data. Regarding ULS data, Krůček et al. [17] applied a random forest classified on a set of geometric properties derived from individual tree point clouds and, with 85% accuracy, classified trees into broad-leaved and needle-leaved classes.
Nowadays, commonly used deep learning algorithms in forestry studies such as Support Vector Machine (SVM) and RF play an important role in remote sensing data classification. An overview of RF applications in forestry remote sensing data is presented by Belgiu et al. [29]. SVM was described by Vapnik [30], and Mountrakis et al. [31] provide an overview of its usage in remote sensing. The high accuracy of SVM was highlighted by Krajnčíć [32] in terms of vegetation classifications. These two deep learning algorithms were compared by Pal [33], who proved that there are lower user-defined requirements for RF than for SVM.
In this study, we analyze the metrics of point clouds of individual trees that were obtained using the Riegl (RIEGEL Laser Measurement System GmbH, Horn, Austria) VUX-SYS system. The first reference to the use of these systems in the scientific literature is the work of Brede et al. [21], where the authors describe in detail the system components and quality of derived Digital Terrain Models (DTMs), Digital Surface Models (DSMs), and Canopy Height Models (CHMs) from the resulting point clouds, which were compared with models that were based on point clouds of the same areas obtained with the TLS system RIEGL VZ-400 (RIEGEL Laser Measurement System GmbH, Horn, Austria).
In this study, we are looking for point-cloud metrics that are significantly different for broadleaf and coniferous trees using descriptive statistics and the above-mentioned deep learning algorithm RF. We assume that spruce trees have a regular “star” shape of the crown and that the distribution of branches has a regular structure. On the other hand, the crown of a broadleaf is expected to be asymmetric, and the branches are more frequent over the entire trunk. Therefore, we have chosen the Clark–Evans spatial aggregation index (CE), among others, to improve classification results using the metrics derived with descriptive statistics methods. CE has been, till now, used for the evaluation of tree distribution in forest stand but not for point clustering analyses on such data.
2. Materials and Methods
2.1. Study Area
The whole study area included four plots in mature stands with full stocking (stand production area is used 100%) that differed in tree species and growth conditions. However, differences in growth conditions did not substantially influence the crown architecture, which is predominantly controlled by stocking. Age varied from 80 (broadleaf plots) to 100 (coniferous plots). All plots were in flat area with slope up to 5%. Plots A and B consisted of broadleaf tree species (Quercus petraea (Matt.) Liebl.), and plots C and D were coniferous (Picea abies (L.) H. Karst.). Selected plots represent examples of typical production forests with economically most important examples of broadleaf and coniferous tree species. Plot A was located in natural reservation Koda in southern central Czech Republic (49°56′00.1″ N, 14°06′14.7″ E) with area 18,000 m2, and plot B was located near the village Podbořanský Rohozec in western part of the Czech Republic (50°13′9.165″ N, 13°13′28.219″ E) with area 21,000 m2. Both were mature stands with Sessile oak Q. petraea. Plot C and plot D belonged to the Czech University of Life Sciences forest enterprise located near town Jevany in eastern central Czech Republic (49°57′22.9″ N, 14°49′37.8″ E)—plot C had area 16,000 m2, and plot D was located near town Stříbrná Skalice (49°54.81395′ N, 14°52.58753′ E) with area 29,000 m2. Both plots had monoculture mature stand of Norway spruce P. abies. Location of all four plots is indicated in Figure 1. The mean height and its standard deviation were calculated from individual tree point clouds for both classes. Mean height for coniferous class was 39.9 m and standard deviation 3.7, for broadleaf mean height 21.1 m and standard deviation 3.3. In this study, there were a total of 290 broadleaf and 755 coniferous individual trees. ULS data were acquired through August 2020 during low precipitation season.
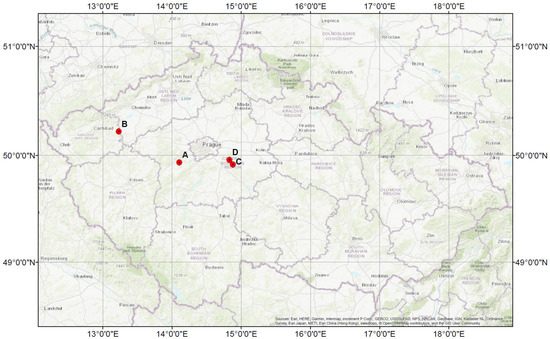
Figure 1.
Location of the study areas in the Czech Republic; plots A and B composed of broadleaf tree species; plots C and D composed of coniferous tree species.
2.2. UAV-Borne LiDAR
For data acquisition, we used UAS VUX-SYS (RIEGL Laser Measurement System GmbH, Horn, Austria), consisting of UAV RiCOPTER and multi-return laser scanner VUX-1UAV.
RiCOPTER is a octocopter UAV with total take of payload 25 kg, of which 6.5 kg includes mounted sensors. The total flight time with full load for data acquisition reaches nearly 28 min. Eight brushless motors on four arms are powered, as is the whole UAV, by four Li-Pol batteries. The UAV is capable of autonomous flight.
VUX-1UAV [34] is a near-infrared multi-return laser scanner with 330° FoV (Field of View), because the scanner is mounted on the bottom side of the UAV; therefore, the FoV is reduced. Maximum pulse repetition rate is 550 MHz with the maximum effective measurement rate up to 500,000 measurements per second (because of 550 kHz and 330° FoV). The scanner can also provide data on return number (up to 11) and reflectance for each point. Electric energy is provided by the RiCOPTER electric system. The laser scanner was remotely controlled by pilot of the UAV. Whole UAS before take-off is presented in Figure 2.
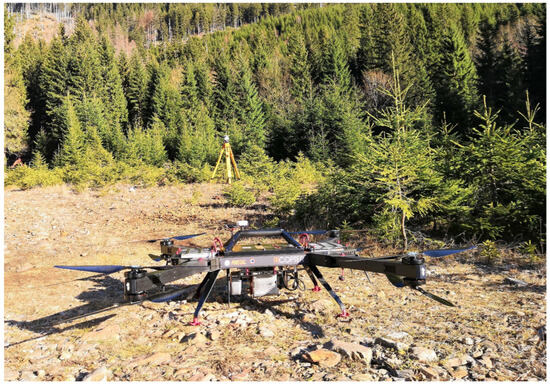
Figure 2.
The RiCOPTER equipped with VUX-SYS before take-off. Behind the UAV, Trimble R2 GNSS receiver is visible.
2.3. LiDAR Data Acquisition
Before the actual flight, Base Station (BS) consisting of Trimble TSC3 Controller and Trimble R2 GNSS receiver (Trimble, Sunnyvale, CA, USA) was established for data acquisition. Periodical static measurement was performed during the whole flight for the later post-processing of trajectory. Before the actual static measurement, the position of the GS was measured using RTK (Real-Time Kinematics) measurement. Data were acquired using VUX-SYS with flight speed 5 m·s−1, altitude 80 m above ground level. The automatic flight used double-grid pattern consisting of two perpendicular parallel lines with 50 m spacing to reach high density of points in the whole point cloud. For every trajectory line, single-laser data were acquired. The laser scanner was remotely controlled by the pilot of the UAV (Figure 2). To attain geometrical accuracy, the stop-and-turn method was used to change direction during the flight of UAV. The point cloud density varied from 1500 to 2700 points m−2 per plot.
2.4. Data Processing
The data processing was divided into several steps considering the software used. The first step was to calculate dense point clouds with high accuracy; the second step was to prepare dataset of all trees in the studied monocultural forest stands. This workflow led to derivation of initial point cloud.
Deriving initial point cloud from each plot was preceded by calculation of trajectory in software PosPAC MMS 8.1 (Applanix: a Trimble company, Richmond Hill, ON, Canada) using the Base Station method adjusting the raw UAV (rower) trajectory data. The precise position of BS was improved with the RTK measurement. After the calculation of the trajectory, the initial dense point cloud was derived in the environment of RiPROCESS (RIEGL Laser Measurement System GmbH, Horn, Austria) software from each single scan. To increase the accuracy of the initial point cloud, we used RiPROCESS software tool RiPRECISSION for better co-registration mainly along the z-axis of individual scanning line data and to improve its congruency. In addition, derived points were classified into several groups (ground, vegetation, and noise) for future data evaluation.
The georeferenced, classified point cloud was imported to environment of the ArcGIS 10.6.1 (ESRI, Redlands, CA, USA) as LAS dataset using ALS dataset tool. The horizontal crown projections were automatically detected with 3D Sample tool from derived CHM (Canopy Height Model). The 3D Sample tool was originally created for ALS datasets for tree detection based on local maxima and Inverse Watershed Segmentation (IWS). The IWS was described on mature forest stand plots from aerial photogrammetry points clouds by Panagiotidis [35]. Polygons (crown projections) were afterward transformed to points in the environment of the ArcGIS 10.6.1 to be used in next step as frame for selecting only the points of one individual tree from the original whole stand point cloud in the environment of R. As a result of this part of data processing, we generated 1045 individual tree point clouds.
The statistical evaluation, generalized linear model (GLM), and RF derivation were performed in the R environment [36]. For each individual point cloud, individual tree metrics (ITMs) were calculated according to descriptive statistics along the normalized tree height: IQR (Inter Quartile Range), VAR (Variance), SD (standard deviation), MOM (Moment), SKEW (Skewness), MEAN, KVAD (Quadratic Mean), CUB (Cubic Mean), MAD (Mean Absolute Deviation), Qi (Quantile, where i was graded by tens of percents for effectivity and representability maximalization) following the common procedure as described in [37,38]. In total, 41 (including CE) metrics were calculated for each individual tree point cloud. GLM was derived using stepwise regression based on Akaike information criterion (AIC) [39]. The free R package randomForest [40] was used for RF derivation, and the same dataset used for the GLM derivation was applied for the training. In the case of RF, R package was used to calculate relative importance for both classes and mean decrease in Gini coefficient as demonstrated in [41], which is a robust method aimed at describing the diversification of each variable. For example, the study of Iban et al. [42] evaluated the results of various methods of RF and other machine learning methods. Both GLM and RF were derived two times: one time including CE and one time excluding CE. Training and verification of derived GLM and RF results were performed on the same dataset.
The whole data processing is described in Figure 3, where key processes regarding different software environments are presented.
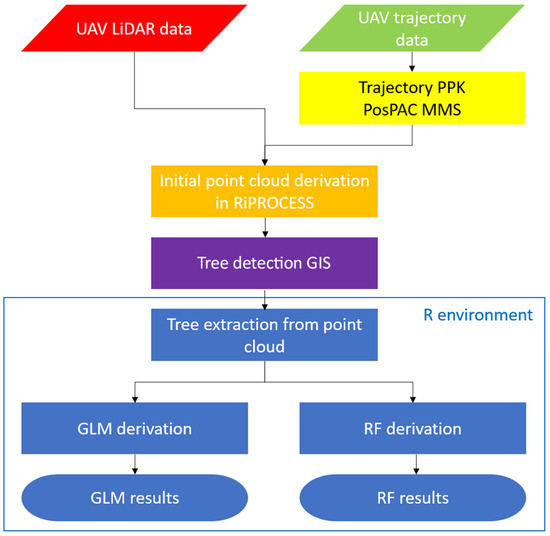
Figure 3.
Flow chart of the whole workflow from data acquisition to final GLM or RF results.
Clark–Evans Spatial Aggregation Index
Clark and Evans’ spatial aggregation index [43] was developed to describe point pattern aggregations using simple words to numerically quantify the degree of clustering of the point cloud. Point processes are compared to Poisson spatial distribution, where values close to 1 are considered to be completely random and values differing from 1 indicate either clustering of the point cloud in the case of the number being lower than 1 or regular in the case of the number being higher than 1. Equation (1) describes the calculation of CE by Fabrika and Pretzsch [44] as relation of observed mean distance to closest neighboring point (upper part of Equation (1)) and expected mean distance with random distribution, where n means number of trees in plot, r is distance to closest point, and A is area of the cross section. The CEi (where i was graded by fives of percents) was also calculated as previously described using individual tree metrics for the cross section (i) representativeness.
3. Results
3.1. Tree Delineation
Individual tree delineation was performed as horizontal crown projection based on the detected local maxima with the limitations as presented by Panagiotidis et al. [35], which include the limits of individual tree point-cloud extraction by crown shape and the possibility of detection of two individual trees instead of one forked one. Figure 4 presents red polygons denoting the delineated ULS point cloud of plot C. In Figure 4, examples of the individual tree point clouds used for deriving individual tree metrics are presented, where each polygon represents one individual tree’s horizontal crown projection.
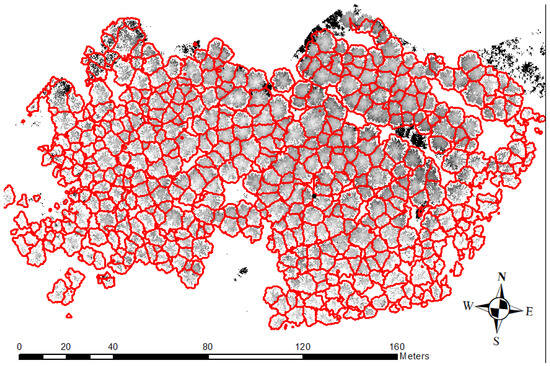
Figure 4.
Demonstration of crowns delineated with the use of IWS in the example of monoculture coniferous plot D populated with Norway spruce (P. abies).
In this study, we used examples of individual tree point cloud representations, as shown in Figure 5. The individual tree point clouds were not modified regarding removing any points except for during the initial point cloud derivation, where we selected only vegetation points and not points classified as ground; however, the ground classification still left a certain number of points on the ground. With an emphasis on an autonomous process, the rest of the ground-lying points were left in individual tree point clouds.
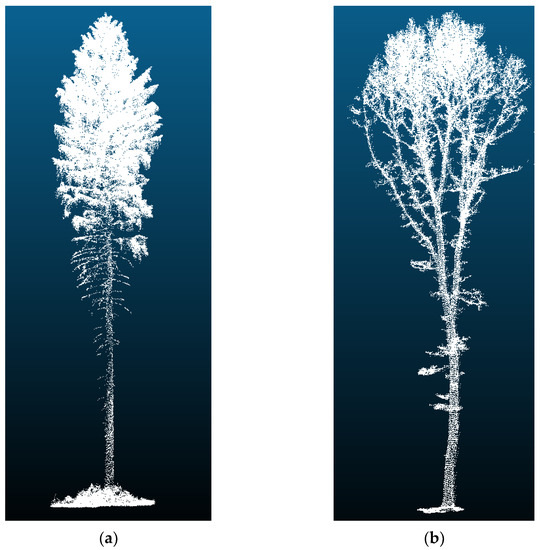
Figure 5.
Examples of individual tree point clouds: (a) presents an example of coniferous individual tree point cloud; (b) presents an example of broadleaf individual tree point cloud. These kinds of point clouds were used for automatic derivation of individual tree metrics.
From the tree habitus (outer look) point of view, Figure 5 shows two examples of trees used in this study, where Figure 5a presents a coniferous tree (Norway spruce) and Figure 5b presents a broadleaf tree (an oak species). There is clear difference in the habitus of these tree species with regard to branching, crown shape, beginning of the crown, etc. These species might display slightly different habitus from the ones shown in the figure when living as solitary trees than when they are living in a denser canopy stand (used for the purposes of this study). However, these differences are not huge, and the intention of this work is to evaluate automatic classification in closed-canopy stands.
3.2. Generalized Linear Model
As a result of this study, we derived the GLM from the ITMs used as predictors. The selected predictors were used to derive the final GLM with CE as described in Table 1 and the GLM without CE as described in Table 2. For each GLM model, we calculated the classification error according to its confusion matrix (Table 3 with CE and Table 4 without CE). Then, we selected the same predictors (VAR, SD, KVAD, CUB, MAD) using the descriptive statistics methods for the derived GLMs with and without CE, the only difference being the presence of SKEW (Table 1). Interestingly, the same quantiles (Q20, Q50, Q60, Q70, and Q95) were selected for both GLMs. For the GLM without CE (Table 2), Q30 and Q90 were additionally selected. In the case of CE with GLM, CE35, CE95, and CE100 were selected.

Table 1.
Derived GLM from all the variables with CE indexes using stepwise regression method showing the most significant predictors.
Table 2.
Derived GLM from all the variables without CE indexes using stepwise regression method showing the most significant predictors.
Table 3.
Confusion matrix of derived GLM from all the variables.
Table 4.
Confusion matrix of derived GLM from all the variables without CE indexes.
Table 3 and Table 4 present the confusion matrixes of the classification errors of the derived GLMs based on the studied dataset. Table 3 presents the classification errors for all variables used for GLM derivation, contrary to Table 4, which presents the classification errors for the GLM without CE. In the presented tables, the positive influence of the CE index on the classification error is clearly visible. By using the CE index, the broadleaf classification error has decreased by 3.8%, and the coniferous classification error has decreased by 1.6%. The highest-reached accuracy for the derived GLM with CE was 94.8%.
Figure 6 shows horizontal projections of point-cloud layers in different heights of the normalized height using an example of one representative tree from each tree class, demonstrating the significant differences derived with the CE indexes and an example of significant Qn metrics. For coniferous trees, the trunk part of the chosen point cloud located around the center appears on nearly all the visible metrics. There are clearly recognizable lines of branches in a radial direction surrounded by smaller branches and needles. This phenomenon is not evident in the upper parts of the tree (in metrics from 90% to 95% and 95% to 100%). Contrary to coniferous trees, the broadleaf tree example in Figure 6 presents a clustering of points around the branches growing phototropically and not radially like the branches of coniferous trees. Figure 7 presents selected cross sections representing significant CE layers along the tree profile. The first cross section was selected at 35% and the other two were selected on top of the tree at 95 and 100% of its normalized height.
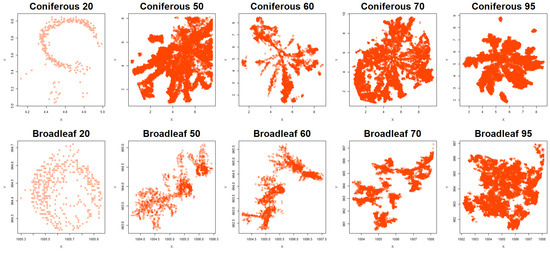
Figure 6.
Comparison of horizontal projections of point layers of coniferous (upper row) and broadleaf (bottom row) trees according to the metrics used in the derived GLM. This figure serves as an example of two chosen trees (one for each group), and for each tree, horizontal projections of layers with significantly different values of point metrics between tree classes are plotted. The example trees are presented in Figure 5.
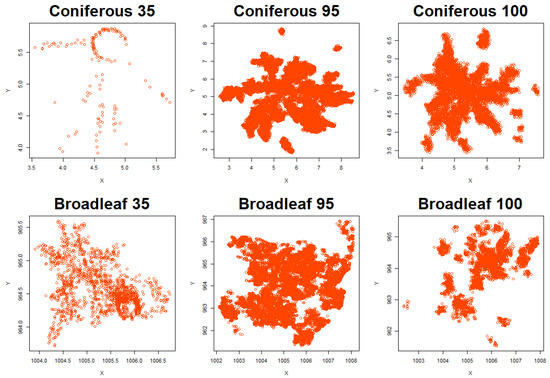
Figure 7.
Comparison of horizontal projections of point layers of coniferous (upper row) and broadleaf (bottom row) trees according to the selected CE metrics used in the derived GLM. The example trees are presented in Figure 5.
Figure 8 describes the selected descriptive statistics predictors (VAR, SKEW, CUB, SD, KVAD, and MAD); interestingly, SKEW was selected only for the GLM with CE. Only the significant descriptive statistic predictors presented in Figure 1 and Figure 2 are provided in Figure 8, which displays the differences in the selected predictors for both classes.
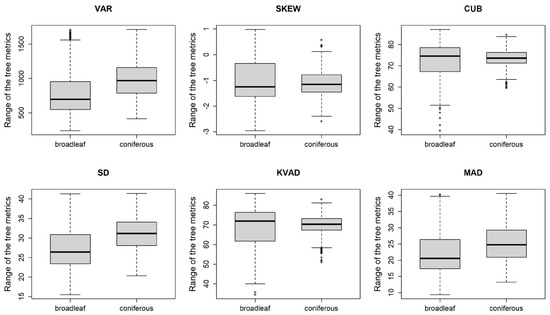
Figure 8.
Boxplots of significant metrics using derived GLM, where skewness was included only in derived GLM containing CE values. For each metric, there are two boxplots: left for broadleaf trees and right for coniferous trees.
3.3. Random Forest
RF classification showed an error estimation rate based on the R toolbox which again classified two classes. Table 5 shows that the broadleaf classification error was 10.3% and that for coniferous was 2.8%. Table 6 shows the results of classification using all metrics except for the CE index: the broadleaf classification error was 11.7.%, and that for coniferous was 4%. For the best results for RF classification, 500 iterations of decision trees were created. The highest accuracy attained for RF classification including CE was 95.1%.
Table 5.
Confusion matrix of derived RF from all the variables.
Table 6.
Confusion matrix of derived RF from all the variables without CE indexes.
As is presented in Figure 9, the important predictors are SKEW, MEAN, KVAD, CUB, Q40, Q50, CE95, and CE100 with high relative importance for both classes (broadleaf and coniferous). Each bar in Figure 9 is divided into four parts (starting from the bottom): relative importance for broadleaf, relative importance for coniferous, mean decrease in accuracy, and mean decrease in Gini coefficient. In general, the relative importance of the CE indexes for the determination of coniferous trees is lower than the relative importance for broadleaf trees. The mean decrease in the Gini coefficient, which describes the contribution of each metric to the homogeneity of the RF results [41], is visible in the left part of Figure 9, particularly for the SKEW, MEAN, KVAD, CUB, Q40, and Q50 metrics. Figure 10 presents the importance of the variables when CE is excluded. Q10, Q40, Q50, and Q95 contributed significantly to tree class classification, as did SKEW, MEAN, and KVAD of the selected descriptive statistic metrics.
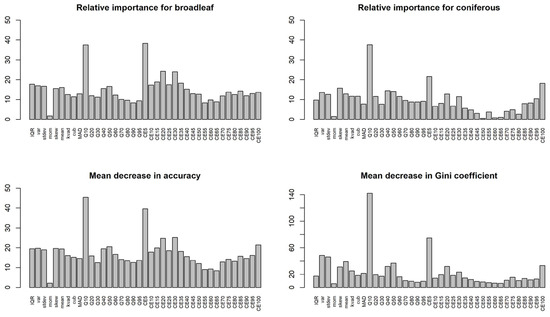
Figure 9.
Graph of importance of variables from which RF was derived including CE index; relative importance for broadleaf, relative importance for coniferous, mean decrease in accuracy, mean decrease in Gini coefficient.
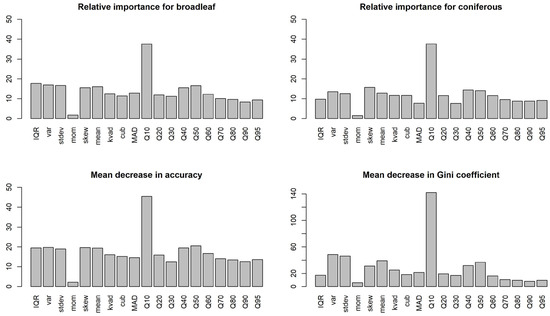
Figure 10.
Graph of importance of variables from which RF was derived without CE index; relative importance for broadleaf, relative importance for coniferous, mean decrease in accuracy, mean decrease in Gini coefficient.
4. Discussion
The benefits of using the VUX-SYS were highlighted by Brede and Wiesser [20,21] with regard to the derivation of individual tree representative 3D point clouds along the whole stem profile, where they emphasized the possibility of canopy penetration and data representativeness mainly in top canopy parts. Both authors agree that ULS has the advantage of providing a relatively high canopy point density contrary to the TLS method. As this study shows, the significant predictors used for classification were located mostly in the upper part of the stem profile.
The differences between coniferous and broadleaf trees based on the differences in CHM with regard to seasonal canopy changes were described by Reitberger [45]; however, this approach is also sensitive to deciduous coniferous trees because these tree species show similar canopy mean-height changes from the points belonging to the canopy as those of broadleaf tree species. Nevertheless, generating time series for canopy changes is a time-demanding method.
Tree canopy shape was also considered in this study. There were two main assumptions regarding the differences in the canopy. The first considers the bottom part, e.g., the beginning of the crown part along the stem profile, contrary to the second assumption regarding the top of the tree crown, where it was expected that the difference in shape [46] could be explained according to the different numbers of points in the current percentile. The positive impact of the height normalization process for tree shape description was mentioned by Brandtberg [47]. Regarding the treetop, the broadleaf trees were expected to have a smooth and round treetop contrary to coniferous trees with a sharper treetop. Both assumptions were confirmed with the derived GLM.
Leaf-on and leaf-off conditions were also compared by Reitberger, Liang, and Kim [45,48,49], and because of the leaf-on conditions during the data acquisition for this study, the results may have been negatively influenced.
The accuracy of the RF was clearly influenced by the different study areas as mentioned by Vetrivel [50]. In comparison to the accuracy of Pal [33] (around 88%), in this study, we observed slightly higher accuracy (95%) but with five times (500) more RF decision trees, and we included the CE index. The study of Shen [51] used a combination of airborne hyperspectral and LiDAR data for the classification of 18 tree species based on individual tree metrics, again reaching a similar accuracy but with a combination of two RS methods. A slightly lower accuracy (76%) was achieved by Pereira Martins-Neto et al. [27] for eight tree species in tropical forests by UAV hyperspectral data and LiDAR metrics. Still, such forests' structural composition is more complex than European temperate or boreal forests. As Belgiu [29] mentions, there have been numerous variable investigations aimed at prediction power; however, nowadays, the aim is per-pixel classifications. Nevertheless, RF is less sensitive to the training data [29] than other machine learning algorithms, and this was the main reason for using it in this study.
RF classification based on geometric 3D shape and intensity was also used in conditions in the Czech Republic by Krzystek et al. [52], who used ALS LiDAR data on a large scale-area for single tree detection and, afterward, dead tree detection. The LiDAR data were fused with multispectral data, and the overall accuracy reached over 90%. High accuracy in tree species classification from multitemporal Sentinel-2 data was attained by Immitzer et al. [53], who highlighted multitemporal data for this data type.
Another classification method that should be used is SVM [30] with regard to the recent trends in RS [31,32], where it is used for classifying two classes. However, the use of SVM and other deep learning algorithms for this kind of data classification needs more development.
5. Conclusions
The ULS data provided by the sensor VUX-1UAV provide a huge opportunity for spatial analysis on the individual tree level. Regarding automatic processes and considering the limitations of manual work, successful individual tree delineation played an important role in the whole data processing process. Both GLM and RF showed promising results (94.8% accuracy for derived GLM and 95.1% for RF) in tree species group classification, where the importance of the CE index was also proven. The derived GLM was mainly built on the CE index, and the RF testing showed the CE index’s impact in terms of describing the differences between broadleaf and coniferous trees.
Author Contributions
Conceptualization, M.S. and P.S.; methodology, M.S. and P.S.; software, M.S.; validation, M.S. and K.K.; formal analysis, M.S.; investigation, M.S.; resources, P.S. and R.M.; data curation, M.S. and K.K.; writing—original draft preparation, M.S., K.K. and R.M.; writing—review and editing, R.M., K.K. and M.S.; visualization, M.S.; supervision, P.S.; project administration, P.S.; funding acquisition, P.S. and R.M. All authors have read and agreed to the published version of the manuscript.
Funding
This research was funded by “OP RDE, grant number CZ.02.1.01/0.0/0.0/16_019/0000803 (Advanced Research Supporting the Forestry and Wood-processing Sector’s Adaptation to Global Change and the 4th Industrial Revolution)”, EXTEMIT—K, no. CZ.02.1.01/0.0/0.0/15_003/0000433, and by “Ministry of Agriculture of the Czech Republic, grant number QK21010435”.
Data Availability Statement
Data are available on a request.
Conflicts of Interest
The authors declare no conflict of interest. The founders have no role in the design of the study; in the collection, analyses, or interpretation of data; in the writing of the manuscript; or on the decision to publish results.
References
- Patacca, M.; Lindner, M.; Lucas-Borja, M.E.; Cordonnier, T.; Fidej, G.; Gardiner, B.; Hauf, Y.; Jasinevičius, G.; Labonne, S.; Linkevičius, E.; et al. Significant increase in natural disturbance impacts on European forests since 1950. Glob. Chang. Biol. 2023, 29, 1359–1376. [Google Scholar] [CrossRef] [PubMed]
- Hlásny, T.; Zimová, S.; Merganičová, K.; Štěpánek, P.; Modlinger, R.; Turčáni, M. Devastating outbreak of bark beetles in the Czech Republic: Drivers, impacts, and management implications. For. Ecol. Manag. 2021, 490, 119075. [Google Scholar] [CrossRef]
- Næsset, E.; Gobakken, T. Estimation of Above- and below-Ground Biomass across Regions of the Boreal Forest Zone Using Airborne Laser. Remote Sens. Environ. 2008, 112, 3079–3090. [Google Scholar] [CrossRef]
- Lefsky, M.; Harding, D.; Blair, J.; Parker, G. Laser altimeter canopy height profiles: Methods and validation for closed-canopy, broadleaf forests. Remote Sens. Environ. 2001, 76, 283–297. [Google Scholar]
- Wang, Y.; Lehtomäki, M.; Liang, X.; Pyörälä, J.; Kukko, A.; Jaakkola, A.; Liu, J.; Feng, Z.; Chen, R.; Hyyppä, J. Is Field-Measured Tree Height as Reliable as Believed—A Comparison Study of Tree Height Estimates from Field Measurement, Airborne Laser Scanning and Terrestrial Laser Scanning in a Boreal Forest. ISPRS J. Photogramm. Remote Sens. 2019, 147, 132–145. [Google Scholar] [CrossRef]
- Panagiotidis, D.; Abdollahnejad, A.; Slavík, M. Assessment of Stem Volume on Plots Using Terrestrial Laser Scanner: A Precision Forestry Application. Sensors 2021, 21, 301. [Google Scholar] [CrossRef]
- Terryn, L.; Calders, K.; Disney, M.; Origo, N.; Malhi, Y.; Newnham, G.; Raumonen, P.; kerblom, M.Å.; Verbeeck, H. Tree Species Classification Using Structural Features Derived from Terrestrial Laser Scanning. ISPRS J. Photogramm. Remote Sens. 2020, 168, 170–181. [Google Scholar] [CrossRef]
- Calders, K.; Adams, J.; Armston, J.; Bartholomeus, H.; Bauwens, S.; Bentley, L.P.; Chave, J.; Danson, F.M.; Demol, M.; Disney, M.; et al. Terrestrial Laser Scanning in Forest Ecology: Expanding the Horizon. Remote Sens. Environ. 2020, 251, 112102. [Google Scholar] [CrossRef]
- Gollob, C.; Ritter, T.; Nothdurft, A. Forest Inventory with Long Range and High-Speed Personal Laser Scanning (PLS) and Simultaneous Localization and Mapping (SLAM) Technology. Remote Sens. 2020, 12, 1509. [Google Scholar] [CrossRef]
- Jaakkola, A.; Hyyppä, J.; Kukko, A.; Yu, X.; Kaartinen, H.; Lehtomäki, M.; Lin, Y. A low-cost multi-sensoral mobile mapping system and its feasibility for tree measurements. ISPRS J. Photogramm. Remote Sens. 2010, 65, 514–522. [Google Scholar] [CrossRef]
- Wallace, L.; Lucieer, A.; Watson, C.; Turner, D. Development of a UAV-LiDAR system with application to forest inventory. Remote Sens. 2012, 4, 1519–1543. [Google Scholar] [CrossRef]
- Ayrey, E.; Fraver, S.; Kershaw, J.A.; Kenefic, L.S.; Hayes, D.; Weiskittel, A.R.; Roth, B.E. Layer Stacking: A Novel Algorithm for Individual Forest Tree Segmentation from LiDAR Point Clouds. Can. J. Remote Sens. 2017, 43, 16–27. [Google Scholar] [CrossRef]
- Vauhkonen, J.; Korpela, I.; Maltamo, M.; Tokola, T. Imputation of Single-Tree Attributes Using Airborne Laser Scanning-Based Height, Intensity, and Alpha Shape Metrics. Remote Sens. Environ. 2010, 114, 1263–1276. [Google Scholar] [CrossRef]
- Aubry-Kientz, M.; Dutrieux, R.; Ferraz, A.; Saatchi, S.; Hamraz, H.; Williams, J.; Coomes, D.; Piboule, A.; Vincent, G. A Comparative Assessment of the Performance of Individual Tree Crowns Delineation Algorithms from ALS Data in Tropical Forests. Remote Sens. 2019, 11, 1086. [Google Scholar] [CrossRef]
- Kellner, J.R.; Armston, J.; Birrer, M.; Cushman, K.C.; Duncanson, L.; Eck, C.; Falleger, C.; Imbach, B.; Král, K.; Krůček, M.; et al. New Opportunities for Forest Remote Sensing Through Ultra-High-Density Drone Lidar. Surv. Geophys. 2019, 40, 959–977. [Google Scholar] [CrossRef]
- Yan, W.; Guan, H.; Cao, L.; Yu, Y.; Li, C.; Lu, J.Y. A Self-Adaptive Mean Shift Tree-Segmentation Method Using UAV LiDAR Data. Remote Sens. 2020, 12, 515. [Google Scholar] [CrossRef]
- Krůček, M.; Král, K.; Cushman, K.C.; Missarov, A.; Kellner, J.R. Supervised Segmentation of Ultra-High-Density Drone Lidar for Large-Area Mapping of Individual Trees. Remote Sens. 2020, 12, 3260. [Google Scholar] [CrossRef]
- Bruggisser, M.; Hollaus, M.; Otepka, J.; Pfeifer, N. Influence of ULS Acquisition Characteristics on Tree Stem Parameter Estimation. ISPRS J. Photogramm. Remote Sens. 2020, 168, 28–40. [Google Scholar] [CrossRef]
- Kuželka, K.; Slavík, M.; Surový, P. Very High Density Point Clouds from UAV Laser Scanning for Automatic Tree Stem Detection and Direct Diameter Measurement. Remote Sens. 2020, 12, 1236. [Google Scholar] [CrossRef]
- Wieser, M.; Mandlburger, G.; Hollaus, M.; Otepka, J.; Glira, P.; Pfeifer, N. A case study of UAS borne laser scanning for measurement of tree stem diameter. Remote Sens. 2017, 9, 1154. [Google Scholar] [CrossRef]
- Brede, B.; Lau, A.; Bartholomeus, H.M.; Kooistra, L. Comparing RIEGL RiCOPTER UAV LiDAR Derived Canopy Height and DBH with Terrestrial LiDAR. Sensors 2017, 17, 2371. [Google Scholar] [CrossRef]
- Hyyppä, E.; Yu, X.; Kaartinen, H.; Hakala, T.; Kukko, A.; Vastaranta, M.; Hyyppä, J. Comparison of Backpack, Handheld, under-Canopy UAV, and above-Canopy UAV Laser Scanning for Field Reference Data Collection in Boreal Forests. Remote Sens. 2020, 12, 3327. [Google Scholar] [CrossRef]
- Hyyppä, E.; Hyyppä, J.; Hakala, T.; Kukko, A.; Wulder, M.A.; White, J.C.; Pyörälä, J.; Yu, X.; Wang, Y.; Virtanen, J.P.; et al. Under-Canopy UAV Laser Scanning for Accurate Forest Field Measurements. ISPRS J. Photogramm. Remote Sens. 2020, 164, 41–60. [Google Scholar] [CrossRef]
- Puliti, S.; Breidenbach, J.; Astrup, R. Estimation of Forest Growing Stock Volume with UAV Laser Scanning Data: Can It Be Done without Field Data? Remote Sens. 2020, 12, 1245. [Google Scholar] [CrossRef]
- Liu, K.; Shen, X.; Cao, L.; Wang, G.; Cao, F. Estimating forest structural attributes using UAV-LiDAR data in Ginkgo plantations. ISPRS J. Photogramm. Remote Sens. 2018, 146, 465–482. [Google Scholar] [CrossRef]
- Michałowska, M.; Rapí, J.; Cao, L.; Fernández-Manso, A. A Review of Tree Species Classification Based on Airborne LiDAR Data and Applied Classifiers. Remote Sens. 2021, 13, 353. [Google Scholar] [CrossRef]
- Pereira Martins-Neto, R.; Garcia Tommaselli, A.M.; Imai, N.N.; Honkavaara, E.; Miltiadou, M.; Saito Moriya, E.A.; David, H.C. Tree Species Classification in a Complex Brazilian Tropical Forest Using Hyperspectral and LiDAR Data. Forests 2023, 14, 945. [Google Scholar] [CrossRef]
- Holmgren, J.; Persson, Å. Identifying Species of Individual Trees Using Airborne Laser Scanner. Remote Sens. Enviton. 2004, 90, 415–423. [Google Scholar] [CrossRef]
- Belgiu, M.; Drăgu, L. Random forest in remote sensing: A review of applications and future directions. ISPRS J. Photogramm. Remote Sens. 2016, 114, 24–31. [Google Scholar] [CrossRef]
- Vapnik, V. The support vector method of function estimation. In Nonlinear Modeling; Springer: Berlin/Heidelberg, Germany, 1998; pp. 55–85. [Google Scholar]
- Mountrakis, G.; Im, J.; Ogole, C. Support vector machines in remote sensing: A review. ISPRS J. Photogramm. Remote Sens. 2011, 66, 247–259. [Google Scholar] [CrossRef]
- Kranjčić, N.; Medak, D.; Župan, R.; Rezo, M. Support Vector Machine accuracy assessment for extracting green urban areas in towns. Remote Sens. 2019, 11, 655. [Google Scholar] [CrossRef]
- Pal, M. Random forest classifier for remote sensing classification. Int. J. Remote Sens. 2005, 26, 217–222. [Google Scholar] [CrossRef]
- RIEGL Data Sheet, RIEGL VUX-1UAV. 2019. Available online: http://www.riegl.com/products/unmanned-scanning/riegl-vux-1uav22/ (accessed on 20 July 2023).
- Panagiotidis, D.; Abdollahnejad, A.; Surový, P.; Chiteculo, V. Determining tree height and crown diameter from high-resolution UAV imagery. Int. J. Remote Sens. 2017, 38, 2392–2410. [Google Scholar] [CrossRef]
- Team, R.C. An introduction to dplR. Ind. Commer Train. 2019, 10, 11–18. [Google Scholar] [CrossRef]
- Næsset, E.; Gobakken, T. Estimating forest growth using canopy metrics derived from airborne laser scanner data. Remote Sens. Environ. 2005, 96, 453–465. [Google Scholar] [CrossRef]
- Kamińska, A.; Lisiewicz, M.; Stereńczak, K.; Kraszewski, B.; Sadkowski, R. Species-related single dead tree detection using multi-temporal ALS data and CIR imagery. Remote Sens. Environ. 2018, 219, 31–43. [Google Scholar] [CrossRef]
- Pekár, S.; Brabec, M. Modern Analysis of Biological Data: Generalized Linear Models in R; Masarykova Univerzita: Brno, Czechia, 2016; ISBN 8021081066. [Google Scholar]
- Breiman, L.; Cutler, A.; Liaw, A.; Wiener, M. Package ‘RandomForest’. 2018, p. 29. Available online: https://cran.r-hub.io/web/packages/randomForest/index.html (accessed on 20 July 2023).
- Han, H.; Guo, X.; Yu, H. Variable selection using Mean Decrease Accuracy and Mean Decrease Gini based on Random Forest. In Proceedings of the 2016 7th IEEE International Conference on Software Engineering and Service Science (ICSESS), Beijing, China, 26–28 August 2016; pp. 219–224. [Google Scholar]
- Iban, M.C.; Sekertekin, A. Machine learning based wildfire susceptibility mapping using remotely sensed fire data and GIS: A case study of Adana and Mersin provinces, Turkey. Ecol. Inform. 2022, 69, 101647. [Google Scholar] [CrossRef]
- Clark, P.J.; Evans, F.C. Distance to Nearest Neighbor as a Measure of Spatial Relationships in Populations. Ecology 1954, 35, 445–453. [Google Scholar] [CrossRef]
- Fabrika, M.; Pretsch, H. Analysis and Modelling of Forest Ecosystems; Technical University in Zvolen: Zvolen, Slovakia, 2011; pp. 1–599. [Google Scholar]
- Reitberger, J.; Krzystek, P.; Stilla, U. Analysis of full waveform LIDAR data for the classification of deciduous and coniferous trees. Int. J. Remote Sens. 2008, 29, 1407–1431. [Google Scholar] [CrossRef]
- Ørka, H.O.; Næsset, E.; Bollandsås, O.M. Classifying species of individual trees by intensity and structure features derived from airborne laser scanner data. Remote Sens. Environ. 2009, 113, 1163–1174. [Google Scholar] [CrossRef]
- Brandtberg, T. Classifying individual tree species under leaf-off and leaf-on conditions using airborne lidar. ISPRS J. Photogramm. Remote Sens. 2007, 61, 325–340. [Google Scholar] [CrossRef]
- Liang, X.; Matikainen, L. Deciduous-Coniferous Tree Classification Using Difference Between First and Last Pulse Laser Signatures. IAPRS 2007, 36, 253–257. [Google Scholar]
- Kim, S.; McGaughey, R.J.; Andersen, H.E.; Schreuder, G. Tree species differentiation using intensity data derived from leaf-on and leaf-off airborne laser scanner data. Remote Sens. Environ. 2009, 113, 1575–1586. [Google Scholar] [CrossRef]
- Vetrivel, A.; Gerke, M.; Kerle, N.; Vosselman, G. Identification of damage in buildings based on gaps in 3D point clouds from very high resolution oblique airborne images. ISPRS J. Photogramm. Remote Sens. 2015, 105, 61–78. [Google Scholar] [CrossRef]
- Shen, X.; Cao, L. Tree-species classification in subtropical forests using airborne hyperspectral and LiDAR data. Remote Sens. 2017, 9, 1180. [Google Scholar] [CrossRef]
- Krzystek, P.; Serebryanyk, A.; Schnörr, C.; Červenka, J.; Heurich, M. Large-scale mapping of tree species and dead trees in Sumava National Park and Bavarian Forest National Park using lidar and multispectral imagery. Remote Sens. 2020, 12, 661. [Google Scholar] [CrossRef]
- Immitzer, M.; Neuwirth, M.; Böck, S.; Brenner, H.; Vuolo, F.; Atzberger, C. Optimal input features for tree species classification in Central Europe based on multi-temporal Sentinel-2 data. Remote Sens. 2019, 11, 2599. [Google Scholar] [CrossRef]


Disclaimer/Publisher’s Note: The statements, opinions and data contained in all publications are solely those of the individual author(s) and contributor(s) and not of MDPI and/or the editor(s). MDPI and/or the editor(s) disclaim responsibility for any injury to people or property resulting from any ideas, methods, instructions or products referred to in the content. |
© 2023 by the authors. Licensee MDPI, Basel, Switzerland. This article is an open access article distributed under the terms and conditions of the Creative Commons Attribution (CC BY) license (https://creativecommons.org/licenses/by/4.0/).