Article

Assessing Water Relations and Carbon Dynamics of Pinus taeda Branches Undergoing Shade-Induced Mortality

by
Adelodun R. Majekobaje
* and
Thomas J. Dean
School of Renewable Natural Resources, Louisiana State University Agricultural Center, Baton Rouge, LA 70803, USA
*
Author to whom correspondence should be addressed.
Forests 2023, 14(9), 1704; https://doi.org/10.3390/f14091704
Submission received: 4 August 2023 / Revised: 18 August 2023 / Accepted: 23 August 2023 / Published: 24 August 2023

Abstract

:
Light acts as a complex signal, influencing various plant physiological, phenological and morphogenetic traits. Although previous studies have explored the effects of varying light levels on branch growth and survival, the underlying mechanisms of branch mortality under shade conditions remain poorly understood, hindering our understanding of canopy dynamics. In this study, contrasting shade conditions were imposed on Pinus taeda branches, and the changes in their water relations and carbon dynamics were evaluated. Monthly measurements of the photosynthetic light–response curve (LRC), sap flow and water potential of the branches were conducted. Furthermore, the conditions that led to the deaths of lower branches were investigated, and principal component analysis (PCA) was used to classify branches according to their mortality status. Significant shade treatment effects were observed for all photosynthetic parameters. The assimilation at light saturation (Amax), dark respiration rate (Rd), apparent quantum yield (AQY), light compensation point (LCP) and light saturation point (LSP) all decreased from full light to deepest shade, whereas the opposite was the case for the convexity term (θ). All water relations traits also decreased from full light to deepest shade; however, although significant shade effect was observed in stomatal conductance (gs) and sap flow, the differences in the pre-dawn (Ψpre-dawn) and mid-day (Ψmid-day) water potentials among treatments were not statistically significant. The PCA classification results showed that it could be used as a reliable method to screen for branch mortality as early as four months before mortality becomes evident. Our results shed more light on branch physiology and mortality under shade and have the potential to help improve the prediction of tree crown size, ultimately improving process-based forest growth models.

1. Introduction

Light plays an important role in influencing crown growth and development [1]. In forests, patterns of tree growth are largely determined by light acquisition. Some trees invest in height growth to extend above others and access sunlight, whereas others expand their crown or leaf area to intercept more light. In addition to being the sole source of energy for growth, light is also a complicated signal that influences plant growth, physiology, phenology and morphogenetic traits. Several studies have focused on the effects of varying irradiance levels on the growth and survival of branches [2,3]. Takenaka [4] investigated branch behavior under contrasting light conditions in saplings of Litsea acuminata and observed a higher growth rate and lower mortality in sun-grown branches than in shaded branches. Hennessey et al. [5] also found increased growth in sun-exposed branches of Pinus taeda than in branches grown under shade.
The dynamics of carbon fixation and carbon dioxide (CO2) release provide the substrate for tree growth [6]. This equilibrium between photosynthesis and respiration within a tree is greatly influenced by the availability of light. In a natural stand, the heterogeneity of light exists within the crown due to shading by neighboring individuals or upper branches within the crown [7,8]. In Pinus taeda, like other conifers with excurrent growth, upper branches shade lower branches. As a result, there is a regular pattern of branches from the top of the crown to the base, each being increasingly shaded. Branches growing under optimal conditions within a crown exhibit a higher allocation of resources [9,10]. For instance, it was demonstrated that the allocation of nitrogen in various species was higher in branches growing under the best light conditions, hence leading to increased photosynthesis [11]. Through a process known as correlative inhibition, the growth and survival rates of shaded branches within a crown whose other branches are exposed to light is reduced relative to shaded branches when the entire crown is shaded [4]. In a study on Acer diabolicum saplings, Sugiura and Tateno [2] observed that the growth rates of the branches were significantly higher when only half of the branches were exposed to light compared to the conditions when all branches were exposed to light, when all branches were exposed to shade, and when half of the branches were exposed to shade.
Slow growth in shade-intolerant species is associated with a higher risk of mortality [12,13]. The mechanisms of tree mortality have been explained by hydraulic failure and carbon starvation hypotheses. The hydraulic failure hypothesis postulates that trees die when the evaporative demand in the atmosphere is significantly greater than the uptake by roots, creating high xylem water tension and increasing the risk of embolism formation and conductivity loss of the xylem [14,15]. On the other hand, mortality due to carbon starvation results from avoidance of hydraulic failure through stomatal closure, causing photosynthetic uptake to reduce, thereby resulting in carbon starvation as more storage is used up for the maintenance of metabolism and defense [16]. Besides water, light is another important resource for tree growth and survival [17]. Changes in the physiology of trees have been observed when they were exposed to different light environments [18,19]. When two trees of the same species are grown in different light conditions, shade-grown trees tend to have lower maximum photosynthetic (Pmax) and dark respiration (Rd) rates than sun-grown trees [20,21,22]. Branches are believed to respond this way as well. Warrington et al. [23] found out that the Pmax of Pinus radiata reduced significantly with decreasing light intensity. Perry et al. [24] observed that the Pmax in Leucenea leucocephala grown under different light regimes decreased consistently from the highest light level to the lowest light level. Working on some hardwood species, Tsel’niker and Tsel’niker [25] observed that the Pmax of Betula pendula and Populus tremula declined as the light intensity decreased. Teskey and Shrestha [26] also found that net photosynthesis was higher under high light intensity in all the species they studied (including P. taeda) than in low light levels. Past studies have also highlighted the role of light environments on the water relations of branches. Schmitz et al. [27] reported reduced hydraulic conductivity in the shaded branches of several mangrove species. Branches that developed under shade conditions were found to be more vulnerable to embolism in Fagus sylvatica [28]. In shoots of Betula pendula, Sellin et al. [29] found that shade leaves had substantially lower leaf hydraulic conductivity compared to the sun leaves at all irradiance levels studied.
The mechanisms of branch mortality under shade conditions remain poorly understood, hindering our ability to predict a tree’s height to crown base (HCB), to understand how different stressors affect canopy dynamics and to understand why some species are able to retain more branches than others. Crown length, which is often used as a surrogate for leaf area in forest growth and yield models [30,31,32], is estimated from a tree’s HBC or crown ratio and total tree height. The measurement of HCB is a time-consuming process; as a result, several studies have concentrated on the development of predictive models that employ readily available stand variables to estimate the HCB of trees [33]. Most of these models are based on static measurements using the total height, diameter at breast height, stand basal area, crown competition factor and dominant height or site index as predictor variables [34]; however, changes in HCB are dynamic. In order to predict HCB more accurately, we need to understand the conditions that set the base of the live crown. Therefore, our objectives in this study are (1) to evaluate the dynamic changes in the photosynthesis and water relations of loblolly pine branches under an imposed range of shade conditions; (2) to assess the suitability of various photosynthetic and hydraulic parameters in screening for branch mortality; and (3) to identify threshold values of photosynthetic and water relations traits that suggest imminent branch mortality.

2. Materials and Methods

2.1. Study Site

This study was conducted at the Louisiana State University AgCenter’s Dean Lee Memorial Forest, located in Washington Parish, in southeastern Louisiana. This forest lies at a latitude of 32.8° N and a longitude of 90.0° W. The average daily minimum and maximum temperatures at this site are 12.03 °C and 25.56 °C, with annual mean precipitation of 1600 mm [35]. The dominant soil type in this forest is the Ruston series, which is classified as a well-drained, fine loamy, siliceous and thermic typic Paleudult.

2.2. Study Methods and Design

This site has a north-to-south fertility gradient. Site quality is lower on the northern side, which increases southward. Blocks were established to account for this variation in fertility and to separate the effects of site quality from the treatment effects under study. Two plots positioned on the southern and northern sides of the site were used in this study. In January 2015, Pinus taeda seedlings were planted at 3 m × 3 m in field plots measuring 27 m × 27 m. Within each plot, nine trees of similar height and exhibiting desirable characteristics, such as good form, vigor and being free of insect damage and disease, were selected for this study. These trees were located at the plot edges, which were exposed to an open field. Branch whorls were numbered starting from the top, and target branches were chosen from the fifth whorl of each tree. In January 2022, prior to spring bud burst, three treatments, namely 30% shade, 60% shade and the control (0% shade), were applied to each plot, with each treatment being replicated three times (Table 1). Shade treatments were achieved by using Agfabric shade cloths (30% and 60%), which were supported by shade structures constructed from concrete remesh and reinforcing bars (Figure 1).
This study employed a randomized complete block design with two blocks and three replications of each shade level within a block. A total of 18 branches were initially measured in August and September. However, due to mortality, the number of measured branches decreased to 17 in October and 13 in November. Consequently, a total of 66 measurements were conducted throughout the duration of the study.

2.3. Photosynthetic Light–Response Curve Measurements

Light–response curve (LRC) measurements were conducted on a monthly basis from August to November 2022 using a portable photosynthesis system (LI-6400xt, Li-Cor, Inc., Lincoln, NE, USA). The system was fitted with a 6 cm3 cuvette, and a blue-red LED light source was used. The measurements were carried out on sunny days between 09:30 and 13:30 Central Daylight Time (CDT) using the default light–response program of the system. The light–response program uses light intensities of 1500, 1200, 1000, 800, 600, 400, 200, 100, 80, 60, 40, 20 and 0 μmol m−2 s−1. Additionally, a light intensity of 2000 μmol m−2 s−1 was manually set and included in the measurements. The leaf chamber’s block temperature was adjusted throughout the measurement to match ambient temperature, the CO2 concentration was maintained at 405 µmol mol−1, and the air flow rate was set to 300 µmol/s.
Three branches per treatment per plot were selected for the LRC measurements. The measurements were made on two fully expanded fascicles from the first flush on each selected branch. The needle fascicles did not completely fill the cuvette; hence, the number of needles per fascicle and the diameter of the needles were recorded after each measurement in order to adjust the data for leaf area [36]. Stomatal conductance was measured at all light levels by the system, but only those at light saturation point were used in this study.

2.4. Storage Carbohydrate Analysis

In December 2022, segments of approximately 14 cm long were excised from each branch. These segments were placed in a plastic bag, were immediately transferred to an ice chest containing ice and were transported to the laboratory. The segments were transferred to paper bags and freeze-dried at −18 °C for 96 h. Once completely dried, the samples were finely ground to pass through a 1 mm2 sieve using a mill grinder. The ground samples were then sent to a commercial lab for nonstructural carbohydrate and starch quantification.

2.5. Sap Flow Measurement

Sap flow measurements were conducted in situ using the heat balance method with the Flow 32-1K system, along with SGB 16-WS and SGB 19-WS sap flow sensors (Dynamax, Houston, TX, USA). Every two weeks between August and November, two to three representative branches from each treatment (the same branches used in the gas exchange measurements) were selected for the installation of sap flow sensors (maximum of eight). Before sensor installation, the branch surface was carefully smoothed, and dead bark was removed using sandpaper. The branch diameter was measured in two perpendicular directions, and the average was calculated to estimate the branch’s sap flow area. To prevent the sensor from sticking to the branch, the branch area was sprayed with release oil. The sensor was then placed at the base of the branch and encased in aluminum bubble foil to protect it from solar radiation. Additionally, a clear packing tape was used to secure the aluminum foil above the sensor to protect it from rainwater and prevent radiation from affecting the readings.
Once the sensors were installed, the system was powered by a 12-volt marine battery and connected to a solar panel to ensure continuous power supply. The system was connected to a CR1000 data logger (Campbell Scientific, Inc., Logan, UT, USA). The Dynagage Flow 32-1K program was used to heat the sensor and record thermocouple temperatures. Temperature data were collected at intervals of 2 s and were subsequently averaged every hour. These averaged data were stored in the data logger. Using the collected temperature data, branch areas and specific parameters for each sensor type, the program calculated the hourly flow rate in grams of water per hour. This calculated flow rate data was then stored in the data logger for further analysis. The hourly flow rates were then integrated for each day to obtain the cumulative grams of water transpired per day.

2.6. Water Potential Measurement

Leaf water potential measurements were carried out in August and October using a pressure chamber (PMS Instruments Co., Corvallis, OR, USA). Pre-dawn measurements started at 04:30 h CDT and ended before sunrise. Mid-day measurements were conducted between 12:30 h and 13:30 h CDT. On each branch, one fully expanded fascicle from the first flush was detached, put in a Ziplock containing a moist paper towel to prevent dehydration and kept on ice. All measurements were conducted within two hours of fascicle detachment.

2.7. Statistical Analysis

A linear mixed-model analysis implemented in SAS ver 9.4 (SAS Institute, Inc., Cary, NC, USA) was used to compare photosynthetic and water relations parameters between treatments. The model included the shade and block as fixed effects and the branch as a random effect, repeated according to the month. A generalized linear model (Proc GLM) was used to compare carbohydrates between treatments. Treatment effects at α = 0.05 were considered significant. Significant effects were then separated using Tukey’s test.
In R-studio (version 2023.03.1), individual light–response curves were fitted with a nonrectangular hyperbola equation with least-squares regression, following the method outlined by Marshall and Biscoe (1980). Six photosynthetic parameters were estimated from each fitted curve.
Principal component analysis (PCA) was performed on all branches using a total of 10 parameters, consisting of 4 water relations and 6 photosynthetic traits. PCA is a widely used statistical technique that simplifies complex, high-dimensional data while retaining trends and patterns. It achieves this by transforming the data into a lower-dimensional space represented by principal components (PCs). The results obtained from the PCA were presented in biplots, which visually illustrate the distribution of the parameters along the first two principal components. Based on the PCA results, scatter plots of the first two principal components’ scores of each branch were used to predict branch mortality by examining how branches clustered together. These scatter plots enabled the identification of patterns or associations that may help determine the likelihood of branch mortality based on their spatial arrangement and proximity to each other within the plot. Finally, the threshold values of photosynthetic and water relations parameters that indicate impending branch mortality were presented using boxplots.

3. Results

3.1. Effect of Shade on Parameters of Photosynthetic Light–Response Curve

From each fitted LRC, key physiological parameters, including the assimilation at light saturation (Amax), dark respiration rate (Rd), apparent quantum yield (AQY), convexity term (θ), light compensation point (LCP) and light saturation point (LSP), were estimated. The statistical analysis revealed significant differences in all light–response parameters among the treatments (p ≤ 0.05, Table 2). Notably, all parameters, except for θ, exhibited a decreasing trend with increasing shade levels. The mean values were found to be the lowest under the deepest shade (60 percent shade), followed by 30 percent shade, and they were the highest under full light conditions (0 percent shade). Furthermore, consistently significant differences were observed between the deepest shade and full light for all parameters. In the deepest shade treatment, significant reductions were observed in the following parameters compared to the full light treatment: Amax decreased by 39.8, Rd decreased by 50.0%, AQY decreased by 38.9%, LCP decreased by 28.1%, and LSP decreased by 35.1%. Conversely, θ showed a significant increase of 81.7% from the full light treatment to the deepest shade treatment.

3.2. Effect of Shade on Storage Carbohydrate

The shade treatment had a significant impact on the amount of nonstructural carbohydrate (NSC) stored in the branch wood (p = 0.0282) in December 2022 (Figure 2). An inverse relationship was observed between the shade level and NSC, with branches under the deepest shade showing a 41.4% lower NSC compared to branches under full light. The NSC content in branches under the 30 percent shade treatment did not significantly differ from those under the deepest shade and full light. The amount of starch in storage did not show a significant treatment effect (p = 0.1221). Moreover, there was no clear pattern observed in the percentage of starch content, with the highest value observed in the 30 percent shade treatment. This value was reduced by 38.02% and 79.09% in branches under full light and the deepest shade, respectively.

3.3. Effect of Shade on Water Relations

Significant variations were evident in stomatal conductance (gs) and sap flow among the different treatments (Table 3). Similar to other light–response parameters, a consistent decrease in gs and sap flow was observed with increasing shade levels. Significance differences were observed between the deepest shade and full light for both gs and sap flow, whereas no significant difference was found between the 30 percent shade and deepest shade treatments. However, pre-dawn water potential (Ψpre-dawn) and mid-day water potential (Ψmid-day) were not affected significantly by the treatments (Table 3); they showed a decreasing trend with increasing shade levels. Among the treatments, full light had the highest Ψpre-dawn and Ψmid-day, followed by 30 percent shade, and the deepest shade had the lowest value.

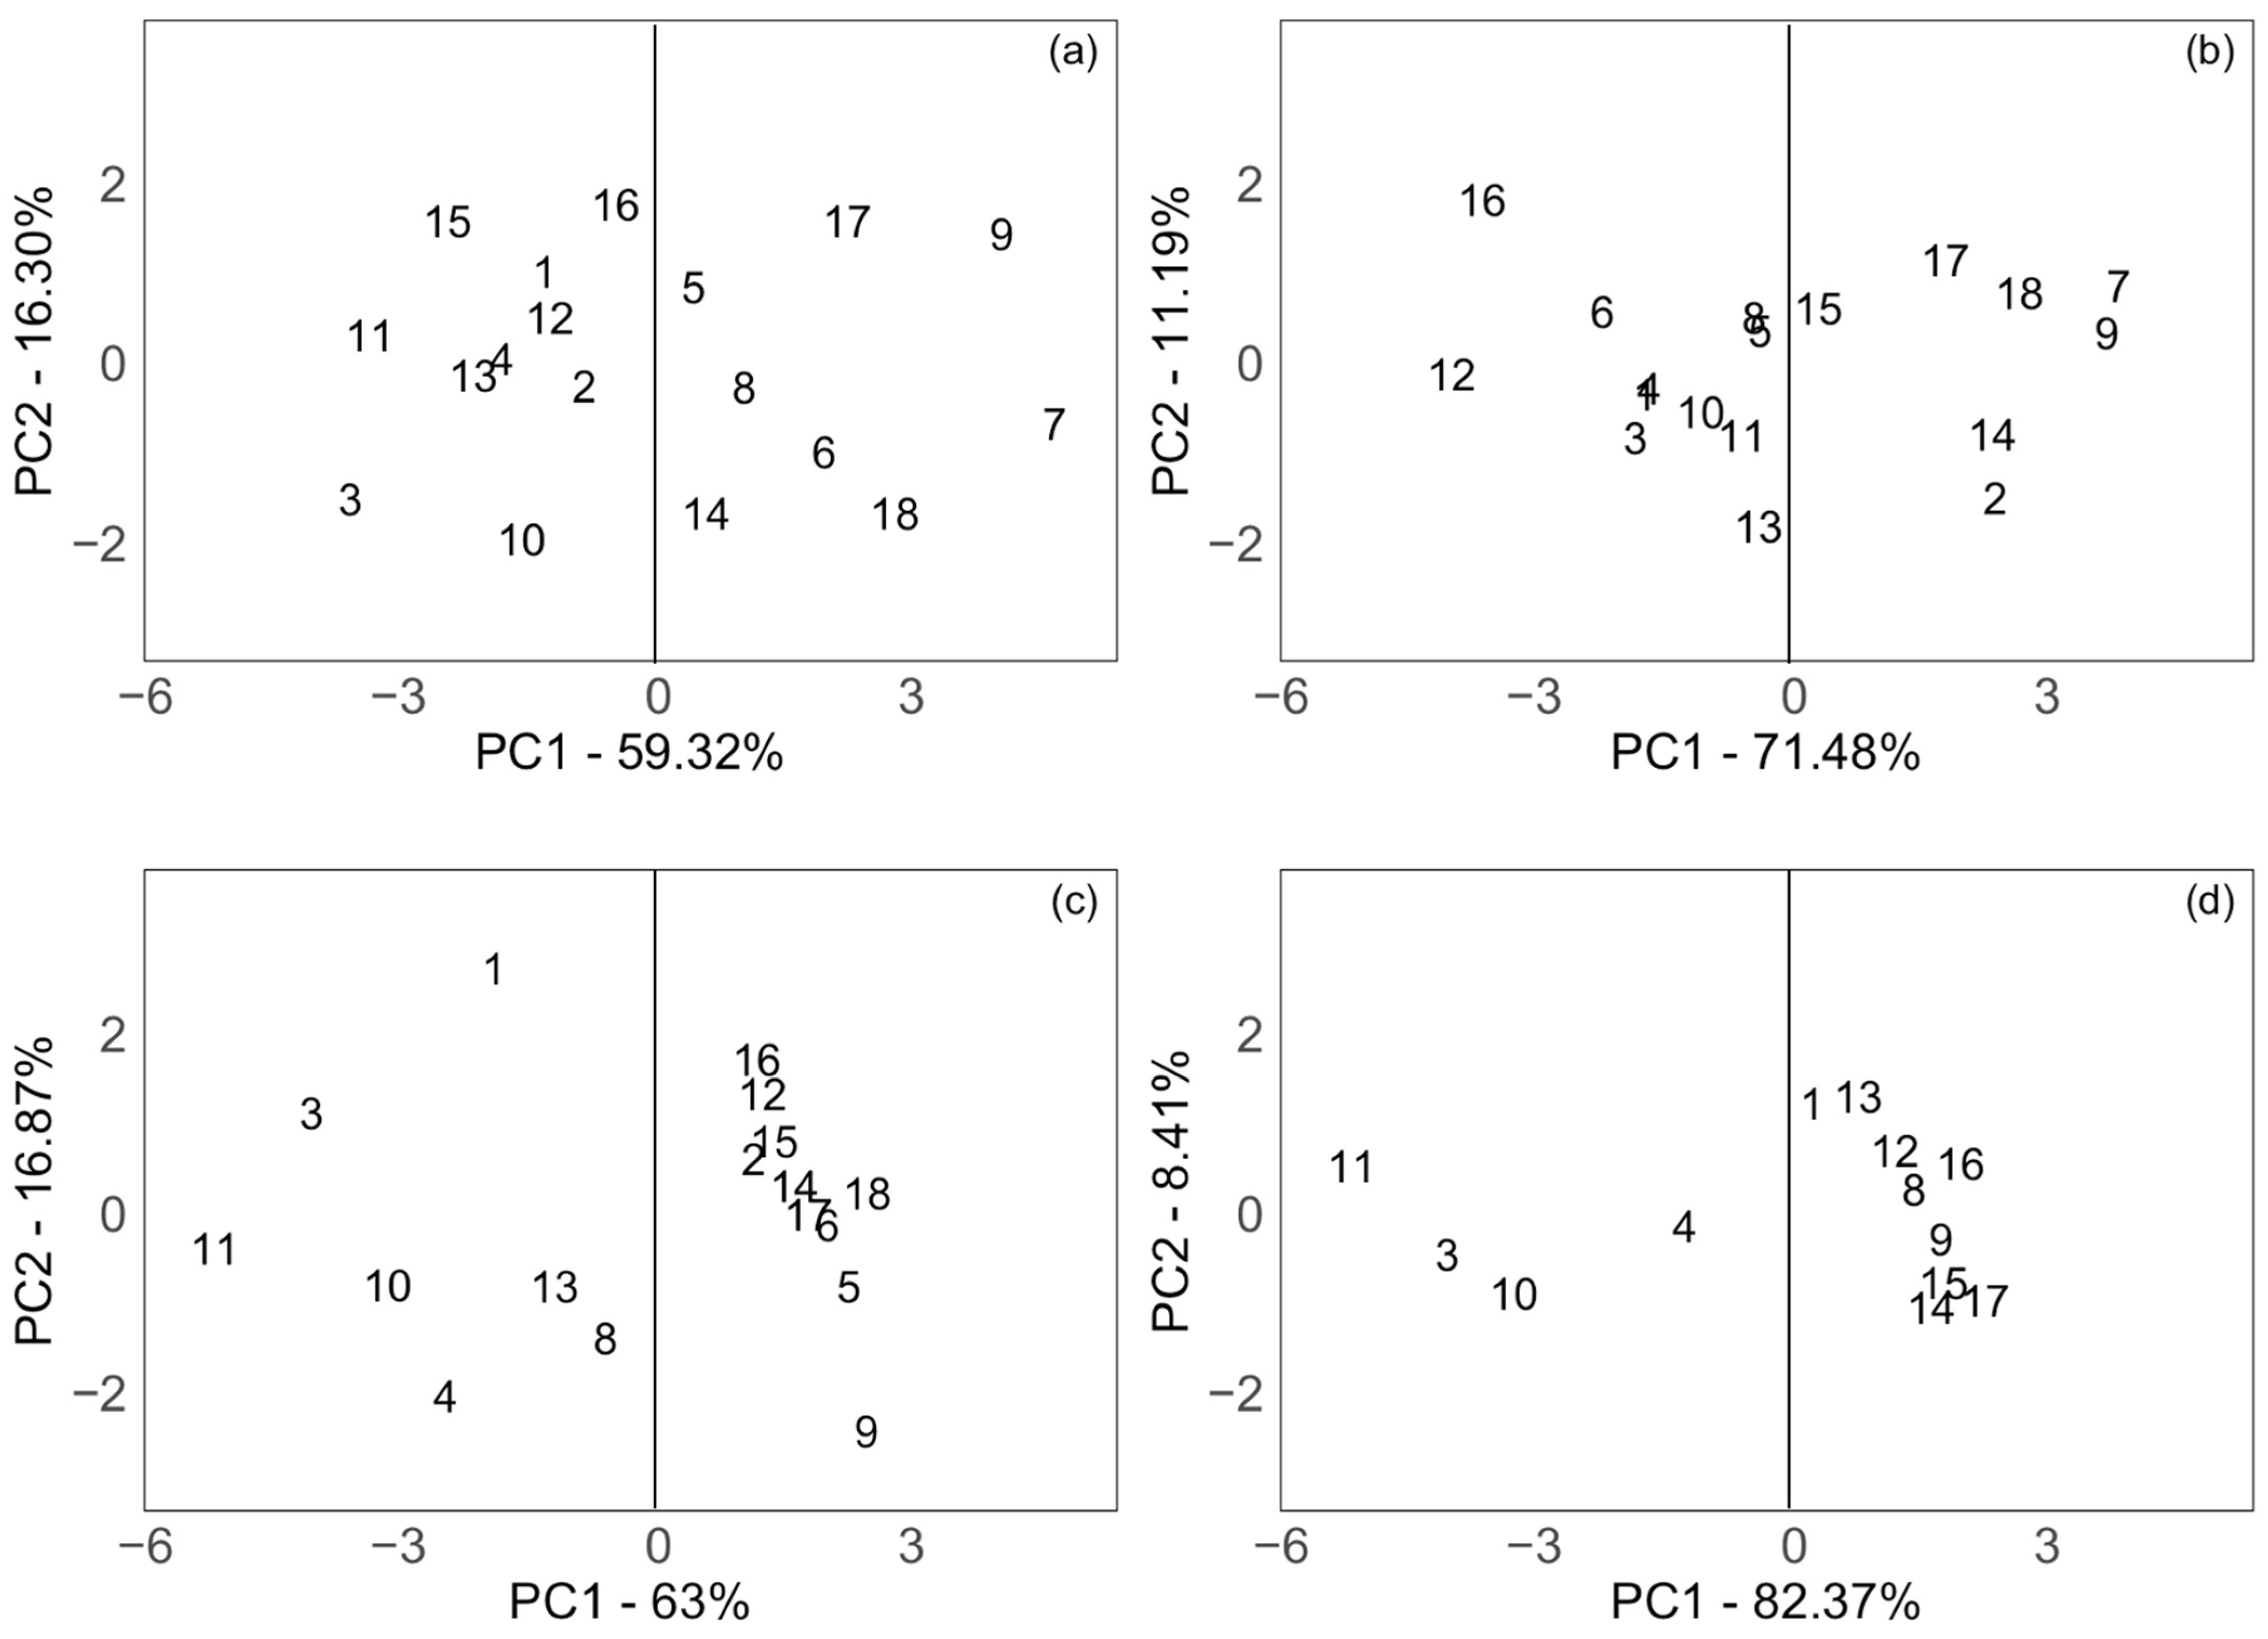
3.4. Principal Component Analysis of Branch Mortality

Principal component analysis (PCA) was conducted to determine the principal components of photosynthetic and water relations parameters that best characterized shade-induced mortality in branches. This analysis aimed to classify branches based on their mortality status. PCA was performed on a monthly basis from August to November 2022. The orthogonal transformation was applied, ensuring that PC1 accounted for the largest variance, averaging 69.04% across months, whereas PC2 accounted for an average of 13.19% of the total variation. In September and November, the combined contribution of PC1 and PC2 explained 82.67% and 90.78% of the variation, respectively, and 75.62% and 79.87% of the variation in August and October, respectively. It is important to note that Ψpre-dawn and Ψmid-day were not measured in September and November. Consequently, these parameters were excluded from the analysis during those two months.
Figure 3a–d present the biplot analysis results, illustrating the correlations between the parameters and the principal components for each month. Negative correlations were observed among the parameters except for θ, in all months. Consequently, branches with higher PC1 scores tended to exhibit lower values for all parameters, except for θ. Consistently, PCA demonstrated higher PC1 eigenvector values for photosynthetic parameters and lower values for water relations parameters. Based on this observation, a biplot of PC1 and PC2 was utilized to classify branches according to their mortality status (Figure 4a–d). Considering that PC1 accounted for a substantial portion of the total variation, ranging from 59.32% to 82.37%, branches with positive PC1 values, indicating lower values for all measured parameters except θ, were classified as experiencing mortality, whereas those with negative values were classified as surviving.
At the end of the 2022 growing season, a total of 11 branches survived, and mortality was evident in 7 branches. The classification results obtained from the PCA were compared with the actual branch status, and the accuracy of the classifications is presented in Table 4. In the month of August, the status of 15 out of 18 branches was accurately classified, and in September, 14 out of 18 branches were correctly classified. Due to the death of a branch in October, it could not be measured, resulting in a sample size of 17 branches, of which 14 were accurately classified. In November, measurements were obtained for 13 branches, with 6 of them being correctly classified. The results revealed that the PCA-based classification could predict mortality as early as four months before it became evident. However, in November, a lower accuracy was observed. This could be attributed to the reduced sample size. However, more importantly, this could also be attributed to the study concluding a month later, and many branches wrongly classified as undergoing mortality would likely have died if the study had continued for a longer period.

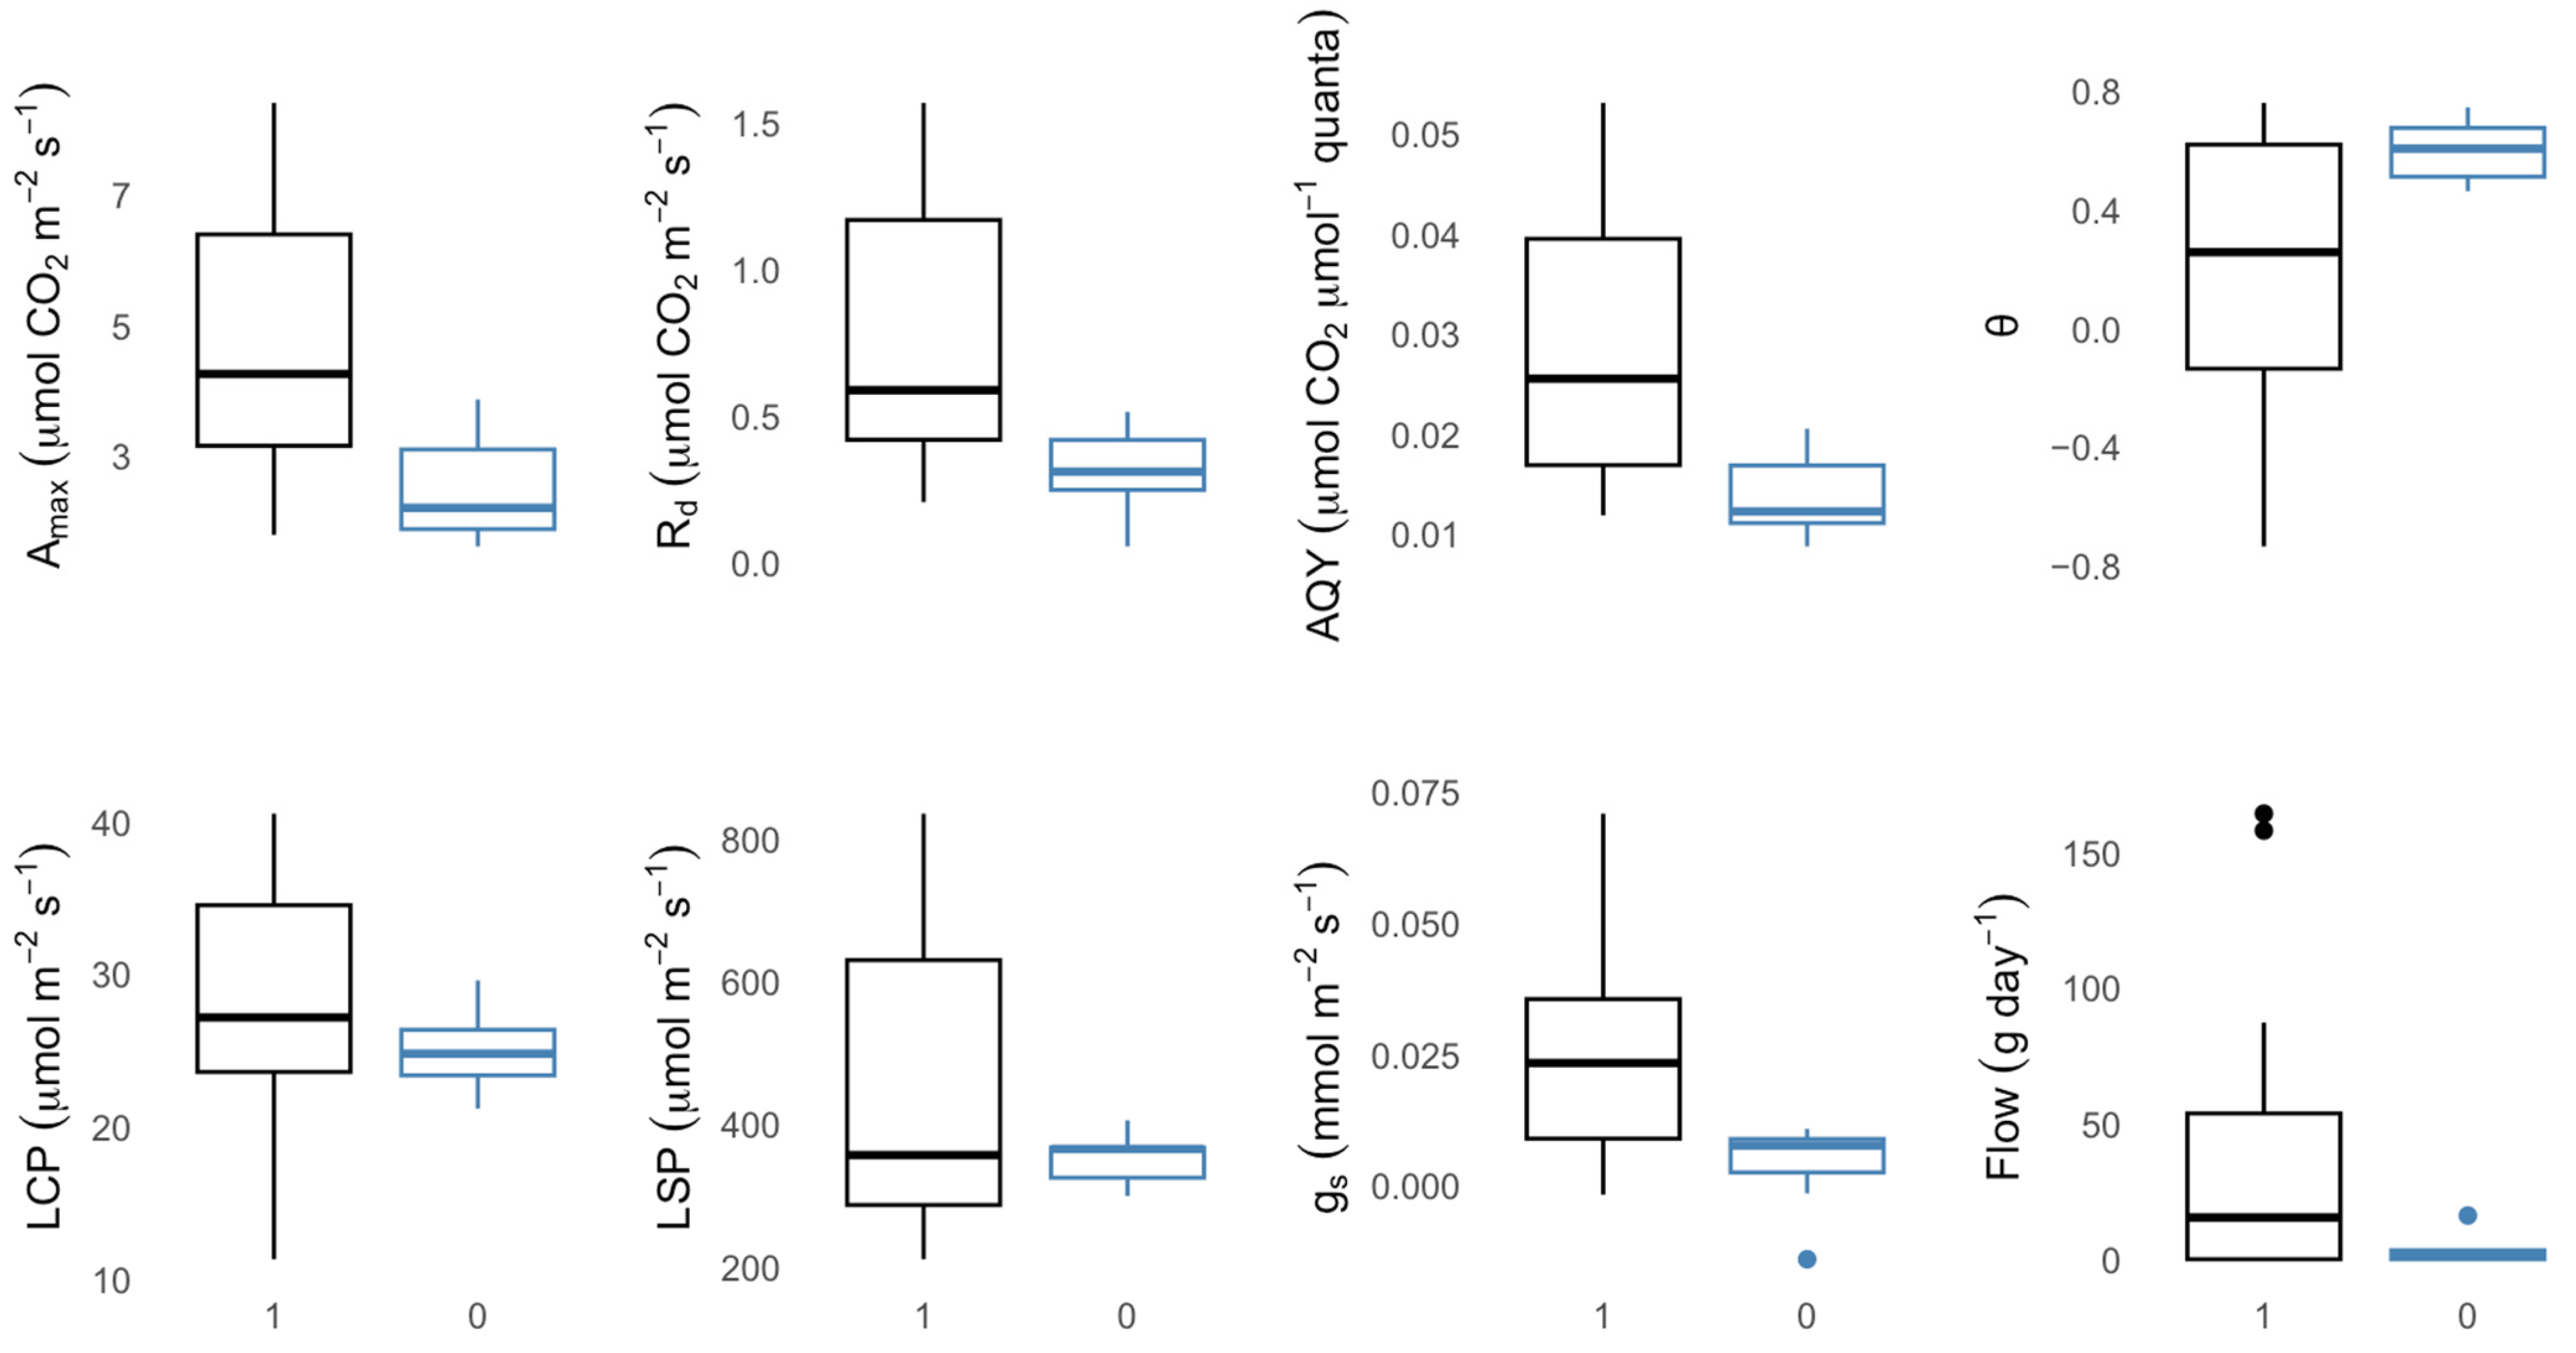
3.5. Comparative Analysis of Photosynthetic and Water Relations Traits between Dying and Surviving Branches

Figure 5 presents the analysis of the physiological characteristics of dead branches, which were measured in the month preceding their mortality, and of surviving branches, which were taken in the final month of measurement (November 2022). This analysis reveals the threshold values of photosynthetic and water relations parameters, which indicate when a branch is expected to die.
Significant differences (p ≤ 0.05) were observed between the surviving and dying branches for all parameters except for LCP and LSP. Before mortality became visibly obvious, the mean values of Amax, Rd, AQY, LCP, LSP, gs and sap flow for the dying branches were 2.5202 μmol CO2 m−2 s−1, 0.0139 μmol CO2 m−2 s−1, 0.3167 μmol CO2 μmol −1 quanta, 25.0009 μmol m−2 s−1, 349.8654 μmol m−2 s−1, 0.0039 mmol m−2 s−1 and 3.5125 g/day, respectively. Compared to the surviving branches, these values represented a substantial decrease of 45.08%, 50.61%, 58.18%, 11.14%, 22.99%, 83.71% and 91.68%, respectively. Conversely, the mean θ value for the dying branches was 0.5987, representing a considerable increase of 70.92% compared to the surviving branches.

4. Discussion

4.1. Effect of Shade on Parameters of Photosynthetic Light–Response Curve

Light–response curves describe the relationship between the rate of photosynthesis and light intensity. They provide valuable insight into key photosynthetic parameters, such as Amax, Rd, AQY, θ, LCP and LSP [37]. Light–response curves have gained widespread application in quantifying photosynthetic acclimation to changing environmental conditions [38]. In this study, a statistical analysis revealed significant differences in all light–response parameters among the different shade treatments, indicating that shade levels have a substantial impact on the photosynthetic responses of branches. Consistent with previous research on light responses [23,26,38,39,40], a decreasing trend was observed in most parameters as shade levels increased. This trend suggests that shade resulted in lower activity of ribulose bisphosphate carboxylase/oxygenase (Rubisco) [41], a key enzyme in carbon fixation, and altered stomatal density and distribution, leading to reductions in gas exchange efficiency [42]. The observed higher photosynthetic capacity in branches exposed to full light conditions compared to shade branches may also be attributed to the greater allocation of resources, such as nitrogen, to needles in sunlit positions [43] or potential changes in chloroplast organization or needle morphology [44,45]. Sun-grown needles have been found to have a higher leaf mass area and thicker palisade and mesophyll layers, which enhance photosynthetic activities [46]. Interestingly, the convexity term (θ) of the LRC exhibited an opposing trend, showing a significant increase from full light conditions to the deepest shade treatment. This result aligns with previous studies linking acclimation to light environments with higher convexities of photosynthetic LRC in shade-adapted branches compared to sun branches [47,48]. The convexity term indicates how efficiently the branch foliage’s photosynthesis responds to changes in light availability. This adjustment allows them to maximize photosynthetic efficiency and utilize as much light as possible, despite the low light levels in their environment.

4.2. Effect of Shade on Storage Carbohydrate

Carbon balance is a crucial aspect of plant performance, and the stress-induced depletion of NSC has been proposed as a potential mechanism underlying tree mortality [49]. In our study, the depletion of stored NSC was observed under shade, indicating that branches were utilizing reserves in response to reduced photosynthetic activities. Our findings are consistent with previous research. For example, Maguire and Kobe [50] reported a decrease in the total NSC reserves in seedlings of various species under shade. This suggests that the reduction in light intensity prompted branches to utilize stored carbohydrates to support vital functions. Interestingly, in our study, starch appeared to be less sensitive to changes in light availability compared to NSC, which contradicts previous studies conducted across different species [51,52,53]. This may be because starch in all branches, regardless of the treatment, was being converted to soluble carbohydrates for maintenance respiration when photosynthesis slowed down, as the quantification of storage carbohydrates was conducted in December. Starch reserves play a crucial role as an immediate energy source that can act as a buffer during times when environmental conditions are not optimal for photosynthesis [54,55].

4.3. Effect of Shade on Water Relations

Stomatal conductance (gs) plays a fundamental role in the regulation of gas exchange and water loss in branches. Its sensitivity to various environmental factors, including light, has been extensively studied [56]. In this study, an increased shade level was associated with a decrease in gs (Table 3), corresponding with a subsequent reduction in branch photosynthetic properties. This decrease in gs under low light conditions has been reported for whole trees [57]. Branches exposed to full light exhibited high transpiration rates, evident from sap flow measurements, which are a direct consequence of keeping stomata open under high light conditions. Previous research by Sellin and Kupper [58], which focused on the effects of light intensity on leaf hydraulic properties in Betula pendula, revealed that water flow from soil to shade foliage encountered greater resistance compared to flow to sun foliage. The observed reduction in gs and sap flow under the deepest shade treatment in this study does not necessarily indicate a higher degree of water stress. Instead, it may be attributed to the decreased capacity to fix CO2 by the branch under shaded conditions [59]. Past studies have reported decreased Rubisco and leaf nitrogen content, resulting in reduced CO2 fixation under shade conditions [60]. The reduction in gs could also be due to a higher ratio of intercellular CO2 concentration (Ci) to ambient CO2 concentration (Ca). Under low light conditions, plant respiration leads to a rapid rise in Ci, whereas the presence of light decreases Ci [61]. Transpiration and water potential are interconnected processes in plants, in which changes in one can influence the other. Stomata conservatively regulate plant water status by controlling the rate of water loss to the atmosphere, such that it matches the capacity of the soil–plant hydraulic system to supply water to needles. Ψpre-dawn is a reliable indicator of plant water status, as it reflects water availability in the root zone, and it provides valuable information about soil water content. On the other hand, Ψmid-day helps identify the maximum water stress, vulnerability to cavitation and potential mortality. Both Ψpre-dawn and Ψmid-day showed a decreasing trend as transpiration reduced due to increasing shade levels. However, the difference was not statistically significant.

4.4. Principal Component Analysis of Branch Mortality

The negative correlations observed among the parameters, except for θ, in all months, indicated that branches with higher PC1 scores tended to exhibit lower values for all parameters, except for θ. Remarkably, the LRC parameters consistently displayed higher eigenvectors compared to the water relations parameters, suggesting that branch mortality is more influenced by photosynthetic traits than the measured water relations parameters. Thus, branches that sustained growth and prevented carbon depletion by maintaining photosynthetic activity had a better chance of survival. These findings underscore the significance of carbon dynamics in branch survival or mortality [16]. Under shade conditions, branches close their stomata to strike a balance between CO2 uptake for photosynthesis and water loss through transpiration. This adaptive response helps in water and energy conservation while optimizing resource utilization. However, prolonged stomatal closure can lead to reduced photosynthesis [62]. Lower photosynthetic rates prompt NSC consumption for maintenance respiration, and if light limitations persist or become severe, plants may ultimately die [63].

4.5. Comparative Analysis of Photosynthetic and Water Relations Traits between Dying and Surviving Branches

This analysis identified the threshold values of photosynthetic and water relations parameters that indicate impending branch mortality. There was a significant decline in both photosynthetic and sap flow rates observed between the surviving and dead branches. Prior to the visible signs of mortality, Amax in the dead branches decreased by 45.1%, Rd exhibited a reduction of 58.2%, gs decreased by 83.9%, and sap flow decreased by 91.7%. In a study examining mortality in Pinus edulis trees under shade, Sevanto et al. [64] reported that photosynthesis and respiration rates reached zero at the point of death. Additionally, they observed permanent stomatal closure and zero transpiration rates in this species before mortality occurred. Notably, our study’s results exhibit slight differences from their findings, possibly due to the timing of measurements. Unlike Sevanto et al. [64], who conducted measurements at the point of death, our study measured physiological changes one month before mortality became evident.

5. Conclusions

This study provides valuable evidence of the physiological changes occurring in branches prior to mortality and offers insight into the mechanisms underlying shade-induced branch mortality. The results provide a means to identify the primary mechanism driving mortality. They emphasize the dominance of carbon dynamics and efficient resource utilization as mechanisms of branch survival or mortality. Dead branches exhibited significantly lower photosynthetic rates and carbon reserves and only a slight change in water potential.
Moreover, this study suggests that PCA could serve as a reliable method for screening branches and predicting their mortality status. The stronger correlation observed between PC1 and the photosynthetic parameters further highlights the dominance of carbon starvation over cavitation as the primary cause of shade-induced mortality.
By providing valuable insight into the physiological responses of branches to shade conditions and the mechanisms of branch mortality in trees, this research has the potential to improve predictions of tree crown size, growth and biomass allocation. These improvements can enhance process-based forest growth models, ultimately supporting better forest management practices.

Author Contributions

Conceptualization, A.R.M. and T.J.D.; methodology, A.R.M. and T.J.D.; formal analysis, A.R.M. and T.J.D.; investigation, A.R.M.; data curation, A.R.M.; writing—original draft preparation, A.R.M.; writing—review and editing, A.R.M. and T.J.D.; supervision, T.J.D. All authors have read and agreed to the published version of the manuscript.

Funding

The Lucius W. Gilbert Foundation funded A.R. Majekobaje’s dissertation research and stipend, and McIntire–Stennis funds under LAB94307 supported T.J. Dean’s and Lee Forest’s personnel work on the project.

Institutional Review Board Statement

Not applicable.

Informed Consent Statement

Not applicable.

Data Availability Statement

The data presented in this study are available upon request from the LSU Agricultural Center.

Acknowledgments

We thank Brett Wolfe for his valuable research input and generous support in lending us his equipment for this study. We give special thanks to Joseph Nehlig and Frank Ueltschi for their help during data collection at Lee Memorial Forest. This study was published with the approval of the Director of the Louisiana Agricultural Experiment Station as publication No. 2023-241-38994.

Conflicts of Interest

The authors declare no conflict of interest.

References

  1. Gratzer, G.; Darabant, A.; Chhetri, P.B.; Rai, P.B.; Eckmüllner, O. Interspecific Variation in the Response of Growth, Crown Morphology, and Survivorship to Light of Six Tree Species in the Conifer Belt of the Bhutan Himalayas. Can. J. For. Res. 2004, 34, 1093–1107. [Google Scholar] [CrossRef]
  2. Sugiura, D.; Tateno, M. Concentrative Nitrogen Allocation to Sun-Lit Branches and the Effects on Whole-Plant Growth under Heterogeneous Light Environments. Oecologia 2013, 172, 949–960. [Google Scholar] [CrossRef] [PubMed]
  3. Dong, T.; Li, J.; Zhang, Y.; Korpelainen, H.; Niinemets, Ü.; Li, C. Partial Shading of Lateral Branches Affects Growth, and Foliage Nitrogen-and Water-Use Efficiencies in the Conifer Cunninghamia Lanceolata Growing in a Warm Monsoon Climate. Tree Physiol. 2015, 35, 632–643. [Google Scholar]
  4. Takenaka, A. Shoot Growth Responses to Light Microenvironment and Correlative Inhibition in Tree Seedlings under a Forest Canopy. Tree Physiol. 2000, 20, 987–991. [Google Scholar] [CrossRef]
  5. Hennessey, T.; Dougherty, P.; Cregg, B.; Wittwer, R. Annual Variation in Needle Fall of a Loblolly Pine Stand in Relation to Climate and Stand Density. For. Ecol. Manag. 1992, 51, 329–338. [Google Scholar] [CrossRef]
  6. Hunt, S. Measurements of Photosynthesis and Respiration in Plants. Physiol. Plant. 2003, 117, 314–325. [Google Scholar] [CrossRef] [PubMed]
  7. Lacointe, A.; Deleens, E.; Ameglio, T.; Saint-Joanis, B.; Lelarge, C.; Vandame, M.; Song, G.; Daudet, F.-A. Testing the Branch Autonomy Theory: A 13C/14C Double-labelling Experiment on Differentially Shaded Branches. Plant Cell Environ. 2004, 27, 1159–1168. [Google Scholar] [CrossRef]
  8. Gustafsson, C.; Boström, C. Influence of Neighboring Plants on Shading Stress Resistance and Recovery of Eelgrass, Zostera marina L. PLoS ONE 2013, 8, e64064. [Google Scholar]
  9. Han, Q.; Chiba, Y. Leaf Photosynthetic Responses and Related Nitrogen Changes Associated with Crown Reclosure after Thinning in a Young Chamaecyparis Obtusa Stand. J. For. Res. 2009, 14, 349–357. [Google Scholar] [CrossRef]
  10. Tegeder, M.; Masclaux-Daubresse, C. Source and Sink Mechanisms of Nitrogen Transport and Use. New Phytol. 2018, 217, 35–53. [Google Scholar] [PubMed]
  11. Hikosaka, K. Optimal Nitrogen Distribution within a Leaf Canopy under Direct and Diffuse Light. Plant Cell Environ. 2014, 37, 2077–2085. [Google Scholar] [PubMed]
  12. Wyckoff, P.H.; Clark, J.S. Predicting Tree Mortality from Diameter Growth: A Comparison of Maximum Likelihood and Bayesian Approaches. Can. J. For. Res. 2000, 30, 156–167. [Google Scholar] [CrossRef]
  13. Bigler, C.; Gričar, J.; Bugmann, H.; Čufar, K. Growth Patterns as Indicators of Impending Tree Death in Silver Fir. For. Ecol. Manag. 2004, 199, 183–190. [Google Scholar]
  14. Brodersen, C.R.; McElrone, A.J.; Choat, B.; Lee, E.F.; Shackel, K.A.; Matthews, M.A. In Vivo Visualizations of Drought-Induced Embolism Spread in Vitis Vinifera. Plant Physiol. 2013, 161, 1820–1829. [Google Scholar] [PubMed]
  15. Nardini, A.; Savi, T.; Losso, A.; Petit, G.; Pacilè, S.; Tromba, G.; Mayr, S.; Trifilò, P.; Lo Gullo, M.A.; Salleo, S. X-ray Microtomography Observations of Xylem Embolism in Stems of Laurus Nobilis Are Consistent with Hydraulic Measurements of Percentage Loss of Conductance. New Phytol. 2017, 213, 1068–1075. [Google Scholar] [CrossRef]
  16. McDowell, N.; Pockman, W.T.; Allen, C.D.; Breshears, D.D.; Cobb, N.; Kolb, T.; Plaut, J.; Sperry, J.; West, A.; Williams, D.G. Mechanisms of Plant Survival and Mortality during Drought: Why Do Some Plants Survive While Others Succumb to Drought? New Phytol. 2008, 178, 719–739. [Google Scholar] [CrossRef] [PubMed]
  17. Lone, P.; Khan, N. The Effects of Rate and Timing of N Fertilizer on Growth, Photosynthesis, N Accumulation and Yield of Mustard (Brassica juncea) Subjected to Defoliation. Environ. Exp. Bot. 2007, 60, 318–323. [Google Scholar] [CrossRef]
  18. Barigah, T.S.; Ibrahim, T.; Bogard, A.; Faivre-Vuillin, B.; Lagneau, L.A.; Montpied, P.; Dreyer, E. Irradiance-Induced Plasticity in the Hydraulic Properties of Saplings of Different Temperate Broad-Leaved Forest Tree Species. Tree Physiol. 2006, 26, 1505–1516. [Google Scholar] [CrossRef]
  19. Trubat, R.; Cortina, J.; Vilagrosa, A. Plant Morphology and Root Hydraulics Are Altered by Nutrient Deficiency in Pistacia lentiscus (L.). Trees 2006, 20, 334–339. [Google Scholar] [CrossRef]
  20. Boardman, N.K. Comparative Photosynthesis of Sun and Shade Plants. Annu. Rev. Plant Physiol. 1977, 28, 355–377. [Google Scholar] [CrossRef]
  21. Björkman, O. Responses to Different Quantum Flux Densities. In Physiological Plant Ecology I: Responses to the Physical Environment; Springer: Berlin/Heidelberg, Germany, 1981; pp. 57–107. [Google Scholar]
  22. Koike, T. Leaf Structure and Photosynthetic Performance as Related to the Forest Succession of Deciduous Broad-Leaved Trees. Plant Species Biol. 1988, 3, 77–87. [Google Scholar] [CrossRef]
  23. Warrington, I.; Rook, D.; Morgan, D.; Turnbull, H. The Influence of Simulated Shadelight and Daylight on Growth, Development and Photosynthesis of Pinus radiata, Agathis australis and Dacrydium cupressinum. Plant Cell Environ. 1989, 12, 343–356. [Google Scholar] [CrossRef]
  24. Perry, M.H. Effects of Shading on Photosynthesis and Leaf Morphology of Leucaena Leucocephala (Lam) de Wit Cv K8; University of Hawai‘i at Manoa: Honolulu, HI, USA, 1985; ISBN 9798728258971. [Google Scholar]
  25. Tsel’niker, Y.L. Resistances to CO2 Uptake at Light Saturation in Forest Tree Seedlings of Different Adaptation to Shade. Photosynthetica 1979, 13, 124–129. [Google Scholar]
  26. Teskey, R.O.; Shrestha, R.B. A Relationship between Carbon Dioxide, Photosynthetic Efficiency and Shade Tolerance. Physiol. Plant. 1985, 63, 126–132. [Google Scholar] [CrossRef]
  27. Schmitz, N.; Egerton, J.; Lovelock, C.; Ball, M. Light-dependent Maintenance of Hydraulic Function in Mangrove Branches: Do Xylary Chloroplasts Play a Role in Embolism Repair? New Phytol. 2012, 195, 40–46. [Google Scholar] [PubMed]
  28. Cochard, H.; Lemoine, D.; Dreyer, E. The Effects of Acclimation to Sunlight on the Xylem Vulnerability to Embolism in Fagus sylvatica L. Plant Cell Environ. 1999, 22, 101–108. [Google Scholar] [CrossRef]
  29. Sellin, A.; Õunapuu, E.; Kupper, P. Effects of Light Intensity and Duration on Leaf Hydraulic Conductance and Distribution of Resistance in Shoots of Silver Birch (Betula pendula). Physiol. Plant. 2008, 134, 412–420. [Google Scholar] [CrossRef]
  30. Daniels, R.F.; Burkhart, H.E. Simulation of Individual Tree Growth and Stand Development in Managed Loblolly Pine Plantations; Virginia Tech. Division of Forestry and Wildlife Resources: Blacksburg, VA, USA, 1975. [Google Scholar]
  31. Burkhart, H.E.; Walton, S.B. Incorporating Crown Ratio into Taper Equations for Loblolly Pine Trees. For. Sci. 1985, 31, 478–484. [Google Scholar]
  32. Hann, D.W.; Walters, D.K.; Scrivani, J.A. Incorporating Crown Ratio into Prediction Equations for Douglas-Fir Stem Volume. Can. J. For. Res. 1987, 17, 17–22. [Google Scholar] [CrossRef]
  33. MacFarlane, D.W.; Green, E.J.; Brunner, A.; Burkhart, H.E. Predicting Survival and Growth Rates for Individual Loblolly Pine Trees from Light Capture Estimates. Can. J. For. Res. 2002, 32, 1970–1983. [Google Scholar] [CrossRef]
  34. Sharma, R.P.; Vacek, Z.; Vacek, S.; Podrázský, V.; Jansa, V. Modelling Individual Tree Height to Crown Base of Norway Spruce (Picea abies (L.) Karst.) and European Beech (Fagus sylvatica L.). PLoS ONE 2017, 12, e0186394. [Google Scholar]
  35. Dicus, C.A.; Dean, T.J. Tree-Soil Interactions Affect Production of Loblolly and Slash Pine. For. Sci. 2008, 54, 134–139. [Google Scholar]
  36. Blazier, M.A.; Tyree, M.C.; Sword Sayer, M.A.; KC, D.; Hood, W.G.; Osbon, B.S. Gas Exchange and Productivity in Temperate and Droughty Years of Four Eastern, Elite Loblolly Pine Genotypes Grown in the Western Gulf Region. Int. J. Agron. 2018, 2018, 3942602. [Google Scholar] [CrossRef]
  37. Johnson, G.; Murchie, E. Gas Exchange Measurements for the Determination of Photosynthetic Efficiency in Arabidopsis Leaves. In Chloroplast Research in Arabidopsis: Methods and Protocols, Volume II; Jarvis, R.P., Ed.; Humana Press: Totowa, NJ, USA, 2011; pp. 311–326. ISBN 978-1-61779-237-3. [Google Scholar]
  38. Midgley, G.F.; Rutherford, M.C.; Davis, G.W.; Bosenberg, J.W. Photosynthetic Responses of Heliophilous Rhus Species to Environmental Modification by Invasive Shrubs. Funct. Ecol. 1992, 6, 334–345. [Google Scholar] [CrossRef]
  39. Bailey, S.; Walters, R.G.; Jansson, S.; Horton, P. Acclimation of Arabidopsis thaliana to the Light Environment: The Existence of Separate Low Light and High Light Responses. Planta 2001, 213, 794–801. [Google Scholar] [CrossRef] [PubMed]
  40. Athanasiou, K.; Dyson, B.C.; Webster, R.E.; Johnson, G.N. Dynamic Acclimation of Photosynthesis Increases Plant Fitness in Changing Environments. Plant Physiol. 2010, 152, 366–373. [Google Scholar] [CrossRef] [PubMed]
  41. Muthuchelian, K.; Paliwal, K.; Gnanam, A. Influence of Shading on Net Photosynthetic and Transpiration Rates, Stomatal Diffusive Resistance, Nitrate Reductase and Biomass Productivity of a Woody Legume Tree Species (Erythrina variegata Lam.). Proc. Plant Sci. 1989, 99, 539–546. [Google Scholar] [CrossRef]
  42. Kardiman, R.; Ræbild, A. Relationship between Stomatal Density, Size and Speed of Opening in Sumatran Rainforest Species. Tree Physiol. 2018, 38, 696–705. [Google Scholar] [CrossRef]
  43. Pearcy, R.W.; Sims, D.A. Photosynthetic Acclimation to Changing Light Environments: Scaling from the Leaf to the Whole Plant. In Exploitation of Environmental Heterogeneity by Plants: Ecophysiological Processes Above- and Belowground; Academic Press: Cambridge, MA, USA, 1994; pp. 145–174. [Google Scholar]
  44. Terashima, I.; Saeki, T. A New Model for Leaf Photosynthesis Incorporating the Gradients of Light Environment and of Photosynthetic Properties of Chloroplasts within a Leaf. Ann. Bot. 1985, 56, 489–499. [Google Scholar] [CrossRef]
  45. Brooks, J.R.; Sprugel, D.G.; Hinckley, T.M. The Effects of Light Acclimation during and after Foliage Expansion on Photosynthesis of Abies amabilis Foliage within the Canopy. Oecologia 1996, 107, 21–32. [Google Scholar] [CrossRef]
  46. Temesgen, H.; Weiskittel, A. Leaf Mass per Area Relationships across Light Gradients in Hybrid Spruce Crowns. Trees 2006, 20, 522–530. [Google Scholar]
  47. Ogren, E. Convexity of the Photosynthetic Light-Response Curve in Relation to Intensity and Direction of Light during Growth. Plant Physiol. 1993, 101, 1013–1019. [Google Scholar] [CrossRef]
  48. Olsson, T.; Leverenz, J. Non-uniform Stomatal Closure and the Apparent Convexity of the Photosynthetic Photon Flux Density Response Curve. Plant Cell Environ. 1994, 17, 701–710. [Google Scholar] [CrossRef]
  49. Dietze, M.C.; Sala, A.; Carbone, M.S.; Czimczik, C.I.; Mantooth, J.A.; Richardson, A.D.; Vargas, R. Nonstructural Carbon in Woody Plants. Annu. Rev. Plant Biol. 2014, 65, 667–687. [Google Scholar] [CrossRef]
  50. Maguire, A.J.; Kobe, R.K. Drought and Shade Deplete Nonstructural Carbohydrate Reserves in Seedlings of Five Temperate Tree Species. Ecol. Evol. 2015, 5, 5711–5721. [Google Scholar] [CrossRef]
  51. Smith, A.M.; Stitt, M. Coordination of Carbon Supply and Plant Growth. Plant Cell Environ. 2007, 30, 1126–1149. [Google Scholar] [PubMed]
  52. Paul, M.J.; Foyer, C.H. Sink Regulation of Photosynthesis. J. Exp. Bot. 2001, 52, 1383–1400. [Google Scholar] [PubMed]
  53. Proietti, S.; Paradiso, R.; Moscatello, S.; Saccardo, F.; Battistelli, A. Light Intensity Affects the Assimilation Rate and Carbohydrates Partitioning in Spinach Grown in a Controlled Environment. Plants 2023, 12, 804. [Google Scholar] [CrossRef] [PubMed]
  54. Fernandez, O.; Ishihara, H.; George, G.M.; Mengin, V.; Flis, A.; Sumner, D.; Arrivault, S.; Feil, R.; Lunn, J.E.; Zeeman, S.C. Leaf Starch Turnover Occurs in Long Days and in Falling Light at the End of the Day. Plant Physiol. 2017, 174, 2199–2212. [Google Scholar] [CrossRef]
  55. Dayer, S.; Murcia, G.; Prieto, J.A.; Durán, M.; Martínez, L.; Píccoli, P.; Perez Peña, J. Non-structural Carbohydrates and Sugar Export in Grapevine Leaves Exposed to Different Light Regimes. Physiol. Plant. 2021, 171, 728–738. [Google Scholar] [CrossRef]
  56. Aasamaa, K.; Sõber, A. Stomatal Sensitivities to Changes in Leaf Water Potential, Air Humidity, CO2 Concentration and Light Intensity, and the Effect of Abscisic Acid on the Sensitivities in Six Temperate Deciduous Tree Species. Environ. Exp. Bot. 2011, 71, 72–78. [Google Scholar] [CrossRef]
  57. Rijkers, T.; Pons, T.; Bongers, F. The Effect of Tree Height and Light Availability on Photosynthetic Leaf Traits of Four Neotropical Species Differing in Shade Tolerance. Funct. Ecol. 2000, 14, 77–86. [Google Scholar] [CrossRef]
  58. Sellin, A.; Kupper, P. Effects of Light Availability versus Hydraulic Constraints on Stomatal Responses within a Crown of Silver Birch. Oecologia 2005, 142, 388–397. [Google Scholar] [CrossRef]
  59. Blenkinsop, P.G.; Dale, J.E. The Effects of Shade Treatment and Light Intensity on Rihulose-1,5-Diphosphate Carboxylase Activity and Fraction I Protein Level in the First Leaf of Barley. J. Exp. Bot. 1974, 25, 899–912. [Google Scholar] [CrossRef]
  60. Choi, D.; Jang, W.; Toda, H.; Yoshikawa, M. Differences in Characteristics of Photosynthesis and Nitrogen Utilization in Leaves of the Black Locust (Robinia pseudoacacia L.) According to Leaf Position. Forests 2021, 12, 348. [Google Scholar] [CrossRef]
  61. Hanstein, S.; de Beer, D.; Felle, H.H. Miniaturised Carbon Dioxide Sensor Designed for Measurements within Plant Leaves. Sens. Actuators B Chem. 2001, 81, 107–114. [Google Scholar] [CrossRef]
  62. Pinheiro, C.; Chaves, M. Photosynthesis and Drought: Can We Make Metabolic Connections from Available Data? J. Exp. Bot. 2011, 62, 869–882. [Google Scholar]
  63. Kobe, R.K. Carbohydrate Allocation to Storage as a Basis of Interspecific Variation in Sapling Survivorship and Growth. Oikos 1997, 80, 226–233. [Google Scholar] [CrossRef]
  64. Sevanto, S.; Mcdowell, N.G.; Dickman, L.T.; Pangle, R.; Pockman, W.T. How Do Trees Die? A Test of the Hydraulic Failure and Carbon Starvation Hypotheses. Plant Cell Environ. 2014, 37, 153–161. [Google Scholar] [CrossRef]
Figure 1. Example of how shade was achieved using reinforcing wire, rebar and shade cloth.
Forests 14 01704 g001
Figure 2. Comparison of percentage of nonstructural carbohydrate among treatments. For each parameter, means with the same letter indicate no significant difference (p ≤ 0.05).
Forests 14 01704 g002
Figure 3. Principal component analysis of photosynthetic and water relations parameters in (a) August, (b) September, (c) October and (d) November. The lengths and directions of blue lines show a correlation with principal components.
Forests 14 01704 g003
Figure 4. Survival or mortality of branches as classified by PCA of photosynthetic and water relations parameters in (a) August, (b) September, (c) October and (d) November. The numbers in the figure represent individual branches and are used in Table 4.
Forests 14 01704 g004
Figure 5. Variations in measured parameters between dying (0) and surviving (1) branches as illustrated by box plots. Boundaries of the box plot are represented by the 25th- and 75th-percentiles, the median line within the plot, and circles indicate outliers.
Forests 14 01704 g005
Table 1. Experimental design.
ShadeSouthNorth
0% S01, S02, S04N01, N02, N05
30%S302, S304, S305N301, N303, N304
60%S601, S603, S605N602, N603, N604
Table 2. Effects of shade treatments on the parameters of photosynthetic light–response curve.
TreatmentMeanStd Error
Assimilation at Light Saturation (μmol CO2 m−2 s−1)
0 percent7.1593 a0.5915
30 percent5.6694 a,b0.6029
60 percent4.3087 b0.6142
Dark Respiration (μmol CO2 m−2 s−1)
0 percent1.3268 a0.1174
30 percent0.9777 b0.1196
60 percent0.6638 b0.1218
Apparent Quantum Yield (μmol CO2 μmol −1 quanta)
0 percent0.0427 a0.0045
30 percent0.0383 a,b0.0046
60 percent0.0261 b0.0046
Theta
0 percent0.0891 a0.1174
30 percent0.0651 a0.1189
60 percent0.4876 b0.1209
Light Compensation Point (μmol m−2 s−1)
0 percent37.7372 a1.9196
30 percent30.7806 b1.9491
60 percent27.1304 b1.9836
Light Saturation Point (μmol m−2 s−1)
0 percent605.3300 a45.5826
30 percent536.9100 a46.2257
60 percent390.3500 b47.0563
For each parameter, the same letter means no significant difference at p < 0.05.
Table 3. Effects of shade treatments on water relations parameters.
TreatmentMeanStd Error
Stomatal conductance (mmol m−2 s−1)
0 percent0.0423 a0.0046
30 percent0.0321 a,b0.0048
60 percent0.0250 b0.0049
Sap flow (g/day)
0 percent220.4600 a24.5518
30 percent130.2300 b25.8615
60 percent62.4087 b27.1485
Pre-dawn water potential (MPa)
0 percent−1.0642 a0.1656
30 percent−1.1700 a0.1425
60 percent−1.3423 a0.1687
Mid-day water potential (MPa)
0 percent−1.9017 a0.2306
30 percent−2.1921 a0.2328
60 percent−2.3391 a0.2953
For each parameter, the same letter means no significant difference at p < 0.05.
Table 4. Accuracy of classifications recorded using PCA.
Classification by Month
No.Branch IDStatusAugustSeptemberOctoberNovember
1N01Alive
2N02Dead*
3N05Alive
4N301Alive
5N303Dead*
6N304Dead*
7N602Dead**
8N603Alive
9N604Dead
10S01Alive
11S02Alive
12S04Alive
13S302Alive
14S304Alive
15S305Alive
16S601Alive
17S603Dead
18S605Dead*
Accuracy (%)83.377.876.546.2
status was correctly classified; status was wrongly classified; * branch was not measured due to mortality.
Disclaimer/Publisher’s Note: The statements, opinions and data contained in all publications are solely those of the individual author(s) and contributor(s) and not of MDPI and/or the editor(s). MDPI and/or the editor(s) disclaim responsibility for any injury to people or property resulting from any ideas, methods, instructions or products referred to in the content.

