Abstract
We present a novel and efficient approach that enables the evaluation of environmental quality in cities worldwide using high-resolution satellite imagery, based on a new green index (GI) through multivariate analysis, to compare the proportion of urban green spaces (UGSs) with built and impervious surfaces. High-resolution images were used to perform a supervised classification of 25 districts in the city of São Paulo, Brazil. Only 11 districts showed higher urban forests, green spaces, green index, and green vs. built values, and impervious surface proportions with lower impervious and built spaces. On the other hand, the remaining districts had higher population densities and unfavorable conditions for urban ecosystem development. In some cases, urban green spaces were three-times smaller than the built and impervious surfaces, and none of the districts attained a high green quality index (0.75 to 1). Artificial intelligence techniques improved the precise identification of land cover, particularly vegetation, such as trees, shrubs, and grasses. The development of a novel green index, using multivariate statistical analysis, enhanced positive interactions among soil cover classes, emphasizing priority areas for enhancing environmental quality. Most of them should be prioritized by decision makers due to the low environmental quality, as identified by the low green index and worse ecosystem services, well-being, and health outcomes. The method can be employed in many other cities to enhance urban ecosystem quality, well-being, and health. The green index and supervised classification can characterize pastures, degraded forest fragments, and guide forest restoration techniques in diverse landscapes.
1. Introduction
The patterns of space use in urban areas are dynamic and marked by extensive land use, mainly due to demographic evolution. Within cities, natural spaces are constantly replaced with artificial structures, such as buildings, roads, and impervious surfaces [1,2]. Human actions cause several negative impacts when sustainability is not considered in urban development, affecting biodiversity and ecological processes. Another aspect greatly affected is the quality of human life itself. Several studies have reported the vulnerability of urban residents, who are more exposed to thermal, cardiovascular, auditory, and psychological stresses [3,4,5].
To minimize these problems, the creation of urban green spaces (UGSs) is an important tool used by public managers to ensure ecosystem services and improve the quality of life. UGSs are natural or artificial areas, public or private, with biological activity and regenerative mechanisms in urban settings [6]. The benefits provided by UGSs are directly linked to well-being and the mitigation of possible environmental disturbances. The green management of urban areas is essential for global sustainability, especially involving the adaptation to climate change and social innovation and development [7,8].
Solutions to mitigate the negative impacts caused by unplanned land use have received considerable attention around the world. The expansion of UGSs has attracted attention to enable the conversion of anthropized areas using vegetation, mainly arboreal species, through afforestation along roads, in public squares and protected areas, such as watercourses and slopes, which can help to reduce atmospheric pollution, increase biodiversity, improve soil and water conservation outcomes, and promote the positive regulation of the urban microclimate [2,9,10].
UGSs are composed of urban forests (UFs), which consist of sets of trees and shrubs located in very complex and altered urban ecosystems, as well as areas with grass and herbaceous surfaces, albeit with a lower local cooling efficiency [11]. Interactions between UGSs and other intra-urban elements, with special attention being paid to urban forests, have been widely assessed on the global and local scales [12,13,14]. The information generated has been used in landscape and urban planning by decision makers to enhance the environmental quality and indicate priority areas for interventions [15].
At present, the negative effects of heat islands in cities are attracting the attention of urban planners [16,17]. Mitigation by greener structures has been globally applied [11,18]. Ref. [19] indicated that the presence of greenery along streets and in public squares decreased local temperature, and this effect varied according to the green community structure. Ref. [20] developed a rational plan and design for urban green spaces with other intra-urban elements that could enhance the local climate in cities. The use of geoprocessing, specifically remote sensing, is also an option to rank priority areas to establish UGSs in sparsely wooded regions to improve the climate in large cities.
Remote sensing is a commonly applied technique for collecting information and tracking UGS dynamics in urban centers. Ref. [21] used remote sensing to assess the processes of development and urbanization in the city of Shenzhen, China. They observed that between 1978 and 2018, there was a change from UGSs to non-UGSs, directly affecting the region’s climate. Ref. [22] applied remote sensing data to compute a vegetation index in poor and rich areas in Johannesburg, South Africa. Ref. [23] also stated that remote sensing was a valuable technique that facilitated the research involving UGSs and minimized the need for field data collection.
The integration of remote sensing as a tool for urban planning has gained prominence, particularly through the utilization of techniques, such as the normal difference vegetation index (NDVI). In general, the assessment of green indices is crucial for understanding environmental health, climate impact, and ecosystem services. However, the use of the NDVI does not address the vertical dimension and density of urban buildings, making it insufficient for evaluating the quality of urban green spaces (UGSs) [24]. Given the constant changes in urban spaces, the development of indices that allow for the detailed classification of urban infrastructure becomes an advancement in this scientific field and facilitates decision making for public managers regarding UGS management.
Considering the importance of wooded areas in major metropolises for enhancing ecological and social aspects, we evaluated the interactions of UGSs with infrastructure and environmental quality across 25 districts (regional administrations) in the largest city in Latin America. Based on these interactions, we developed an index with the aim of prioritizing regions for urban planners and decision makers in the investigated areas. The framework presented in this study encompasses the development and processing of high-resolution images, including the supervised classification and organization of land-cover classes. Additionally, using the developed index, we assess the interactions within intra-urban spaces, analyze the provision of ecosystem services, and propose strategies to improve environmental quality in a Brazilian megacity.
2. Materials and Methods
2.1. Study Area
We chose São Paulo, one of the largest cities in the world, known as the “stone jungle”, to conduct this study. São Paulo is located at a latitude of 23°37′ N and longitude of 46°39′ W, 802 m above sea level, has a 1521 km2 of land area, and an estimated population of 12,038,175 in 2016 (Figure 1). Urbanization and afforestation occur along 50.3% and 74.8% of public roads, respectively [25]. The local climate is classified as either Cfb (wet subtropical with temperate summer) or Cfa (wet subtropical with hot summer), with an average yearly temperature of 18.4 °C and precipitation level of 1697 mm [26].
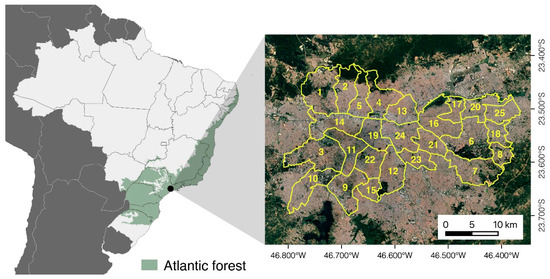
Figure 1.
Localization of the study area with the 25 districts of São Paulo City, São Paulo State, Brazil.
2.2. High-Resolution Multispectral Images
High-resolution multispectral images containing 25 districts of São Paulo were donated in 2017 by the Digital Globe Foundation of Google Earth, and were used to perform the supervised classification to quantify the intra-urban elements of the region. The high-resolution multispectral images were procured on 29 June 2016, employing the WorldView-2 Satellite Imagery platform during the winter season. The spatial resolution exhibited a value of 50 cm, the panchromatic image 46 cm, and 1.84 cm for the multispectral image. The merging of the panchromatic with the multispectral bands was performed through the application of the “Pansharpening” technique, resulting in the generation of a single high-resolution colored image. No clouds were detected in the high-resolution multispectral images, signifying that there was no impact or necessity for any treatments.
2.3. Supervised Classification
The high-resolution multispectral images underwent supervised classification using Quantum GIS software version 3.28. This classification process employed the random forest algorithm, which was accessible through the Dzetsaka complement [27]. The hyperparameters used to perform the supervised classification in the Dzetsaka (random forest) plugin were n estimators = 2; np range = 10; max features = 20; min samples split = range 6, and percentage of pixels for the validation = 50%. The outcome of this procedure was an error matrix table and a kappa coefficient (Table S1, Supplementary Material). Kappa coefficient values higher than 80% (Table 1) were considered to represent high accuracy regarding the intra-urban elements’ quantifications [28,29].

Table 1.
Rating criteria of kappa statistics.
The supervised classification of satellite images involved the utilization of the random forest classifier algorithm. This algorithm was composed of a collection of classifiers built using decision trees. Each classifier within a random forest assigned a weight to a particular class with respect to the input vectors [30,31,32,33,34]. In the classification tool, a total of 100 polygon samples were created for each cover class, namely, tree/shrub, grass/herbaceous, bare soil, roads, impervious surface, shadow, river/lake, swimming pool, light tiles, dark tiles, gray tiles, and ceramic tiles. Following the collection of the samples for each class, the Dzetsaka complement was employed, incorporating both the image (mosaic) in .tif format with RGB+IR spectral bands and a shapefile containing the polygonal samples. The samples were identified by the ID field within the attributed table of the shapefile. Figure 2 shows the land-cover classes and composition of the intra-urban elements measured in percentages, and the built areas are the sum of swimming pools and different roof-tile types (dark, light, gray, and ceramic). The classification adopted and the high resolution of the images used in this study allowed us to distinguish the different land-cover classes between tree and herbaceous covers [35].
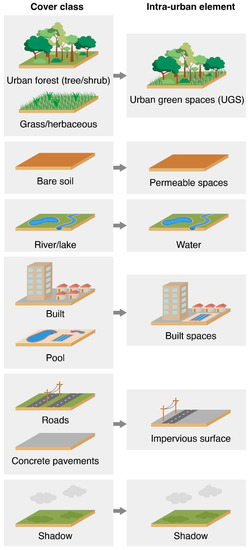
Figure 2.
Land-cover classes and intra-urban element compositions for the supervised classifications.
2.4. Interaction of Urban Green Spaces and Intra-Urban Elements
A new concept was developed based on the method described by [1]. Proportions between intra-urban elements were used to assess the green spaces’ quality, distribution, interactions, and the potential ecosystem services involved. Using the land-cover percentage for each district, it was possible to calculate the proportion between natural and anthropized areas (Equations (1)–(3)), ranging from 0 to 1.
Green vs. impervious surface proportion (GIP):
Green vs. built spaces proportion (GBP):
Green index (GSI):
Population density and contaminated sites per district in 2016 were used as independent variables [25]. Urban environmental quality was evaluated using the green index range for each district, as shown in Table 2.
Table 2.
Green index range values.
The principal component analysis (PCA) was used to assess the interactions in each district between urban forests, grass/herbaceous areas, green spaces, permeable spaces, water, built spaces, roads, concrete pavements, other impervious surfaces, shaded area, green vs. impervious surface proportion, green vs. built space proportion, green index, population density, and contaminated sites. Contaminated sites were defined as environments composed of organic and inorganic elements with concentrations above the limits established by legislation, which could cause damage to human health and the environment.
To assess districts with higher and lower environmental quality levels (priority), the cluster analysis was employed to the variables of urban forests, grass/herbaceous areas, green spaces, permeable spaces, built spaces, impervious surfaces, green vs. impervious surface proportion, green vs. built space proportion, and green index. The SAS 9.4 package (SAS™ Institute Inc., Cary, NC, USA) was used to perform the statistical analysis.
3. Results and Discussion
3.1. Supervised Classification
The kappa index achieved high-accuracy results, with values above 96% for all land-cover classes regarding the intra-urban element quantification from the high-resolution multispectral images. Table 3 shows the supervised classification, intra-urban elements measured in percentage, green vs. built and impervious surface proportion, green index, population density, and contaminated sites in the 25 districts (Supplementary Table S1). The districts were ranked according to the presence of urban forested areas, and only four districts had tree cover values above 30%, considered to reflect good environmental ecosystem quality [36]. These results are important to improve decision-making processes to enhance biodiversity conservation and sustainable urban ecosystem management [37]. However, regarding the interactions of the intra-urban elements, the first 11 districts had a green index above 0.5, meaning higher green-space coverage than built and impervious surfaces.
Table 3.
Supervised classification of the 25 districts in São Paulo City.
Figure 3A shows the coverage classes estimated using the supervised classification in the 25 districts in São Paulo. The districts located on the map border had higher urban forest coverage and green index values (Figure 3B). However, the central and eastern regions had higher built and impervious surfaces because they were dominated mainly by corporate buildings and commercial areas. In addition to the low concentration of UGSs, these regions had a higher concentration of contaminated areas, mainly due to the presence of service stations and industries. Groundwater was the factor most affected by contaminated soils, which can negatively affect the public water supply in the city [38]. São Paulo is the fourth most-polluted city in Brazil. It is estimated that 17,964 t of CO2 was emitted in 2018 alone, and the energy sector was the greatest culprit.
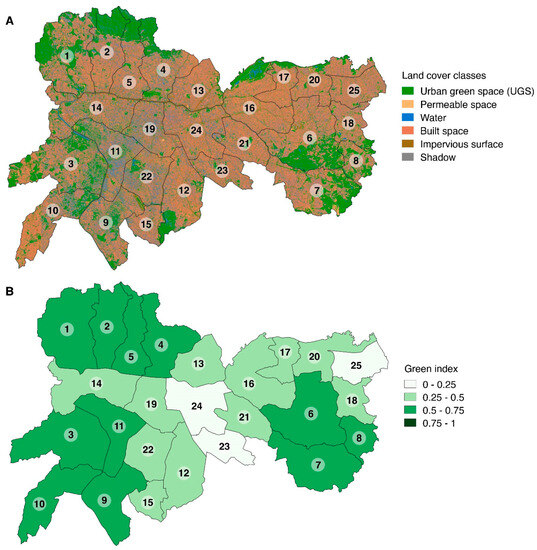
Figure 3.
(A) Supervised classification map of 25 districts representing the cover classes of São Paulo City; (B) distribution of the green index.
Areas with lower green spaces represent a high risk to the residents, since the air-quality index indicates that aerosol particulate pollution reduces the global life expectancy by nearly two years [39]. However, urban forests can mitigate, or even reverse, this damage. Trees improve air quality by intercepting particles on their leaf surfaces and absorbing pollutant gases. In a simulation conducted considering some cities in Canada, trees were found to remove 16,500 tons of air pollution [40]. Water quality can also be improved through nutrient uptake and the retention of rainfall runoff. By understanding how environmental variables affect air quality, urban forests can be better designed for an efficient performance [40].
3.2. Interaction of Urban Green Spaces and Intra-Urban Elements
Principal component analysis accounted for 89.93% of the total data variation (Figure 4). Component 1 included the districts with a higher green vs. built space proportion, green index, green vs. impervious space proportion, urban forest area, and green space coverage, and lower impervious spaces, roads, and built space percentages. Component 2 contained the districts with higher grass/herbaceous areas, concrete pavements, and permeable spaces, along with less shade, rivers/lakes, and contaminated sites. The highest positive pairwise correlations were observed among the urban forests, green index, green vs. built spaces, green spaces vs. impervious surfaces, and green spaces. Pirituba, Freguesia, Butantã, Santana, Casa Verde, Itaquera, São Mateus, Cidade Tiradentes, Santo Amaro, and Pinheiros had the most urban forests, green spaces, green index, green spaces vs. built, and impervious surfaces proportion, and the least impervious and built space among all the districts investigated. Larger green spaces produce a stronger cooling effect, which is intensified when associated with water [11]. Therefore, they have better environmental quality, since a balanced intra-urban space proportion increases the available ecosystem services [14]. In China, urban forests are associated with enhanced air quality, the removal of air pollutants, decrease in carbon levels, and improved recreation and cultural activities in several cities [41]. In Stockholm, Sweden, green spaces were found to enhance human health and urban ecosystem quality [42]. Urban forests play important roles in local climate regulation, reducing the negative effects of heat islands and enhancing air quality [43]. When land use is properly planned and organized in line with environmental considerations, urban structures can enhance microclimate quality; reduce potential toxic elements in the atmosphere, water, and soil; and control surface runoff, especially during the rainy season.
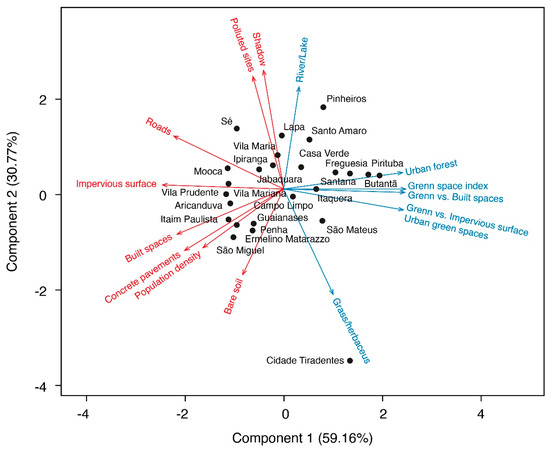
Figure 4.
Multidimensional preference analysis representing the intra-urban elements’ interactions in the 25 districts.
The city of São Paulo frequently suffers from localized flooding, causing economic losses and reducing the residents’ well-being, a problem affecting many other Brazilian cities. It is estimated that the impact of flooding in 2008 caused aggregate monetary damage of BRL 218.19 million in Brazil as whole [44]. Another chronic problem faced by São Paulo is landslides, which mainly occur in the summer. According to the Civil Defense Department, the city has more than 400 areas with high and very-high landslide susceptibility. Achieving the equilibrium of green and urbanized spaces is a key step to achieve sustainable development with the enhancement of urban ecosystem resilience [7]. Urban forests can minimize these events and contribute to increased carbon sequestration and storage in urban environments with multiple emission sources.
A cluster of districts with vertical buildings (represented by shadows) had several contaminated sites near rivers and lakes. Population growth and industrialization processes compromise the quality of urban rivers, potentially making them reservoirs of disease. The effects of sewage systems on urban river pollution are still not well-understood, and this hampers restoration projects [45]. The results obtained in that study demonstrated the potential of creating riparian UGSs to rehabilitate polluted rivers. A study conducted on ecosystem services in a riparian protected area (RPA) in São Paulo estimated that 5917.5 ha of the reforested RPA could reduce the cost of water treatment by USD 181,774 per 1000 m3 [46].
Additionally, Figure 5 shows a cluster of districts with higher population densities and larger impervious areas (roads and concrete pavements) and built spaces. Intra-urban elements with a higher reflective capacity produce a hot and dry microclimate, increasing the thermal discomfort of the population through the change in energy balance, forming heat islands, increasing the predisposition to inundation, and causing soil compaction [1]. Those problems reduce the social–ecological resilience potential of these districts and decrease the ecosystem services provided by urban forests [7]. In turn, some districts had larger permeable spaces, which could be converted into green spaces, improving the green index and environmental quality.
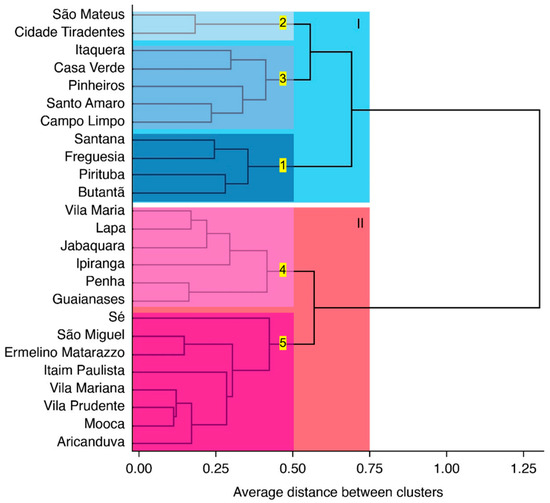
Figure 5.
Average distances between clusters, districts with more urban green space covers and indexes (I), and districts with less urban green space covers and indexes, and thus higher priority for public policies (II).
When assessing the tree cover in Los Angeles, researchers concluded that the city had the potential to plant 1 million trees [47]. Decision-makers can also increase urban afforestation along streets. In Lisbon, Portugal, for every USD 1 invested in a street tree, residents received USD 4.48 in benefits through ecosystem services [48]. In the United States, planting trees increased property values when the urban forest cover was between 30% and 38% in private and public areas, respectively [49]. São Paulo can also mitigate these negative effects by converting bare soil areas into urban forests by planting trees. Therefore, increasing street afforestation increases the green index and environmental quality by increasing the proportion between urban forest cover and impervious surfaces [2]. Moreover, ecosystem services are frequently related to the qualitative and quantitative aspects of urban forests, when composed of a healthy and well-distributed population [14]. In another study on Fuzhou, China, the Cidade Tiradentes district had the largest grass/herbaceous cover available for a possible conversion into an urban forest to enhance the cooling effect [11].
We found two distinct clusters regarding the interaction of the green index and intra-urban elements that could help decision makers, as shown in Figure 4. Cluster I was represented by the districts with higher values and the best green quality due to the green index ranging between 0.75 and 0.5. However, districts with a very-high green index (above 0.75) were not found. These districts also provide greater social cohesion, improving the health benefits and well-being of the population, stimulating physical activity and social engagement [50]. The regional prefecture of cluster I also showed more green spaces than built and impervious surfaces (green index > 0.5), with a high environmental quality. Therefore, it was essential to undertake a systematic spatial assessment of all urban green spaces and their social, ecological, and economic functions, to preserve and enhance their benefits to residents [51].
Finally, cluster II had districts with moderate and low green-quality values, as well as more built and impervious surfaces than green spaces. Districts with moderate-level green quality also had a higher population density, with smaller green spaces, and possibly higher levels of health inequality due to low income [52]. Itaim Paulista, with the worst scenario, has green spaces three-times smaller than built and impervious surfaces. Ecological functions must be improved by increasing the urban green infrastructure to enhance the quality of life and social cohesion of communities [16]. Thus, districts with low- and moderate-level green quality should be prioritized by the state and municipal governments to mitigate the negative effects on the urban environment, as mentioned before.
3.3. What Measures Should Be Taken to Improve Urban Spaces? A Warning for Public Managers
UGSs can be a powerful instrument to improve ecological balance and quality of life, where urban planners, legislators, and managers can perform effective actions to increase the green index in urban centers, and consequently increase ecosystem services and benefits for the population [53,54]. In addition, UGS expansion can also help reduce public spending on health, safety, and infrastructure in megacities, with the annual benefits estimated at USD 505 million [55,56]. This need to create UGSs in large cities has been increasing to minimize the impacts caused by anthropic actions, such as different types of pollution and heat islands. In light of this need, in 2014, the São Paulo City government established the Municipal Plan for Urban Afforestation (PMAU) as a priority action, in article 288 of Municipal Law 16,050/2014 [57], based on the Sustainable Development Goals (SDGs) established by the United Nations (UN), specifically: (i) SDG 11—sustainable cities and communities; (ii) SDG 13—action against global climate change; and (iii) SDG 15—terrestrial life [58]. All measures performed since then have aimed to reduce the impacts generated by rapid population growth and urban sprawl through the expansion of green areas. However, public managers need to keep in mind that all actions should be conducted considering the conditions of each district. Therefore, based on the results obtained through the analyses performed in this study, we recommend the following initiatives for more effective results:
(i) Definition of priority areas for creating UGSs—regions with a green index be-low 0.50 should receive priority attention from public managers, especially the districts of Mooca and Itaim Paulista. The planting of individual trees, especially species endemic to Brazil indicated for urban environments, in areas with grass and herbaceous vegetation is an effective option for transforming these spaces into urban forests. Places with bare soil are environments with a high potential for the expansion and implementation of UGSs, through the creation of squares and parks that can improve the quality of life and social interaction.
(ii) Creation of UGSs close to contaminated areas to reduce impacts and improve the quality of life—we recommend for these spaces the use of phytoremediation, a green technology that seeks to mitigate the impacts of contaminated environments using plant species. This efficient technique has been used to absorb greenhouse gases from industrial emissions and to remove heavy metals, insecticides, and other organic and inorganic chemical compounds. There are different types of phytoremediation (phytoextraction, phytostabilization, phytodegradation, phytovolatilization, rhizodegradation); therefor, the choice should be made according to the pollution level of the area in question [59].
(iii) Interconnection of UGSs through ecological corridors—the benefits provided by UGSs go beyond the control of pollution and the enhancement of human well-being. When well-planned, these environments can be an important ecological tool, serving as connectors for fauna mobility, food sources, and shelter, enabling the gene flow and conservation of plant species [60]. Connectivity between UGSs plays an important role in ecological balance outcomes, and consequently the provision of ecosystem services that benefit everyone. Thus, the creation of green corridors should be encouraged. Empty lots, alleys, and small green spaces can be used to establish corridors, creating a connection between squares, parks, and other types of UGSs [61].
(iv) Encouragement of socio-environmental actions linked to UGSs—policymakers should encourage social and environmental actions tailored to each district or group of districts, such as joint efforts to plant trees and maintain existing spaces. In addition to promoting UGS improvement and expansion, these activities increase interpersonal dynamics and the sense of a connection between people, which promote better physical and mental health outcomes [50].
(v) Alternative sources of revenue and capital funding for UGSs—due to the eco-nomic crisis experienced in Brazil, municipal budgets may be insufficient for project developments associated with the expansion of UGSs. The formation of public–private partnerships (PPPs) can be a strategy to guarantee funding. In the Paying for Parks Report [62], eight financing models, including PPPs, were listed, which can be used as alter-native sources of income for the implementation and maintenance of UGSs, namely, (i) financing from local authorities—general income; (ii) multi-agency public sector funding—proceeds from projects that meet cross-targets; (iii) income generation opportunities—maintenance of UGSs through income from commercial spaces located inside them; (iv) issuance of bonds and commercial financing; (v) donations; (vi) fiscal initiatives—such as reduced state value added tax (ICMS) on the circulation of ecological goods and services; (vii) planning and development initiatives; and (viii) voluntary and community sector involvement—such as contributions from nonprofit organizations.
4. Conclusions
The method used fulfilled the purpose of identifying environmental quality via the green index in the districts of São Paulo City. The integration of artificial intelligence techniques, specifically the utilization of supervised classification algorithms, such as Dzetsaka and the random forest plugin, on the satellite images within the study area facilitated the accurate and efficient identification of land cover, with particular emphasis on vegetation, proved valuable in distinguishing various vegetation types, including trees, shrubs, and grasses. The novel green index developed through the multivariate statistical analysis amplified the positive interactions among soil cover classes, thereby emphasizing priority areas for enhancing the environmental quality. This study and green index represent a rare contribution to the field, as they are among the few developed specifically for subtropical forests in developing countries. This method can be replicated in other regions of the world for the identification of priority areas for the creation or improvement of UGSs, serving as a tool to assist decisions made by public policymakers. The developed green index and supervised classification can be utilized to characterize various areas, such as pastures, degraded forest fragments in expansive landscapes, and determine suitable techniques for forest restoration. The creation of UGSs provides an ecosystem service that improves the quality of life of the urban population. With the adoption of public policies that invest in these environments, São Paulo has the potential to become a sustainable megacity, fulfilling the SDGs cited in its Municipal Plan for Urban Afforestation. Through collaborative endeavors involving academic, public, and private initiatives, considerable advancements can be achieved in enhancing environmental quality for communities worldwide, in a timely and accessible manner, thereby promoting the development of sustainable cities.
Supplementary Materials
The following supporting information can be downloaded at: https://www.mdpi.com/article/10.3390/f14091705/s1, Table S1: error matrix table and the kappa coefficient from the supervised classification and Table S2: supervised classification of the 25 districts in São Paulo City.
Author Contributions
A.S.N., A.Q.L. and D.F.d.S.F. contributed to the study conception and design. Material preparation, data collection and analysis were performed by A.S.N., J.L.P., A.N.G. and A.Q.L. The first draft of the manuscript was written by F.M.F.L. and J.G.M.U.-F. and all authors commented on the previous versions of the manuscript. The final review of the manuscript was conducted by F.M.F.L., J.G.M.U.-F., A.S.N. and A.F.D.J. All authors have read and agreed to the published version of the manuscript.
Funding
This study received no external funding.
Data Availability Statement
Data are contained within the article or Supplementary Materials.
Acknowledgments
This study was financed in part by the Office to Coordinate Improvement of Higher Education Personnel (CAPES, Finance Code 001), National Council for Scientific and Technological Development (CNPq), and Espírito Santo State Research Support Foundation (FAPES).
Conflicts of Interest
The authors declare no conflict of interest.
References
- Da Silva Filho, D.F.; Pivetta, K.F.L.; do Couto, H.T.Z.; Polizel, J.L. Indicadores de Floresta Urbana a Partir de Imagens Aéreas Multiespectrais de Alta Resolução. Sci. For. PP-Piracicaba 2005, 88–100. Available online: https://repositorio.unesp.br/handle/11449/68193 (accessed on 1 June 2023).
- Wu, D.; Wang, Y.; Fan, C.; Xia, B. Thermal Environment Effects and Interactions of Reservoirs and Forests as Urban Blue-Green Infrastructures. Ecol. Indic. 2018, 91, 657–663. [Google Scholar] [CrossRef]
- Kondo, M.C.; Fluehr, J.M.; McKeon, T.; Branas, C.C. Urban Green Space and Its Impact on Human Health. Int. J. Environ. Res. Public Health 2018, 15, 445. [Google Scholar] [CrossRef]
- Song, C.; Ikei, H.; Igarashi, M.; Takagaki, M.; Miyazaki, Y. Physiological and Psychological Effects of a Walk in Urban Parks in Fall. Int. J. Environ. Res. Public Health 2015, 12, 14216–14228. [Google Scholar] [CrossRef]
- Chapman, S.; Watson, J.E.M.; Salazar, A.; Thatcher, M.; McAlpine, C.A. The Impact of Urbanization and Climate Change on Urban Temperatures: A Systematic Review. Landsc. Ecol. 2017, 32, 1921–1935. [Google Scholar] [CrossRef]
- Zou, H.; Wang, X. Progress and Gaps in Research on Urban Green Space Morphology: A Review. Sustainability 2021, 13, 1202. [Google Scholar] [CrossRef]
- McPhearson, T.; Andersson, E.; Elmqvist, T.; Frantzeskaki, N. Resilience of and Through Urban Ecosystem Services. Ecosyst. Serv. 2014, 12, 152–156. [Google Scholar] [CrossRef]
- Semeraro, T.; Scarano, A.; Buccolieri, R.; Santino, A.; Aarrevaara, E. Planning of Urban Green Spaces: An Ecological Perspective on Human Benefits. Land 2021, 10, 105. [Google Scholar] [CrossRef]
- Castelli, K.R.; Silva, A.M.; Dunning, J.B. Improving the Biodiversity in Urban Green Spaces: A Nature Based Approach. Ecol. Eng. 2021, 173, 106398. [Google Scholar] [CrossRef]
- Qiu, L.; Liu, F.; Zhang, X.; Gao, T. Difference of Airborne Particulate Matter Concentration in Urban Space with Different Green Coverage Rates in Baoji, China. Int. J. Environ. Res. Public Health 2019, 16, 1465. [Google Scholar] [CrossRef]
- Yu, Z.; Guo, X.; Jørgensen, G.; Vejre, H. How Can Urban Green Spaces Be Planned for Climate Adaptation in Subtropical Cities? Ecol. Indic. 2017, 82, 152–162. [Google Scholar] [CrossRef]
- Baró, F.; Palomo, I.; Zulian, G.; Vizcaino, P.; Haase, D.; Gómez-Baggethun, E. Mapping Ecosystem Service Capacity, Flow and Demand for Landscape and Urban Planning: A Case Study in the Barcelona Metropolitan Region. Land Use Policy 2016, 57, 405–417. [Google Scholar] [CrossRef]
- Daniels, B.; Zaunbrecher, B.S.; Paas, B.; Ottermanns, R.; Ziefle, M.; Roß-Nickoll, M. Assessment of Urban Green Space Structures and Their Quality from a Multidimensional Perspective. Sci. Total Environ. 2018, 615, 1364–1378. [Google Scholar] [CrossRef] [PubMed]
- Nowak, D.J.; Greenfield, E.J. Tree and Impervious Cover Change in U.S. Cities. Urban For. Urban Green. 2012, 11, 21–30. [Google Scholar] [CrossRef]
- Luederitz, C.; Brink, E.; Gralla, F.; Hermelingmeier, V.; Meyer, M.; Niven, L.; Panzer, L.; Partelow, S.; Rau, A.-L.; Sasaki, R.; et al. A Review of Urban Ecosystem Services: Six Key Challenges for Future Research. Ecosyst. Serv. 2015, 14, 98–112. [Google Scholar] [CrossRef]
- Shin, Y.; Kim, S.; Lee, S.-W.; An, K. Identifying the Planning Priorities for Green Infrastructure within Urban Environments Using Analytic Hierarchy Process. Sustainability 2020, 12, 5468. [Google Scholar]
- Shou, Y.; Zhang, D.-L. Recent Advances in Understanding Urban Heat Island Effects with Some Future Prospects. J. Meteorol. Res. 2012, 70, 338–353. [Google Scholar]
- Azmy, M.M.; Hosaka, T.; Numata, S. Responses of Four Hornet Species to Levels of Urban Greenness in Nagoya City, Japan: Implications for Ecosystem Disservices of Urban Green Spaces. Urban For. Urban Green. 2016, 18, 117–125. [Google Scholar] [CrossRef]
- GAO, J.; SONG, T.; ZHANG, B.; HAN, Y.; GAO, X.; FENG, C. The Relationship between Urban Green Space Community Structure and Air Temperature Reduction and Humidity Increase in Beijing. Resour. Sci. 2016, 38, 1028–1038. [Google Scholar] [CrossRef][Green Version]
- Liu, F.; Yan, W.; Kong, F.; Yin, H.; Ban, Y.; Xu, W. A Review on the Urban Green Space Cooling Effect Based on Field Measurement of Air Temperature. Chinese J. Appl. Ecol. 2017, 28, 1387–1396. [Google Scholar] [CrossRef]
- Liu, Y.; Li, H.; Li, C.; Zhong, C.; Chen, X. An Investigation on Shenzhen Urban Green Space Changes and Their Effect on Local Eco-Environment in Recent Decades. Sustainability 2021, 13, 12549. [Google Scholar] [CrossRef]
- Abutaleb, K.; Freddy Mudede, M.; Nkongolo, N.; Newete, S.W. Estimating Urban Greenness Index Using Remote Sensing Data: A Case Study of an Affluent vs Poor Suburbs in the City of Johannesburg. Egypt. J. Remote Sens. Space Sci. 2021, 24, 343–351. [Google Scholar] [CrossRef]
- Shahtahmassebi, A.R.; Li, C.; Fan, Y.; Wu, Y.; Lin, Y.; Gan, M.; Wang, K.; Malik, A.; Blackburn, G.A. Remote Sensing of Urban Green Spaces: A Review. Urban For. Urban Green. 2021, 57, 126946. [Google Scholar] [CrossRef]
- Gupta, K.; Kumar, P.; Pathan, S.K.; Sharma, K.P. Urban Neighborhood Green Index—A measure of green spaces in urban areas. Landsc. Urban Plan. 2012, 105, 325–335. [Google Scholar] [CrossRef]
- IBGE. Instituto Brasileiro de Geografia e Estatística. São Paulo. Available online: https://cidades.ibge.gov.br/brasil/sp/sao-paulo/panorama (accessed on 1 June 2023).
- Alvares, C.A.; Stape, J.L.; Sentelhas, P.C.; de Moraes Gonçalves, J.L.; Sparovek, G. Köppen’s Climate Classification Map for Brazil. Meteorol. Zeitschrift 2014, 22, 711–728. [Google Scholar] [CrossRef]
- Karasiak, N. Dzetsaka Qgis Classification Plugin; 2016. [Google Scholar]
- Landis, J.R.; Koch, G.G. A One-Way Components of Variance Model for Categorical Data. Biometrics 1977, 33, 671. [Google Scholar] [CrossRef]
- Rwanga, S.S.; Ndambuki, J.M. Accuracy Assessment of Land Use/Land Cover Classification Using Remote Sensing and GIS. Int. J. Geosci. 2017, 8, 611–622. [Google Scholar] [CrossRef]
- Natteshan, N.V.S.; Kumar, N. Effective SAR Image Segmentation and Classification of Crop Areas Using MRG and CDNN Techniques. Eur. J. Remote Sens. 2020, 53, 126–140. [Google Scholar] [CrossRef]
- Bhosle, K.; Musande, V. Evaluation of Deep Learning CNN Model for Land Use Land Cover Classification and Crop Iden-tification Using Hyperspectral Remote Sensing Images. J. Indian Soc. Remote. Sens. 2019, 47, 1949–1958. [Google Scholar] [CrossRef]
- Kussul, N.; Lavreniuk, M.; Skakun, S.; Shelestov, A. Deep Learning Classification of Land Cover and Crop Types Using Remote Sensing Data. IEEE Geosci. Remote Sens. Lett. 2017, 14, 778–782. [Google Scholar] [CrossRef]
- Kaur, P.; Kale, K. Deep Convolutional Neural Network Models for Land Use and Land Cover Identification Using Dataset Created from LISS-IV Satellite ImagesInt. J. Sci. Res. Comput. Sci. Eng. Inf. Technol. 2018, 3, 2123–2134. [Google Scholar]
- Yuan, Q.; Shen, H.; Li, T.; Li, Z.; Li, S.; Jiang, Y.; Xu, H.; Tan, W.; Yang, Q.; Wang, J.; et al. Deep Learning in Environmental Remote Sensing: Achievements and Challenges. Remote Sens. Environ. 2020, 241, 111716. [Google Scholar] [CrossRef]
- Arantes, B.L.; Castro, N.R.; Gilio, L.; Polizel, J.L.; Silva Filho, D.F. da Urban Forest and per Capita Income in the Mega-City of Sao Paulo, Brazil: A Spatial Pattern Analysis. Cities 2021, 111, 103099. [Google Scholar] [CrossRef]
- Lombardo, M.A. Ilha de Calor Nas Metrópoles: O Exemplo de São Paulo; Geografia, T.e.R., de Lalekla, S.A., Eds.; Hucitec Editora Comércio e Indústria: São Paulo, Brazil, 1985; 244p. [Google Scholar]
- de Groot, R.; Brander, L.; van der Ploeg, S.; Costanza, R.; Bernard, F.; Braat, L.; Christie, M.; Crossman, N.; Ghermandi, A.; Hein, L.; et al. Global Estimates of the Value of Ecosystems and Their Services in Monetary Units. Ecosyst. Serv. 2012, 1, 50–61. [Google Scholar] [CrossRef]
- Lino, J.d.S.; Aquino, A.R.d. A Study of Contaminated Land in São Paulo City, Brazil and Mainly Adopted Remediation Process Face a Deficient Database. Int. J. Environ. Pollut. Remediat. 2019, 7, 23–35. [Google Scholar] [CrossRef]
- Dennis, L. Annual Update: Top Governmental and Not-for-Profit Accounting and Auditing Issues Facing CPAs; John Wiley & Sons: Hoboken, NJ, USA, 2020. [Google Scholar] [CrossRef]
- Nowak, D.J.; Hirabayashi, S.; Doyle, M.; McGovern, M.; Pasher, J. Air Pollution Removal by Urban Forests in Canada and Its Effect on Air Quality and Human Health. Urban For. Urban Green. 2018, 29, 40–48. [Google Scholar] [CrossRef]
- Jim, C.Y.; Chen, W.Y. Ecosystem Services and Valuation of Urban Forests in China. Cities 2009, 26, 187–194. [Google Scholar] [CrossRef]
- Bolund, P.; Hunhammar, S. Ecosystem Services in Urban Areas. Ecol. Econ. 1999, 29, 293–301. [Google Scholar] [CrossRef]
- Streiling, S.; Matzarakis, A. Influence of Single and Small Clusters of Trees on the Bioclimate of a City: A Case Study. J. Arboric. 2003, 29, 309–316. [Google Scholar]
- Haddad, E.A.; Teixeira, E. Economic Impacts of Natural Disasters in Megacities: The Case of Floods in São Paulo, Brazil. Habitat Int. 2015, 45, 106–113. [Google Scholar] [CrossRef]
- Xu, Z.; Xu, J.; Yin, H.; Jin, W.; Li, H.; He, Z. Urban River Pollution Control in Developing Countries. Nat. Sustain. 2019, 2, 158–160. [Google Scholar] [CrossRef]
- Adas, M.A.A.; Hardt, E.; Miraglia, S.G.e.K.; Semensatto, D. Reforest or Perish: Ecosystem Services Provided by Riparian Vegetation to Improve Water Quality in an Urban Reservoir (São Paulo, Brazil). Sustentabilidade Em Debate 2020, 11, 226–243. [Google Scholar] [CrossRef]
- McPherson, E.G.; Simpson, J.R.; Xiao, Q.; Wu, C. Million Trees Los Angeles Canopy Cover and Benefit Assessment. Landsc. Urban Plan. 2011, 99, 40–50. [Google Scholar] [CrossRef]
- Soares, A.L.; Rego, F.C.; McPherson, E.G.; Simpson, J.R.; Peper, P.J.; Xiao, Q. Benefits and Costs of Street Trees in Lisbon, Portugal. Urban For. Urban Green. 2011, 10, 69–78. [Google Scholar] [CrossRef]
- Siriwardena, S.; Boyle, K.; Holmes, T.; Wiseman, P. The Implicit Value of Tree Cover in the U.S.: A Meta-Analysis of Hedonic Property Value Studies. Ecol. Econ. 2016, 128, 68–76. [Google Scholar] [CrossRef]
- Jennings, V.; Bamkole, O. The Relationship between Social Cohesion and Urban Green Space: An Avenue for Health Promotion. Int. J. Environ. Res. Public Health 2019, 16, 452. [Google Scholar] [CrossRef]
- Hansen, R.; Olafsson, A.S.; van der Jagt, A.P.N.; Rall, E.; Pauleit, S. Planning Multifunctional Green Infrastructure for Compact Cities: What Is the State of Practice? Ecol. Indic. 2019, 96, 99–110. [Google Scholar] [CrossRef]
- Mitchell, R.; Popham, F. Effect of Exposure to Natural Environment on Health Inequalities: An Observational Population Study. Lancet 2008, 372, 1655–1660. [Google Scholar] [CrossRef] [PubMed]
- Ghahramani, M.; Galle, N.J.; Ratti, C.; Pilla, F. Tales of a City: Sentiment Analysis of Urban Green Space in Dublin. Cities 2021, 119, 103395. [Google Scholar] [CrossRef]
- Liu, L.; Qu, H.; Ma, Y.; Wang, K.; Qu, H. Restorative Benefits of Urban Green Space: Physiological, Psychological Restoration and Eye Movement Analysis. J. Environ. Manag. 2022, 301, 113930. [Google Scholar] [CrossRef]
- Endreny, T.A. Strategically Growing the Urban Forest Will Improve Our World. Nat. Commun. 2018, 9, 1160. [Google Scholar] [CrossRef] [PubMed]
- Endreny, T.; Santagata, R.; Perna, A.; Stefano, C.D.; Rallo, R.F.; Ulgiati, S. Implementing and Managing Urban Forests: A Much Needed Conservation Strategy to Increase Ecosystem Services and Urban Wellbeing. Ecol. Modell. 2017, 360, 328–335. [Google Scholar] [CrossRef]
- São Paulo. Lei No 16.050, de 31 de Julho de 2014. Política de Desenvolvimento Urbano e o Plano Diretor Estratégico Do Município de São Paulo; 2014.
- United Nations Sustainable Development Goals. Available online: https://sdgs.un.org/goals (accessed on 26 September 2022).
- Guidi Nissim, W.; Labrecque, M. Reclamation of Urban Brownfields through Phytoremediation: Implications for Building Sustainable and Resilient Towns. Urban For. Urban Green. 2021, 65, 127364. [Google Scholar] [CrossRef]
- Ucella-Filho, J.G.M.; Lucas, F.M.F.; Almeida, D.M.; Silva, B.R.F.; Almeida, D.M.; Brito, D.Y.O.; Azevêdo, T.K.B. Biodiverse Neighborhoods: An Ex-Situ Conservation Tool. Ornam. Hortic. 2022, 28, 8–18. [Google Scholar] [CrossRef]
- Zhang, Z.; Meerow, S.; Newell, J.P.; Lindquist, M. Enhancing Landscape Connectivity through Multifunctional Green Infrastructure Corridor Modeling and Design. Urban For. Urban Green. 2019, 38, 305–317. [Google Scholar] [CrossRef]
- Cabe, S. Paying for Parks: Eight Models for Funding Urban Green Space; Commission for Architecture and the Built Environment: London, UK, 2006; 6p. [Google Scholar]


Disclaimer/Publisher’s Note: The statements, opinions and data contained in all publications are solely those of the individual author(s) and contributor(s) and not of MDPI and/or the editor(s). MDPI and/or the editor(s) disclaim responsibility for any injury to people or property resulting from any ideas, methods, instructions or products referred to in the content. |
© 2023 by the authors. Licensee MDPI, Basel, Switzerland. This article is an open access article distributed under the terms and conditions of the Creative Commons Attribution (CC BY) license (https://creativecommons.org/licenses/by/4.0/).