Article

Evaluation of Ecosystem Service Value of Homegarden in Chengdu Plain and Relevant Protection Strategy

Institute of Mountain Hazards and Environment, Chinese Academy of Sciences, Chengdu 610299, China
*
Author to whom correspondence should be addressed.
Forests 2023, 14(9), 1754; https://doi.org/10.3390/f14091754
Submission received: 8 July 2023 / Revised: 18 August 2023 / Accepted: 24 August 2023 / Published: 30 August 2023
(This article belongs to the Section Forest Economics, Policy, and Social Science)

Abstract

:
The Homegarden (HG) in Chengdu Plain is an important agricultural heritage in China, and is viewed as a sustainable land use pattern. HGs are damaged continuously under the backdrop of urbanization and land use changes, thus influencing ecosystem services and residents’ welfare. This study investigates the distribution characteristics of HGs in Chengdu and their ecosystem service value and proposes HG protection strategies on this basis. Results demonstrate that (1) there are 71,892 HGs in Chengdu, covering an area of 558.70 km2. The average density is 9.94 HGs/km2. (2) The total ecosystem service value of HGs is about USD 30562.70 million/year. Among them, the material product, regulating services, biodiversity maintenance value, and cultural services account for 15.46%, 37.90%, 14.19%, and 32.45%, respectively. (3) The number, area, and ecosystem service value of HGs in Chengdu decreased by 11.45%, 20.89%, and 6.92% in the last ten years, respectively. (4) The area of the extremely important protection zone of HGs accounts for 21.14%. We suggest giving priority attention to these areas. Protection strategies of HGs include, among others, formulating HG protection plans, keeping traditional features, maintaining biodiversity, and increasing the economic income of residents.

1. Introduction

Homegardens (HGs) exist widely around the world, and they are mainly composed of forest ecological space, agricultural production space, and residential living space [1]. They are viewed as the agroforestry system of sustainable development [2]. HGs provide important ecosystem services, such as agricultural and forest product supply, climate regulation, carbon storage, environmental cleaning, pest control and pollination, biodiversity protection, and landscape cultural services [3,4,5,6,7,8,9,10,11,12]. HGs improve the welfare of residents [7,13,14]. Ecosystem services assessment is a research hotspot, and evaluation frameworks such as MEA, GEO, and ESPA have been established as well as assessment methods such as InVEST, ARIES, and MIMES [15]. However, small-scale mixed environmental ecosystem services assessment methodologies need to be strengthened. Some studies have constructed a framework of ecosystem services in small-scale mixed environments (including HGs, parks, etc.) from provisioning services, regulation, culture and support services [7], and used statistical data, actual observations, model simulations, surrogate factors, public participatory geographic information systems (PPGISs), and Perceived Sensory Dimensions (PSDs) for quantitative assessment [3,5,16,17]. The landform, altitude, temperature, and precipitation of a region determine the composition structure and functions of HGs [18], thus resulting in differences in ecosystem service supply among HGs [19]. Meanwhile, the nationality, gender, age, income, and educational background of residents in HGs decide the ecosystem service demands of HGs [20]. Studying ecosystem service demands of HGs are conducive to the high-efficiency protection of an HG.
In particular, there are relatively few forests in plain areas. Although an HG contributes more important benefits in plain areas, it is easily disturbed by human activities [21]. Chengdu Plain is one of four major plains in China. HGs in Chengdu Plain have unique composition and structural features. HGs form a composite ecosystem that is mainly composed of a farm house, forest land, and other production and living factors [22,23]. The area of an HG is not large and its shape is approximately round (Figure 1). Hence, the HG has another Chinese name of “Linpan”, which means that the HG distributes in plain areas as plate-like forest land [24]. There are a lot of HGs in Chengdu Plain, and they form the global unique agricultural landscape with farmland and wetland ecosystems. The HG has been a symbol of agricultural civilization and ecological resources in Chengdu Plain for more than 3000 years [24,25,26], and is viewed as the land use pattern of sustainable development [27,28]. In 2020, the HG system in Chengdu Plain was enlisted as an important agricultural heritage of China. However, many HGs have suffered different degrees of damage with changes in urbanization and land production mode [29,30,31,32]. This is disadvantageous for regional sustainable development. The local government in Chengdu plain attaches great importance to the protection and utilization of HGs and plans to complete more than 3000 HG protection and restoration projects from 2020 to 2025. At present, the protection and utilization of HGs pay more attention to the value of architecture and sociology, and there is little research on the characteristics and ecosystem services. Therefore, it is necessary to strengthen the ecosystem protection and management of HG, and improve ecosystem service values [33].
In fact, the ecosystem services of HGs are often ignored or underestimated [34]. According to the United Nations goals of SDG11.4 (Further Efforts to Protect and Defend the World Important Culture and Natural Heritage) and SDG11.7 (Green Public Spaces which make everyone feel safe, inclusive and barrier free), HGs deserve better understanding and protection [35,36]. Therefore, the research objectives of this study are (a) determining the number and changes of HGs in Chengdu Plain; (b) constructing an evaluation framework of HG ecosystem services in Chengdu Plain and estimating ecosystem service values; and (c) proposing an HG protection zone division in Chengdu Plain.

2. Study Area and Methods
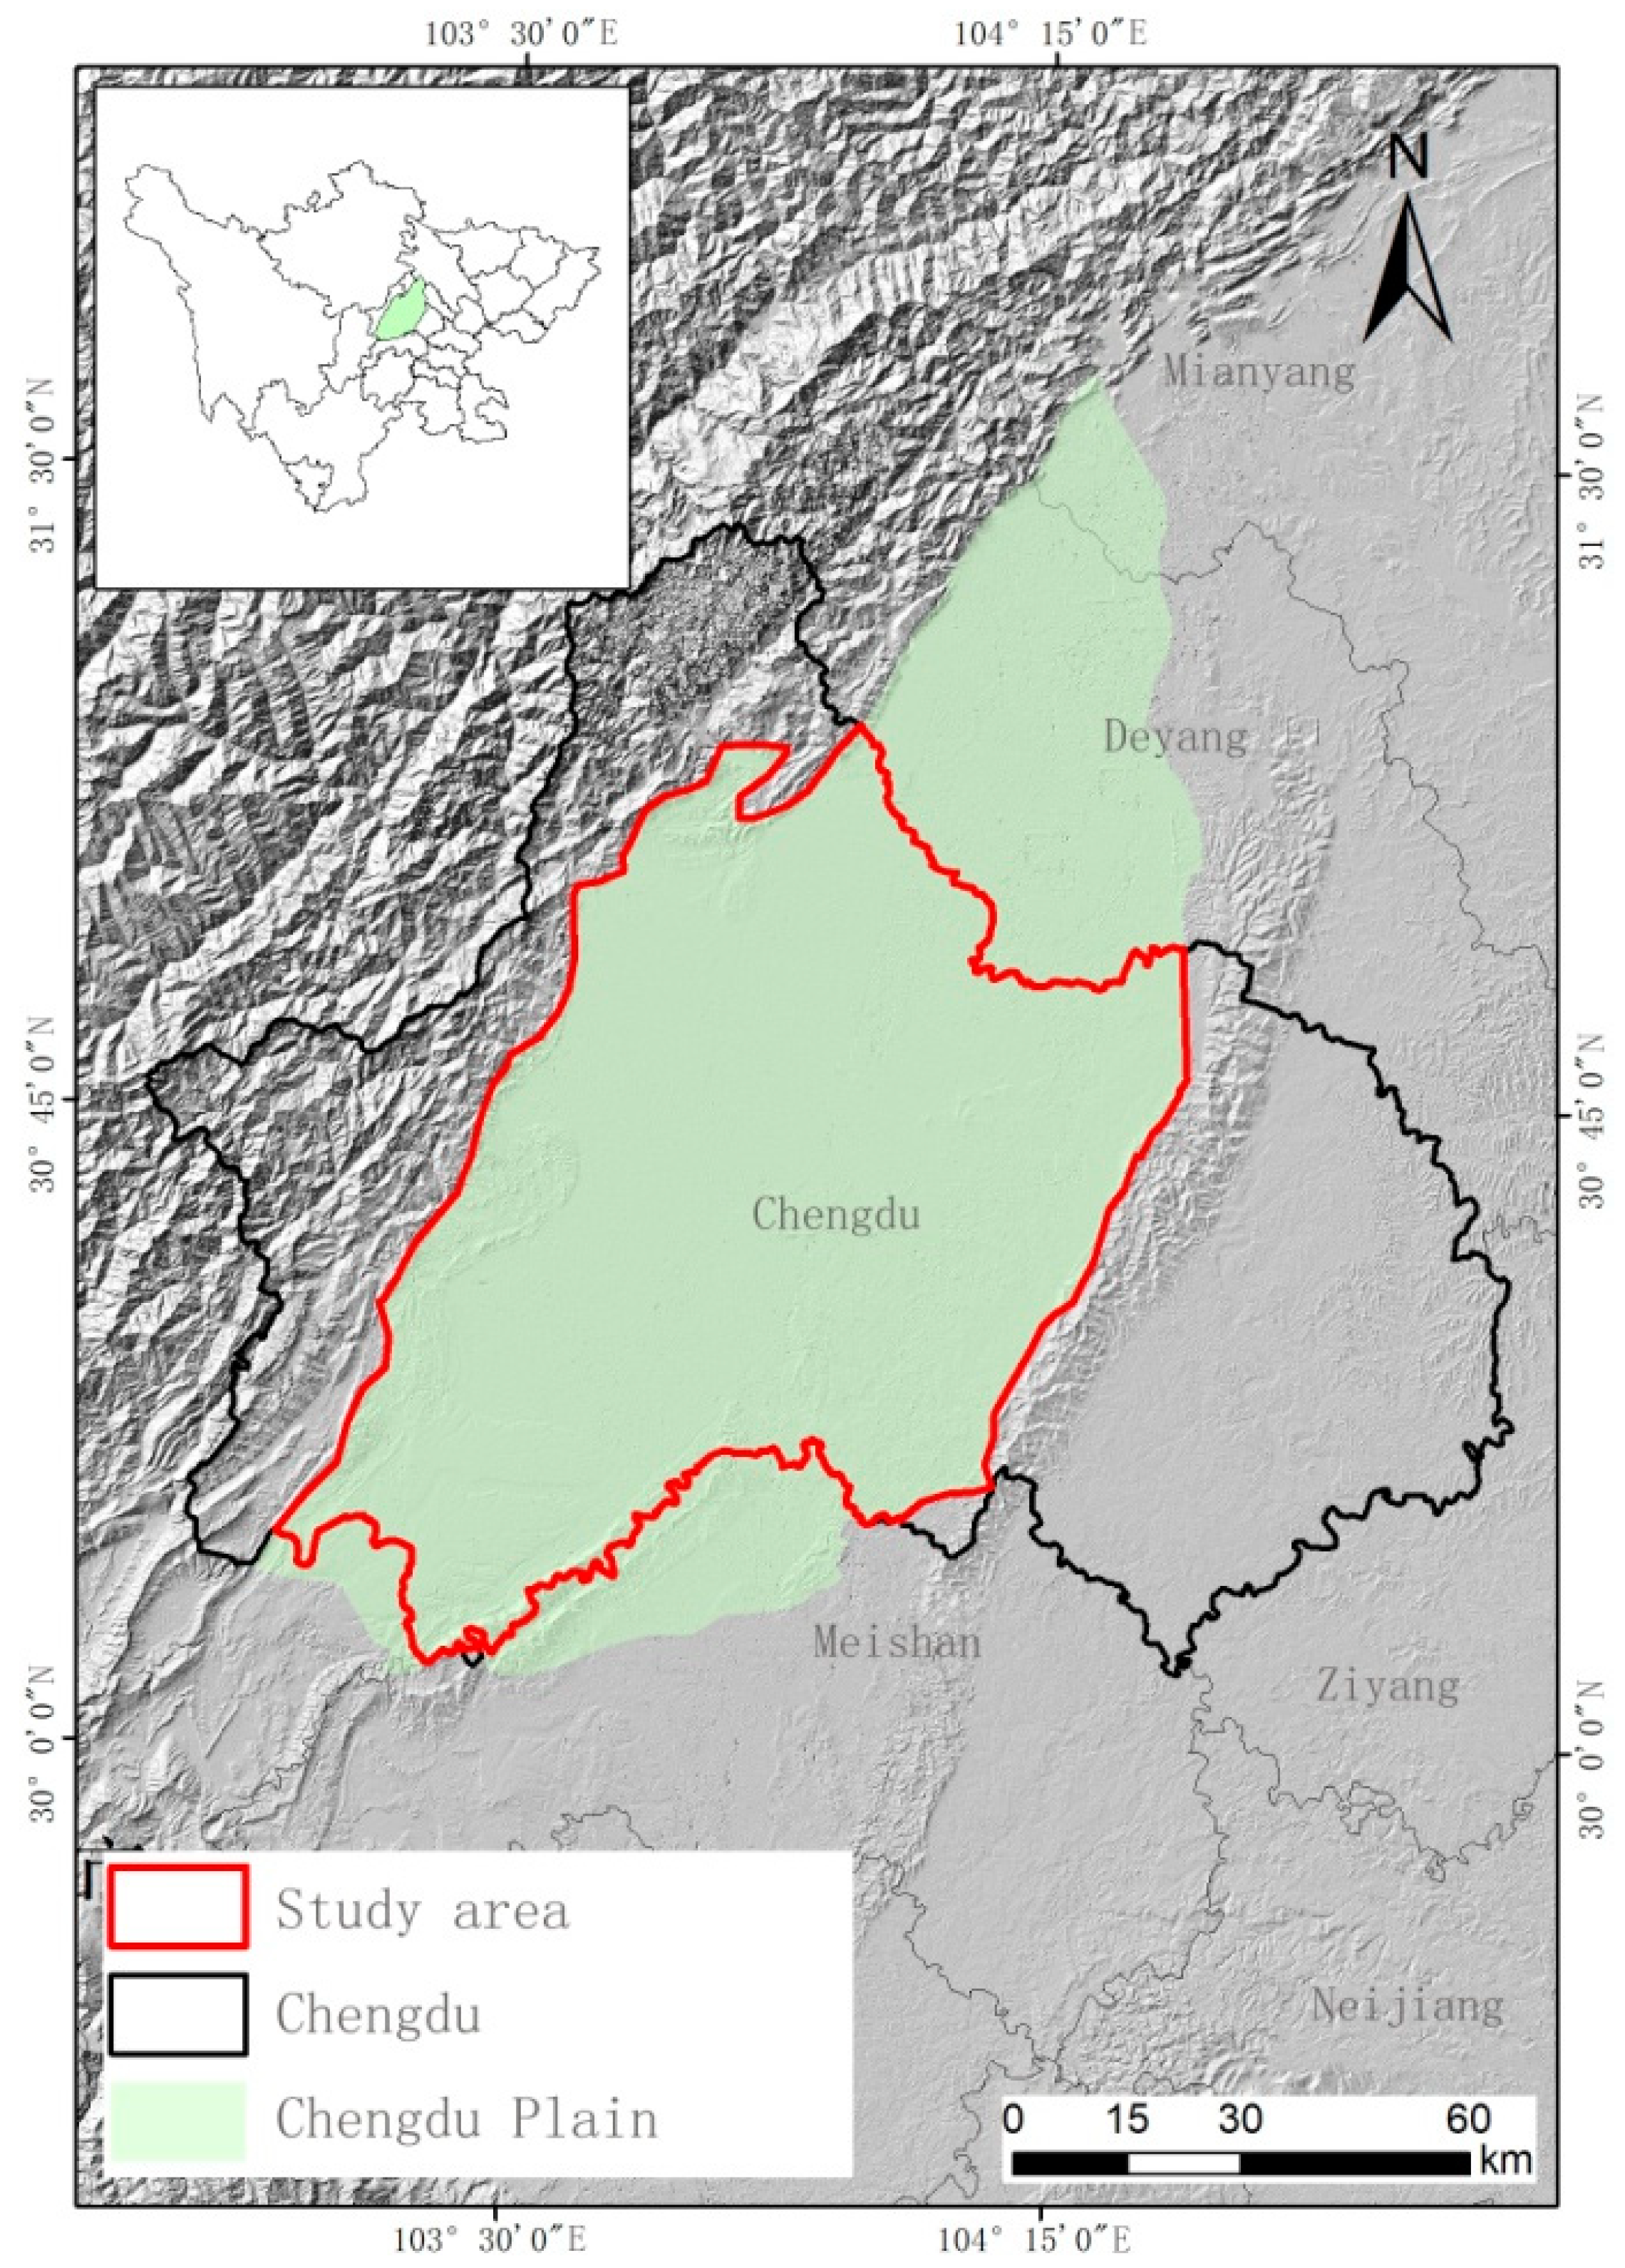
2.1. Study Area

HGs in Chengdu Plain are mainly distributed in the Minjiang River between Qionglai Mountain and Longquan Mountain in Sichuan Basin, as well as the alluvial plain of Tuo River (103°00′–104°30′ E, 30°00′–31°40′ N) (Figure 2). The distribution area of HGs covers a length of 200 km from south to north, and a width of 40~70 km, with an area of about 18,800 km2. Chengdu Plain involves Chengdu City, Mianyang City, Deyang City, Meishan City, and Ya’an City of Sichuan Province, with 71.35% of the area distributed in Chengdu City. The total population in Chengdu Plain exceeds 20 million, including about 6 million in rural population. Specifically, 72.40% of rural residents live in HGs. The Chengdu Plain has flat terrains, fertile soils, rich water resources, and cultivated land resources. It is one of the major grain-producing areas in China and is called the “Land of Abundance”.

2.2. Research Methods

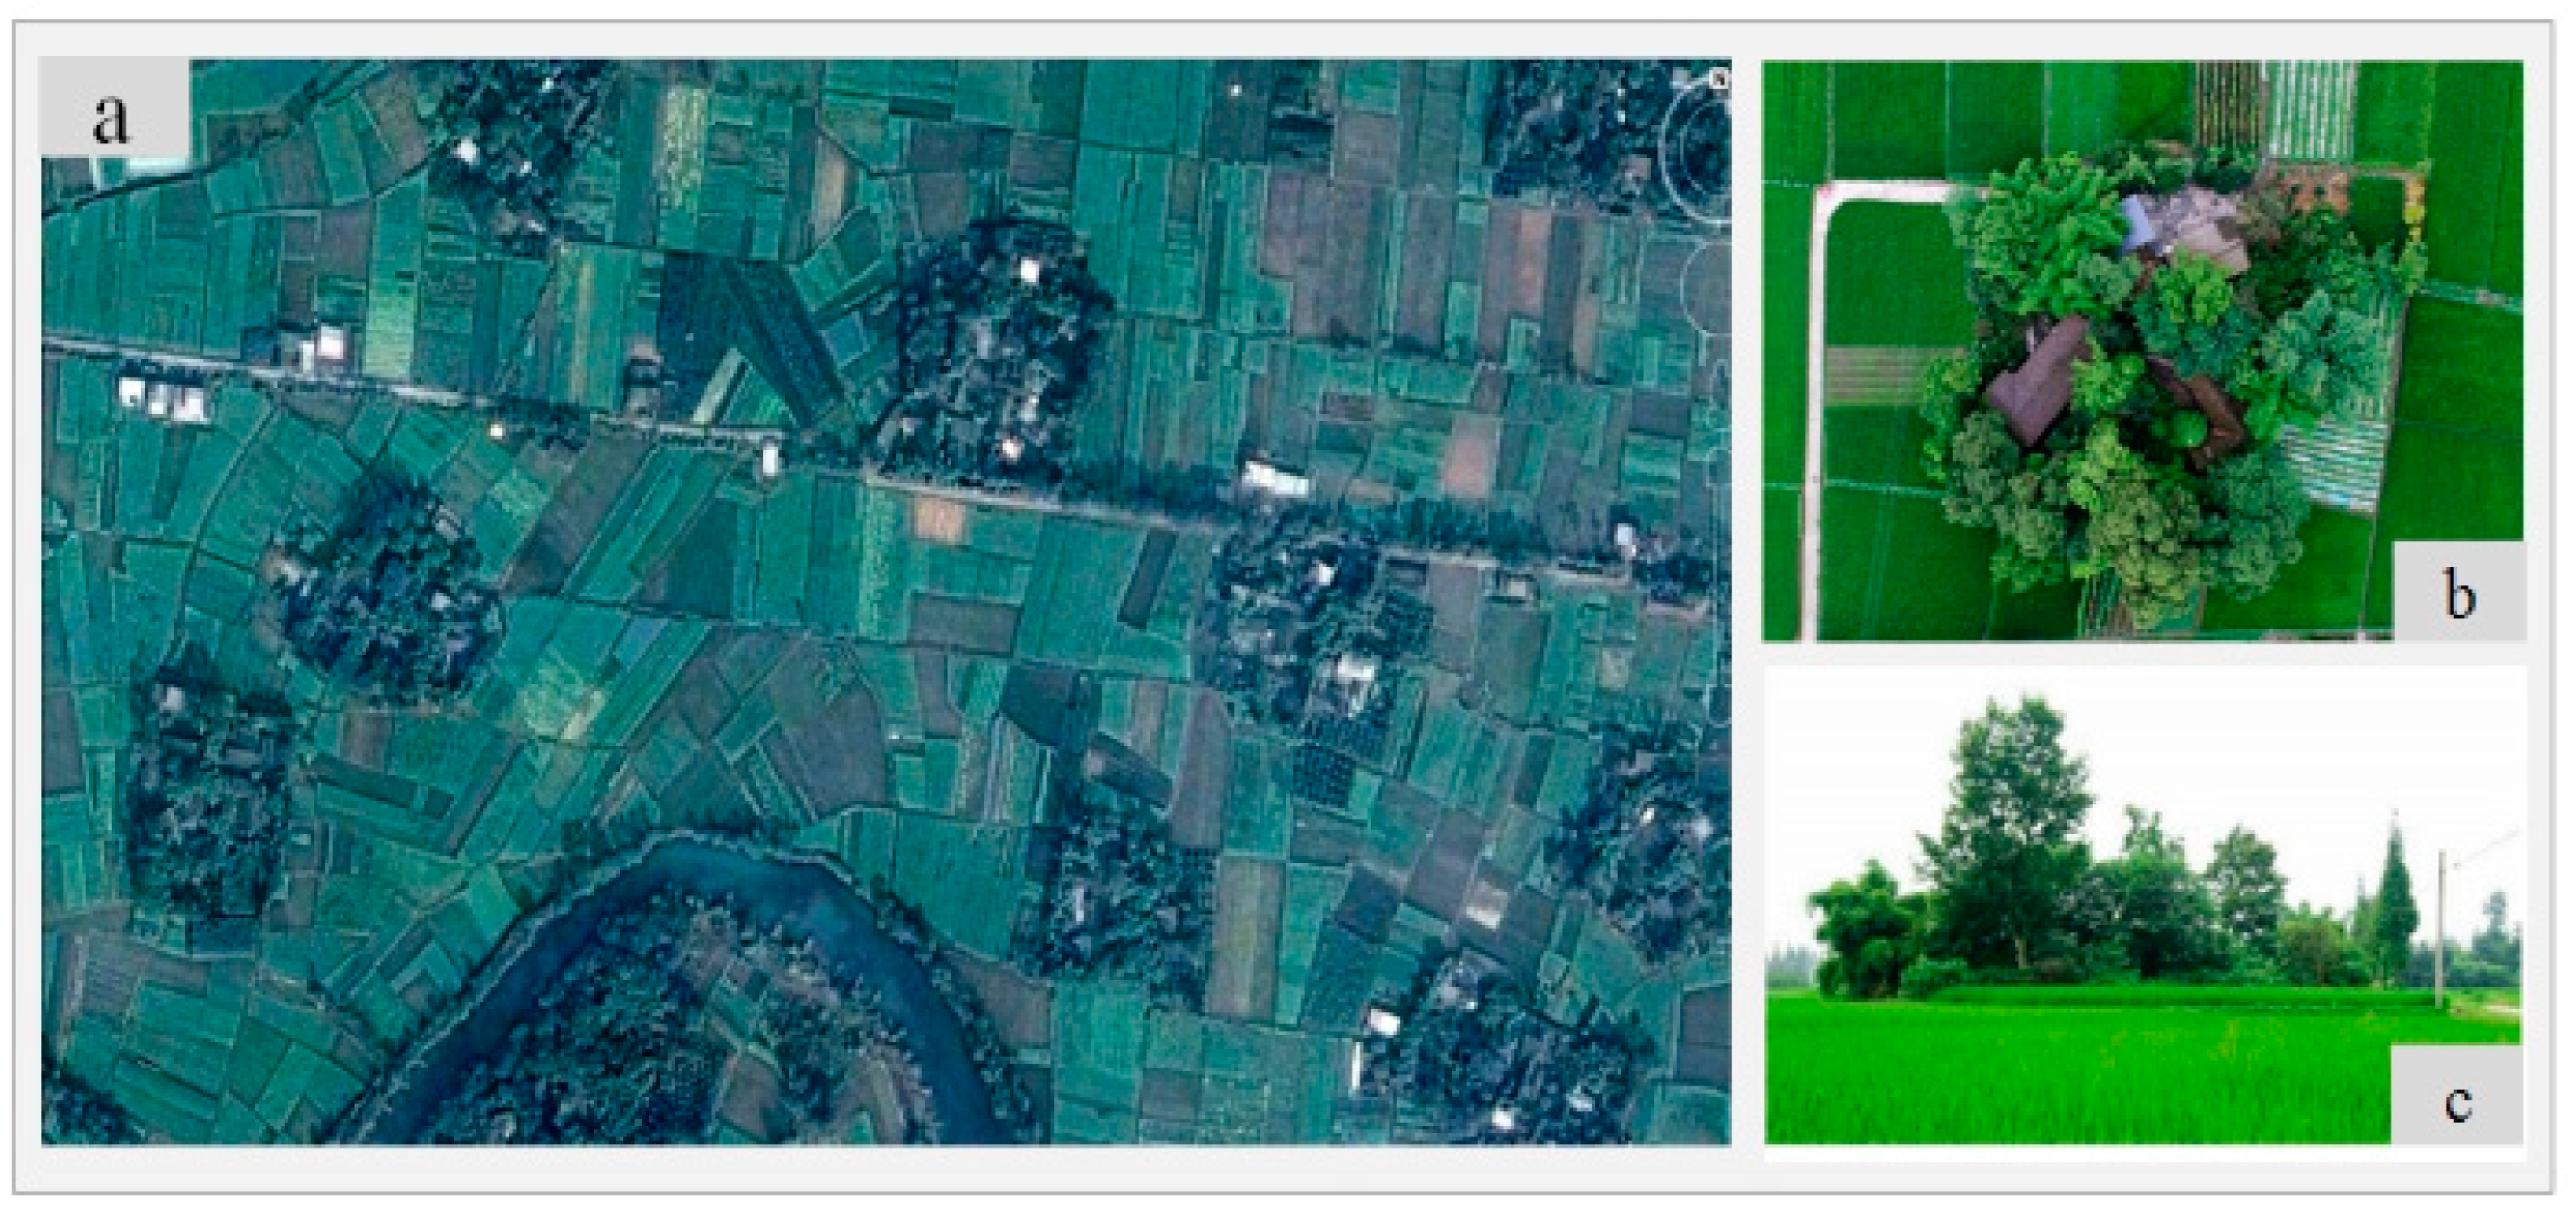
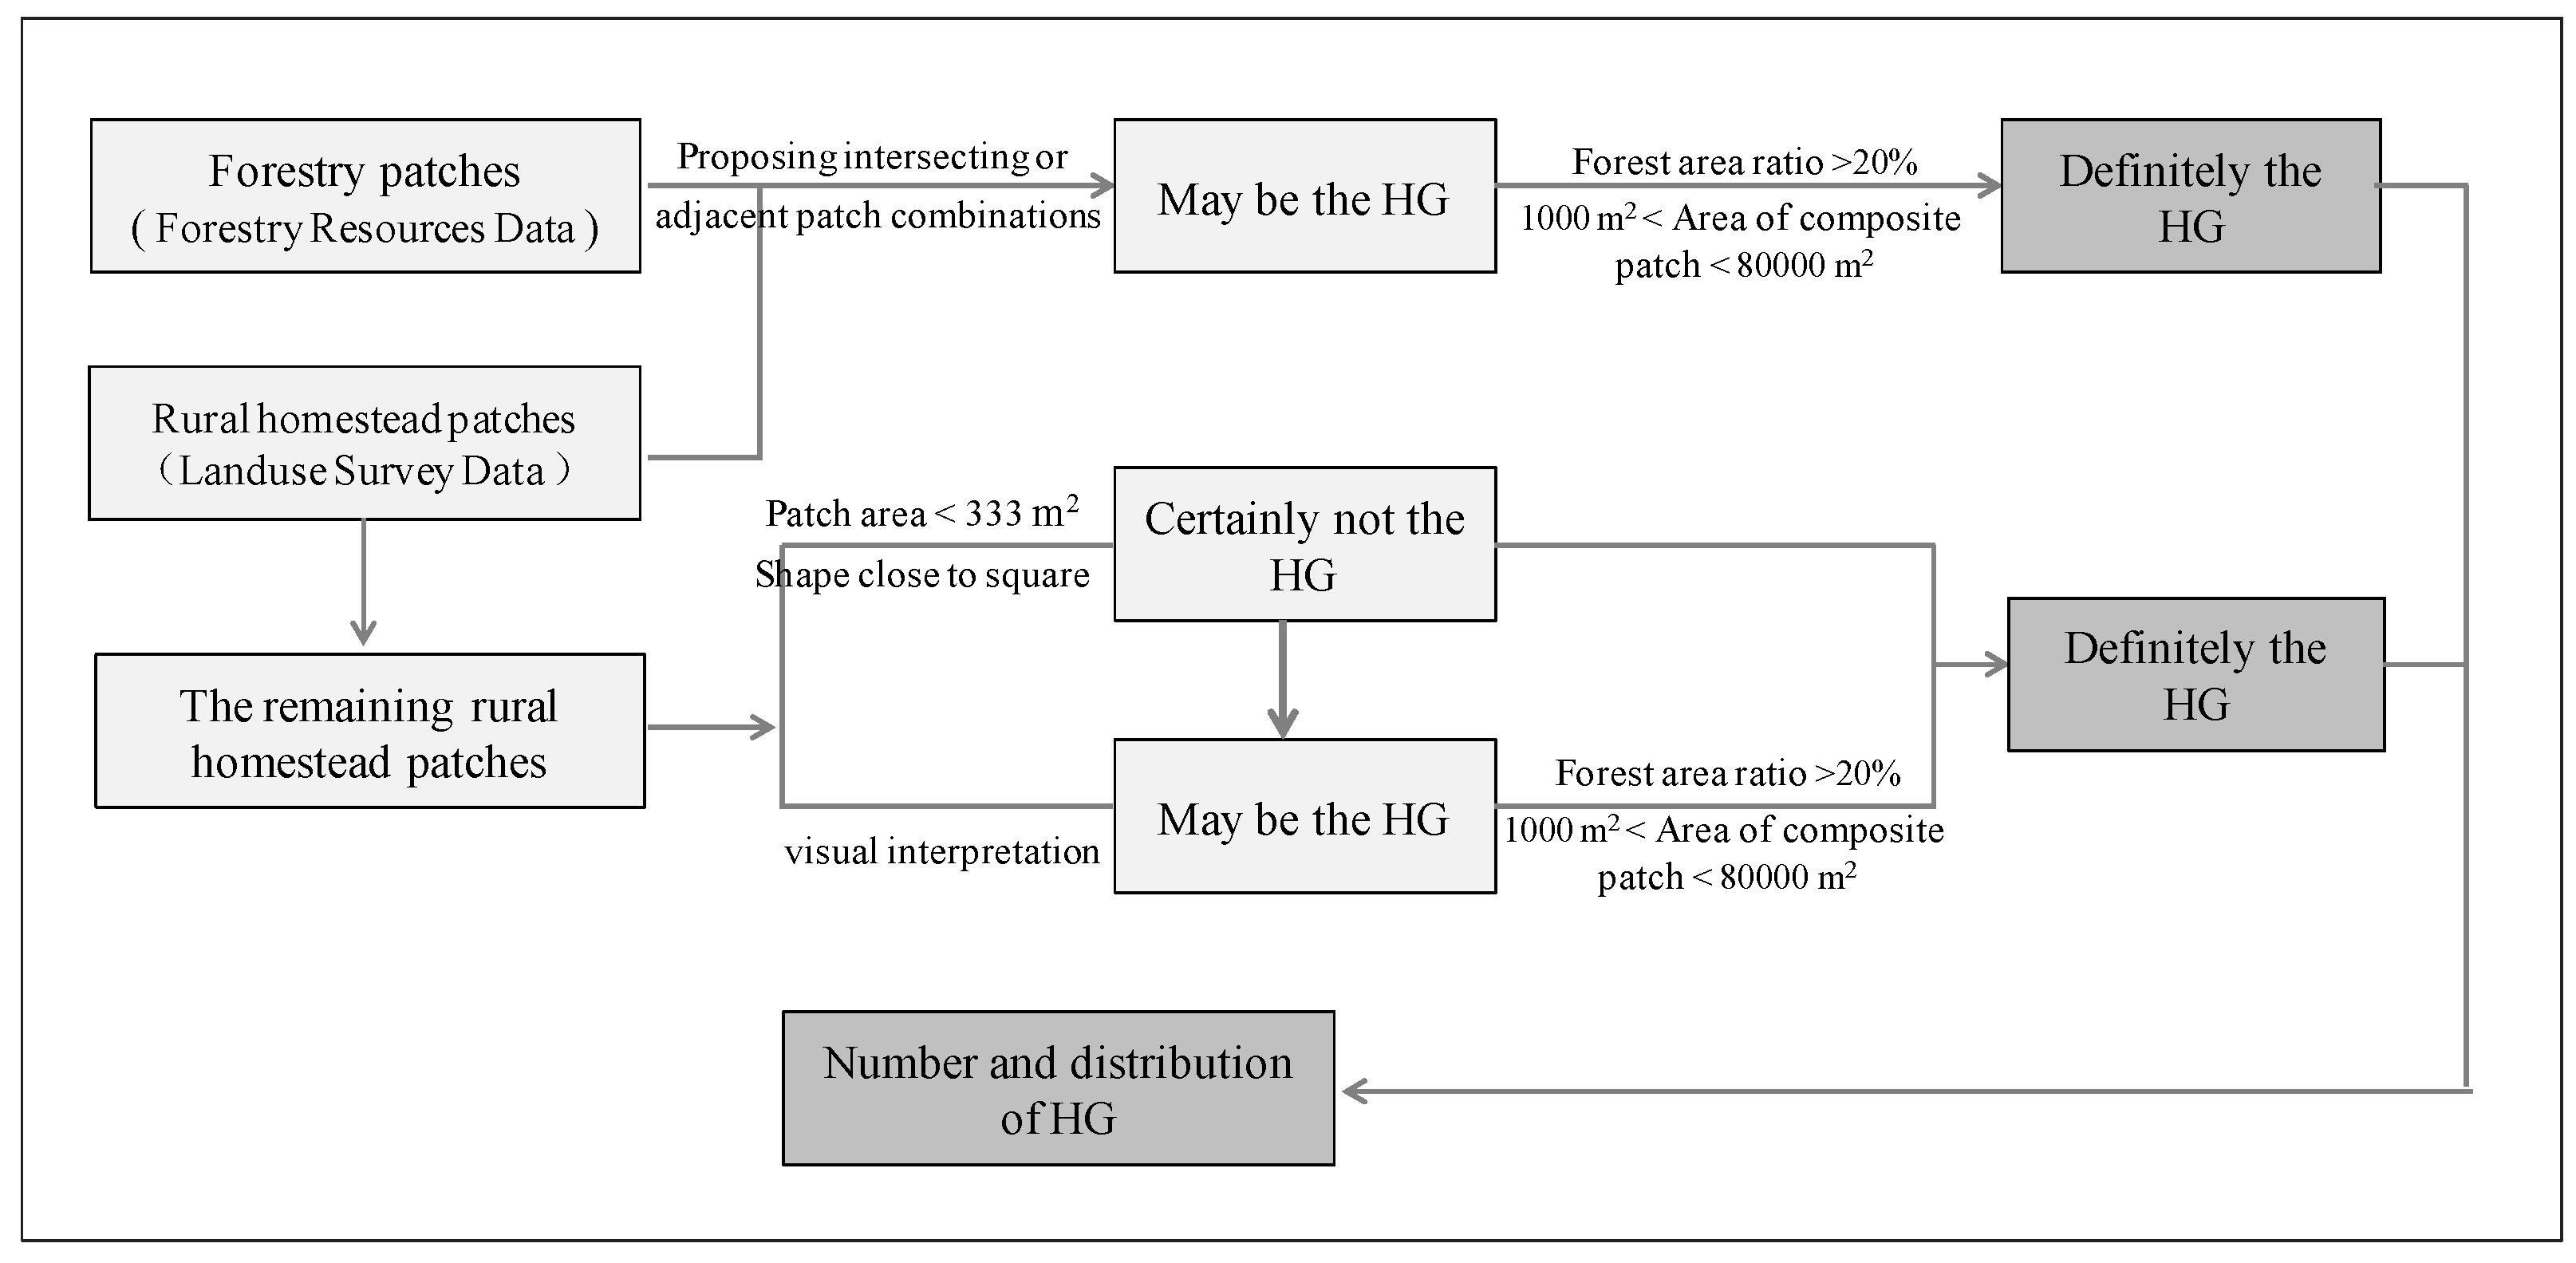
2.2.1. Interpretation of HGs

(1)
Establishing interpretation rules
Pi County, a representative in HG distribution, was used as the research object. High-resolution Google Earth images from 2018 were downloaded. The HG interpretation rules were established using the visual interpretation method and were combined with unmanned aerial vehicle (UAV) photography and field survey data: forest land and rural residence patches intersect or are adjacent; 1000 m2 ≤ combination area ≤ 80,000 m2; forest area ratio is higher than 20%; and shapes shall not be close to square (it is close to square only when rural residence or vegetation coverage is too low). A total of 5964 HG patches were extracted (Figure 3). To verify the interpretation accuracy and applicability of interpretation rules, several 2 km × 2 km windows were produced in the map of Pi County. Ten window areas were chosen randomly among them. Field sampling verification of interpretation results was carried out using UAVs. A total of 164 HG sample points were selected, thus achieving an interpretation accuracy of 96%.
(2)
Extracting HG patches
Based on forest resource survey data and land resource survey data in Chengdu City in 2018 and 2008, an overlapping analysis of forest patches (coming from the forest resource survey data, geographical coordinates: GCS_WGS_1984, and projection coordinates: WGS_1984_Albers) and rural homestead patches was carried out to extract the HG patches of Chengdu City (Figure 4). Firstly, forest land conforming to HG interpretation rules and rural homestead patch combinations was judged as HG. Secondly, since forest resource data only contain forest patches with an area larger than 667 m2 (1 mu), and the forest area of some HGs is smaller than 667 m2, the remaining rural residence patches were used as the analysis objects. Patches with areas ≤333 m2 and shapes close to square (analyzed using the feature envelope to polygon tool of ArcGIS) were directly judged as non-HGs. Subsequently, the rest of the rural residence patches were superposed onto Google Earth images. The surrounding forest lands were extracted by combining with visual interpretation. If the rural residence patch conforms to the interpretation rules of HG, it is judged as HG.
(3)
Verification of interpretation results
Visual interpretation results of HGs in Pi County of Chengdu City were used to verify the HG patches determined by the above method. The HG patch extraction accuracy of this method was about 92.4%, indicating that the extracted HG data conformed to practical situations. HG areas can be divided into small-sized HGs (area ≤ 6000 m2), middle-sized HGs (6000 m2 < area < 12,000 m2), and large-sized HGs (area ≥ 12,000 m2) [24].

2.2.2. Evaluation of Ecosystem Service Values

(1)
Evaluation framework of HG ecosystem services
According to the evaluation framework of Millennium Ecosystem Assessment (MA), the evaluation framework of HG ecosystem services was constructed from four aspects; material product supply, regulating services, cultural services, and support services, with considerations for the relationship between HGs and the welfare of residents (Figure 5).
(2)
Evaluation methods of HG ecosystem services
According to the evaluation framework of HG ecosystem services, a quantitative evaluation of the main ecosystem services of HGs was carried out by combining associated existing studies (Table 1).

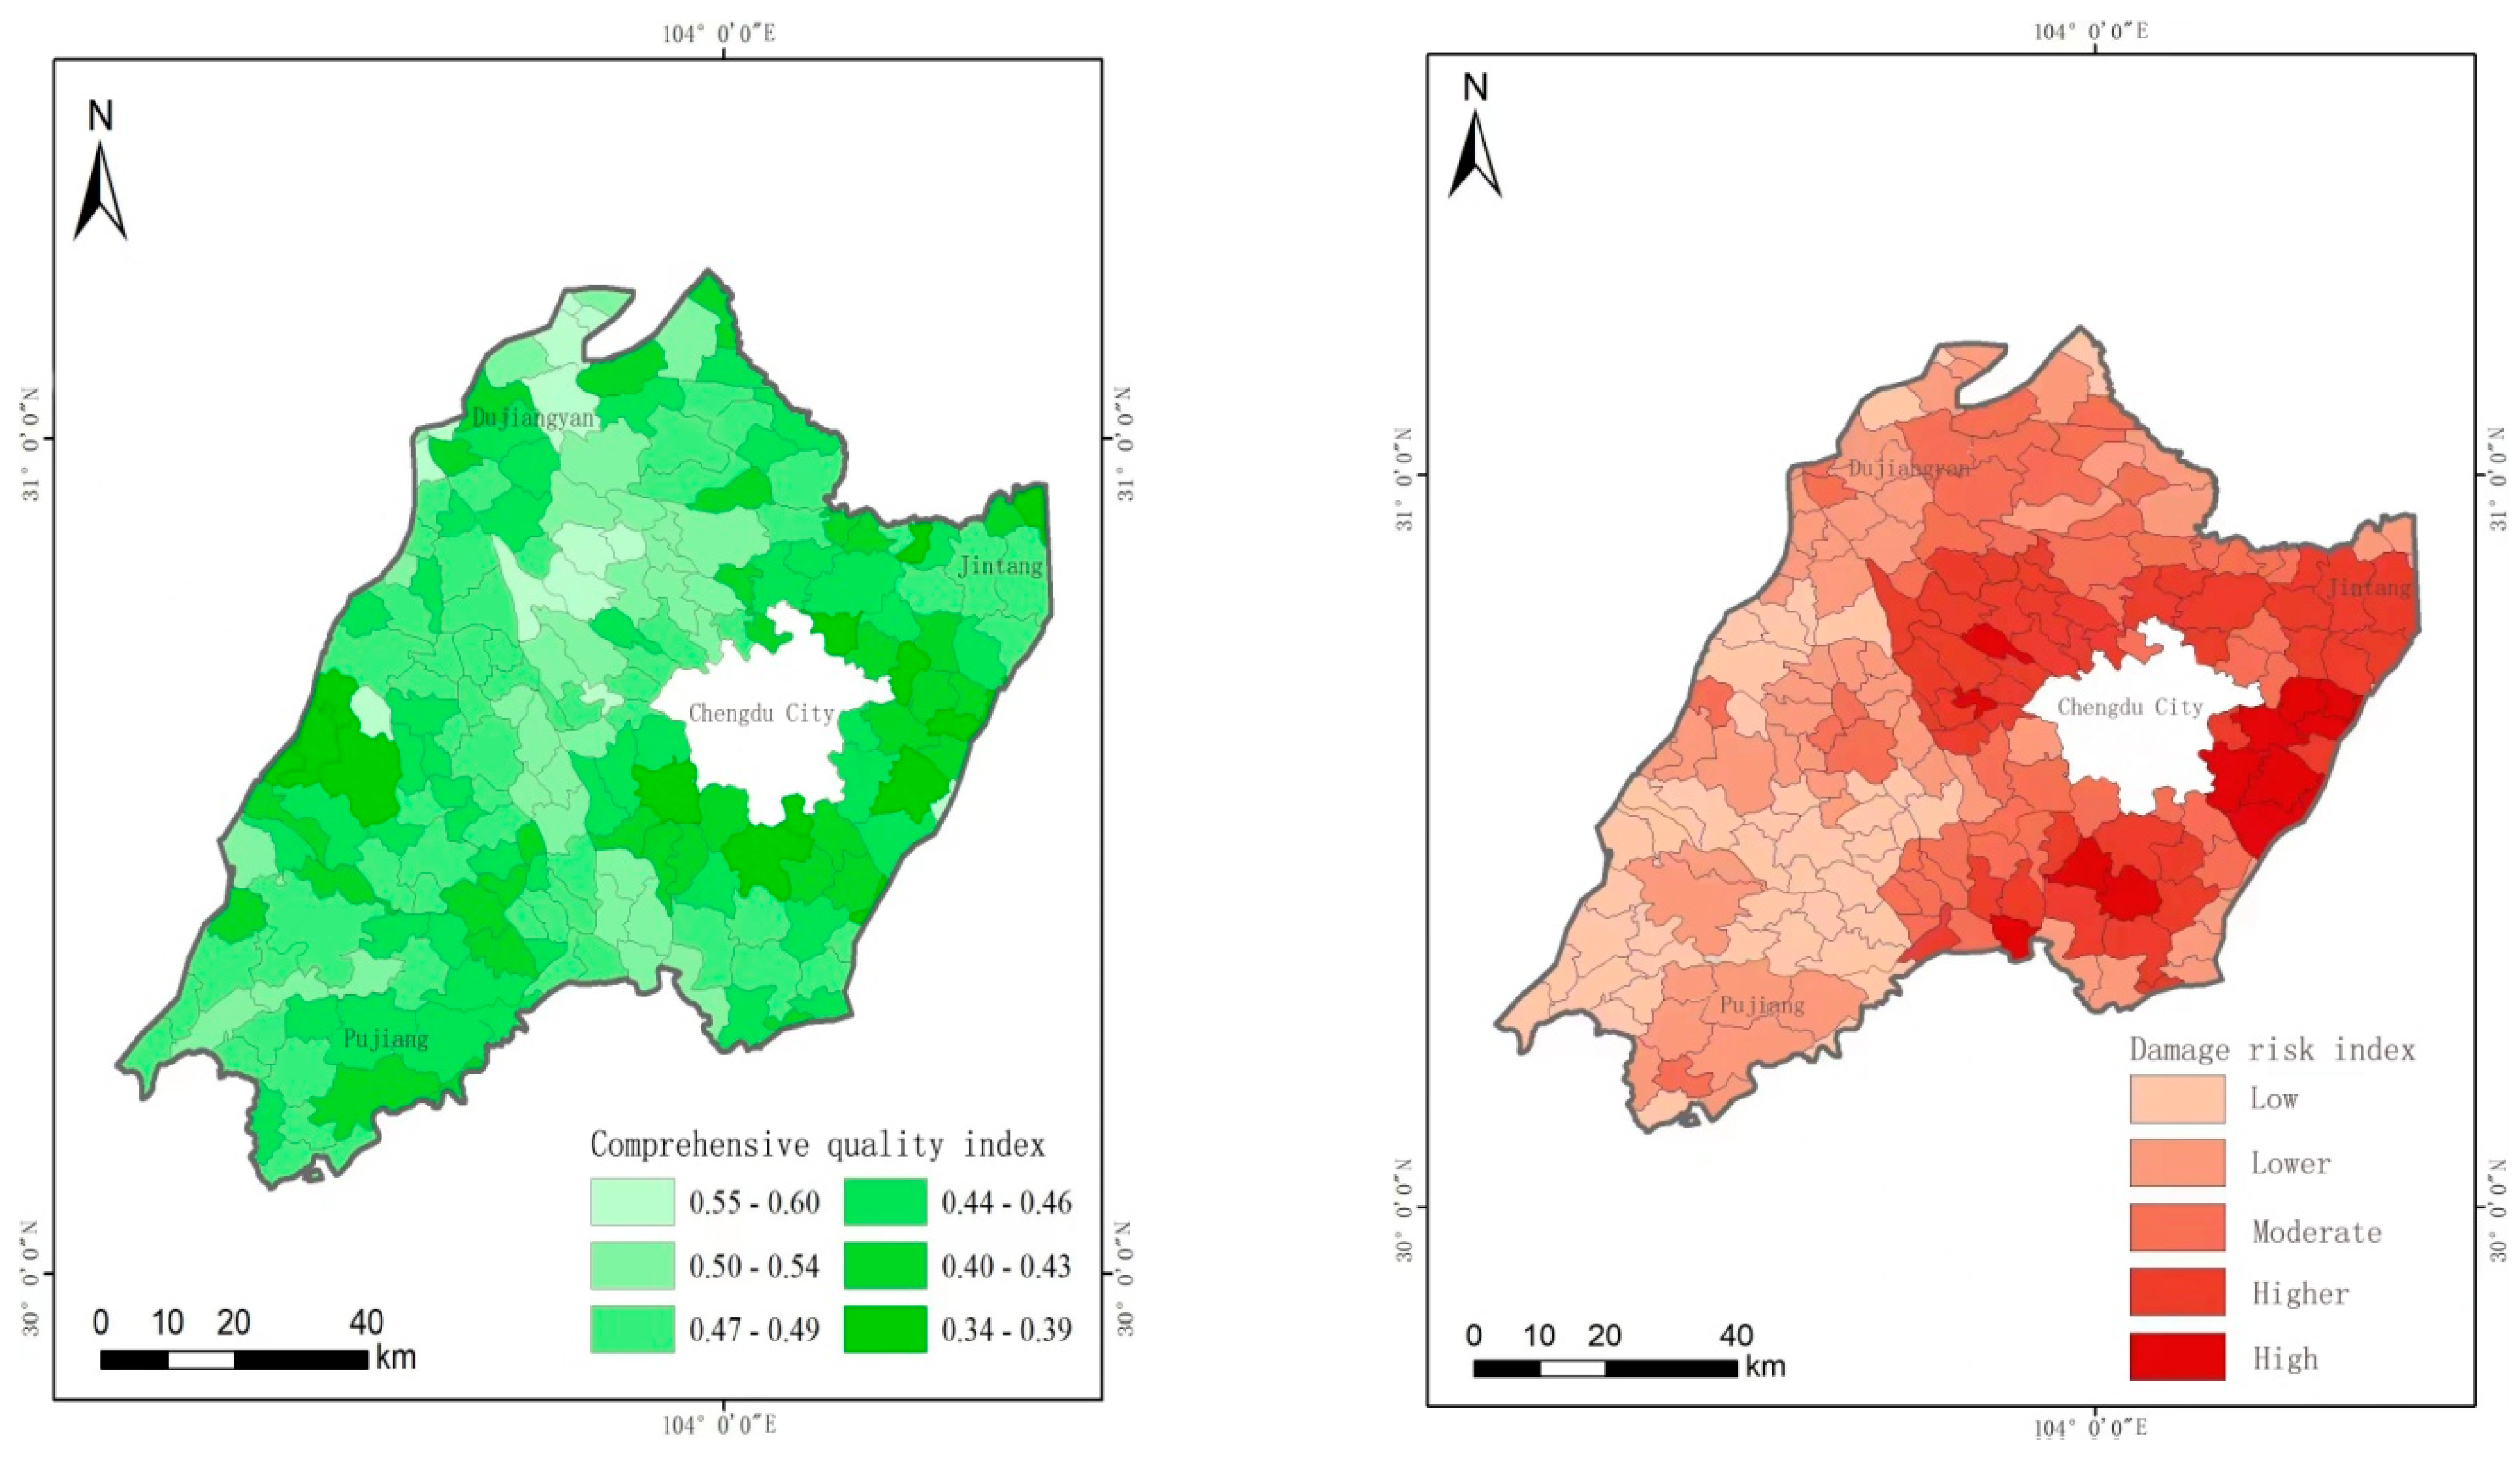
2.2.3. Zone Division of HG Based on Protection Importance

(1)
Comprehensive quality index evaluation of HG
The comprehensive quality index of HGs was calculated using the analytic hierarchy process (AHP). With reference to existing ecosystem quality evaluation indexes and comprehensive considerations for the stability and functions of the HG ecosystem [46], the comprehensive quality evaluation indexes of HGs were established according to the principles of scientificity, representativeness, dominance, and operability by combining experts’ opinions. The objective layer (Z) is the comprehensive quality index. The criteria layer (A) is the landscape stability and is mainly composed of average patch density (A1), average patch area (A2), and evenness index (A3). The criteria layer (B) is the ecological function and is mainly composed of headwater conservation value per unit area (B1), soil conservation value per unit area (B2), carbon sequestration value per unit area (B3), and biodiversity maintenance value (B4). The criteria layer (C) is a sociocultural function and is composed of the number of residents per unit area of HG (C1), cultural service value per unit area (C2), and material product value per unit area (C3).
A total of 15 experts engaged in HG studies and management were chosen for the consultation survey (including three professors and associate professors in universities, five graduate students, three administrative staff, and four primary-level workers). Factors of the criteria layer and index layer were paired for evaluation. The conventional 1–9 scores were used to evaluate the importance of each factor. If two factors in a pair were equally important, the pair valued at 1. If the former factor was slightly important, the pair was valued at 3. If the former factor was obviously important, the pair was valued at 5. If the former factor was strongly important, the pair was valued at 7. If the former one was extremely important, the pair was valued at 9. Specifically, 2, 4, 6, and 8 were intermediate values of adjacent judgments. The mean of pairwise judgments was calculated by collecting, evaluating, and summarizing the results of experts, based on the comprehensive judgment results acquired to construct the judgment matrix.
Secondly, indexes of the criteria layer (Z-ABC orders) and index layer (A-Ai, B-Bi, and C-Ci orders) were compared in pairs. A judgment matrix was constructed:
a i = A A B 2 1 2 C 1 B C 4 1 2 1 4 2 1 2 ,
The consistency of the judgment matrix was tested using AHP to ensure clear order of the judgment matrix. The specific calculation formula is
C I = λ m a x n n 1 ,
where CI is the consistency index, λmax is the maximum eigenvalue, and n is the number of orders of the matrix.
C R = C I R I ,
where CR is the consistency ratio, CI is the consistency index, and RI is the random consistency index. When the number of orders of the matrix is 3, RI equals 0.52. When the number of orders of the matrix is 4, RI equals 0.89. The consistency of the judgment matrix is considered acceptable when CR < 0.1.
According to the calculation, the CR values of all matrixes are smaller than 0.1, conforming to the consistency test conditions. The weights of indexes were determined using the geometric average vectors of matrixes. The calculation results are listed in Table 2 and Table 3.
Therefore, the comprehensive quality index of an HG is
Z = A × w a + B × w b + C × w c ,
A = A i × w i ;   B = B i × w i ;   C = C i × w i
where Z is the comprehensive quality index. A, B, and C are indexes of the criteria layer, which are calculated as sums of data of index layers multiplied with weights.
The pre-processed evaluation index data with the uniform coordinate system and pixel size were normalized to eliminate the effects of different dimensions of multiple factors. The calculation formula is
y i j p = X i j m i n x j / ( m a x x j m i n x j )
where m i n x j and m a x x j are the minimum and maximum values of the evaluation samples under the jth index, respectively.
(2)
Damage risk index evaluation of HG
The damage risk index of an HG mainly refers to influences of human activity disturbance. According to the driving factors of HG damages [31,32], the rural population density, land development and utilization, per-capita net income of farmers, distance to built-up areas, and regional economic level were used, in combination with field survey and analysis, as the evaluation criteria for damage risk indexes. Weights of indexes were determined by Delphi, and 15 experts were invited to give scores (1, 3, 5, 7, 9) of the importance of index weights. Multiple surveys were carried out until experts reached the same general opinions, and the standard deviations and coefficients of variation (CVs) of the indexes decreased. Table 4 shows that the second expert consultation achieved relatively good results and experts basically reached uniform opinions.
Therefore, the weight results of the second survey were used as the evaluation basis of the damage risk index of an HG (Table 5). Land development and utilization achieved the highest weight (0.34). In other words, the built-up area, new rural community, and infrastructure construction can all significantly influence the number and area of HGs. The weight of distance to the built-up area ranked second (0.29). Generally, HGs closer to the built-up area have a higher risk of damage. The per-capita net income of farmers (0.20) may also cause damages to HGs. Given better economic conditions, farmers have a higher reconstruction degree to HG, and may even migrate to other places. The weights of rural population density (0.11) and regional economic level (0.06) were relatively small.
(3)
Zone division of HG based on importance
Based on the unit of towns, the comprehensive quality index and damage risk index of HGs were divided into high level and low level using the natural breaking point method. The zones with high comprehensive quality index and high damage risk index were classified as extremely important protection areas. The zones with low comprehensive quality index and low damage risk index were classified as general protection areas. Other zones were classified as important protection areas.

3. Research Results

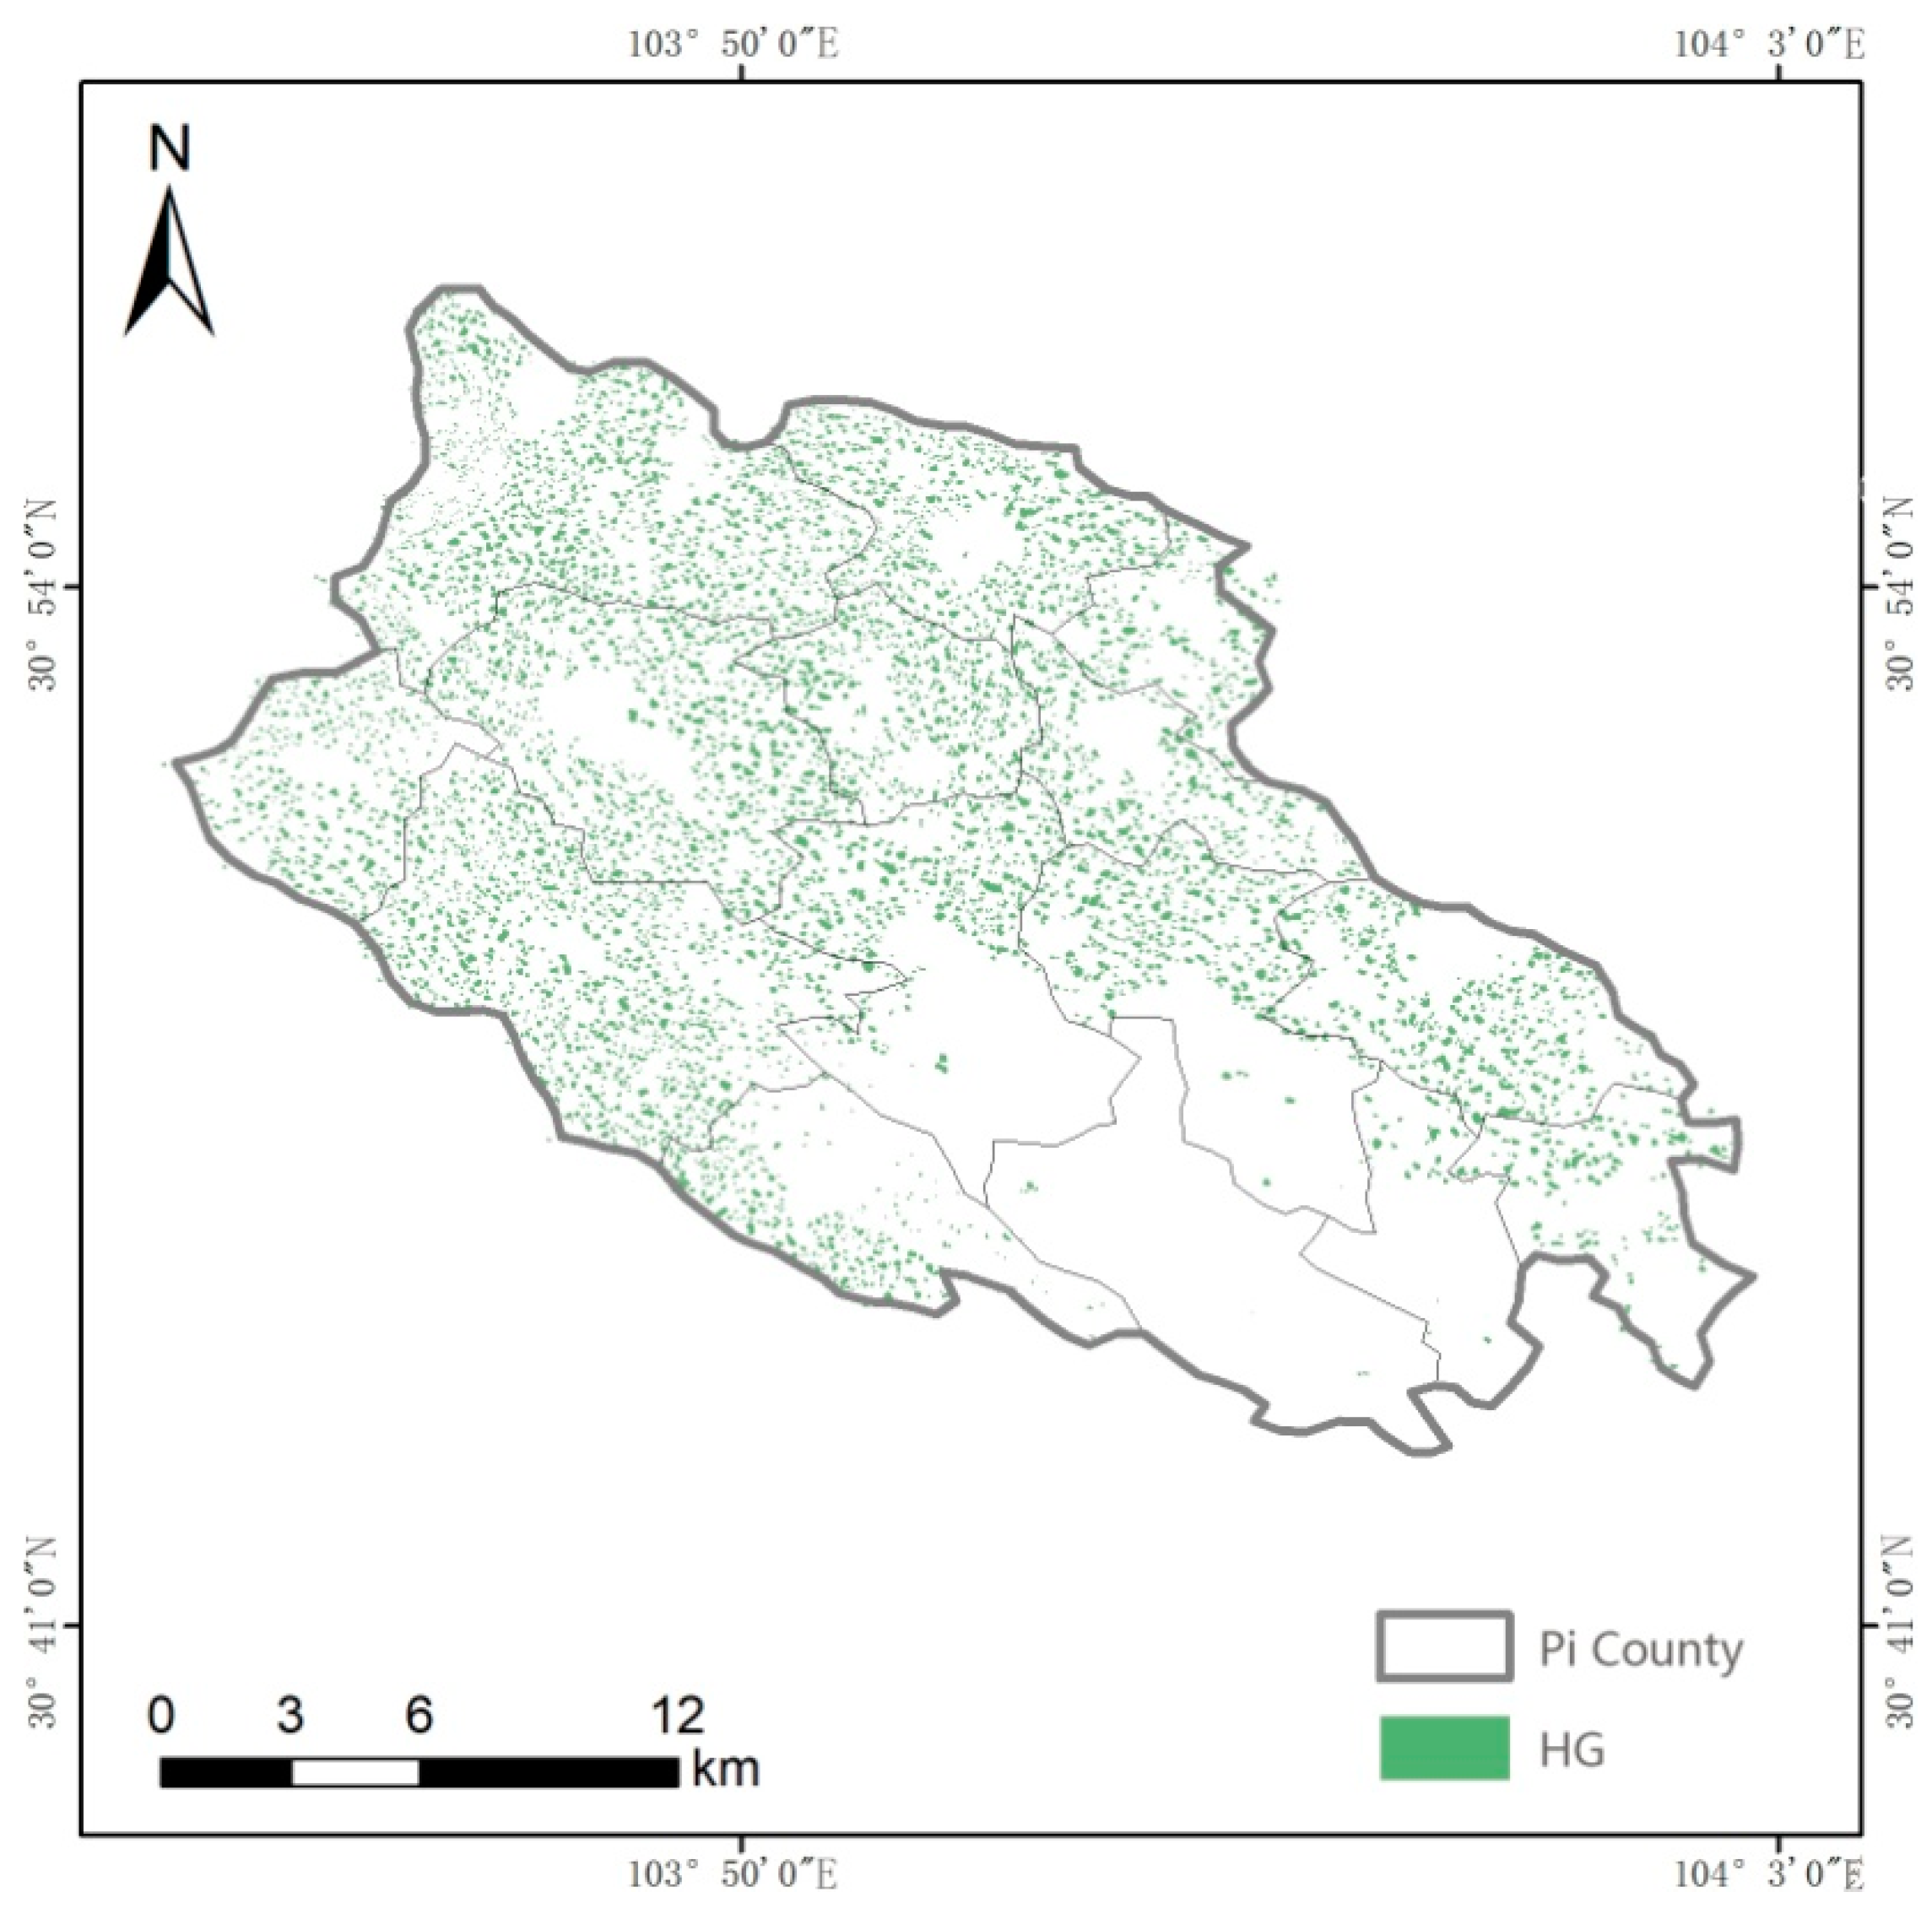
3.1. Quantity and Distribution of HGs

In 2018, there were 71,892 HGs in Chengdu City (within the scope of Chengdu Plain) (Figure 6), with an average density of about 9.94 HGs/km2. The total area was 558.70 km2. The forest land and grassland area in HGs was 316.18 km2, accounting for 56.60% of the total HG area. The rural residential building and other land area was 242.52 km2, accounting for 43.41% of the total HG area. In view of HG size, there were 41,132 small-sized HGs, accounting for 57.21% of the total HGs. There were 20,934 middle-sized HGs, accounting for 29.12% of the total HGs. There were 9826 large-sized HGs, accounting for 13.67% of the total HGs. The spatial distributions of HGs in Chengdu City were different.
In 2008, there were 81,186 HGs in Chengdu City, covering a total area of 706.24 km2; the average distribution density was about 11.21 HGs/km2. The number of HGs in Chengdu City decreased by 9294 (11.45%) in ten years and the HG area decreased by 147.54 km2 (20.89%). Specifically, the small-sized HGs, middle-sized HGs, and large-sized HGs decreased by 3745, 3437, and 2112, respectively. Generally, the number of HGs decreased and the average area of an HG declined slightly.

3.2. Ecosystem Service Value of HGs

According to the evaluation results (Table 6), the ecosystem service value of HGs in Chengdu City in 2018 amounted to USD 30,562.70 million. Specifically, the material product supply value was USD 4724.06 million, accounting for 15.46% of total ecosystem service values. The regulation service value was USD 11,583.00 million, accounting for 37.90% of total ecosystem service values. The headwater conservation value of vegetation was USD 1448.58 million; the soil conservation value was USD 111.85 million; the carbon sequestration value was USD 35.38 million; the climate regulation service value was USD 1103.85 million; and the pollination service value was USD 8883.45 million. The biodiversity maintenance value was USD 4337.85 million, accounting for 14.19% of total ecosystem service values. The cultural service value of HGs was USD 9917.79 million, accounting for 32.45% of total ecosystem service values.
In 2008, the ecosystem service value of HGs in Chengdu City was USD 32836.28 million, which decreased by USD 2273.57 million (about 6.92%) when compared to that of 2008. Specifically, the material product supply value decreased by USD 724.63 million (about 13.30%). The regulation service value decreased by USD 6870.18 million (about 47.36%). The biodiversity maintenance value decreased by USD 1845.83 million (about 29.85%). The cultural service value increased by USD 7167.07 million (about 2.6 times). This demonstrated that with the changes in number and area of HGs as well as changes in residents’ demands, the ecosystem services of HGs were mainly manifested as a slight reduction in material product supply, reductions in regulation services and biodiversity maintenance value, and an increase in cultural service values.

3.3. Protection Zone Division of HGs

The comprehensive quality of HGs in Chengdu City was generally moderate (Figure 7). Zones with high comprehensive quality index were mainly in central and southeast regions of the study area, where HGs had relatively stable landscapes and large ecological function values per unit area. These zones could resist the influences of unfavorable environments, thus enabling them to maintain sustainable development. Secondly, there is a moderate comprehensive quality index in the western and southern regions of the study area. The comprehensive quality index in the eastern regions of this study was relatively low and there were relatively few HGs, accompanied with relatively low density.
Some HGs in the eastern and central regions of Chengdu City were close to built-up areas (Figure 7). The land development and utilization have been relatively high in recent times, and the urbanization influence is great, resulting in a high damage risk index. HGs in the western and southern regions of Chengdu City were relatively far away from the built-up areas. In these regions, the urbanization rate and land development and utilization were relatively low, and human activities slightly interfered with these HGs. Hence, the damage risk index was relatively low.
Through the overlay analysis of HG comprehensive quality index and damage risk index, HGs in Chengdu City were divided into extremely important zones, relatively important zones, and general important zones, accounting for 21.14%, 51.95%, and 23.91% of total areas, respectively (Figure 8). Among them, the extremely important protection zones are mainly located in the northern areas (including Xindu, Pi County, Wenjiang, and some towns in Pengzhou), northwest areas (including Qingbai River and some towns in Longquanyi), and southeast areas (including Xinjin and some towns in Shuangliu) of Chengdu City. Priority attention should be paid to these zones.

4. Discussions

4.1. Importance of the Ecosystem Service Value of HGs

HGs in Chengdu Plain have important ecosystem service values. Also, there are balances among ecosystem services. Since ecosystem services are correlated or repellent, they are mainly manifested as a reduction in supply services and an increase in cultural services [47]. HG characteristics in Chengdu Plain are different from other regions in the world, thus resulting in different ecosystem service values. The ecosystem service values of HGs in Chengdu Plain are higher than those in South Asia and Latin America, but are slightly lower than those in Southeast Asia and Europe [11,48,49]. In fact, this shows the difference in the supply and demand of ecosystem services for HGs in different regions. It is in a period of rapid urbanization in Chengdu Plain; although HGs have been damaged, resulting in a decrease in provisioning services and regulation services, the supply and demand for cultural services have increased. If the framework of “Services Path Attribution Networks (SPANs)” is adopted to visualize the ecosystem service supply, transmission, and consumption processes of HGs spatially [50], the value of ecosystem services can be expressed more clearly. Apart from the ecosystem service value of HGs, agricultural economic income is also an important factor of HG protection. Although rewards for planting traditional crops in some regions of Chengdu Plain are about 868 dollars per ha and are far higher than the compensation (106 dollars) in South Asia [51], many people are still unwilling to plant traditional crops and even migrate from HGs to cities to find jobs. Therefore, it is very important to facilitate realization, transform the ecosystem service values of HGs, and increase the economic incomes of residents.

4.2. Composition Structures and Functional Changes of HGs

Failures of HGs are mainly manifested in two forms: disappearance or structural and functional changes. Moreover, flood plains are easier to disturb [21]. In particular, the urbanization rate of Chengdu Plain increased from 53.72% to 74.41% in the past two decades and the built-up area increased by 4.70 times. Due to the increase in urbanization and expansion of built-up areas, more peasant households permanently or temporarily leave HGs. Moreover, the HG ecosystem service demands of residents may change. As a result, there are changes in the size, shape, and biodiversity of HGs [52]. For example, some HGs lose traditional characteristics and increase more economic crops and appreciation plants, but core plant species may not change and represent local plant flora [53]. As a result, HGs are vulnerable to human activity. But the eco-social systems also have resilience, adaptability, and transformability [54]. If the protection objectives and models of HGs are clarified, the structural characteristics of the composition can be maintained and the ecosystem function can be improved.

4.3. Suggestions for the Sustainable Protection of HGs

The government is presently more committed to natural forest and landscape protection, but ignores the ecological functions and ecosystem service values of HGs [55]. In fact, HGs are closely related to the welfare of human beings. The regional scale can relieve and adapt to climate change, maintain biodiversity, and increase ecological stability [6,56]. The community scale can maintain production safety, increase regulation services, and promote physical and psychological health [57]. The government should particularly make full development of cultural service values, and promote material product supply as well as collaborative improvements of regulation service and cultural service values. This requires that the protection and utilization of HGs should follow the sustainable development goals [58], combine the resource endowment and socioeconomic development of HGs in different regions, maintain the characteristic landscape and develop HG resources according to local conditions, improve the value of ecosystem services, and realize the multi-functional benefits of HGs. Chengdu Plain has to formulate an HG protection plan, determine the number and spatial distribution of critical protective HGs, and confirm the reasonable distribution of large-sized, middle-sized, and small-sized HGs [33]. The protection of HGs should be organically combined with urban construction, new rural community construction, and agricultural industry construction. It is suggested that government formulates action plans for HGs, including organic agriculture, rural tourism, homestay and healthcare, and ecological compensation, to increase the economic income of residents and promote the protection of HGs. Furthermore, HGs need to maintain traditional characteristics, pay attention to plant diversity protection, and facilitate the collaborative improvement in ecosystem services [59,60].
Actually, many HGs in the extremely important zones are close to the urban area, as well as have good location conditions and relatively perfect infrastructure, but the interference of human activities is very strong. The protection of HGs should be combined with the construction of new towns and new rural communities, and optimize and adjust traditional industrial models, to improve the efficiency of land use and realize the integration of production and housing [61]. HGs in the important zones should take ecological protection and construction as the core, focus on creating a characteristic industrial model integrating culture and tourism, and form a diversified landscape [62]. It is recommended to optimize the ecological cultural industry of HGs; organically integrate traditional culture with modern art culture, music and sports culture, and network culture; and explore a new green industrial model [63]. The advantage of HGs in the general important zones is that the agricultural landscape resources are relatively rich, and they have agricultural and forestry products such as rice, fruits, flowers, and Chinese medicinal materials. HGs need to maintain their traditional style, create a characteristic industrial model of leisure tourism and agricultural tourism, and accelerate the integration of agriculture and tourism [64].

5. Conclusions

This study deepens public understanding of HGs in Chengdu Plain and improves the understanding of the main ecosystem services of HGs from a qualitative to a quantitative assessment. Through identifying the comprehensive quality index and damage risk index of HGs, and zone division of HGs based on protection importance, the important protection objects, and objectives of HGs are clarified, which is conducive to the scientific and reasonable protection of HGs. According to research results, the total number of HGs in Chengdu City is 71,892, and the average density is 9.94 HGs/km2. Among them, small-sized HGs account for 57.21%, while middle-sized and large-sized HGs account for 29.12% and 13.67%, respectively. In the last ten years, the number of HGs in Chengdu City has decreased by 11.45%; thus, HG protection deserves more attention. In fact, HGs make considerable contributions to residents’ welfare and regional ecological safety. Based on the ecosystem service evaluation framework, the ecosystem service value of HGs in Chengdu City is about USD 30,562.70 million/year, including 15.46% of material product supply, 37.90% of regulation service values, 14.19% of supporting services, and 32.45% of cultural service values. In the most recent ten years, the ecosystem service value of HGs in Chengdu City decreased by 6.92%, manifested as reductions in material products and regulation services, but with an increase in cultural services. This study divides HGs into extremely important protection zones, important protection zones, and general important zones, accounting for 21.14%, 51.95%, and 23.91% of total areas, respectively. Many protection strategies are proposed, such as formulating HG protection plans, proposing protection and utilization patterns of different protection zones, maintaining traditional characteristics, increasing biodiversity, and increasing the economic income of residents.

Author Contributions

Conceptualization, Q.L.; methodology, Q.L. and K.Y.; investigation, Q.L., K.Y. and Y.Y.; data curation, Y.Y.; writing—original draft preparation, Q.L.; writing—review and editing, K.Y. All authors have read and agreed to the published version of the manuscript.

Funding

This study was supported by the National Key Research and Development Program of China (2022YFF1301104), the National Natural Science Foundation of China (41401664) and the Youth Innovation Promotion Association of the Chinese Academy of Sciences (No. 2021375).

Data Availability Statement

The data presented in this study are available upon request from the corresponding author.

Conflicts of Interest

The authors declare no conflict of interest.

References

  1. Soemarwoto, O.; Christanty, L. Homegarden in the tropics. In Proceedings of the First International Workshop on Tropical Homegarden, Bandung, Indonesia, 2–9 December 1985. [Google Scholar]
  2. Kumar, B.M.; Nair, P. The enigma of tropical homegardens. Agrofor. Syst. 2004, 61, 135–152. [Google Scholar]
  3. Nath, A.J.; Das, A.K. Carbon storage and sequestration in bamboo-based smallholder homegardens of Barak Valley, Assam. Curr. Sci. 2011, 100, 229–233. [Google Scholar]
  4. Galhena, D.H.; Freed, R.; Maredia, K.M. Home gardens: A promising approach to enhance household food security and wellbeing. Agric. Food Secur. 2013, 2, 8. [Google Scholar] [CrossRef]
  5. Karthigesu, J.; Sivachndiran, S.; Pushpakumara, D. Ecosystem services of homegarden agroforestry in Jaffna Peninsula. In Proceedings of the International Conference on Dry Zone Agriculture, Jaffna, Sri Lanka, 15 December 2016. [Google Scholar]
  6. Bardhan, S.; Jose, S.; Biswas, S.; Kabir, K.; Rogers, W. Homegarden agroforestry systems: An intermediary for biodiversity conservation in Bangladesh. Agrofor. Syst. 2012, 85, 29–34. [Google Scholar] [CrossRef]
  7. Mohri, H.; Lahoti, S.; Saito, O.; Mahalingam, A.; Gunatilleke, N.; Irham; Hoang, V.T.; Hitinayake, G.; Takeuchi, K.; Herath, S. Assessment of ecosystem services in homegarden systems in Indonesia, Sri Lanka, and Vietnam. Ecosyst. Serv. 2013, 5, 124–136. [Google Scholar] [CrossRef]
  8. Lowenstein, D.M.; Matteson, K.C.; Minor, E.S. Diversity of wild bees supports pollination services in an urbanized landscape. Oecologia 2015, 179, 811–821. [Google Scholar] [CrossRef]
  9. Castro, A.; Lascurain, R.M.; Gómez-Díaz, J.A.; Sosa, V. Mayan Homegardens in Decline: The Case of the Pitahaya (Hylocereusundatus), a Vine Cactus with Edible Fruit. Trop. Conserv. Sci. 2018, 11, 1940082918808730. [Google Scholar] [CrossRef]
  10. Chakravarty, S.; Pala, N.A.; Tamang, B.; Sarkar, B.C.; Manohar, K.A.; Rai, P.; Puri, A.; Vineeta; Shukla, G. Ecosystem Services of Trees Outside Forest. In Sustainable Agriculture, Forest and Environmental Management; Springer: Berlin/Heidelberg, Germany, 2019; Volume 31. [Google Scholar]
  11. Norfolk, O.; Eichhorn, M.P.; Gilbert, F. Traditional agricultural gardens conserve wild plants and functional richness in arid South Sinai. Basic Appl. Ecol. 2013, 14, 659–669. [Google Scholar] [CrossRef]
  12. Taylor, J.R.; Lovell, S.T. Urban homegardens in the Global North: A mixed methods study of ethnic and migrant home gardens in Chicago, Illinois. Renew. Agric. Food Syst. 2015, 1, 22–32. [Google Scholar] [CrossRef]
  13. Wolch, J.R.; Byrne, J.; Newell, J.P. Urban green space, public health, and environmental justice: The challenge of making cities “just green enough”. Landsc. Urban Plan. 2014, 125, 234–244. [Google Scholar] [CrossRef]
  14. Panyadee, P.; Balslev, H.; Wangpakapattanawong, P.; Inta, A. Woody Plant Diversity in Urban Homegardens in Northern Thailand. Econ. Bot. 2016, 70, 285–302. [Google Scholar] [CrossRef]
  15. Hails, R.S.; Ormerod, S.J. Ecological science for ecosystem services and the stewardship of Natural Capital. J. Appl. Ecol. 2013, 50, 807–811. [Google Scholar] [CrossRef]
  16. Brown, G.; Schebella, M.F.; Weber, D. Using participatory GIS to measure physical activity and urban park benefits. Landsc. Urban Plan. 2014, 121, 34–44. [Google Scholar] [CrossRef]
  17. Luo, S.; Shi, J.; Lu, T.; Furuya, K. Sit down and rest: Use of virtual reality to evaluate preferences and mental restoration in urban park pavilions. Landsc. Urban Plan. 2022, 220, 104336. [Google Scholar] [CrossRef]
  18. Vibhuti, K.; Bargali, S.S. Effect of size and altitude on soil organic carbon stock in homegarden agroforestry system in Central Himalaya, India. Acta Ecol. Sin. 2020, 40, 483–491. [Google Scholar]
  19. Caballero-Serrano, V.; Onaindia, M.; Alday, J.G.; Caballero, D.; Carrasco, J.C.; McLaren, B.; Amigo, J. Plant diversity and ecosystem services in Amazonian homegardens of Ecuador. Agric. Ecosyst. Environ. 2016, 225, 116–125. [Google Scholar] [CrossRef]
  20. Baul, T.K.; Chakraborty, A.; Nandi, R.; Nath, T.K.; Mohiuddin, M. Phytosociological Attributes and Ecosystem Services of Homegardens of Maheshkhali Island of Bangladesh. Trees For. People 2021, 5, 100092. [Google Scholar] [CrossRef]
  21. Nebel, G. Sustainable land-use in Peruvian flood plain forests: Options, planning and implementation. For. Ecol. Manag. 2001, 150, 187–198. [Google Scholar] [CrossRef]
  22. Trinh, L.; Watson, J.; Hue, N.; De, N.; Minh, N.; Chu, P.; Sthapit, B.; Eyzaguirre, P. Agrobiodiversity conservation and development in Vietnamese home gardens. Agric. Ecosyst. Environ. 2003, 97, 317–344. [Google Scholar] [CrossRef]
  23. Kabir, M.E.; Webb, E.L. Household and homegarden characteristics in southwestern Bangladesh. Agrofor. Syst. 2009, 75, 129–145. [Google Scholar] [CrossRef]
  24. Chen, Q.B. Researches on the Modes about Conservation and Development of Linpan in Western Sichuan Plain; Chinese Forestry Press: Beijing, China, 2011. [Google Scholar]
  25. Fang, Z.R.; Zhou, J.H. Population, Cultivated Land and the Self-organization of Traditional Rural Settlement—With the Case of the Linpan Settlement System (1644–1911) in Chuanxi Plain. Hum. Habitat Environ. 2011, 27, 83–87. [Google Scholar]
  26. Shu, B. Studies of Agricultural Landscape in Chengdu Plain; Southwest Jiaotong University Press: Chengdu, China, 2012. [Google Scholar]
  27. Maroyi, A. Traditional homegardens and rural livelihoods in Nhema, Zimbabwe: A sustainable agroforestry system. Int. J. Sustain. Dev. World Ecol. 2009, 16, 1–8. [Google Scholar] [CrossRef]
  28. Saha, S.K.; Nair, P.K.R.; Nair, V.D.; Kumar, B.M. Soil carbon stock in relation to plant diversity of homegardens in Kerala, India. Agrofor. Syst. 2009, 76, 53–65. [Google Scholar] [CrossRef]
  29. Panyadee, P.; Balslev, H.; Wangpakapattanawong, P.; Inta, A. Karen Homegardens: Characteristics, Functions, and Species Diversity. Econ. Bot. 2018, 72, 1–19. [Google Scholar] [CrossRef]
  30. Cai, S.T. The Protection Planning of LinPan in New Rural Construction. Sichuan Archit. 2007, 27, 4–6. [Google Scholar]
  31. Guo, Y.M. Study on Spatial-Temporal Variation Characteristics and Driving Forces of Linpan in Chengdu Plain—A Case of Pi County; University of Chinese Academy of Sciences: Beijing, China, 2018. [Google Scholar]
  32. Zhou, Y.; Chen, J. Landscape Pattern Change and Its Driving Forces in the Linpan of Western Sichuan. J. Sichuan Agric. Univ. 2017, 35, 241–255. [Google Scholar]
  33. Seidl, R.; Albrich, K.; Erb, K.; Formayer, H.; Leidinger, D.; Leitinger, G.; Tappeiner, U.; Tasser, E.; Rammer, W. What drives the future supply of regulating ecosystem services in a mountain forest landscape? For. Ecol. Manag. 2019, 445, 37–47. [Google Scholar] [CrossRef]
  34. Hernández-Blanco, M.; Costanza, R.; Cifuentes-Jara, M. Economic valuation of the ecosystem services provided by the mangroves of the Gulf of Nicoya using a hybrid methodology. Ecosyst. Serv. 2021, 49, 101258. [Google Scholar] [CrossRef]
  35. Mukherjee, N.; Sutherland, W.J.; Dicks, L.; Hugé, J.; Koedam, N.; Dahdouh-Guebas, F. Ecosystem Service Valuations of Mangrove Ecosystems to Inform Decision Making and Future Valuation Exercises. PLoS ONE 2014, 9, e107706. [Google Scholar] [CrossRef]
  36. Himes-Cornell, A.; Pendleton, L.; Atiyah, P. Valuing Ecosystem Services from Blue Forests: A systematic review of the valuation of salt marshes, sea grass beds and mangrove forests. Ecosyst. Serv. 2018, 30 Pt A, 36–48. [Google Scholar] [CrossRef]
  37. Liu, Q.; Wang, Y.K.; Guo, Y.M.; Peng, P.H.; Wang, K.Y. Morphological characteristics and composition of plant species and their distribution patterns in Linpan of Chengdu plain. Acta Ecol. Sin. 2018, 38, 3553–3561. [Google Scholar]
  38. Wang, J.X.; Mu, C.L.; Peng, P.H.; Hu, Z.Y. Monitoring and Evaluation of Ecological Benefits of Shelter Forest System in the Middle and Upper Reaches of the Yangtze River; Sichuan Scientific and Technological Press Co., Ltd.: Chengdu, China, 2006. [Google Scholar]
  39. Wang, Y.K.; Deng, Y.L.; Peng, P.H.; Fan, J.R. Theoretical and Technical Research on Ecological Barrier Construction in the Upper Reaches of the Yangtze River; Sichuan Scientific and Technological Press Co., Ltd.: Chengdu, China, 2005. [Google Scholar]
  40. Liu, B.T.; Song, C.F.; Tao, H.P. Quantitative Assessment of Soil Erosion of Chengdu City. J. Yangtze River Sci. Res. Inst. 2016, 33, 40–47. [Google Scholar]
  41. Liu, Q.; Wang, Y.K.; Xu, P.; Peng, P. Value Estimate of Carbon Fixation and Oxygen of Linpan and Its Characteristics-a Case of Pixian, Chengdu Plain. Southwest China J. Agric. Sci. 2018, 31, 1732–1738. [Google Scholar]
  42. Xie, G.D.; Zhang, C.X.; Zhang, C.S.; Xiao, Y.; Lu, C.X. The value of ecosystem services in China. Resour. Sci. 2015, 37, 1740–1746. [Google Scholar]
  43. FAOSTAT. Food and Agriculture Data. Available online: https://faostat.fao.org/site/291/defaultaspx (accessed on 10 April 2021).
  44. Liu, Q.; Xu, P.; Wang, Y.; Peng, P.; Liu, Y. Ecosystem Provisioning Services Valuation of Linpan in Chengdu Plain. Ecol. Econ. 2018, 34, 195–200. [Google Scholar] [CrossRef]
  45. Statistic Bureau of Chengdu. Chengdu Statistical Yearbook; China Statistics Press: Beijing, China, 2020.
  46. Xiao, Y.; Ouyang, Z.Y.; Wang, L.Y.; Rao, E.; Jiang, L.; Zhang, L. Spatial Patterns of Ecosystem Quality in Inner Mongolia and its Driving forces analysis. Acta Ecol. Sin. 2016, 36, 6019–6030. [Google Scholar]
  47. De Leijster, V.; Santos, M.J.; Wassen, J.M.; Camargo García, J.C.; Llorca Fernandez, I.; Verkuil, L.; Scheper, A.; Steenhuis, M.; Verweij, P.A. Ecosystem services trajectories in coffee agroforestry in Colombia over 40 years. Ecosyst. Serv. 2021, 48, 101246. [Google Scholar] [CrossRef]
  48. Kehlenbeck, K. Rural Homegardens in Central Sulawesi, Indonesia: An Example for a Sustainable Agro-Ecosystem? Georg-August-University: Göttingen, Germany, 2007. [Google Scholar]
  49. Coomes, O.T.; Ban, N. Cultivated plant species diversity in home gardens of an Amazonian peasant village in northeastern Peru. Econ. Bot. 2004, 59, 420–434. [Google Scholar] [CrossRef]
  50. Bagstad, K.J.; Johnson, G.W.; Voigt, B.; Villa, F. Spatial dynamics of ecosystem service flows: A comprehensive approach to quantifying actual services. Ecosyst. Serv. 2013, 41, 17–125. [Google Scholar] [CrossRef]
  51. Rasheed, S.; Venkatesh, P.; Singh, D.R.; Renjini, V.; Jha, G.K.; Sharma, D.K. Ecosystem valuation and eco-compensation for conservation of traditional paddy ecosystems and varieties in Kerala, India. Ecosyst. Serv. 2021, 49, 101272. [Google Scholar] [CrossRef]
  52. Tapasi, D.; Ashesh, K.D. Conservation of Plant Diversity in Rural Homegardens with Cultural and Geographical Variation in Three Districts of Barak Valley, Northeast India. Econ. Bot. 2015, 69, 57–71. [Google Scholar]
  53. Albuquerque, U.P.; Andrade, L.; Caballero, J. Structure and floristics of homegardens in Northeastern Brazil. J. Arid Environ. 2005, 62, 491–506. [Google Scholar] [CrossRef]
  54. Folke, C.; Carpenter, S.R.; Walker, B.; Scheffer, M.; Chapin, T.; Rockström, J. Resilience thinking: Integrating resilience, adaptability and transformability. Ecol. Soc. 2010, 15, 299–305. [Google Scholar] [CrossRef]
  55. Perfecto, I.; Vandermeer, J. Biodiversity conservation in tropical agroecosystems: A new conservation paradigm. Ann. N. Y. Acad. Sci. 2008, 1134, 173–200. [Google Scholar] [CrossRef]
  56. Mattsson, E.; Ostwald, M.; Nissanka, S.P.; Pushpakumara, D.K.N.G. Quantification of carbon stock and tree diversity of homegardens in a dry zone area of Moneragala district, Sri Lanka. Agrofor. Syst. 2015, 89, 435–445. [Google Scholar] [CrossRef]
  57. Motzke, I.; Klein, A.-M.; Saleh, S.; Wanger, T.C.; Tscharntke, T. Habitat management on multiple spatial scales can enhance bee pollination and crop yield in tropical homegardens. Agric. Ecosyst. Environ. 2016, 223, 144–151. [Google Scholar] [CrossRef]
  58. Lemonsu, A.; Masson, V. Inclusion of vegetation in the Town Energy Balance model for modelling urban green areas. Geosci. Model Dev. Discuss. 2012, 5, 1295–1340. [Google Scholar] [CrossRef]
  59. Wratten, S.D.; Gillespie, M.; Decourtye, A.; Mader, E.; Desneux, N. Pollinator habitat enhancement: Benefits to other ecosystem services. Agric. Ecosyst. Environ. 2012, 159, 112–122. [Google Scholar] [CrossRef]
  60. Melathopoulos, A.P.; Cutler, G.C.; Tyedmers, P. Where is the value in valuing pollination ecosystem services to agriculture? Ecol. Econ. 2015, 109, 59–70. [Google Scholar] [CrossRef]
  61. Roschewitz, I.; Gabriel, D.; Tscharntke, T.; Thies, C. The effects of landscape complexity on arable weed species diversity in organic and conventional farming. J. Appl. Ecol. 2005, 42, 873–882. [Google Scholar] [CrossRef]
  62. Rossum, F.V. Reproductive success and pollen dispersal in urban populations of an insect-pollinated hay-meadow herb. Perspect. Plant Ecol. Evol. Syst. 2010, 12, 21–29. [Google Scholar] [CrossRef]
  63. Nath, T.; Inoue, M. Forest-based settlement project and its impacts on community livelihood in the Chittagong Hill Tracts, Bangladesh. Int. For. Rev. 2009, 11, 394–407. [Google Scholar] [CrossRef]
  64. Goulson, D. Review: An overview of the environmental risks posed by neonicotinoid insecticides. J. Appl. Ecol. 2013, 50, 977–987. [Google Scholar] [CrossRef]
Figure 1. HG landscape and units in Chengdu Plain ((a), Landscape of HGs; (b), Aerial image of a typical HG; (c), Photo of a typical HG).
Forests 14 01754 g001
Figure 2. Distribution diagram of Chengdu Plain.
Forests 14 01754 g002
Figure 3. Visual interpretation results of HG in Pi County.
Forests 14 01754 g003
Figure 4. Extraction methods and flowchart of HG.
Forests 14 01754 g004
Figure 5. Evaluation framework of HG ecosystem services.
Forests 14 01754 g005
Figure 6. Number and distribution of HGs in 2018 (left) and 2008 (right).
Forests 14 01754 g006
Figure 7. Comprehensive quality index (left) and damage risk index (right) of HGs.
Forests 14 01754 g007
Figure 8. Zone division of HGs in Chengdu City based on protection importance.
Forests 14 01754 g008
Table 1. Evaluation methods of HG ecosystem services.
ContentEvaluation Methods of Number of Substances (Number of Functions)Value Evaluation MethodsNotes
Material productsActual yield of material productsMarket value methodValues of small-sized, middle-sized, and large-sized HG material product supplies are USD 2867, 6195, and 1350/year, respectively [37];
Headwater conservationComprehensive water-holding capacity methodCost substitution methodHeadwater conservation refers to the average value of different types of forest lands in Chengdu Plain [38,39];
The calculation of the headwater conservation value refers to Technical Norms for Calculation of Ecological Product Values.
Soil conservationUniversal soil loss equation (USLE model)Cost substitution methodSoil conservation refers to the average value (100 t/ka) of different types of HGs in Chengdu Plain [40];
The calculation of the soil conservation value refers to Technical Norms for Calculation of Ecological Product Values.
Carbon sequestrationNet primary productivity methodMarket value methodVegetation-based carbon sequestration volumes of small-sized, middle-sized, and large-sized HGs were 0.26, 0.81, and 1.56 t/a, respectively [41];
The carbon sequestration price per unit chooses the listing-agreed price of carbon emission amount (CEA) of China’s carbon market in Shanghai Environment and Energy Exchange.
Climate regulationVegetation-absorbed heatsCost substitution methodThe absorbed heats of evergreen broad-leaf forest in Chengdu Plain is 100 KJ/ha [42];
The calculation of the climate regulation value refers to Technical Norms for Calculation of Ecological Product Values.
PollinationEffects of HG pollinator on typical crop yieldMarket value methodTypical crops (rice, oilseed rape, corn and wheat) in Chengdu Plain are chosen for value evaluation, according to the pollination dependence degree of crops [43];
Biodiversity maintenanceShannon–Wiener Diversity Index of speciesEquivalent factor methodThe average Shannon–Wiener Diversity Index of HGs in Chengdu Plain is 2.51 [44].
According to Technical Norms of Forest Ecosystem Service Evaluation (2020), the biodiversity maintenance value per unit area is USD 1372/ha.
Cultural servicesTourism consumption per peopleTravel cost methodA comprehensive statistical analysis on the agritainment ticket price of HGs and entertainment income is carried out [45].
Table 2. Judgment matrixes and relative weights of indexes.
Criteria Layer
A-CABC CI value Relative weight
A21/21 0.00560.2857
B412 0.5714
C11/41/2 0.1429
Index Layer
A-A3A1A2A3 CI value Relative weight
A131/21 0.00920.3200
A2412 0.5580
A311/21/3 0.1220
B-B4B1B2B3B4CI value Relative weight
B113220.00350.4232
B21/311/21/20.1222
B31/22110.2273
B41/22110.2273
C-C3C1C2C3 CI value Relative weight
C1123 0.00460.4232
C21/212 0.1222
C31/31/21 0.2273
Table 3. Comprehensive quality evaluation index system of HG.
Objective LayerCriteria LayerWeightsIndex LayerWeights
HG comprehensive quality indexLandscape stability (A)0.2857Average patch density (A1)0.3200
Average patcharea (A2)0.5580
Evenness index (A3)0.1220
Ecological functions
(B)
0.5714Headwater conservation value (B1)0.4232
Soil conservation value (B2)0.1222
Carbon sequestration value (B3)0.2273
Biodiversity maintenance value (B4)0.2273
Social cultural functions (C)0.1429Number of residents per unit area (C1)0.5400
Cultural service value per unit area (C2)0.2970
Material product supply value per unit area (C3)0.1630
Table 4. Summary of importance judgment indexes.
Experts1. Rural Population Density2. Land Development and Utilisation3. Per Capita Net Income of Farmers4. Distance to the Built-Up Area5. Regional Economic Level
Survey 1Survey 2Survey 1Survey 2Survey 1Survey 2Survey 1Survey 2Survey 1Survey 2
Expert 13399557711
Expert 23399755711
Expert 31377359951
Expert 43599137751
Expert 55199357713
Expert 61397357951
Expert 71179359753
Expert 85379973511
Expert 97559139731
Expert 107397553911
Expert 111399557731
Expert 123359159771
Expert 135137957913
Expert 147399351751
Expert 157339975511
Table 5. Importance evaluation.
FactorsAverage ImportanceStandard Deviation of ImportanceCVWeight Coefficients
Survey 1Survey 2Survey 1Survey 2Survey 1Survey 2Survey 1Survey 2
Rural population density3.932.872.291.150.580.400.160.11
Land development and utilisation7.278.472.170.880.300.100.290.34
Per capita net income of farmers4.475.002.781.030.620.210.180.20
Distance to the built-up area6.337.272.391.240.380.170.250.29
Regional economic level3.001.402.070.800.690.570.120.06
Table 6. Major ecosystem service values of HGs in Chengdu City.
No.ContentsValue in 2018
/USD Million
Proportion
/%
Value in 2008
/USD Million
Proportion
/%
1Material products4724.0615.465448.6916.59
2Headwater conservation1448.584.742197.136.69
3Soil conservation111.850.37135.520.41
4Carbon sequestration35.380.1241.190.13
5Climate regulation1103.753.611573.424.79
6Pollination8883.4529.0714,505.9344.18
7Biodiversity maintenance4337.8514.196183.6818.83
8Cultural services9917.7932.452750.728.38
Total30,562.70 100.0032,836.28 100.00
Disclaimer/Publisher’s Note: The statements, opinions and data contained in all publications are solely those of the individual author(s) and contributor(s) and not of MDPI and/or the editor(s). MDPI and/or the editor(s) disclaim responsibility for any injury to people or property resulting from any ideas, methods, instructions or products referred to in the content.

