Article

A Method for Extracting the Tree Feature Parameters of Populus tomentosa in the Leafy Stage

Key Lab of State Forestry Administration on Forestry Equipment and Automation, Beijing Forestry University, Beijing 100083, China
*
Author to whom correspondence should be addressed.
Forests 2023, 14(9), 1757; https://doi.org/10.3390/f14091757
Submission received: 13 July 2023 / Revised: 28 August 2023 / Accepted: 28 August 2023 / Published: 30 August 2023
(This article belongs to the Section Forest Inventory, Modeling and Remote Sensing)

Abstract

:
With the advancement of 3D information collection technology, such as LiDAR scanning, information regarding the trees growing on large, complex landscapes can be obtained increasingly more efficiently. Such forestry data can play a key role in the cultivation, monitoring, and utilization of artificially planted forests. Studying the tree growth of artificially planted trees during the leafy period is an important part of forestry and ecology research; the extraction of tree feature parameters from the point clouds of leafy trees, obtained via terrestrial laser scanning (TLS), is an important area of research. The separation of foliage and stem point clouds is an important step in extracting tree feature parameters from data collected via TLS. By modeling the separated stem point clouds, we can obtain parameters such as a tree’s diameter at breast height (DBH), the number of branches, and the relationship between these and other parameters. However, there are always problems with the collected foliated tree point clouds; it is difficult to separate the point clouds into foliage and stems, yielding poor separation results. To address this challenge, the current study uses a deep learning-based method to train a mixture of non-foliated and foliated point clouds from artificially planted trees to semantically segment the foliage labels from the stem labels of these trees. And this study focused on a Chinese white poplar (Populus tomentosa Carr.) plantation stand. At the same time, the method of this study greatly reduces the workload of labeling foliated point clouds and training models; an overall segmentation accuracy of 0.839 was achieved for the foliated Populus tomentosa point clouds. By building the Quantitative Susceptibility Mapping (QSM) model of the segmented point clouds, a mean value of 0.125 m for the tree diameter at breast height, and a mean value of 14.498 m for the height of the trees was obtained for the test set. The residual sum of squares for the diameter at breast height was 0.003 m, which was achieved by comparing the calculated value with the measured value. This study employed a semantic segmentation method that is applicable to the foliated point clouds of Populus tomentosa trees, which solves the difficulties of labeling and training models for the point clouds and improves the segmentation precision of stem-based point clouds. It offers an efficient and reliable way to obtain the characteristic parameters and stem analyses of Populus tomentosa trees.

1. Introduction

Trunk information is one of the most important areas of study in forestry. By modeling the stem point cloud for a particular tree model, data on a range of variables, such as its height, the number of branches, trunk diameter at breast height, branch angle, and storage volume, can be extracted from the model. In the past, the most common method for measuring tree information was achieved by taking manual field measurements. For example, the average number of branches was counted by felling a sample of trees. These traditional methods can measure basic tree information, but the process usually involves a sample survey, which is time-consuming and damaging to the sampled trees. The rapid progress of laser remote sensing technology in recent years has led to the rapid development of terrestrial laser scanning (TLS) techniques. In addition, better portability, stable performance, moderate operational difficulty, and the ability to form good-quality point clouds have led to a wide range of new uses for terrestrial laser scanning technology in forestry and ecology, including the estimation of biomass on the ground [1,2], extraction of the characteristic parameters for trees [3], segmentation of forest point clouds [4,5], study of stem form and volume allocation in diverse boreal forests [6], etc. The datasets used in this paper comprise point clouds collected via terrestrial laser scanning and are of high quality; at the same time, the high levels of density and complexity of these point clouds create a challenge in terms of processing them.
The classification of stem and foliage point clouds is of great interest in the field, and many research projects have focused on the subject in recent years. The separation of foliage and stem point clouds from TLS data continues to yield new findings. Among these findings, study [7] used graph-based method, it utilized the shortest path-based features, study [8] used the supervised learning-based method and more studies have been using deep learning methods, such as based on 2D convolutional networks [9], as well as a comparative study of full convolutional neural networks (FCN), long short-term memory full convolutional neural networks (LSTM-FCN) and residual networks (ResNet) [10]. These methods are all based on the geometrical characteristics of trees, while some methods combine the intensity and geometrical characteristics of trees to study [11]. But the geometric methods based on point cloud only requires x, y, and z coordinates, this makes it possible to incorporate data collected by various means, whether from a backpack-based LiDAR, handheld LiDAR, or any similar LiDAR device. And the collected data is more independent of the environment compared to intensity, meaning that geometric feature-based methods have much wider applicability. Although these methods mentioned above have achieved good results regarding the segmentation of foliage and stem point clouds, they are often used for single trees or locations with a small number of trees. For large-scale areas and a large numbers of trees, deep learning networks for direct processing of point clouds have been more widely used and explored, such as the use of PointNet [12] to segment tree crowns [13] and the use of PointNet++ [14] to segment an entire forested area [15]. These studies not only segment stems and foliage but generally process the entire forested area semantically, making it easier for us to understand the forest environment.
The above methods have all achieved good results and progress has been made in the present work regarding stem and foliage segmentation, but there are still many challenges yet to be addressed. The first is that many studies usually focus on one-period data; therefore, long-term observation and research on the same forest are lacking, and comparative research on the different seasons in the same forest is also rare. The current paper fills this research gap by collecting data for one period of leafy coverage and one period of leafless coverage for the same plantation, using a mixed training model of leafless and leafy data for the semantic segmentation of leafy forest scenes. For the same plantation, the point cloud stem information recorded during the leafless period is more complete and the data labeling is, thus, more convenient. Unfortunately, these point clouds are disordered and are prey to large point cloud densities; this means that some of the methods that have achieved good feature-learning results in smaller environments are unsuitable and will not obtain equally good results with the large Populus tomentosa Carr. point clouds. Therefore, in this paper, the feature learning and segmentation of point clouds are performed using PointCNN [16]. PointCNN, which is based on Tensorflow [17], solves the problem of disorder in the large Populus tomentosa point clouds by introducing X-Conv, which means that the convolution can better retain the spatial position information from the large Populus tomentosa point clouds. Finally, the software programs 3D Forest (version 0.42) [18] and TreeQSM [19,20,21,22] helped us to incorporate the semantic segmented stem point cloud into the QSM model.
In summary, the motivation behind the work presented in this paper was to provide a method for segmenting stem point clouds and extracting tree feature parameters from foliated Populus tomentosa. This paper focuses on (1) deep learning models that have been trained with leafy point clouds to segment the point clouds of the Populus tomentosa test set; (2) deep learning models trained with a mixture of leafy and non-leafy point clouds to segment the point clouds of the Populus tomentosa test set; (3) QSM models for the stem point clouds, segmented by the mixed training models and statistics of the tree feature parameters, such as DBH and tree height. Using a hybrid training model of leafless and leafy point clouds to segment the foliated point clouds of Populus tomentosa is one of the most important steps; this reduces the manual effort and the amount of time spent labeling the foliated data and training the deep learning model and also improves the segmentation accuracy of the stem data. And in order to test the implementation of our semantic segmentation method, datasets were created from two phases of plantation data that were collected via TLS from the same forest and then manually labeled in a uniform manner. Finally, it was verified that this semantic segmentation method was effective in terms of the segmentation of the forested environment of Populus tomentosa, while a comparison of the QSM results with the manually measured values verified that the leafless data help to improve the accuracy of the Populus tomentosa stem segmentation data, as well as proving the effectiveness of this tree feature parameter extraction method.

2. Materials and Methods

2.1. Methodology Overview

In this section, we present the methods that were used to collect and build the dataset, and to train the deep learning model and the deep learning framework, along with the methods used to build the stem QSM model and extract the parameters, as well as details on how we validated these models and methods. Figure 1 presents a schematic diagram of the extraction of tree feature parameters from foliated data, which demonstrates how the method in this paper can be used to process raw foliated point cloud data collected via TLS. For the leafless dataset, we classified the data into three categories of labels, stem, ground, and the remaining points (including grass, ropes tied between the trees, and human beings), while in the leafy dataset, we classified the large Populus tomentosa Carr. point cloud into four categories of labels: foliage, stem, terrain, and other points (including grass, ropes tied between the trees, and human beings).

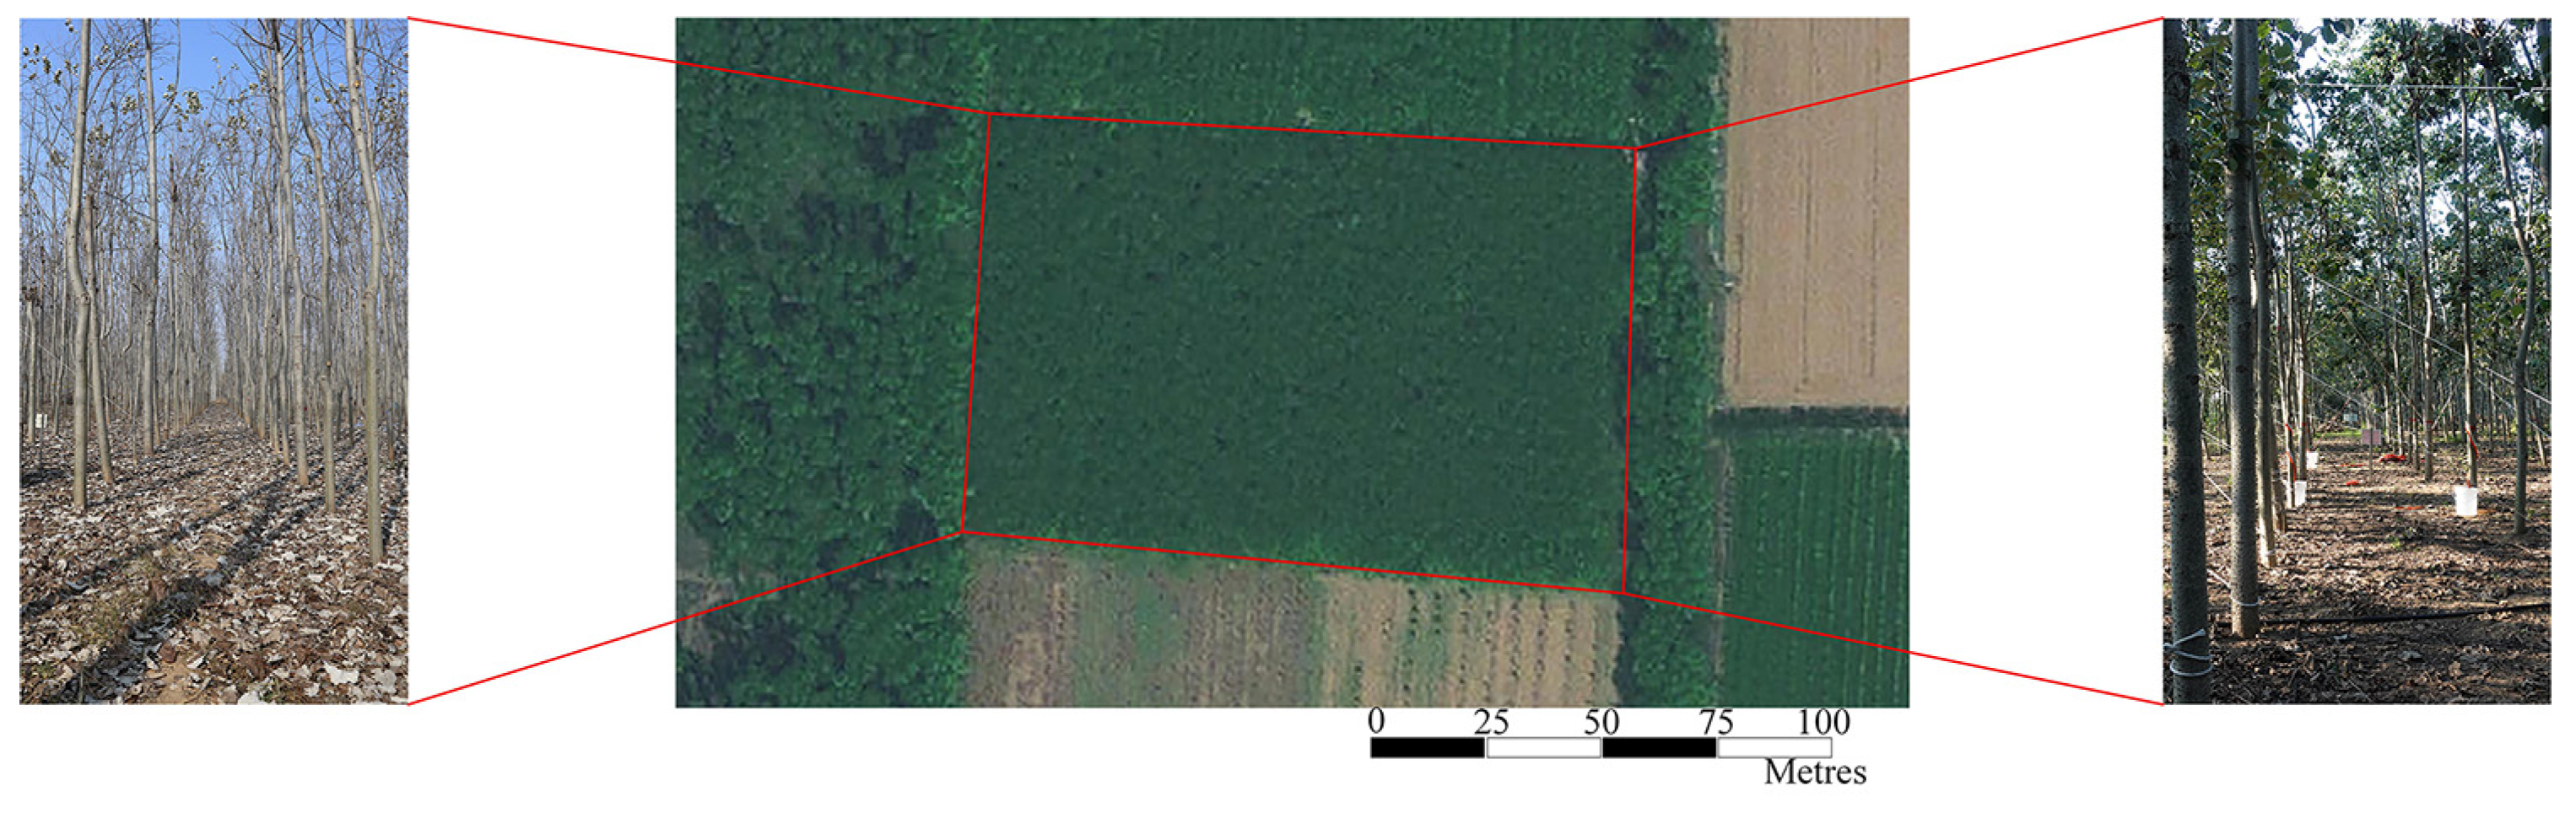
2.2. Study Area and Data Collection

The plantation of Populus tomentosa Carr. studied in this paper is located in Qingping Town National Ecological Park, Shandong Province, China (N: 36°48′46.33″ E: 116°05′23.00″). It is located in a temperate monsoon climate zone in an area known for its favorable climate and abundant rainfall. A trial plantation was established here in the second quarter of 2015, using the B301 clone ((P. tomentosa × P. bolleana) × P. tomentosa) for afforestation. All planted trees were spaced 2 m × 3 m apart, and the plantation covered an area of 1.34 hectares. At the time of plantation establishment, the average tree height was 3.0 ± 0.1 m, and the average diameter at breast height was 3.7 ± 0.2 cm [23].
An RGB image of the entire Populus tomentosa test site is shown in Figure 2, with an image of the leafless Populus tomentosa trees on the left, an aerial image in the middle, and an image of the leafy Populus tomentosa trees on the right.
We acquired the leafy and leafless Populus tomentosa datasets for the experiment using a RIEGL TLS vz-2000i, which has high accuracy and a resolution of 5 mm and can scan up to 2500 m horizontally, at 360 degrees, and vertically, at −40° to +60°. When the data were collected, the height of the terrestrial laser scanning was 1.8 m, the total area of the forest land is 16134 m2, the average density of the point cloud of leafy data obtained was 119,698.8 points per square meter, and the average density of the point cloud of leafless data was 123,550.8 points per square meter.
On 5 August 2021, we collected the leafy dataset in the field when the Populus tomentosa had dense foliage. We scanned the data 98 times with the LiDAR device and stitched the dataset together to generate a point cloud map. On 3 March 2022, when the Populus tomentosa was almost leafless, we collected the leafless dataset and scanned the data 98 times on the test site with the same LiDAR device. The scanning positions were not exactly the same for each of the two scans, but the point cloud maps obtained via processing with RIEGL’s RiSCAN PRO software (version 2.11.1) were of high quality and characterized the experimental forest well, as shown in Figure 3. The point clouds were eventually acquired and were stored in the las1.4 format.

2.3. Class Selection Approach

In this paper, the stem point clouds obtained from semantic segmentation were processed by first building the QSM model and then extracting the tree feature parameters, which requires that the tree point clouds selected for study meet certain conditions. Primarily, they need to have good coverage and a high level of accuracy; the stem points obtained after stitching together the data collected by TLS into point cloud maps should, thus, be relatively complete. For example, DBH and tree height can then be directly measured from the collected point cloud map of the forest and be relatively accurate, as most LiDAR devices can capture such a good-quality point cloud. In addition, the point clouds chosen for this paper have no color information or reflection information because colorless point clouds have the characteristics of data simplicity and occupy less virtual space. A few deep learning frameworks [24,25,26] specialize in the processing of colored point clouds; however, the study of tree point clouds in this paper is more focused on their geometric structure, so these methods were not employed. In this paper, the point cloud maps of Populus tomentosa Carr. collected via TLS were generally of good quality in terms of the reconstruction process. In the leafless Populus tomentosa point cloud, all the branches of each tree are well reconstructed, clearly indicating the form and number of stems, while some of the treetops are not perfectly reconstructed, due to wind-induced shaking during acquisition. However, these areas of imperfect reconstruction are small in proportion to the whole, and their data are still useful for deep learning, so they are retained. In the leafy Populus tomentosa point cloud, due to the high density of foliage, the foliage and stem are partially obscured from each other, making it impossible to distinguish between all the foliage and the stems, which is inevitable in the study of foliated tree point clouds. In the manual labeling process of the training, validation, and test datasets, the stem point cloud is one of the most important points on which we focused, and the labeling standard was the same for both the leafless and leafy point cloud datasets. In the case of manually labeling point clouds for the purposes of classification, to obtain the most accurate stem point cloud in both the leafless and leafy Populus tomentosa point cloud datasets, when labeling the ground points and stem, if there is a part of the junction that is not easily distinguishable, it will then be labeled as “ground”. When labeling stems and foliage in the leafy Populus tomentosa data, if there is a part of the junction that is blurred, it will then be labeled as “foliage”. In addition to the trees and ground points, the Populus tomentosa point cloud map also includes grass on the ground, equipment, ropes tied between trees, and some human shadows, which are classified as “other” points; these are not the main target of our study and make up a relatively small percentage of the total.

2.4. Point Cloud Pre-Processing

To validate the semantic segmentation results obtained from the neural network that was trained using leaf data, along with the results from the neural network trained using mixed leaf and non-leaf data, respectively, we labeled the leaf and non-leaf datasets separately, the details of which are shown in Table 1. For training deep learning networks, labeling the data is an extremely important first step, especially when labeling the stem and foliage point clouds of the leafy dataset, where the crossover between stems at the top of the canopy is a more serious issue and the foliage canopies overlap each other. This work requires a great deal of manual effort to screen the data carefully, and it also requires that the people performing the labeling work have a high level of relevant judgment and expertise. At the same time, in order to ensure the uniformity of all the data used in this paper, although the annotation of the point clouds was time-consuming and tedious, a professional author also manually labeled all the datasets used in this paper. All data were converted into HDF5 [27] format for storage. The leafy and leafless data were classified into four semantic categories, comprising: (1) complete and vestigial stems; (2) foliage; (3) terrain; and (4) other point clouds in the scene, such as grass, ropes tied between the trees, and human beings. The leafless point clouds do not incorporate the second category mentioned above. In this study, the number of trees in the training data set, validation data set, and testing data set follow the principle of 7 to 3 to 3, in accordance with the hold-out method, and the training data chosen for the leafy data were randomly selected in the point cloud map as YT1 to YT7, the validation set data were randomly selected as V1 to V3, and the training data for the leafless data were randomly selected as NT1 to NT7, and the training and validation sets do not contain any data from the testing set. And each piece of the leafless data and the leafy data described the same trees; for example, the trees in YT1 and NT1 are the same specimens. The timing of the manual labeling was recorded during the processing of these data. All data are uniformly labelled using the point cloud labelling software Pointly. At the same time, the area of YT6 and YT7 is a bit larger than NT6 and NT7, which is due to manual cutting, but they contain the same number of trees, which does not affect our deep learning training.

2.4.1. Training Data and Validation Data
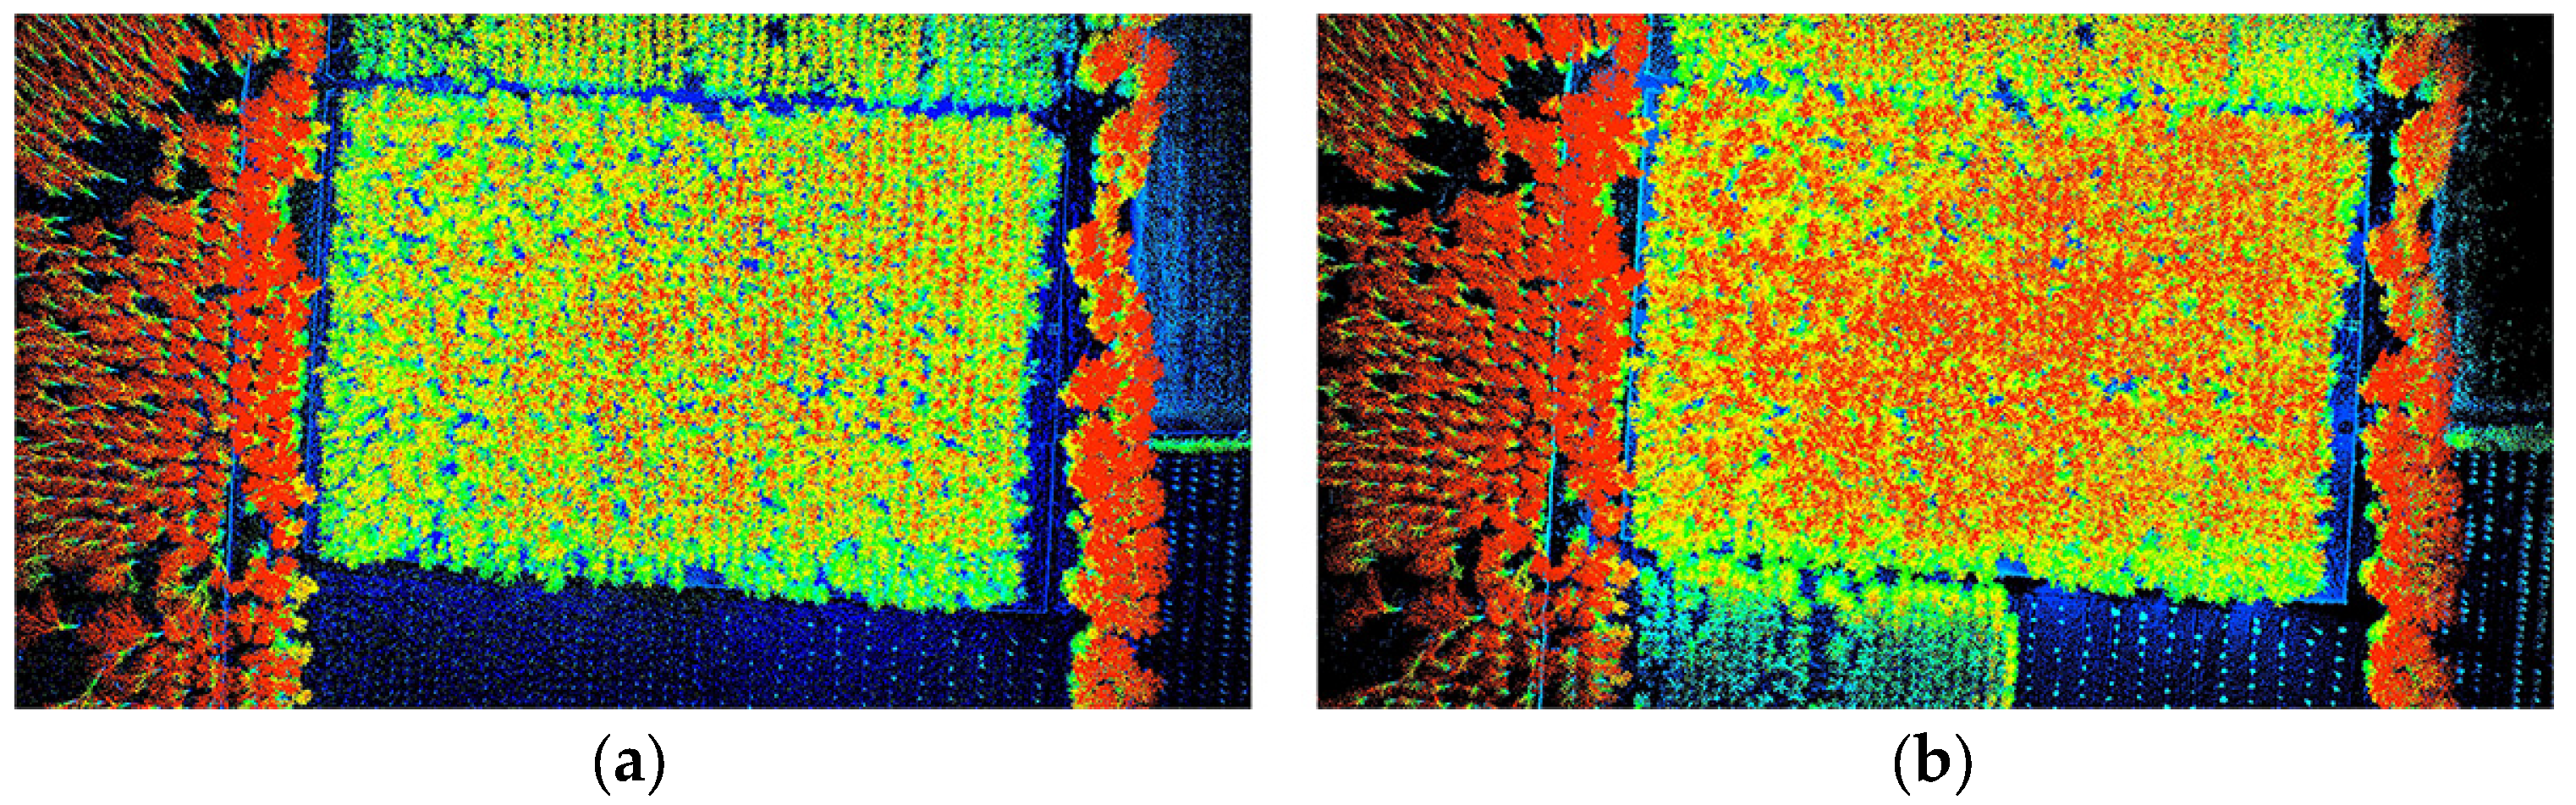
Here, we present the details of a tree labeled as shown in Figure 4, depicting the semantic labeling details of a tree in both the leafy and leafless periods. The point clouds of leafless trees, which have more branches after several months of growth, can provide more stem information to the network than a point cloud labeled during the leafy period, thereby making the point clouds of leafy Populus tomentosa Carr. stems more fully segmented.
The partially labeled training and validation sets are also shown in Figure 5, with approximately 20 trees on each point cloud.

2.4.2. Testing Data

Based on the principles of the hold-out method mentioned above, we validated the generalizability, accuracy, and robustness of our method by randomly selecting three complete sample plots of foliage data from the Populus tomentosa Carr. leafy data. Further details on the parameters of the complete testing set are given in Table 2.

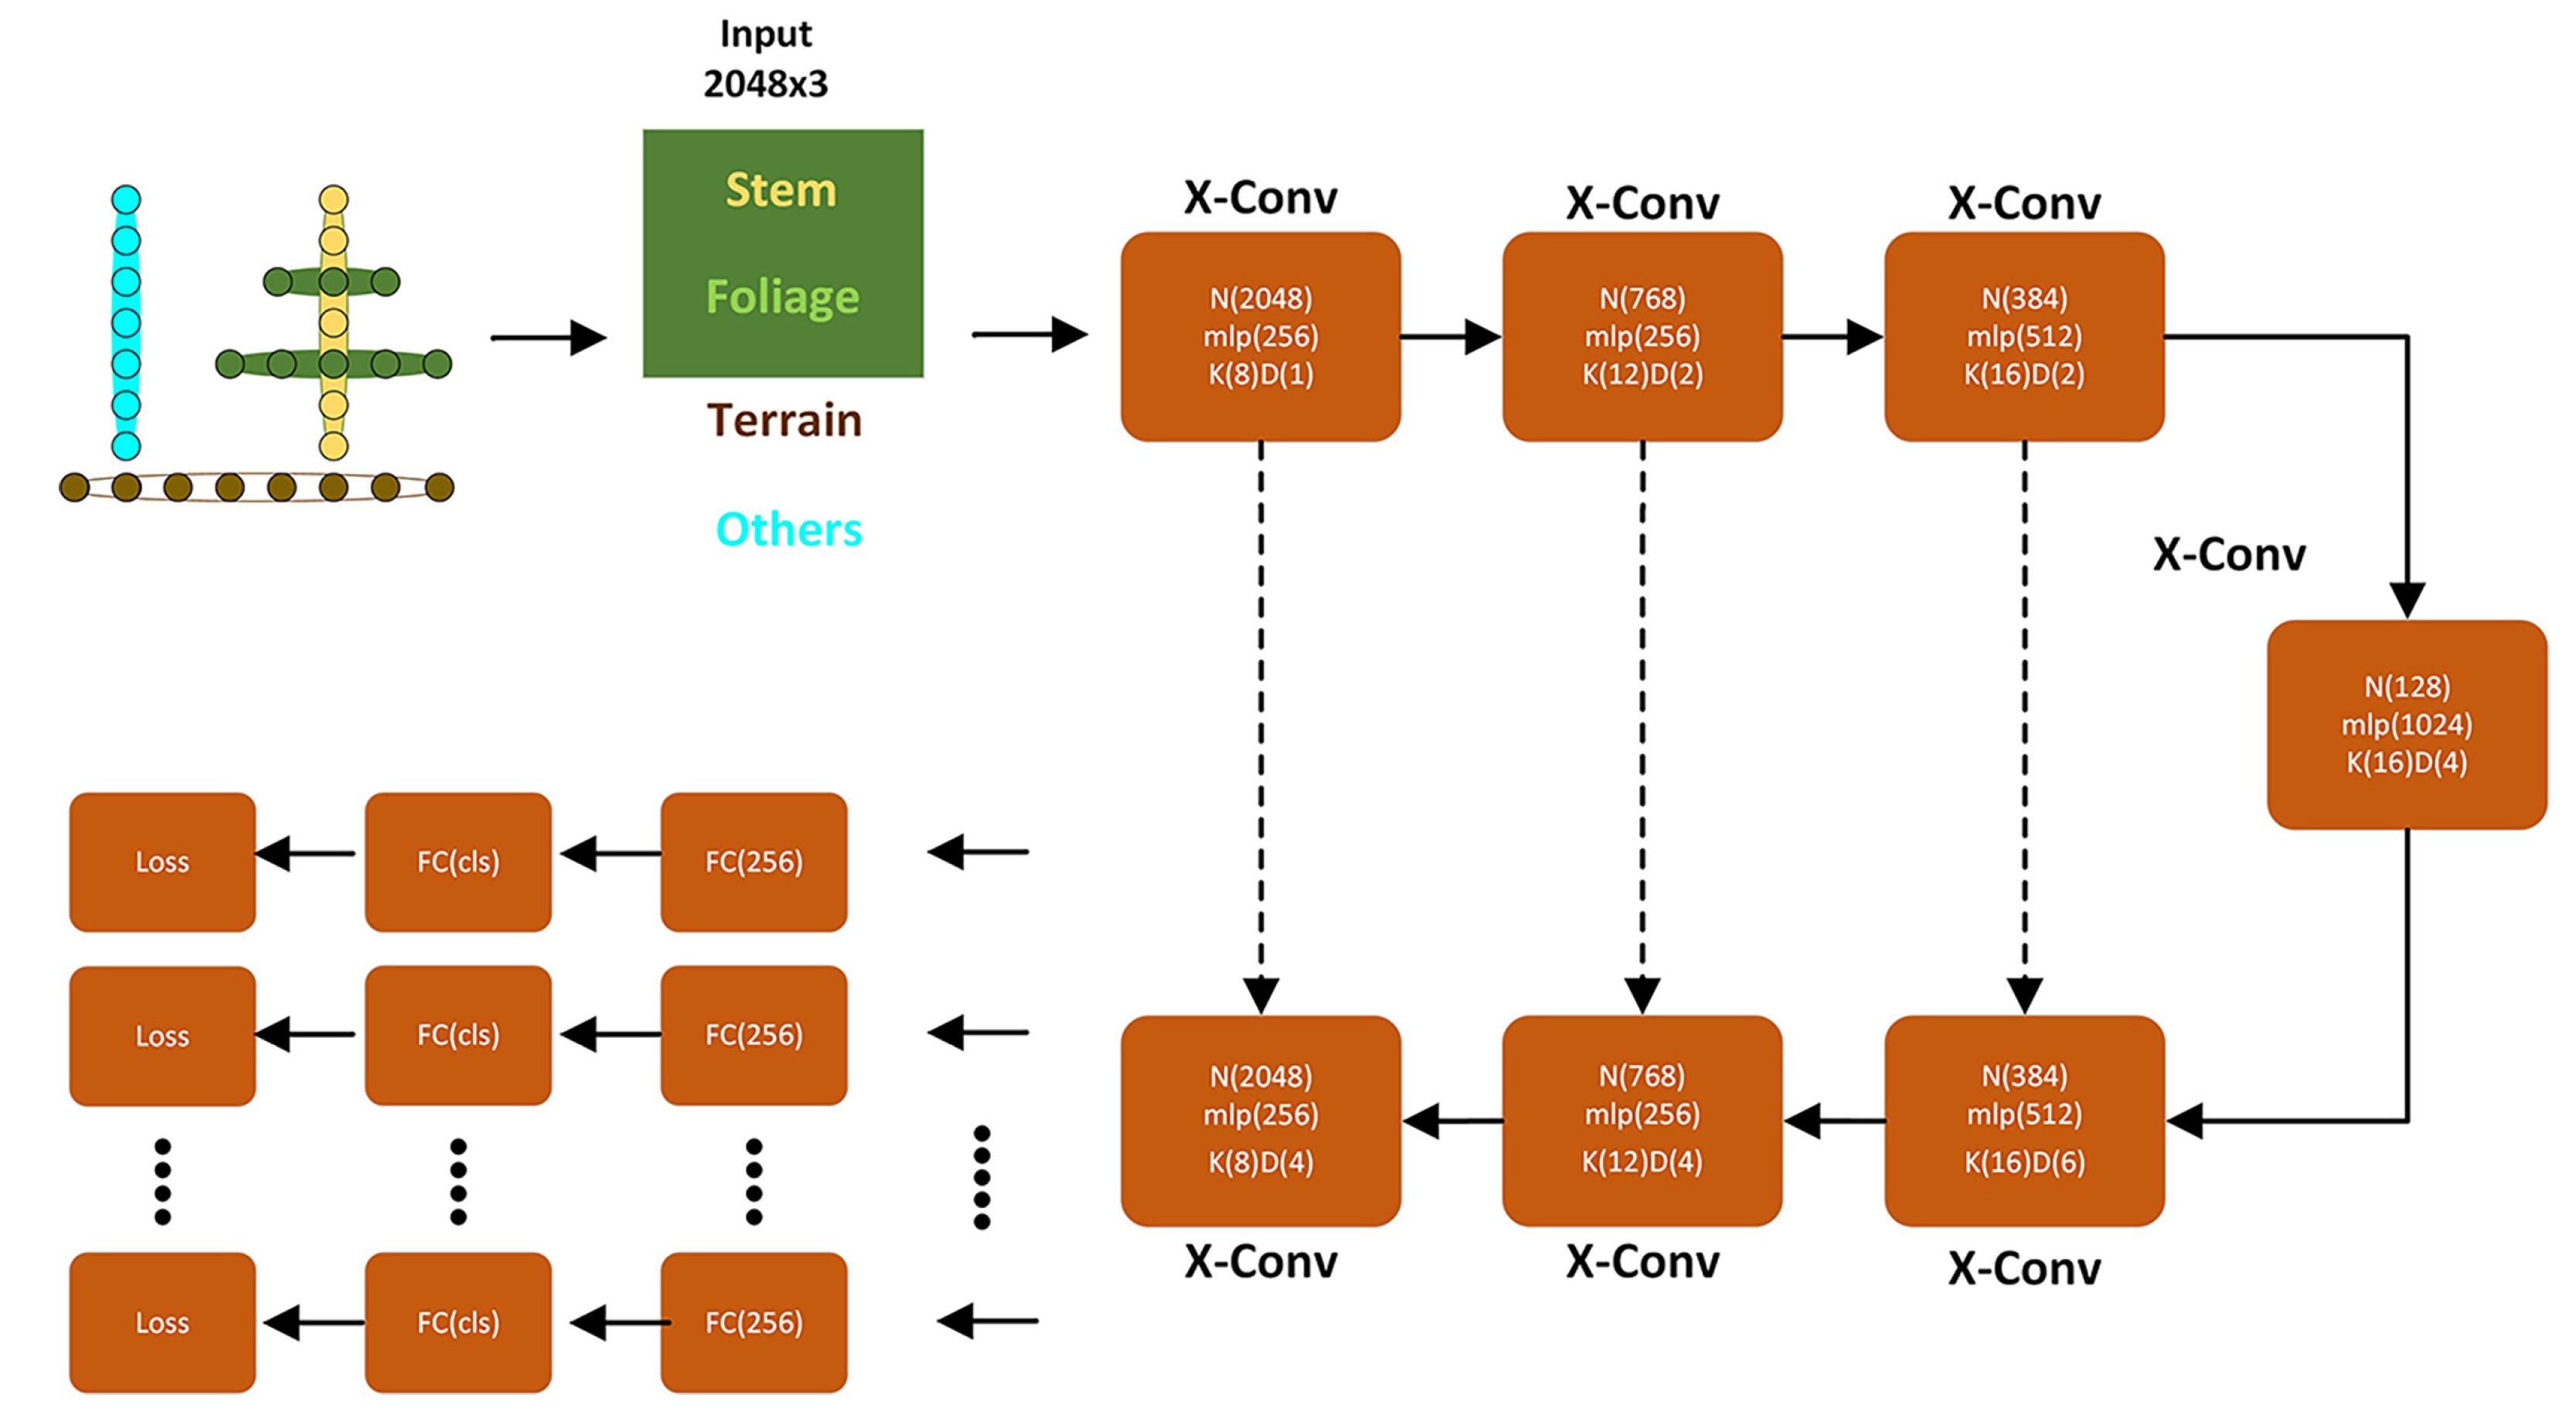
2.5. The PointCNN Deep Learning Network

This paper is based on the PointCNN deep learning network, the structure of which is shown in Figure 6. We did not change the network greatly, merely making it fit our needs. Convolution has been used on a large scale to classify two-dimensional (2D) data; however, since 2D data are often regular and ordered data, this method is not applicable to the chaotic and disorderly nature of 3D data, especially in forestry point clouds where there is also the problem of uneven density and sparsity. PointCNN has changed this situation by presenting an innovative X-conv solution to the above problem, allowing irregular point cloud data to be processed using convolutional methods. It is also much more effective in terms of learning features than the PointNet method of using symmetric functions to deal with point cloud disorder. The PointCNN deep learning network uses an encoder–decoder paradigm, whereby the encoder first increases the number of channels while decreasing the number of points; then, the decoder part of the network increases the number of points while decreasing the number of channels. The network also uses a “skip” paradigm, employing “skip connections” in the same way as in a U-net network [28].
At the same time, CNN and PointCNN differ in two important ways: firstly, in the way local features are extracted. In an image, the extraction of local features is achieved using K x K blocks in a pixel region, whereas in a point cloud, it is achieved using K-nearest neighbors mixed with features from the K-neighborhood via weighted summation. Secondly, the two networks differ in the way that the local information is learned. An ordinary CNN uses pool downsampling, whereas the PointCNN uses an encoder–decoder paradigm. In addition, the computational effort of the X-conv is related to K, which is quite different from the conv effort. A comparison between ordinary conv and X-conv is shown in Figure 7.

2.6. QSM Formation and Tree Feature Parameter Extraction

Modeling the QSM of the tree is achieved by obtaining a geometric model of it, which characterizes the tree’s shape information. This model presents a convenient medium for extracting information on the tree by means of the stem point cloud. A QSM model of a tree can be obtained by downsampling the stem point cloud, which is usually made up of hundreds of blocks that are generally in the form of cylindrical cones, etc. In this paper, cylindrical blocks are used, which are more realistic for tree stems; in most cases, they represent a very accurate choice for estimating tree stem parameters. By constructing our tree model from geometric blocks, it is possible to accurately estimate most of the appearance parameters of each tree, such as the parent–child relationship between branches, the number of branches, and the angle and length of these branches. The surface area of the canopy and the area that it covers, the forest canopy closure (FCC), and other parameters can all be obtained. In this paper, QSM modeling of the stem point cloud obtained by the semantic segmentation of the leafy point cloud of Populus tomentosa was used to obtain the exact feature parameters of each tree in the testing set. This demonstrates that tree parameter extraction via contactless means is a reliable and efficient way of extracting feature parameters and represents an important research direction.
In this paper, the QSM model was built from our extracted stem point cloud using the TreeQSM method. An example of a modeled tree is shown in Figure 8. TreeQSM is a free and open source MATLAB (version R2021b) software program with high precision, high compilability, rapid working speed, and high reliability. In this paper, the tree height and DBH of the trees calculated using the QSM model were counted and then compared to our manually collected data.

2.7. Training and Performance Measures

In this section, we go into more detail about the process of training semantic segmentation models and the parameters of the training, along with how we validate our deep learning models. All data labeling, model training, and testing were performed on the same personal computer. An Nvidia 2080Ti GPU was used for CUDA-accelerated computing during the deep learning training process. The basic training parameters for this paper are shown in Table 3.
In this study, the breast diameter and tree height extracted by the QSM model were plotted for comparison. In addition, the actual values for breast diameter, which were measured manually, were compared with the measurements extracted by the QSM model. These two comparisons illustrate the validity of our approach. The segmentation of the testing set T1–T3 was compared to the evaluation of the deep learning network, while the semantic segmentation effects of the model were evaluated using precision, recall, weighted recall, and overall accuracy, as shown in Equations (1)–(4). In addition, the Python package, numpy, and seaborn were used for assessing our methods and producing confusion matrices.
OA = T P + T N T P + T N + F P + F N
Precision = T P T P + F P
Recall = T P T P + F N
Weighted   Recall = i = 1 4 R i × W i
In the above equations; TP represents the true positive; TN represents the true negative; FP represents the false positive; FN represents the false negative; and i = 1–4 represents terrain, foliage, stems, and the other, which are the four categories in this paper.

3. Results

In this section, we present the results obtained from the semantic segmentation of the three testing datasets, using models trained with different levels of blending of the leafy and leafless point clouds, as well as the results obtained from building QSM models from the segmented stem point clouds.

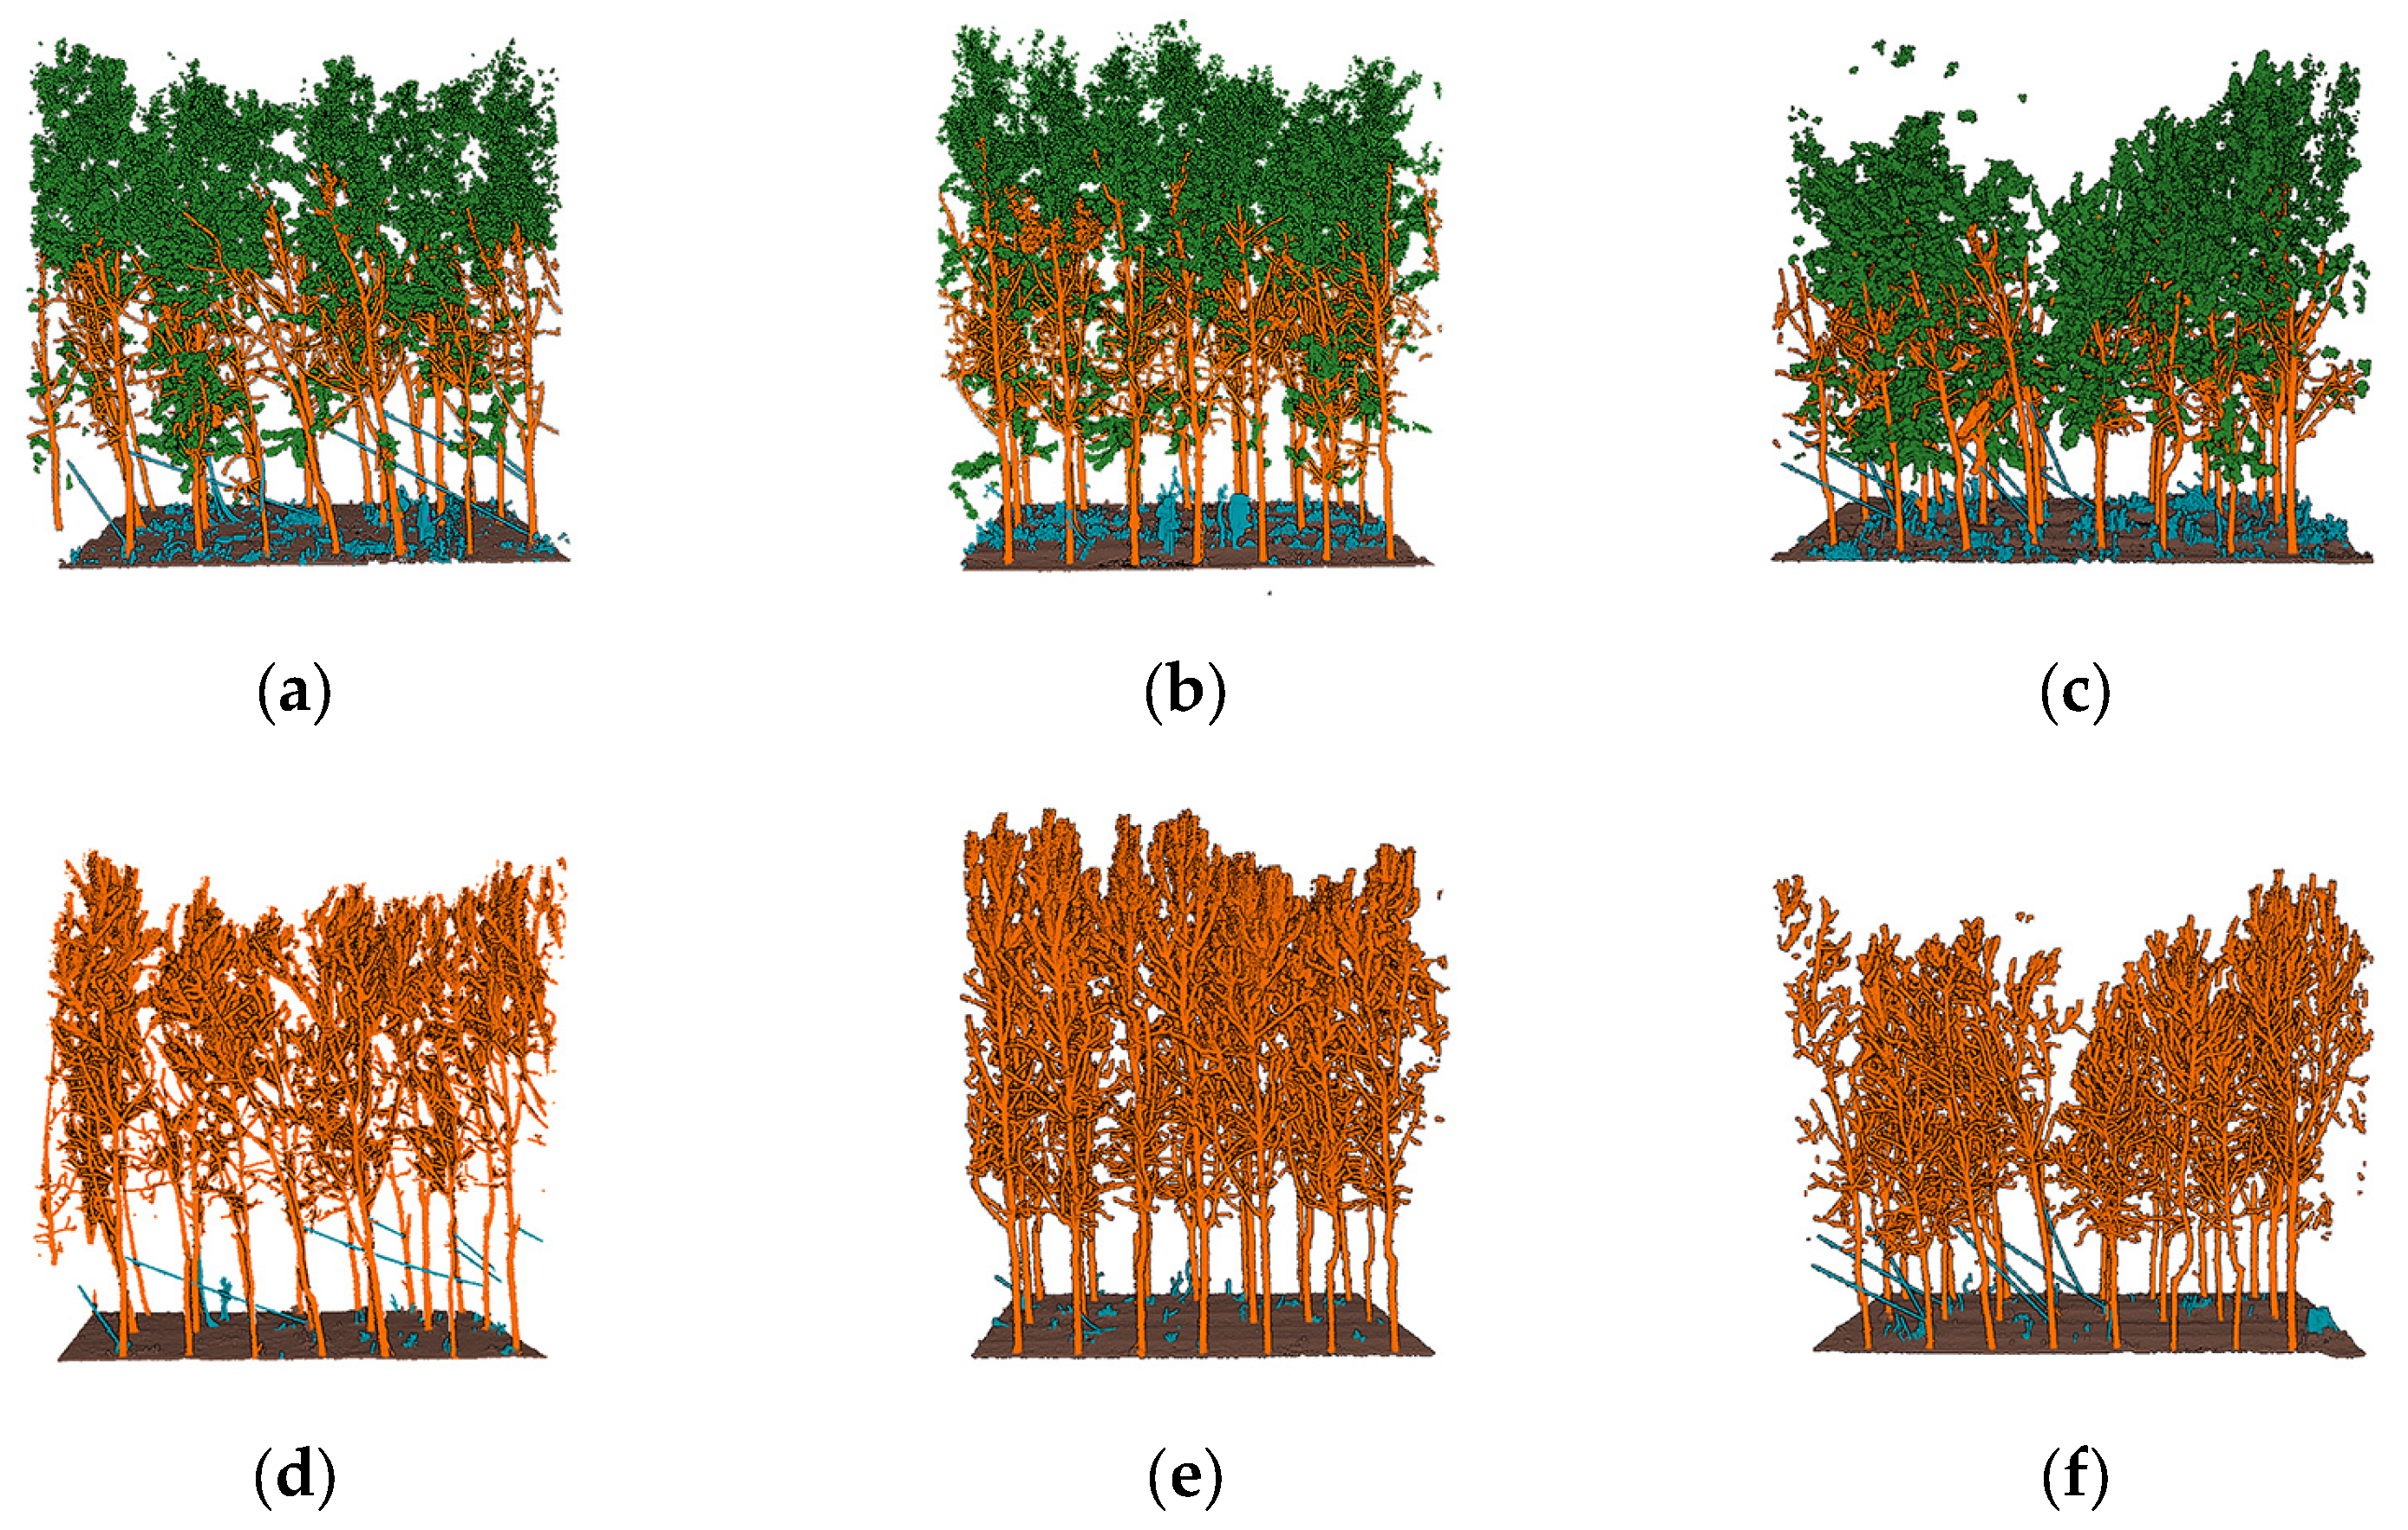
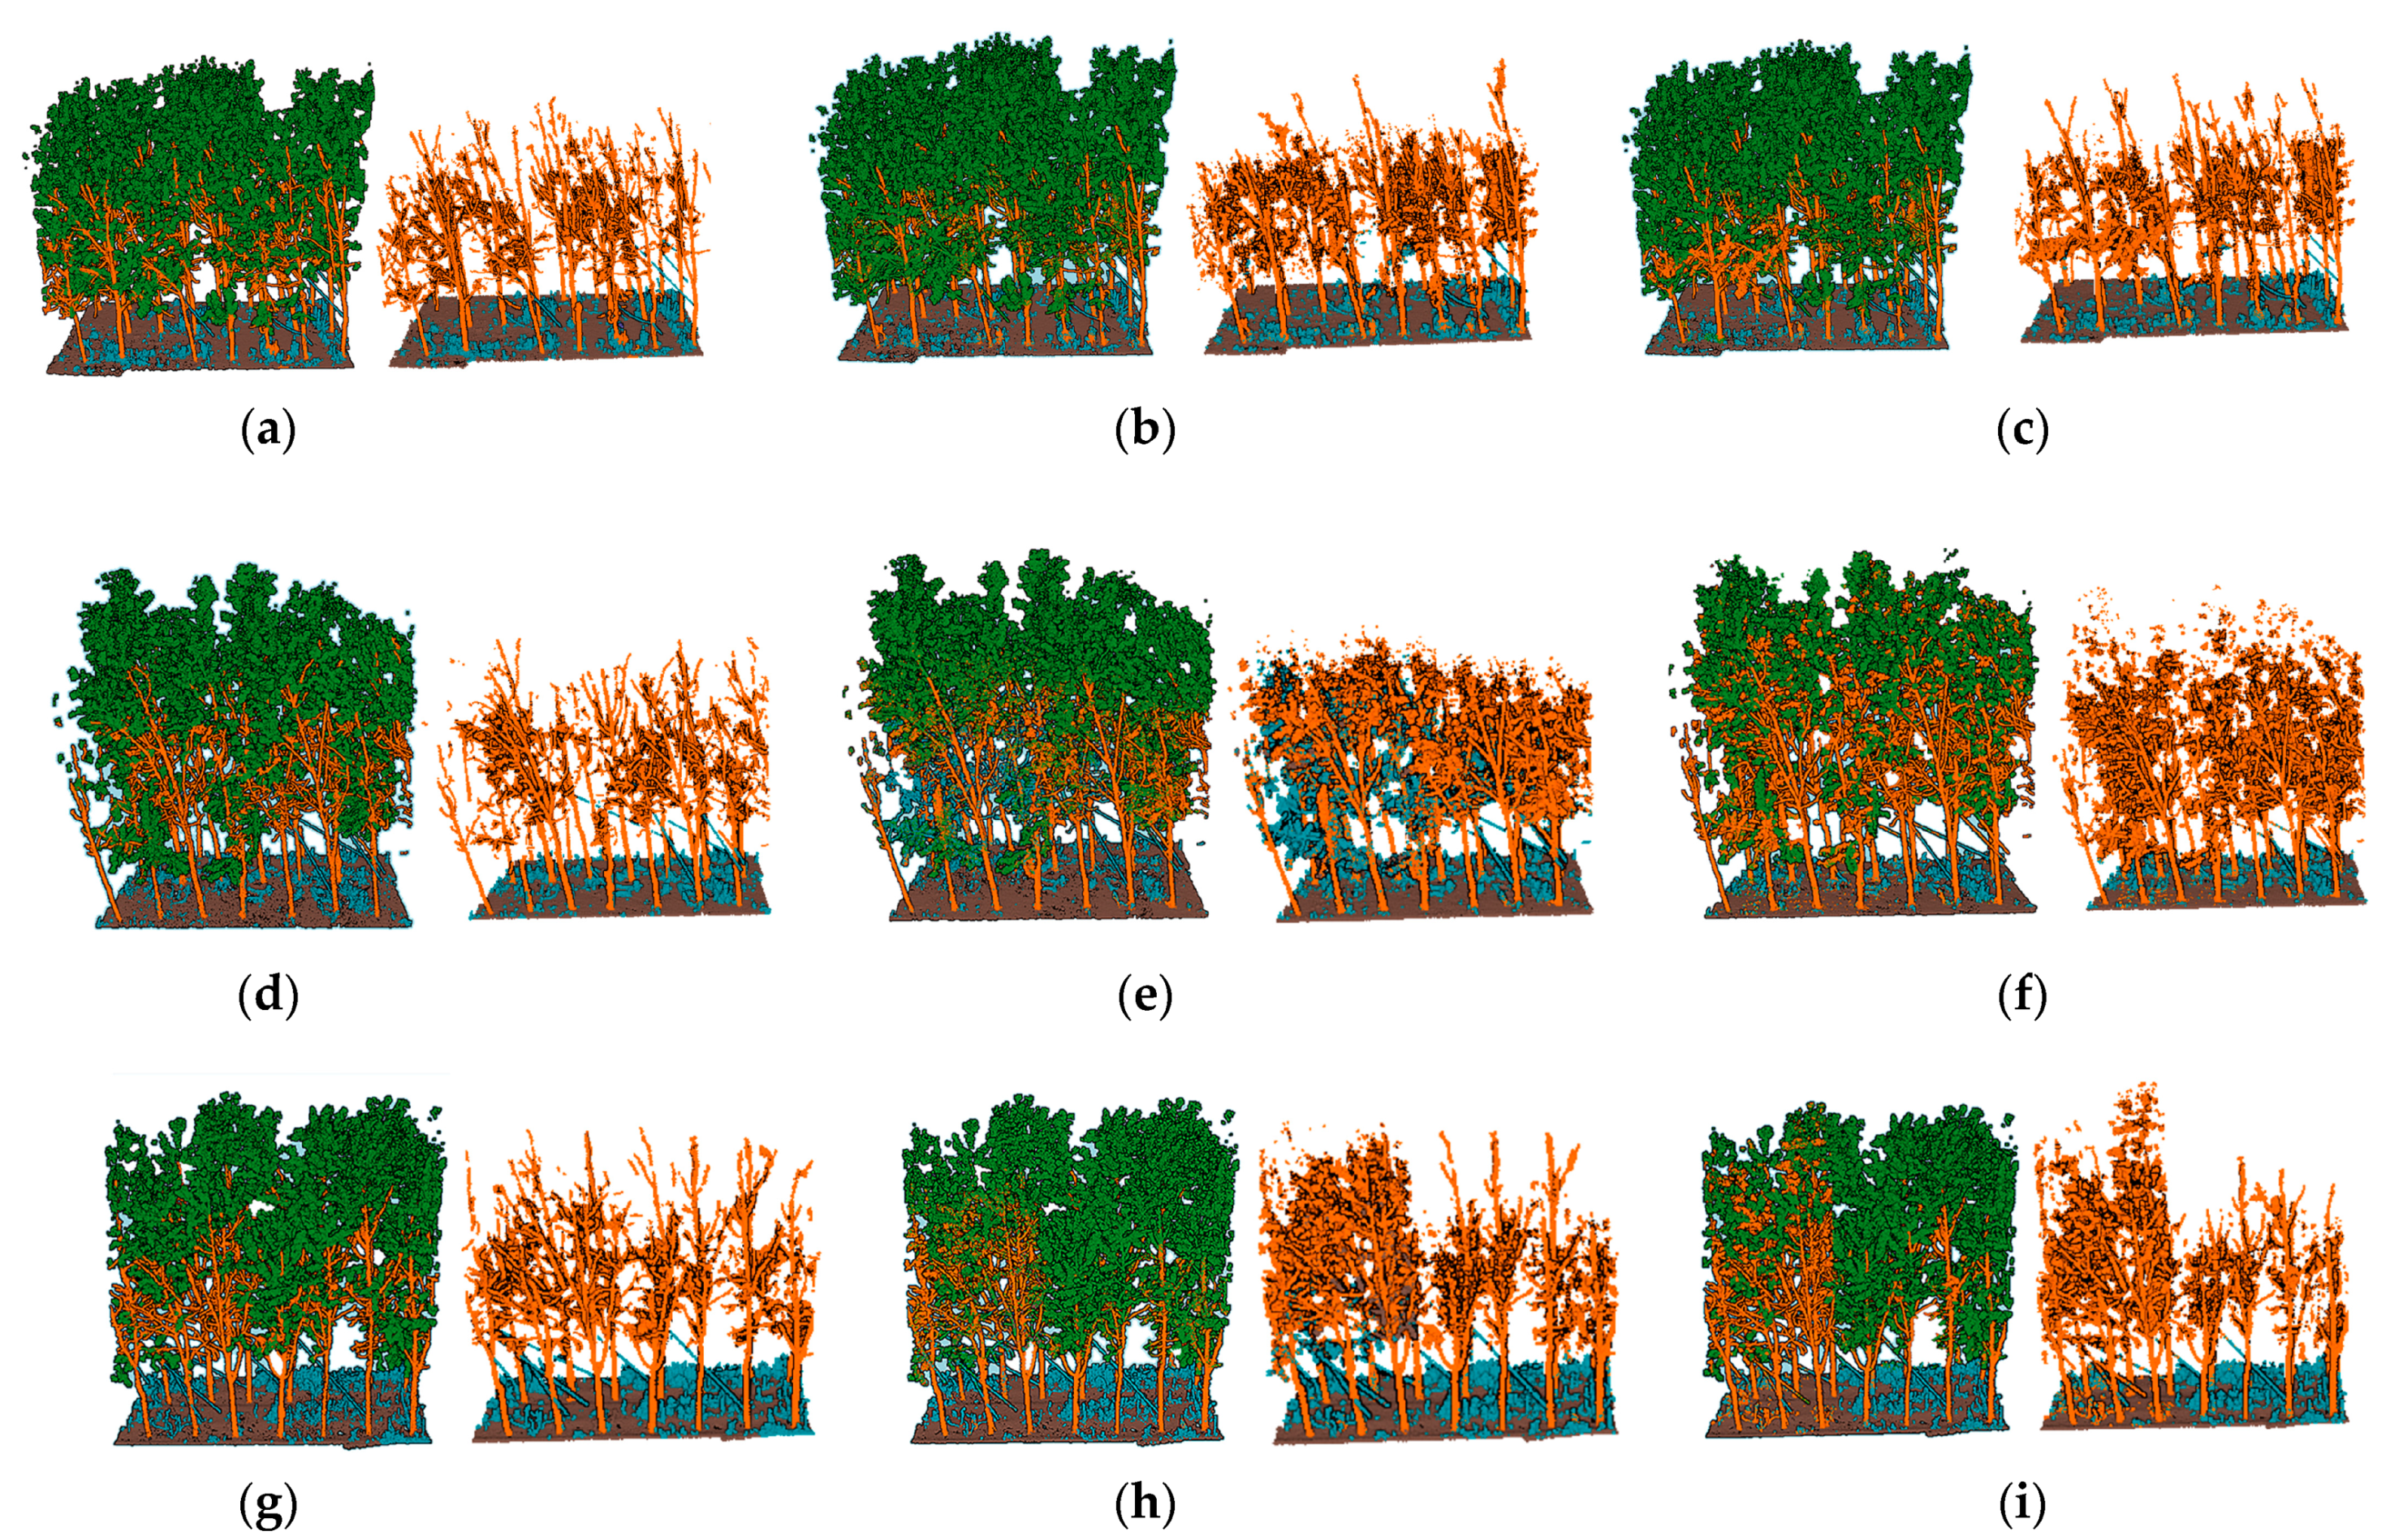
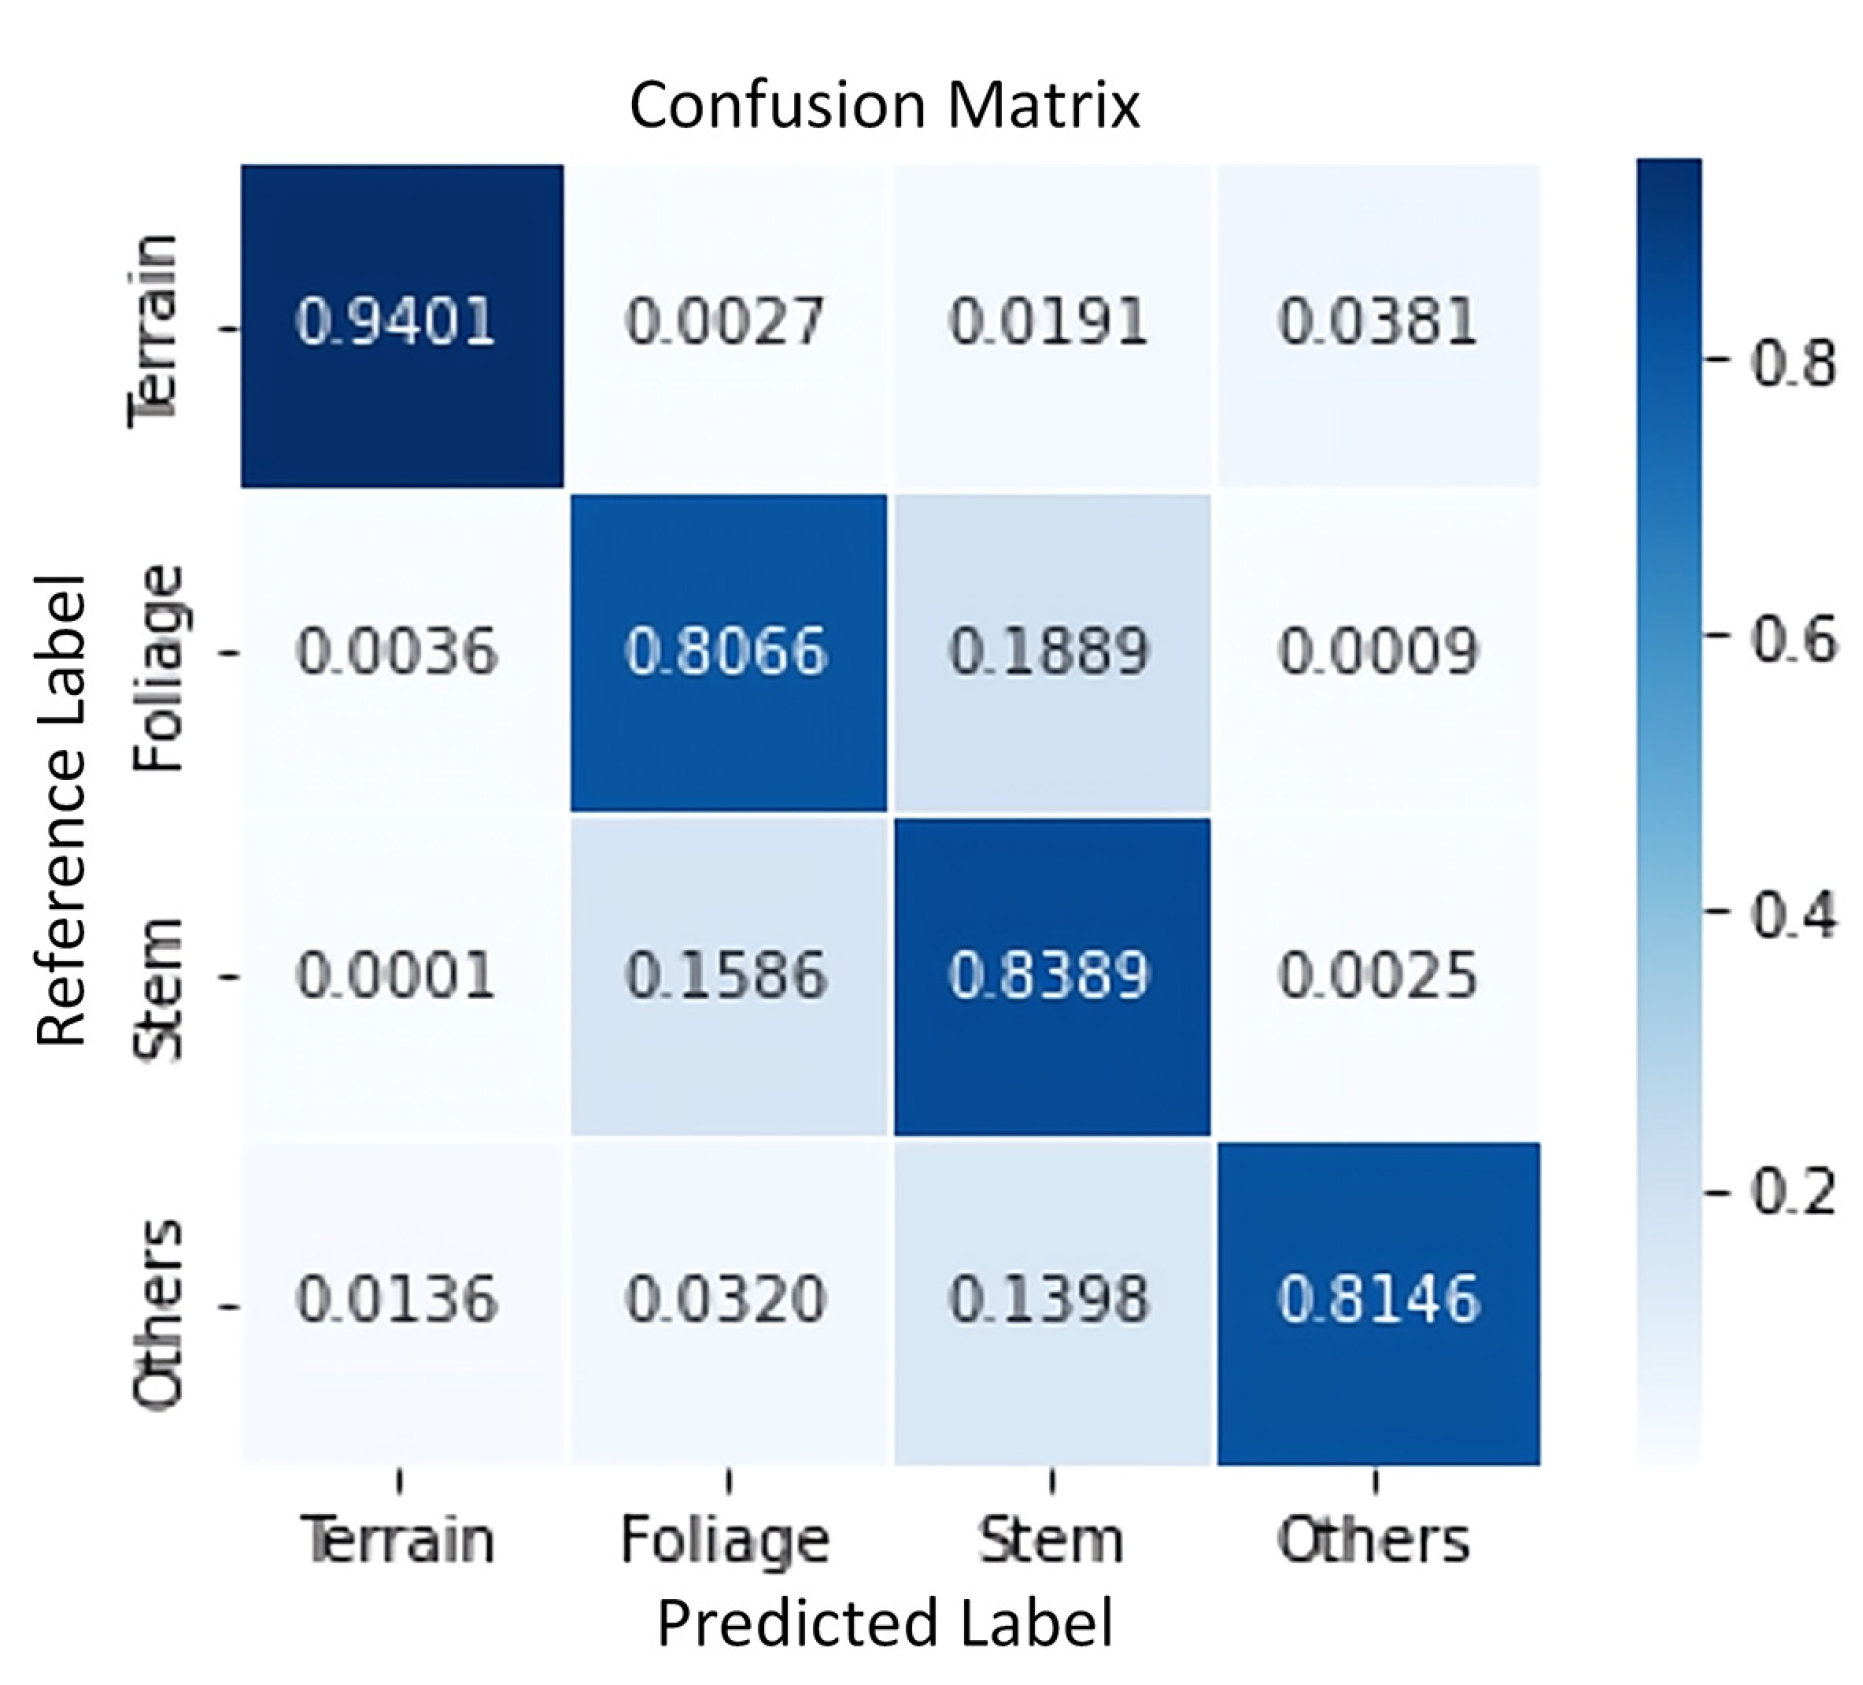
3.1. Semantic Segmentation Results

Figure 9 shows the semantic segmentation results of the three testing sets, in each figure on the left are the results with leaves and on the right are the results with no leaves shown. Figure 9a,d,g in the left column show the manually segmented reference point cloud, Figure 9b,e,h in the middle shows the segmentation results when all the training point clouds are leafy point clouds, and Figure 9c,f,i in the in the right column show the segmentation results for the 6-1 mixed training model (six leafy point clouds and one leafless point cloud mixed trained model). As can be seen, the segmented stem point clouds are more accurately segmented in the mixed training model than in the model that was trained without the mixed leafless point cloud. These semantically segmented point clouds are, in general, visually very similar to the manually annotated reference dataset, with a segmentation accuracy of 0.839 for tree trunks in the model that was trained on the 6-1 mixed dataset and 0.801 for the model trained on the leafy point cloud. Although some of the foliage and stem data are erroneously classified as terrain or other points, and other points are erroneously classified as stem, this issue is not frequent. Some incorrect divisions between foliage and stem occurred, usually in the case of the topmost branches. In T2, the foliage tended to be incorrectly divided into stems, probably because the trees in T2 had a greater density of foliage, a higher degree of canopy density, and smaller spaces between the trees.
After segmenting the three testing sets separately, using models trained with all leafy data, and after partially replacing leafy point clouds with leafless point clouds, we observed that the method using the 6-1 dataset presented the highest stem segmentation accuracy and total accuracy, as shown by the confusion matrix in Figure 10. In terms of the four labels, we also observed that the “stem”, “other points”, and “terrain” categories presented significantly higher accuracy than the foliage, while the “terrain” points had the highest precision of the whole map.
Artificially planted Populus tomentosa Carr. trees have many branches, a large branch-to-diameter ratio, and small and numerous leaves. In all experiments, the 6-1 method of mixing leafy and leafless data presented the highest stem segmentation accuracy and total precision; therefore, more specifics as to how the three testing sets were segmented by the model trained on the 6-1 dataset are given in Table 4. Of these, the T1 dataset had the highest weighted precision, T3 had the highest weighted recall, and T2 had the highest trunk recall; however, this also resulted in more foliage being mis-segmented into stems, giving a lower recall value for foliage, although the overall accuracy of this method was reliable.
In this study, we conducted several comparison experiments, replacing one piece of leafy data with leafless data from the training dataset each time. Here, we focused on recall and overall accuracy, the specifics of which are shown in Table 5. The method using the 6-1 dataset presented the highest stem segmentation accuracy and overall accuracy. Subsequently, as more leafless data were added, the recall value for foliage gradually decreased, and the overall accuracy gradually decreased, which was mainly due to more leaf points being misclassified as stem points. Therefore, we believe that the appropriate addition of leafless point cloud data in this study is beneficial for use in training a model with higher accuracy.

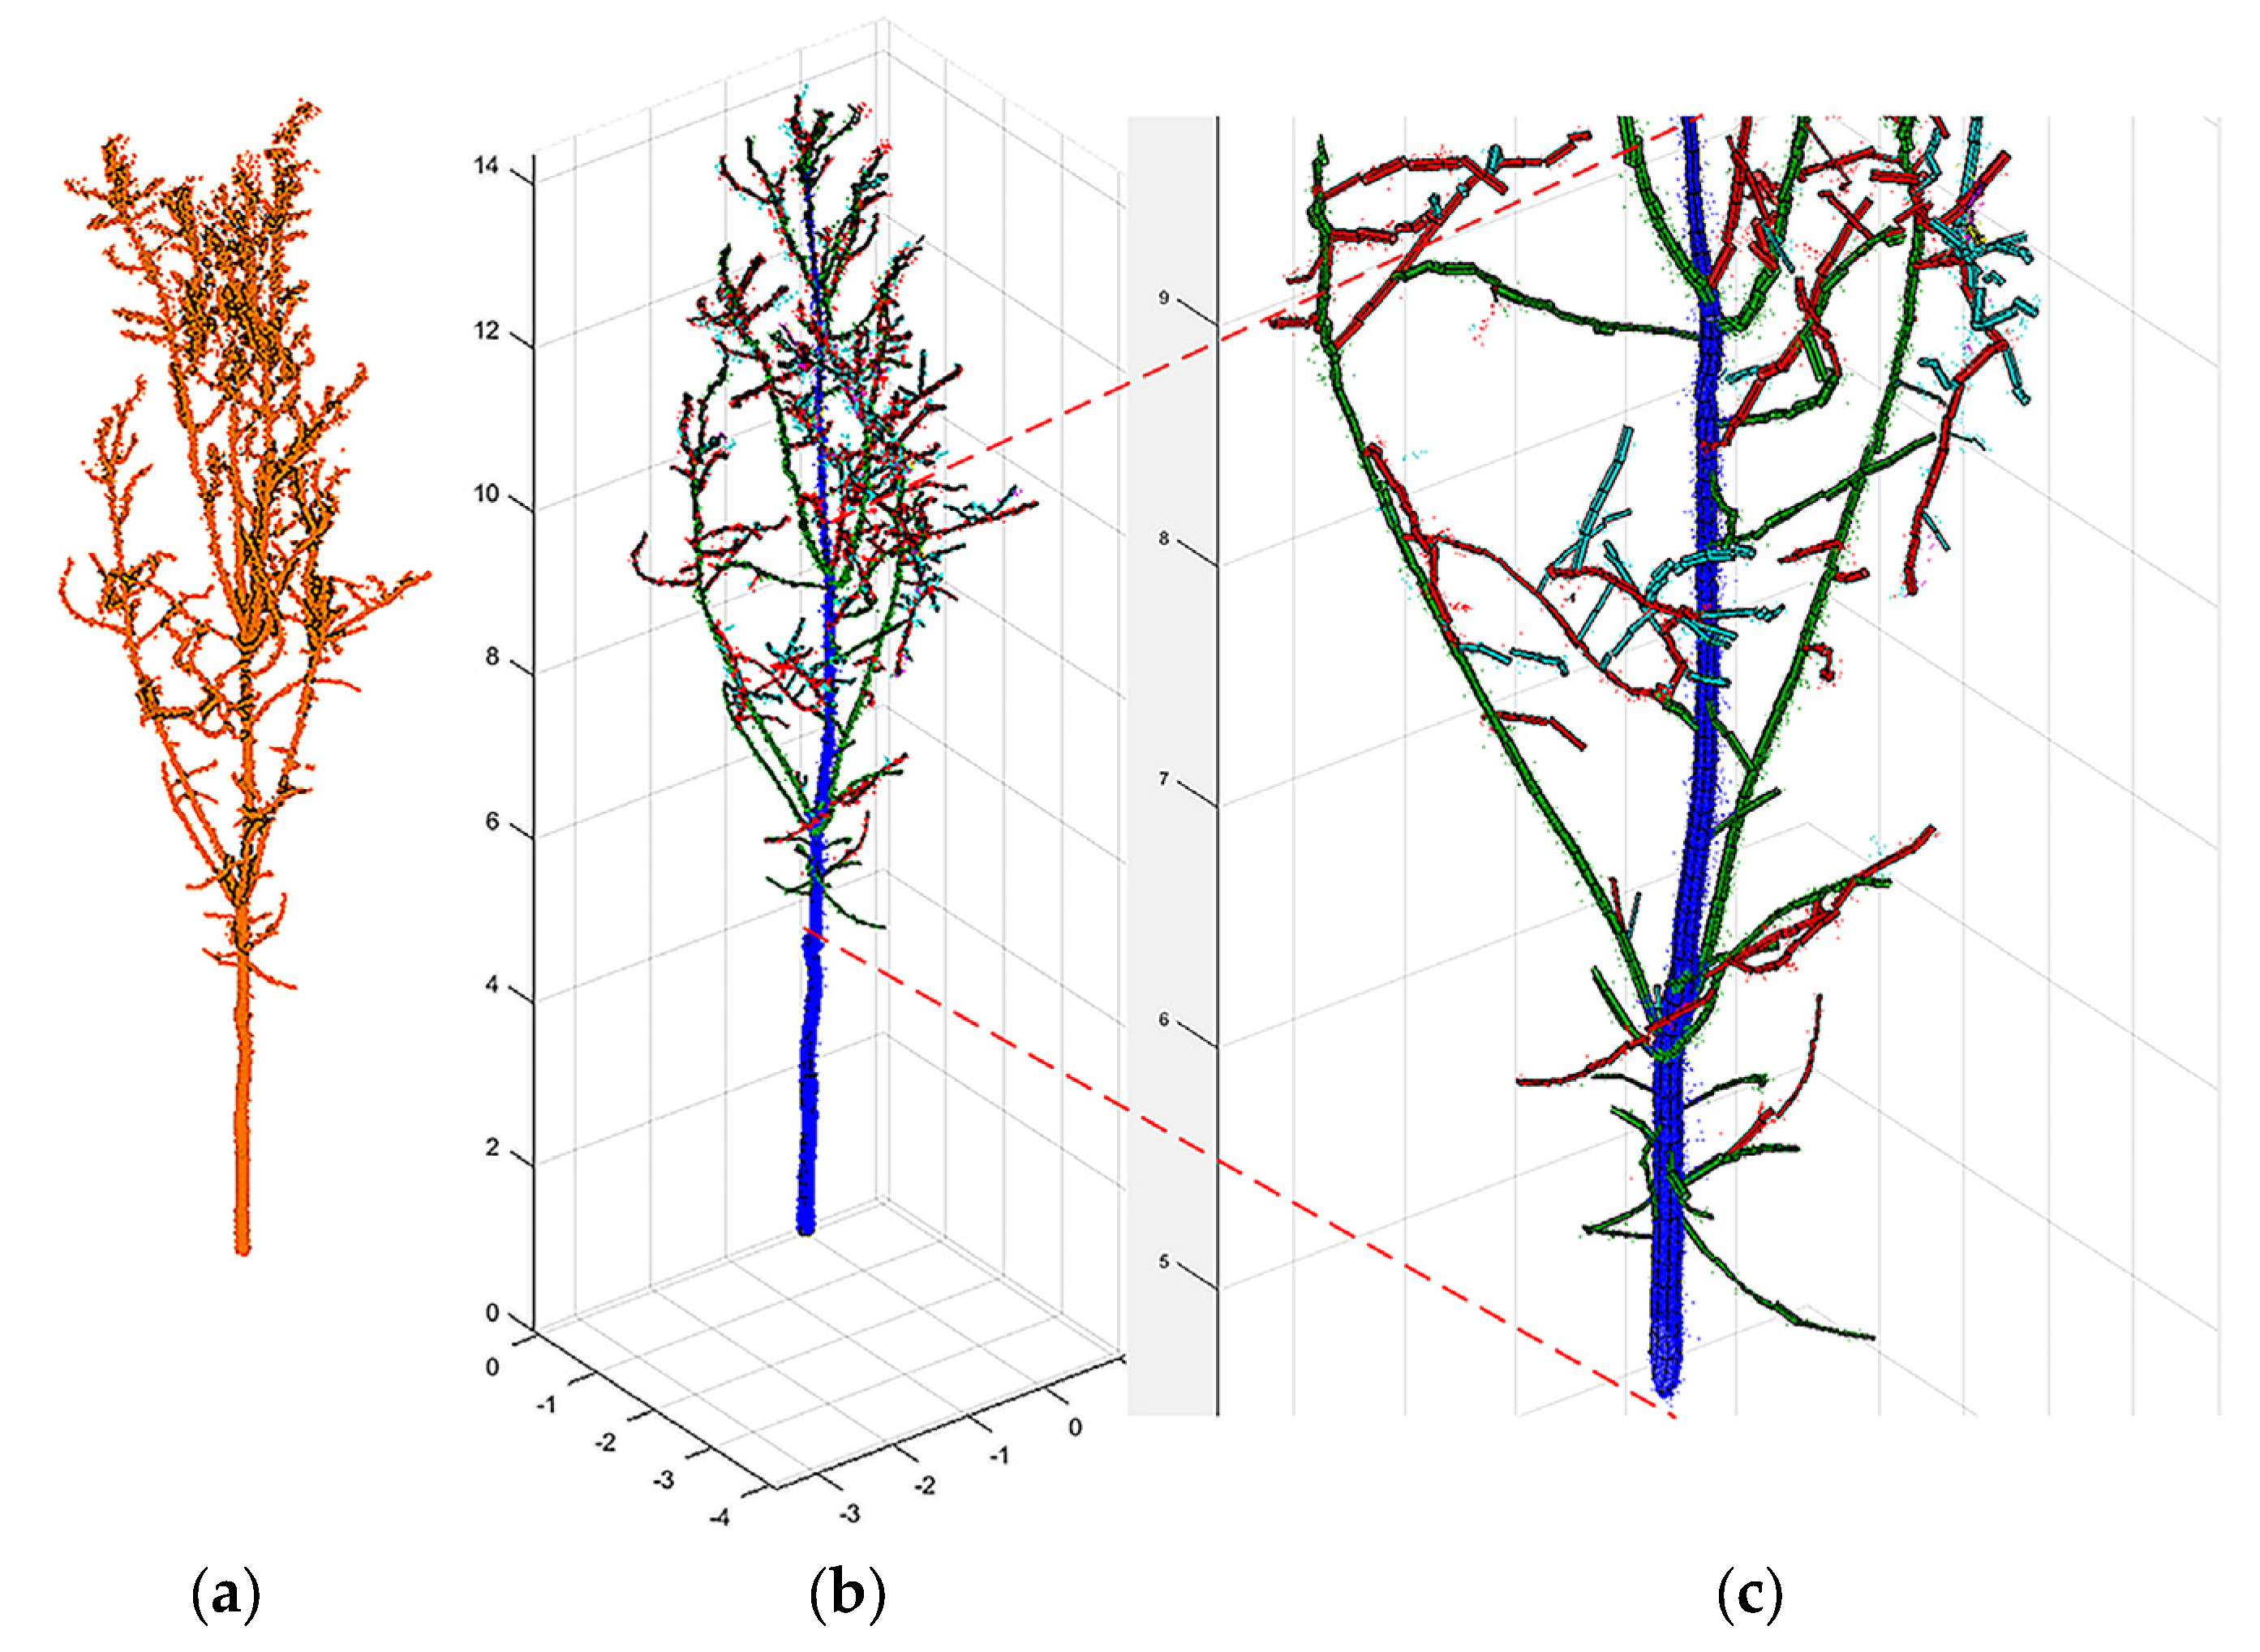
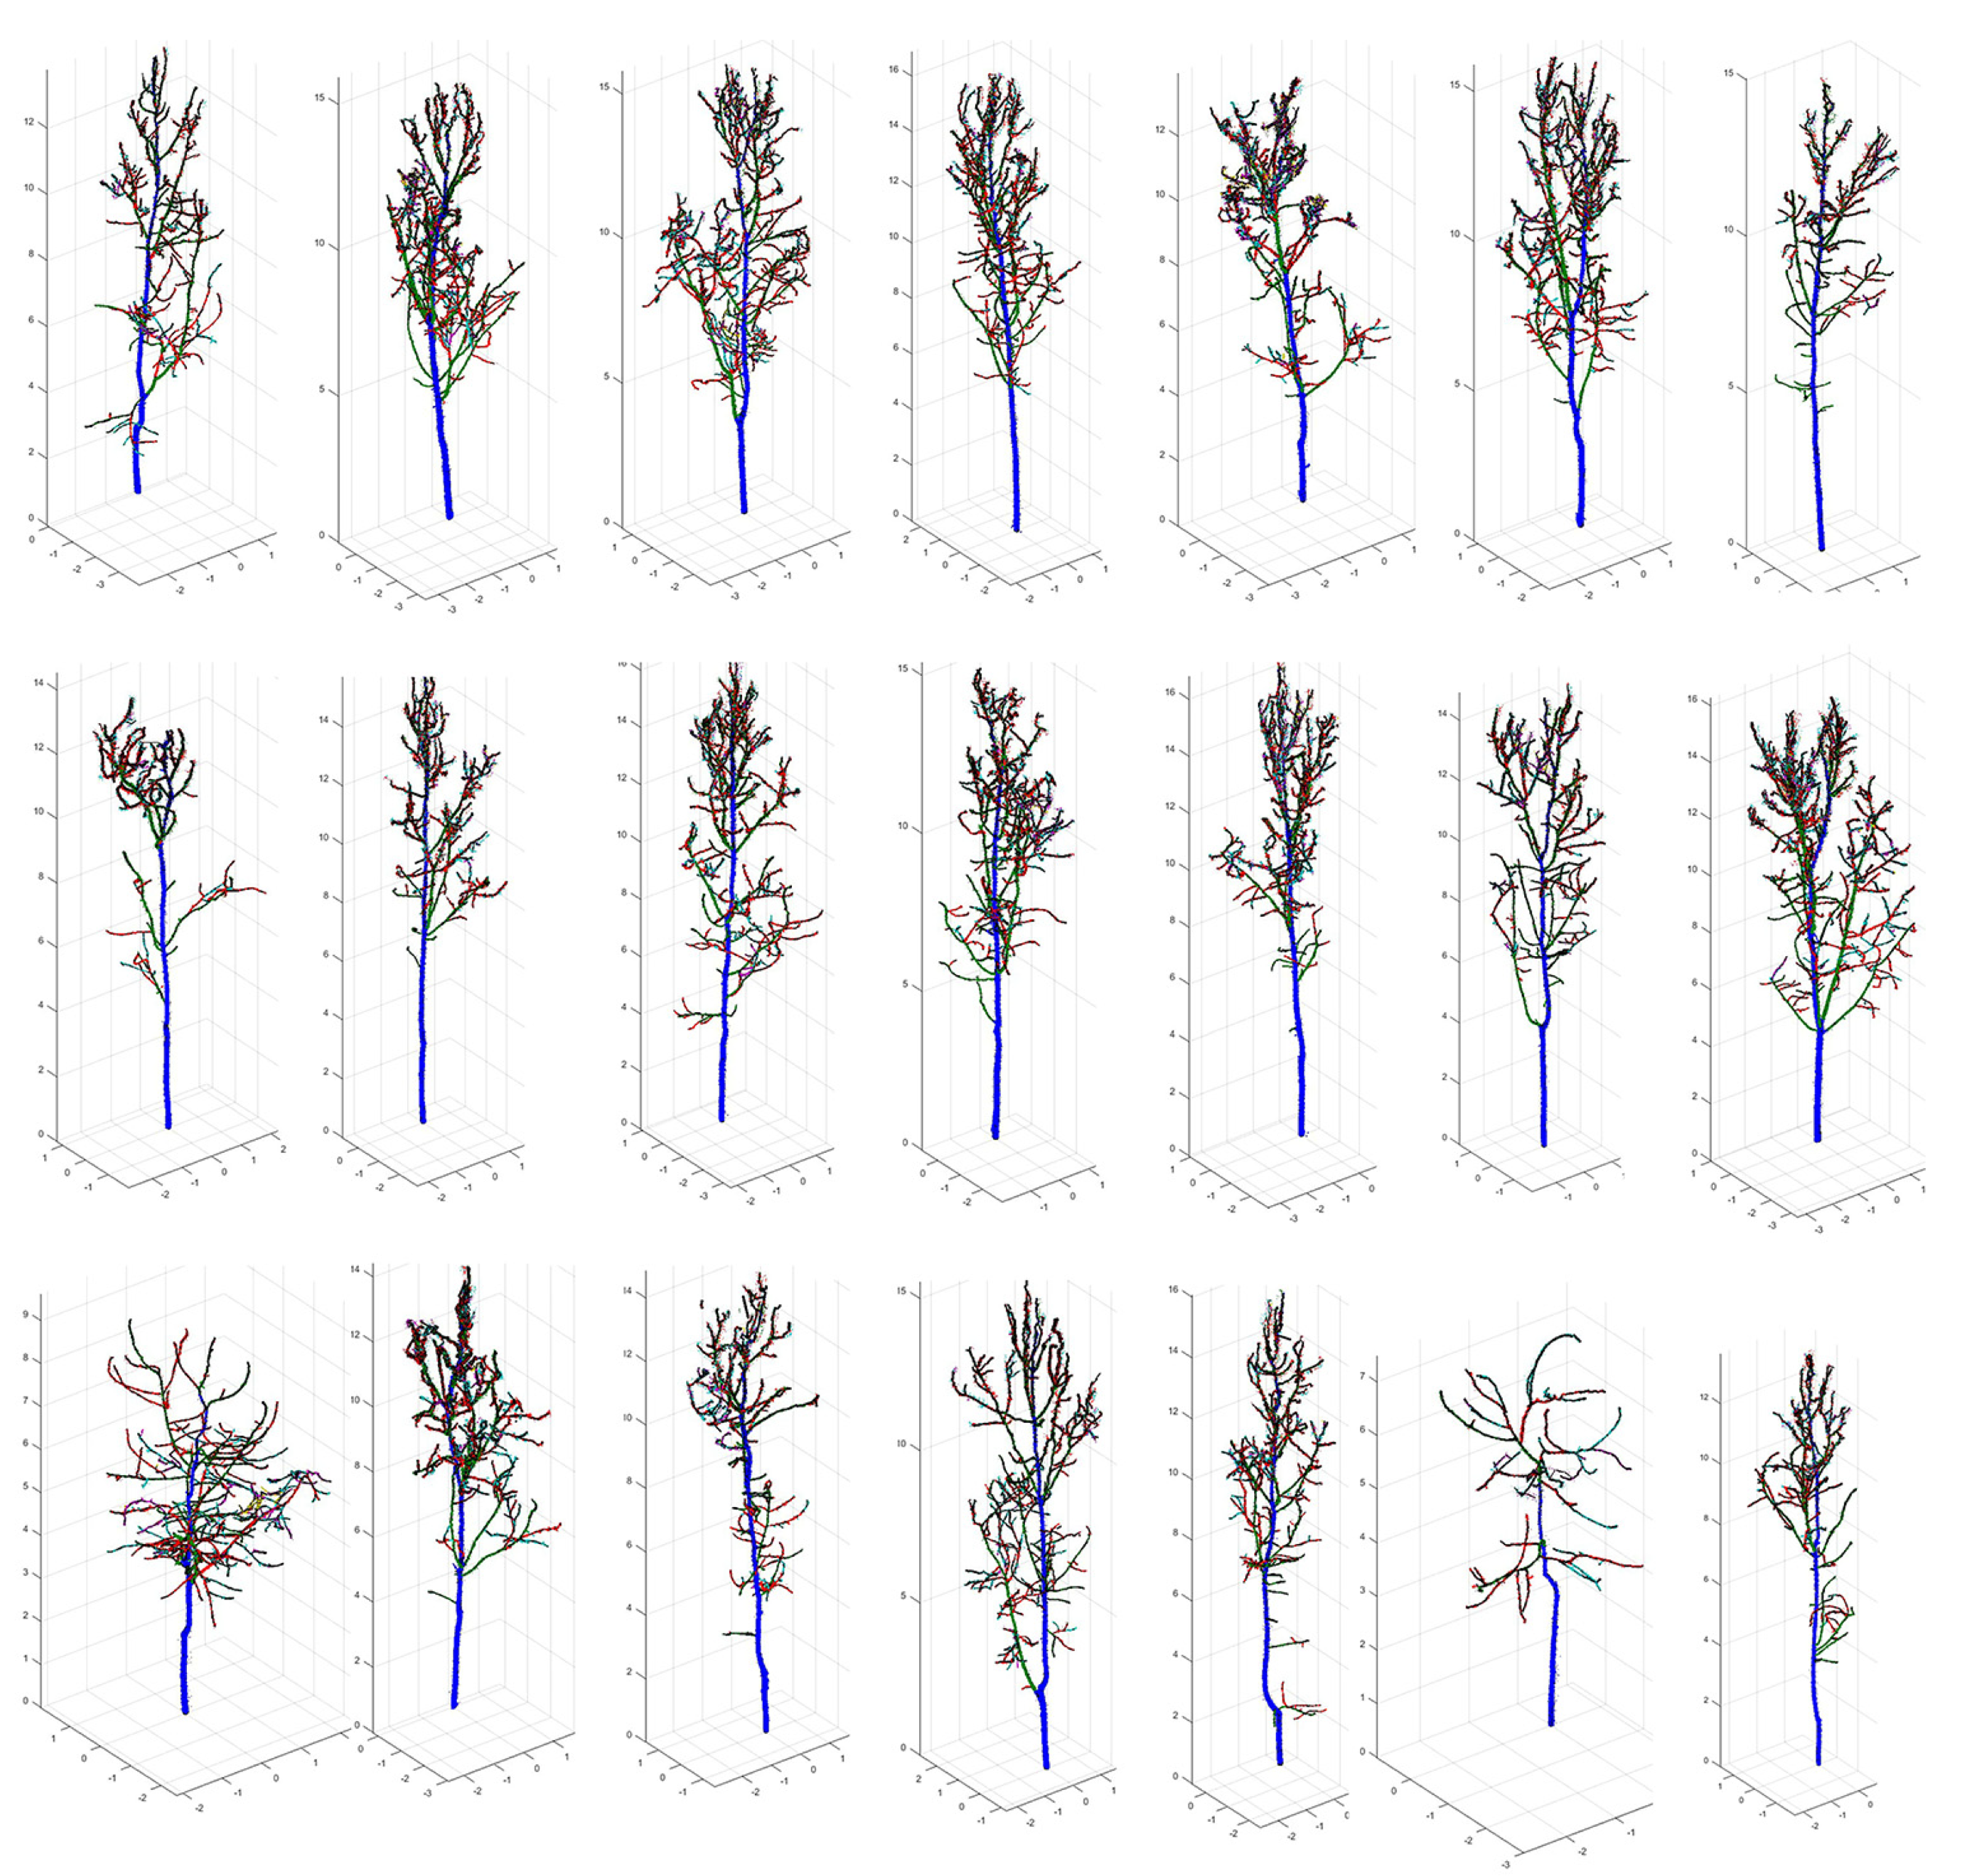
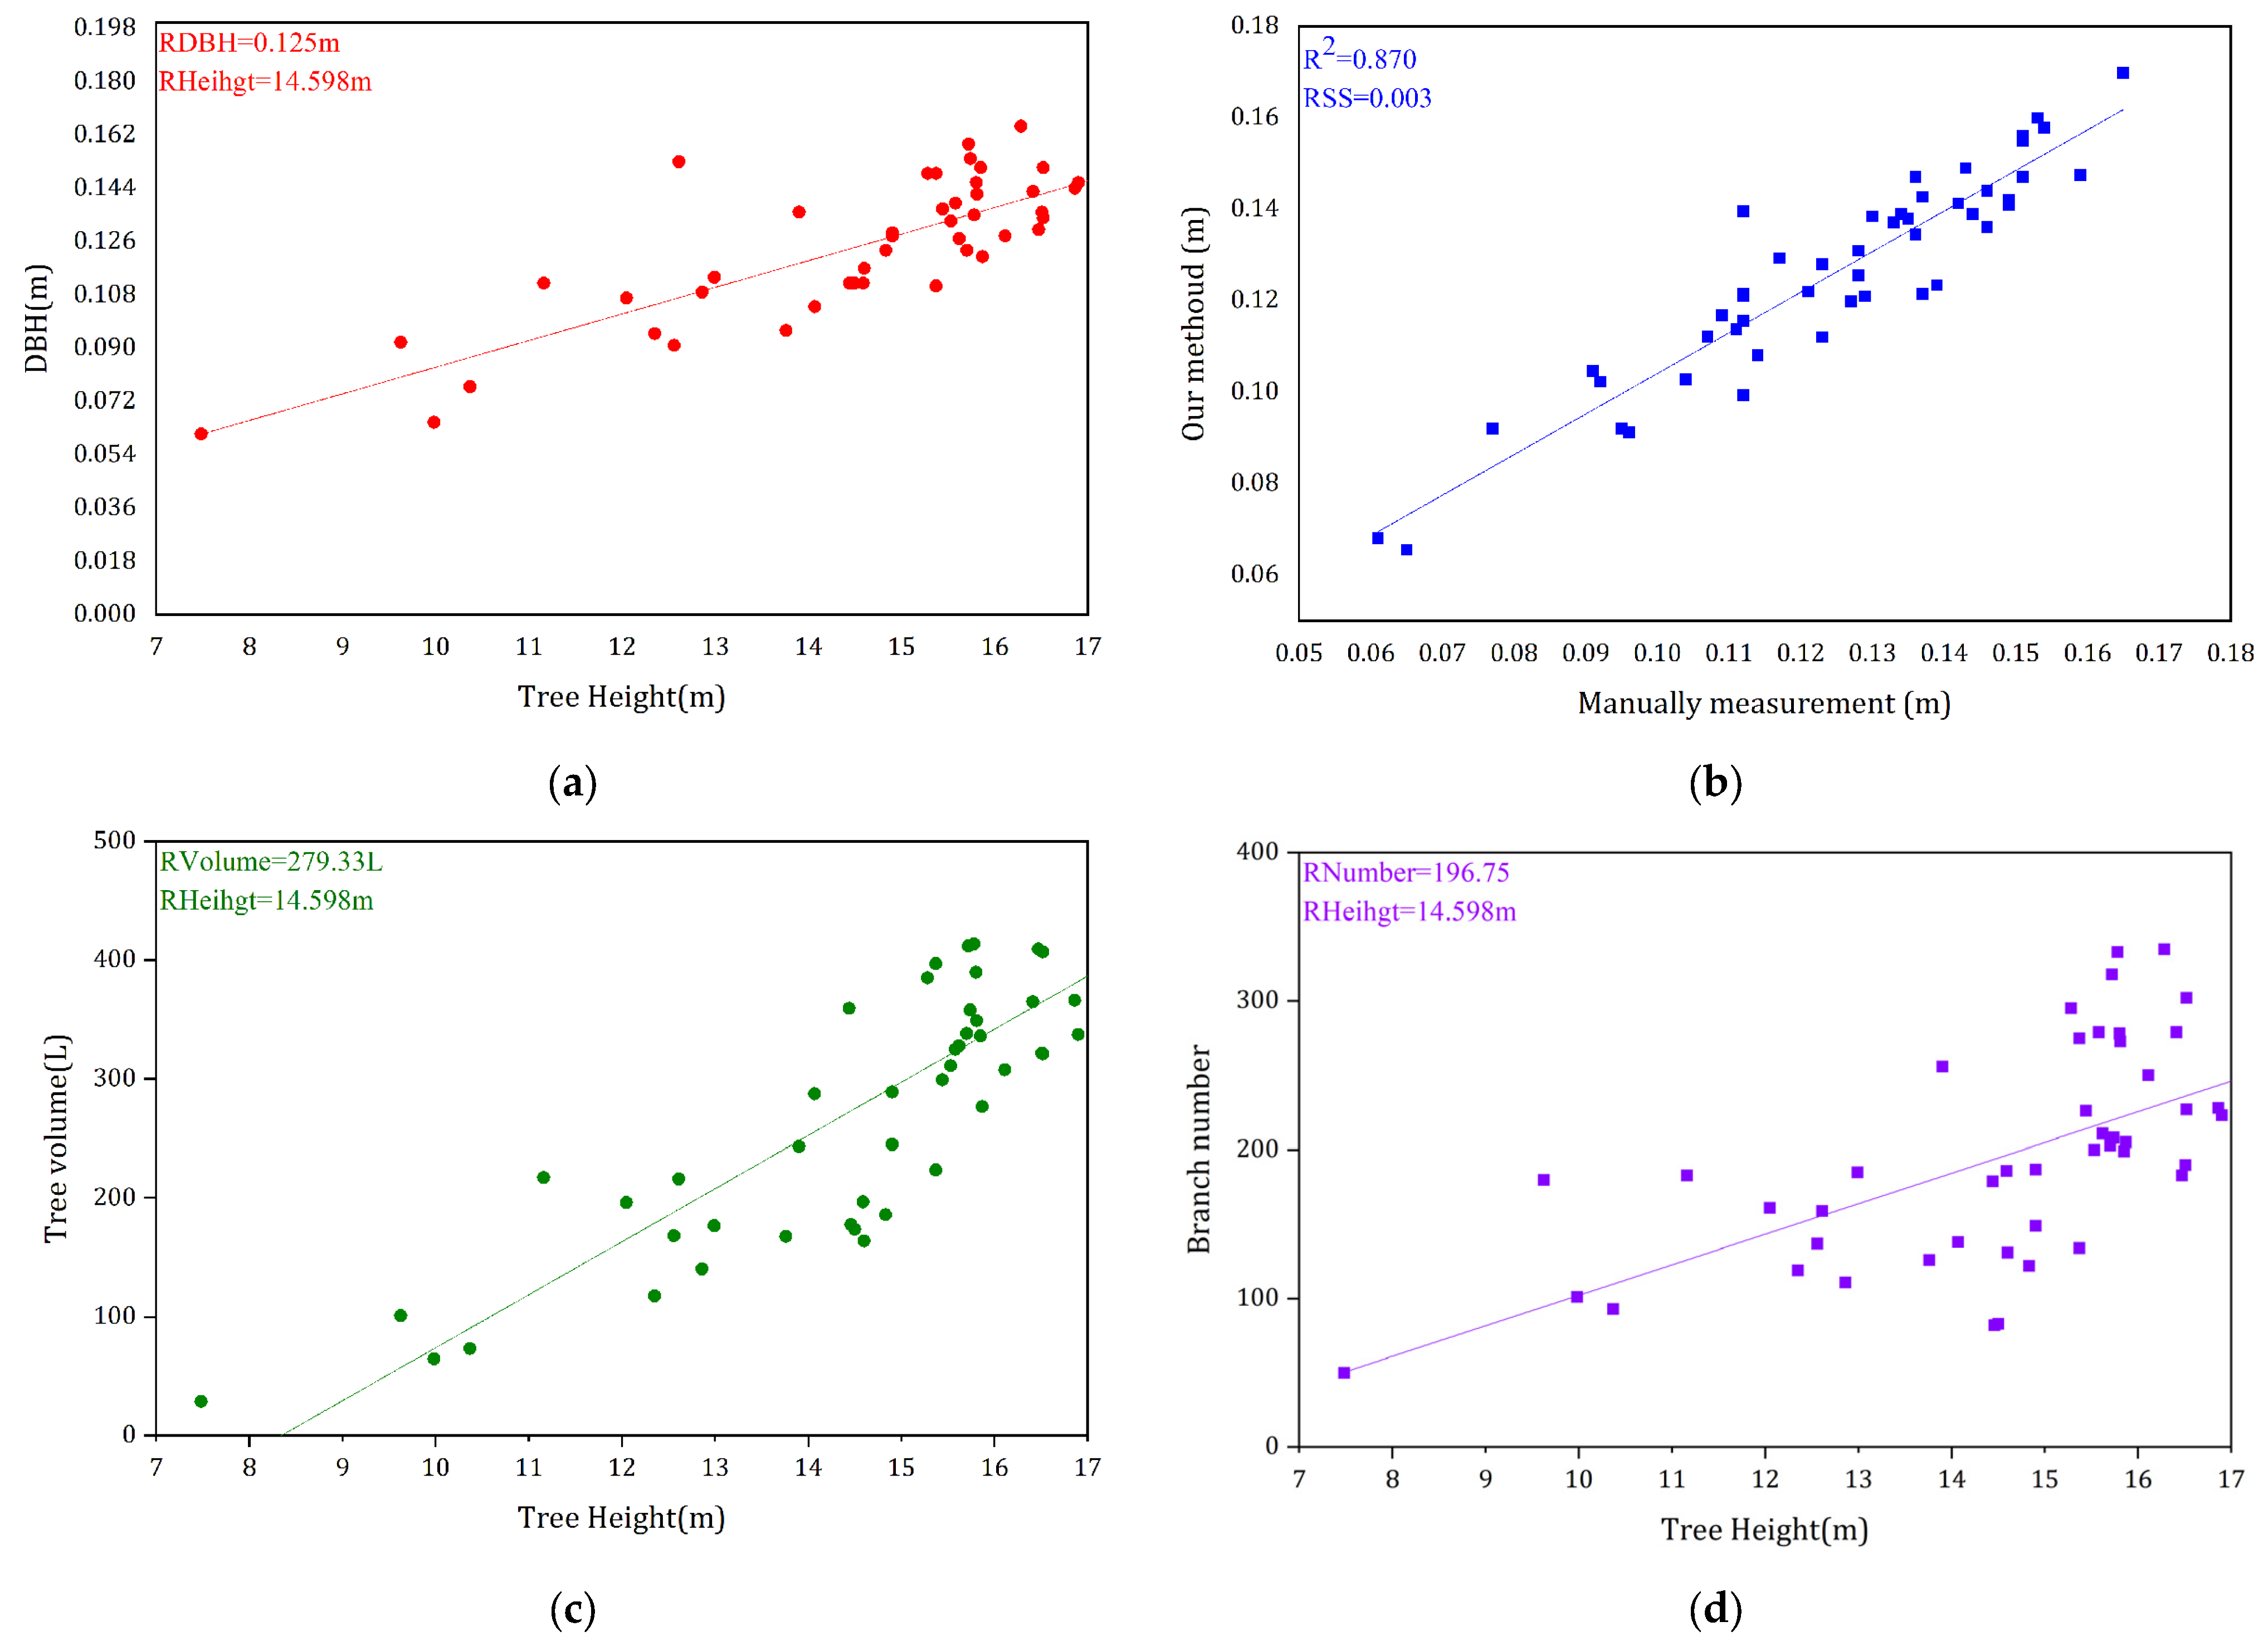
3.2. QSM Model Results and the Extracted Parameters

In this section, we show the results of the QSM model that was built from the segmented stem point cloud and the extracted tree feature parameters, which is an extremely important step in our method. The stem point cloud that is obtained after semantic segmentation is not 100% accurate; therefore, we have made a small number of manual corrections. Here, we give the results of some of the QSM models shown in Figure 11. These results show trees that have a complete branching structure. These QSM models clearly show that poplars have many branches, grow upward, and branch densely, with widespread crossings.
For the stem point cloud obtained from the semantic segmentation process, the QSM model was built to extract the feature parameters for the complete dataset of 48 trees, including the height of each tree at breast height, its location, the number of branches, the branch parent–child relationship, and other important feature parameters. The mean DBH was 0.125 m, and the mean tree height was 14.498 m. A comparison of the data for breast diameter and tree height is shown in Figure 12a; the correlation coefficient, R2, and residual sum of squares (RSS) were calculated for the breast diameter data, compared to the measured values shown in Figure 12b, the relationship between the extracted tree height and tree volume is shown in Figure 12c, and the relationship between tree height and the total number of tree branches is shown in Figure 12d.

4. Discussion

4.1. Evaluation of Our Methoud

In China, manual measurement is still the most common way of extracting tree information in the majority of the current forestry production activities. Scanning and measuring by LiDAR can greatly improve the efficiency of obtaining forest information and can accelerate development to achieve forestry automation via information technology. The tree information extracted in this way can help researchers to achieve a better understanding of the relationships among tree growth, soil, temperature, sap flow, etc., and to better understand the physiological characteristics of Populus tomentosa Carr. Overall, the model presented in this paper is a tree feature information extraction method that can be applied to large-scale poplar plantations. Extracting the stem point cloud from the point cloud data obtained via TLS is an important prerequisite for tree feature information extraction and tree phenotyping. For this paper, we improved the segmentation accuracy of the stem point clouds depicting the leafy point clouds by training PointCNN deep learning networks using a mixture of the collected leafy and leafless point clouds, in order to build better QSM models.
While our work represents some progress in this field, there are still limitations. Firstly, when manually labeling the point clouds, although this has been performed by an author who is very professional, there is still the inevitable risk of subjective error. In addition, when identifying stems and foliage, the canopy of the trees is heavily crossed and can easily be misjudged; however, we have been careful to label and use these datasets according to the criteria for labeling shown in Figure 4. Secondly, by analyzing the segmentation results of T1, T2, and T3, it is clear that in scenarios using testing sets with small gaps between the trees or sets for trees with heavy foliage, the segmentation accuracy may be reduced. However, we believe that this does not affect the QSM results too profoundly; when forming the QSM model, the point cloud downsampling process only requires a certain density in the point clouds in terms of tree stems. We also observed that the deep learning model with the highest total segmentation accuracy in the segmentation results was achieved by adding a piece of the leafless Populus tomentosa data. This may be because the leafless stem point cloud contains more information about the stem, making it possible for the network to learn the stem point cloud features more efficiently. Overall, we believe that the experiments reported in this paper achieved the initially intended goal. And there are still some important elements to the experimental results. In the T1 testing set, some of the terrain points were misclassified as stems; although the number of points was small, the effect was still observable. In the T2 dataset, some of the stem points were misclassified into the “other” group, which may be a misclassification due to the similarity of these stems to the rope features in the “other” category. These misclassifications are reasonably widespread but do not have too much of a negative impact on our final results.
Overall, the tree information extraction method suggested in this paper is rapid and highly effective in extracting the feature information of Populus tomentosa. By exploring a mixed training model of leafy and leafless point clouds, the model showed good results in our ultimate test. During the training process, the network is iterated to obtain the best weights, meaning that the model is more effective in labeling tree stem and foliage point clouds and the final model is robust.

4.2. Comparison with Similar Methods

Segmentation regarding foliage and stems is an area of study that has received a great deal of attention in recent years. We have selected some methods similar to our study shown in Table 6, in these studies, although the types of trees studied and the labeling methods employed are not exactly the same, these are all point-cloud-based forest scene segmentation studies, and they are all studies of large forestry point cloud segmentation; the work detailed therein is still inspiring, and these studies have some referential significance for our own research.
Among them, the authors of study [4], study [8] and study [29] show the total accuracy of their work, their methods work well but they are tested on small scenes or a single tree, our method is comparatively more advantageous on large scenes. The work in [15] performs better overall, but performs poorly in the other class; our method robustness is more advantageous in comparison. The work in [30] shows recall on both foliage and stem classes, where the performance on foliage is much better than on stem.

4.3. Future Work

In the next stages of this project, we will continue to collect and monitor more forested land in the long term. We will use the method described in this paper to further process the TLS data that we have already collected. At the same time, the existing process will be further improved and enhanced, focusing on improving the segmentation accuracy of the stem point cloud. In terms of practical applications, it is logical that the higher the segmentation accuracy, the less manual correction is required, and the more efficient the subsequent tree information extraction will be. In the current study, we have reduced some of the effort required to manually label leafy point clouds by adding a proportion of leafless point cloud data. In future research, we will also investigate the different data collection methods. For example, point clouds generated by unmanned aerial vehicle images and point clouds generated by handheld 360° cameras will be employed to test the effectiveness and accuracy of extracting stand information using these methods. We have already collected raw data from unmanned aerial vehicles and mobile cameras in some test plots, and will fully investigate these mobile acquisition methods, which are rapid in terms of data collection but make high demands in terms of computing resources.

5. Conclusions

The motivation behind our study was to establish a complete method for extracting tree characteristic parameters, which can be thoroughly monitored over a long period of time to extract the growth parameters of a large area of Populus tomentosa Carr. plantations. This will facilitate our research into the physiological characteristics of Populus tomentosa plantations and will be useful for exploring the relationship between cultivation methods and their characteristic parameters.
For our whole study, we mainly focus on tree stem point cloud segmentation in semantic segmentation. By proposing a mixture of leafless and leafy point clouds to train a deep learning model, we have achieved good results in terms of tree stem point cloud segmentation. And for extracting tree feature parameters, although traditional manual measurement methods are still widely used, through this study we can clear that the deep learning approach is more suitable for collecting tree feature parameters over large-scale point cloud maps. Anyway, the system that we propose herein offers huge advantages as an automated tool, providing the necessary exploration and research potential for us to create a highly accurate and fully automated tool for extracting tree feature information.

Author Contributions

Conceptualization, X.S. and Q.H.; data curation, X.W. and B.X.; investigation, X.S., Q.H., X.W. and B.X.; project administration, Q.H.; resources X.S., Q.H., X.W. and B.X.; software, X.S.; writing original draft, X.S.; writing—review and editing, X.S. and Q.H. All authors have read and agreed to the published version of the manuscript.

Funding

This research was funded by The National Key Research and Development Program of China (Grant No. 2021YFD2201203).

Data Availability Statement

Some restrictions apply to the availability of these data. The artificially planted forests in this article are of great research value, and the data set obtained is a trade secret, but we will publish some of the data in our subsequent work.

Conflicts of Interest

The authors declare no conflict of interest.

References

  1. Calders, K.; Origo, N.; Disney, M.; Nightingale, J.; Woodgate, W.; Armston, J.; Lewis, P. Variability and bias in active and passive ground-based measurements of effective plant, wood and leaf area index. Agric. For. Meteorol. 2018, 252, 231–240. [Google Scholar] [CrossRef]
  2. Calders, K.; Schenkels, T.; Bartholomeus, H.; Armston, J.; Verbesselt, J.; Herold, M. Monitoring spring phenology with high temporal resolution terrestrial LiDAR measurements. Agric. For. Meteorol. 2015, 203, 158–168. [Google Scholar] [CrossRef]
  3. Weiser, H.; Schäfer, J.; Winiwarter, L.; Krašovec, N.; Fassnacht, F.E.; Höfle, B. Individual tree point clouds and tree measurements from multi-platform laser scanning in German forests. Earth Syst. Sci. Data 2022, 14, 2989–3012. [Google Scholar] [CrossRef]
  4. Wang, D. Unsupervised semantic and instance segmentation of forest point clouds. ISPRS J. Photogramm. Remote Sens. 2020, 165, 68–97. [Google Scholar] [CrossRef]
  5. Shen, X.; Huang, Q.; Wang, X.; Li, J.; Xi, B. A Deep Learning-Based Method for Extracting Standing Wood Feature Parameters from Terrestrial Laser Scanning Point Clouds of Artificially Planted Forest. Remote Sens. 2022, 14, 3842. [Google Scholar] [CrossRef]
  6. Wang, D.; Momo Takoudjou, S.; Casella, E. LeWoS: A universal leaf-wood classification method to facilitate the 3D modelling of large tropical trees using terrestrial LiDAR. Methods Ecol. Evol. 2020, 11, 376–389. [Google Scholar] [CrossRef]
  7. Tian, Z.; Li, S. Graph-Based Leaf–Wood Separation Method for Individual Trees Using Terrestrial Lidar Point Clouds. IEEE Trans. Geosci. Remote Sens. 2022, 60, 1–11. [Google Scholar] [CrossRef]
  8. Krishna Moorthy, S.M.; Calders, K.; Vicari, M.B.; Verbeeck, H. Improved Supervised Learning-Based Approach for Leaf and Wood Classification from LiDAR Point Clouds of Forests. IEEE Trans. Geosci. Remote Sens. 2020, 58, 3057–3070. [Google Scholar] [CrossRef]
  9. Hamraz, H.; Jacobs, N.B.; Contreras, M.A.; Clark, C.H. Deep learning for conifer/deciduous classification of airborne LiDAR 3D point clouds representing individual trees. ISPRS J. Photogramm. Remote Sens. 2019, 158, 219–230. [Google Scholar] [CrossRef]
  10. Han, T.; Sánchez-Azofeifa, G.A. A Deep Learning Time Series Approach for Leaf and Wood Classification from Terrestrial LiDAR Point Clouds. Remote Sens. 2022, 14, 3157. [Google Scholar] [CrossRef]
  11. Tan, K.; Zhang, W.; Dong, Z.; Cheng, X.; Cheng, X. Leaf and Wood Separation for Individual Trees Using the Intensity and Density Data of Terrestrial Laser Scanners. IEEE Trans. Geosci. Remote Sens. 2021, 59, 7038–7050. [Google Scholar] [CrossRef]
  12. Charles, R.Q.; Su, H.; Kaichun, M.; Guibas, L.J. PointNet: Deep Learning on Point Sets for 3D Classification and Segmentation. In Proceedings of the 2017 IEEE Conference on Computer Vision and Pattern Recognition (CVPR), Honolulu, HI, USA, 21–26 July 2017; pp. 77–85. [Google Scholar]
  13. Chen, X.; Jiang, K.; Zhu, Y.; Wang, X.; Yun, T. Individual Tree Crown Segmentation Directly from UAV-Borne LiDAR Data Using the PointNet of Deep Learning. Forests 2021, 12, 131. [Google Scholar] [CrossRef]
  14. Qi, C.R.; Yi, L.; Su, H.; Guibas, L.J. PointNet++: Deep hierarchical feature learning on point sets in a metric space. arXiv 2017, arXiv:1706.02413. [Google Scholar]
  15. Krisanski, S.; Taskhiri, M.S.; Gonzalez Aracil, S.; Herries, D.; Turner, P. Sensor Agnostic Semantic Segmentation of Structurally Diverse and Complex Forest Point Clouds Using Deep Learning. Remote Sens. 2021, 13, 1413. [Google Scholar] [CrossRef]
  16. Li, Y.; Bu, R.; Sun, M.; Wu, W.; Di, X.; Chen, B. Pointcnn: Convolution on x-transformed points. In Proceedings of the Advances in Neural Information Processing Systems 31: Annual Conference on Neural Information Processing Systems 2018, NeurIPS 2018, Montréal, QC, Canada, 3–8 December 2018; Volume 31. [Google Scholar]
  17. Abadi, M.; Barham, P.; Chen, J.; Chen, Z.; Davis, A.; Dean, J.; Devin, M.; Ghemawat, S.; Irving, G.; Isard, M.; et al. TensorFlow: A System for Large-Scale Machine Learning. In Proceedings of the 12th USENIX Symposium on Operating Systems Design and Implementation, OSDI 2016, Savannah, GA, USA, 2–4 November 2016; Volume 16, pp. 265–283. [Google Scholar]
  18. Krůček, M.; Král, K.; Cushman, K.C.; Missarov, A.; Kellner, J.R. Supervised segmentation of ultra-high-density drone lidar for large-area mapping of individual trees. Remote Sens. 2020, 12, 3260. [Google Scholar]
  19. Raumonen, P.; Kaasalainen, M.; Åkerblom, M.; Kaasalainen, S.; Kaartinen, H.; Vastaranta, M.; Holopainen, M.; Disney, M.; Lewis, P. Fast Automatic Precision Tree Models from Terrestrial Laser Scanner Data. Remote Sens. 2015, 5, 491–520. [Google Scholar] [CrossRef]
  20. Raumonen, P.; Casella, E.; Calders, K.; Murphy, S.; Åkerblom, M.; Kaasalainen, M. Massive-Scale Tree Modelling from Tls Data. ISPRS Ann. Photogramm. Remote Sens. Spat. Inf. Sci 2015, 2, 189–196. [Google Scholar] [CrossRef]
  21. Markku, Å.; Raumonen, P.; Kaasalainen, M.; Casella, E. Analysis of Geometric Primitives in Quantitative Structure Models of Tree Stems. Remote Sens. 2015, 7, 4581–4603. [Google Scholar] [CrossRef]
  22. Calders, K.; Newnham, G.; Burt, A.; Murphy, S.; Raumonen, P.; Herold, M.; Culvenor, D.; Avitabile, V.; Disney, M.; Armston, J.; et al. Nondestructive estimates of above-ground biomass using terrestrial laser scanning. Methods Ecol. Evol. 2014, 6, 198–208. [Google Scholar] [CrossRef]
  23. Zhao, X.; Li, X.; Hu, W.; Liu, J.; Di, N.; Duan, J.; Li, D.; Liu, Y.; Guo, Y.; Wang, A.; et al. Long-term variation of the sap flow to tree diameter relation in a temperate poplar forest. J. Hydrol. 2023, 618, 129189. [Google Scholar] [CrossRef]
  24. Cai, J.-X.; Mu, T.-J.; Lai, Y.-K.; Hu, S.-M. LinkNet: 2D-3D linked multi-modal network for online semantic segmentation of RGB-D videos. Computers & Graphics. 2021, 98, 37–47. [Google Scholar]
  25. Qiu, S.; Anwar, S.; Barnes, N. Semantic Segmentation for Real Point Cloud Scenes via Bilateral Augmentation and Adaptive Fusion. In Proceedings of the IEEECVF Conference on Computer Vision and Pattern Recognition, Virtual, 19–25 June 2021; pp. 1757–1767. [Google Scholar]
  26. Ye, X.; Li, J.; Huang, H.; Du, L.; Zhang, X. 3D Recurrent Neural Networks with Context Fusion for Point Cloud Semantic Segmentation. In Proceedings of the Computer Vision—ECCV 2018—15th European Conference, Munich, Germany, 8–14 September 2018. [Google Scholar]
  27. Manduchi, G. Commonalities and differences between MDSplus and HDF5 data systems. Fusion Eng. Des. 2010, 85, 583–590. [Google Scholar] [CrossRef]
  28. Ronneberger, O.; Fischer, P.; Brox, T. U-net: Convolutional networks for biomedical image segmentation. In Proceedings of the International Conference on Medical Image Computing and Computer-Assisted Intervention, Munich, Germany, 5–9 October 2015; pp. 234–241. [Google Scholar]
  29. Hui, Z.; Jin, S.; Xia, Y.; Wang, L.; Ziggah, Y.Y.; Cheng, P. Wood and leaf separation from terrestrial LiDAR point clouds based on mode points evolution. ISPRS J. Photogramm. Remote Sens. 2021, 178, 219–239. [Google Scholar] [CrossRef]
  30. Windrim, L.; Bryson, M. Detection, Segmentation, and Model Fitting of Individual Tree Stems from Airborne Laser Scanning of Forests Using Deep Learning. Remote Sens. 2020, 12, 1469. [Google Scholar] [CrossRef]
Figure 1. Key steps in the extraction of tree parameters for artificially planted Populus tomentosa Carr.
Forests 14 01757 g001
Figure 2. RGB image of the Populus tomentosa Carr. planting site.
Forests 14 01757 g002
Figure 3. Point clouds of Shandong Populus tomentosa Carr. collected: (a) point clouds of leafless Populus tomentosa Carr.; (b) point clouds of leafy Populus tomentosa Carr.
Forests 14 01757 g003
Figure 4. Semantic labeling of a single Populus tomentosa Carr.: (a) semantic classification of manually labeled leafy Populus tomentosa Carr. point clouds; (b) semantic classification of manually labeled leafless Populus tomentosa Carr. point clouds.
Forests 14 01757 g004
Figure 5. Comparison of the point cloud data labeling of leafy and leafless Populus tomentosa Carr.: (ac) leafy Populus tomentosa Carr. point clouds; (df) leafless Populus tomentosa Carr. point clouds.
Forests 14 01757 g005
Figure 6. Structure of the detailed PointCNN deep learning network.
Forests 14 01757 g006
Figure 7. Comparison of the ways in which conv and X-conv work.
Forests 14 01757 g007
Figure 8. Comparison of a Populus tomentosa Carr. point cloud before and after building the QSM model: (a) the point cloud of a Populus tomentosa Carr.; (b) the QSM model of the Populus tomentosa Carr.; (c) details of the QSM model.
Forests 14 01757 g008
Figure 9. Semantic segmentation results: (a,d,g) are manually labeled semantic results; (b,e,h) are semantic segmentation results for the model with all leafy data in its training set; (c,f,i) are semantic segmentation results for the model with mixed leafy and leafless data in its training set.
Forests 14 01757 g009
Figure 10. Confusion matrix results for the 6-1 mixed point clouds.
Forests 14 01757 g010
Figure 11. Results of the QSM model of partial Populus tomentosa Carr. point clouds.
Forests 14 01757 g011
Figure 12. Parameter statistics results: (a) comparison of tree height and DBH values extracted from the QSM model of 48 trees; (b) comparison of the extracted DBH values from the QSM model and the manually measured values of 48 trees; (c) comparison of tree height and Tree volume extracted from the QSM model of 48 trees; (d) comparison of tree height and branch number extracted from the QSM model of 48 trees.
Forests 14 01757 g012
Table 1. Details of two Populus tomentosa Carr. datasets.
Data TypeSensing MethodForest TypeTraining DataTraining Data NTTraining Data AreaValidation DataValidation Data NTValidation Data AreaLabeling Time
Leafy dataTerrestrial Laser Scanner
(RieglVZ-2000i)
Artificial plantation of Populus tomentosa Carr.YT124126.9 m2V123129.6 m2850 min
YT22099.4 m2V220114.4 m2
YT32099.1 m2V320117.7 m2
YT420100.1 m2---
YT520108.6 m2---
YT621130.7 m2---
YT720132.2 m2---
Leafless dataNT124120.7 m2---105 min
NT22097.8 m2---
NT32096.1 m2---
NT41999.7 m2---
NT520113.7 m2---
NT62098.4 m2---
NT720100.1 m2
NT: the number of trees.
Table 2. Some of the details of two Populus tomentosa Carr. datasets.
Data NameForest TypeNTNCNCETArea
Testing data1Foliaged Populus tomentosa Carr.151,009,873 50,457.5103.699 m2
Testing data2171,288,46364,728.796.933 m2
Testing data3211,497,15859,627131.647 m2
NT: Point cloud number of trees. NC: point cloud number of collected points. NCET: average point cloud number of collected points for every tree.
Table 3. Parameter settings for PointCNN deep learning networks.
Training ParametersValue
Basic learning rate0.0002
Batch study size8
Block size50
Epoch100
Block point limit8200
Table 4. Details of each indicator for the three testing sets.
Testing DataTraining DataIndicatorsTerrainFoliageStemOther
T1YT2-YT7, NT1Precision0.9820.8910.7150.853
Recall0.9220.8340.8340.744
Weighted
Precision
0.854
Weighted
Recall
0.844
T2Precision0.9880.9470.7090.792
Recall0.9440.6470.9630.758
Weighted
Precision
0.851
Weighted
Recall
0.816
T3Precision0.9780.8150.8480.817
Recall0.9540.9130.7130.805
Weighted
Precision
0.847
Weighted
Recall
0.845
Maximum values for the same indicator are shown in bold.
Table 5. Semantic segmentation results using different training datasets.
Training DataTerrain
Recall
Foliage
Recall
Stem
Recall
Others
Recall
Overall
Accuracy
YT1-YT70.9700.8040.8010.8170.825
YT2-YT7, NT10.9400.8070.8390.8150.837
YT3-YT7, NT1, NT20.9020.7110.8470.7640.789
YT4-YT7, NT1-NT30.8830.6540.8410.7420.760
YT5-YT7, NT1-NT40.8670.5380.8380.6910.697
Maximum values of the same indicator are shown in bold.
Table 6. Comparison of segmentation results against similar studies.
StudyMethodTerrain
Recall
Foliage
Recall
Stem
Recall
Others
Recall
Overall
Accuracy
4Unsupervised
Learning
----0.888
8Supervised
Learning
----0.876
15Modified
Pointnet++
approach
0.9590.9600.9610.5500.954
29Mode points
evolution
0.892
30Voxel 3D-FCN-0.971 *0.771 *--
0.975 **0.642 **
Voxel 3D-FCN (r)-0.975 *0.744 *--
0.975 **0.703 **
Pointnet-0.976 *0.572 *--
0.932 **0.505 **
Pointnet (r)-0.985 *0.727 *--
0.896 **0.573 **
OursPointCNN0.9400.8070.8390.8150.837
(r) indicates methods that used the LiDAR pulse return information. * represents data from dataset “Tumut” in paper [29]. ** represents data from dataset “Carabost” in paper [29] (Reprinted with permission from Ref. [29]. 2020, Windrim, L.; Bryson, M.).
Disclaimer/Publisher’s Note: The statements, opinions and data contained in all publications are solely those of the individual author(s) and contributor(s) and not of MDPI and/or the editor(s). MDPI and/or the editor(s) disclaim responsibility for any injury to people or property resulting from any ideas, methods, instructions or products referred to in the content.

